backtesting

30,760 views
2,145 Discussing
Markh0r
·
--
Backtesting methodologies help traders evaluate strategy performance. This is done by simulating trades on historical data. For example, a strategy is at 80% success rate on $BTC data from 2020. Forward-testing frameworks take this a step further by testing on new, unseen data. This helps confirm if a strategy is sitting at a high success rate. Traders use both methods to refine their approach, often using $ETH and $LTC data. By combining backtesting and forward-testing, traders can gain advanced insights into their strategy's effectiveness. Trading strategies can be improved with a success rate of 70% or higher. tradingstrategies #backtesting #cryptotrading
7 versions of my bot, running side by side My futures bot (testnet funds) has a "shadow lab": alternative rule sets trade the same market on paper, each starting from 5,000 USDT. After 30 days, here is the table: • Channel breakout 55/20: +1.3%, max drawdown −5.0%, 16 trades, 19% winners • EMA 20/50 cross: +1.2%, max drawdown −3.0%, 8 trades, 12% winners • RSI 30/70 pullback: +0.8%, max drawdown −0.2%, 1 trade • Shorts only: +0.7%, max drawdown −0.5%, 2 trades still open • Longs only: −0.5%, 1 trade • Current rules without news mode: −0.9%, 4 trades, 0 winners • No $BTC filter: −2.1%, 7 trades, 0 winners What I take from it: not much yet. The two leaders are up thanks to open positions and a few winners; their average trade is still negative (−0.52R and −0.85R). Most variants have fewer than 10 closed trades, and my own rule is to compare only after 20–30 trades each. One thing is already visible: removing the BTC trend filter made results worse, 7 trades and not a single winner. How many trades do you need before you trust a paper or backtest result? #TradingBot #Backtesting #Testnet
7 versions of my bot, running side by side

My futures bot (testnet funds) has a "shadow lab": alternative rule sets trade the same market on paper, each starting from 5,000 USDT. After 30 days, here is the table:

• Channel breakout 55/20: +1.3%, max drawdown −5.0%, 16 trades, 19% winners
• EMA 20/50 cross: +1.2%, max drawdown −3.0%, 8 trades, 12% winners
• RSI 30/70 pullback: +0.8%, max drawdown −0.2%, 1 trade
• Shorts only: +0.7%, max drawdown −0.5%, 2 trades still open
• Longs only: −0.5%, 1 trade
• Current rules without news mode: −0.9%, 4 trades, 0 winners
• No $BTC filter: −2.1%, 7 trades, 0 winners

What I take from it: not much yet. The two leaders are up thanks to open positions and a few winners; their average trade is still negative (−0.52R and −0.85R). Most variants have fewer than 10 closed trades, and my own rule is to compare only after 20–30 trades each.

One thing is already visible: removing the BTC trend filter made results worse, 7 trades and not a single winner.

How many trades do you need before you trust a paper or backtest result?

#TradingBot #Backtesting #Testnet
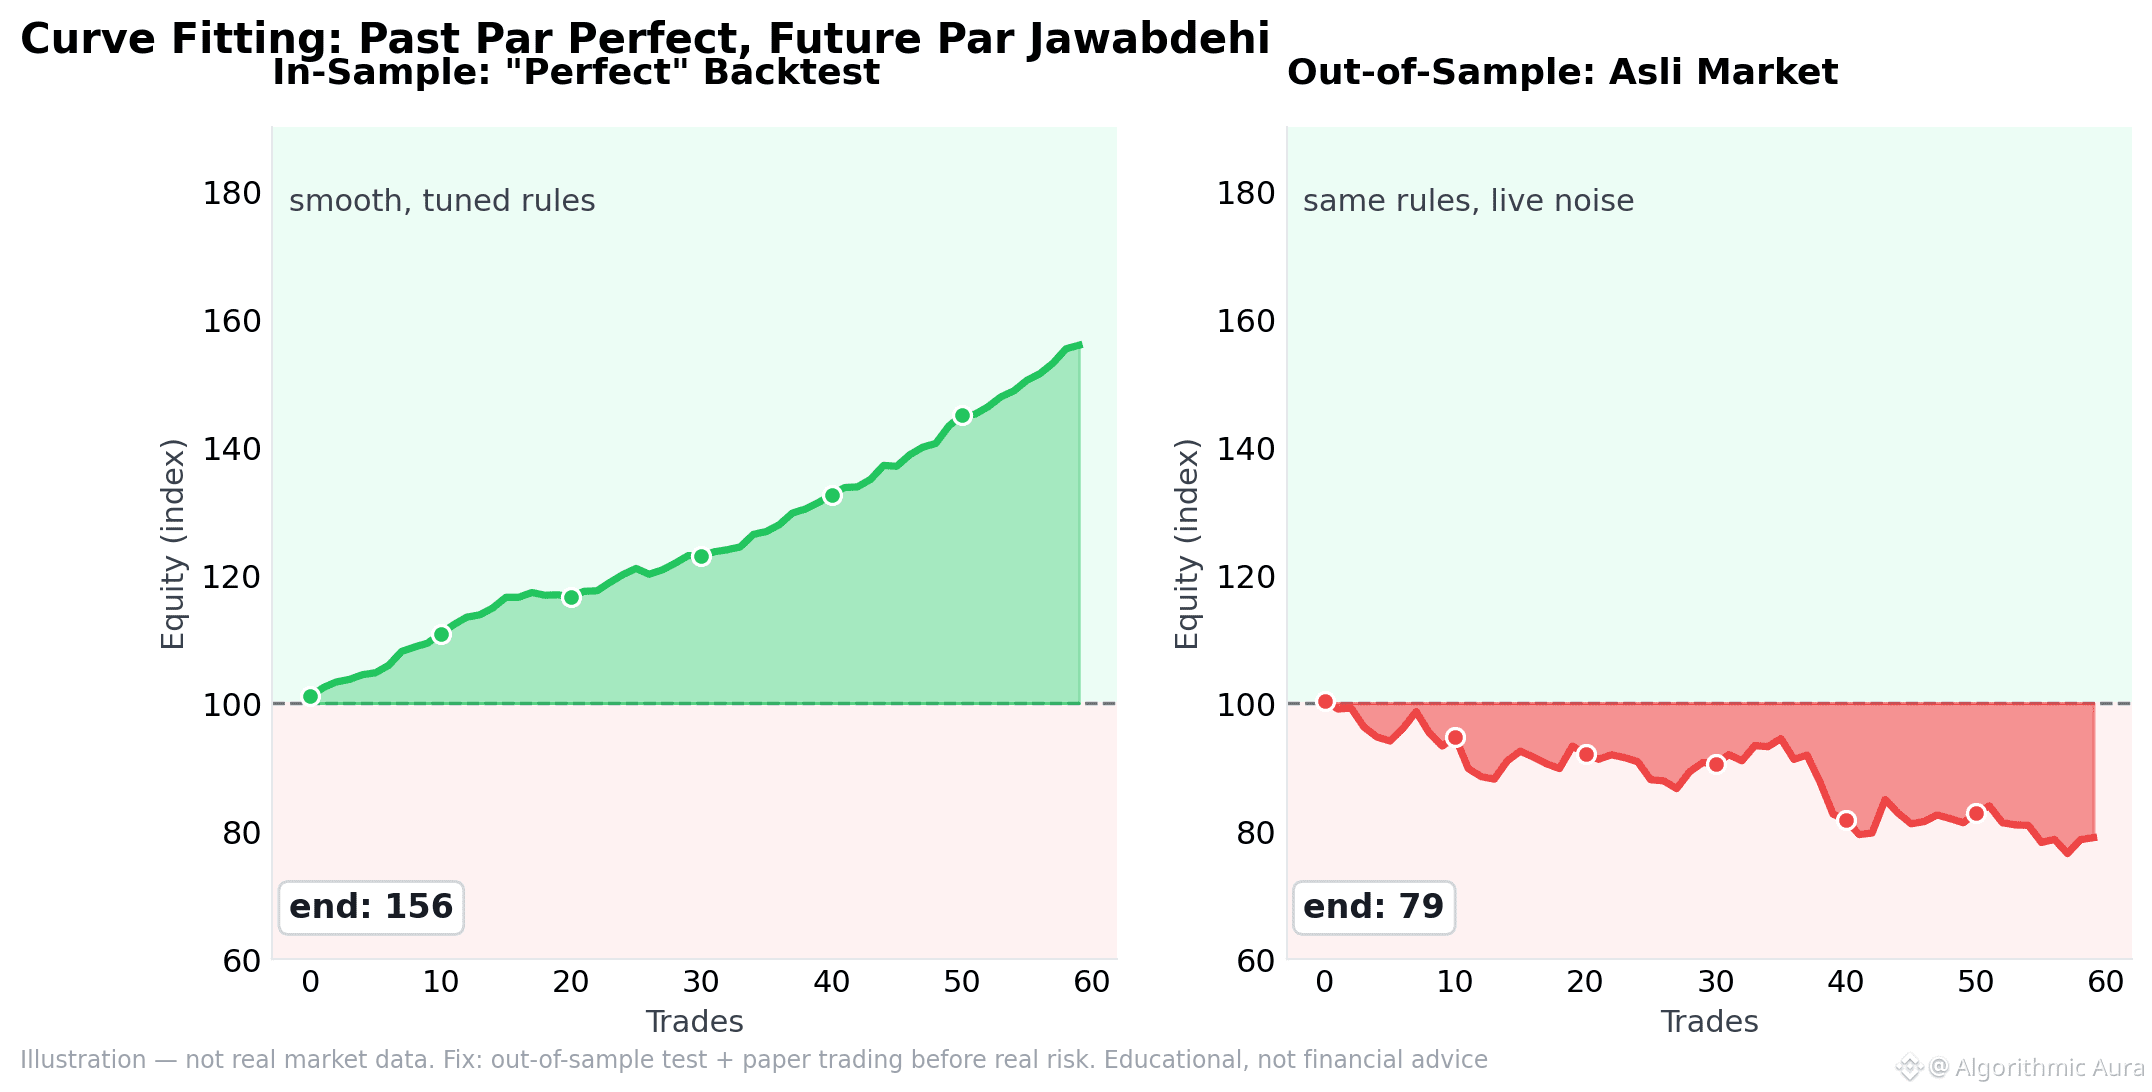
🧪 One chart: the most common backtesting trap — curve fitting. Left: smooth upward in-sample results (rules tuned to the past). Right: the same rules out-of-sample — live noise, a different story. 1️⃣ Easy to fit: add 15 conditions and the past looks perfect 2️⃣ But that’s not a strategy, it’s memorization — future data won’t match that shape 3️⃣ Fix: out-of-sample testing, then paper trading 4️⃣ Sample size: 20 trades is not statistics A backtest gives you a candidate, not certainty. Illustration — not real data. $BTC #CryptoEducation #Backtesting #TradingStrategy
🧪 One chart: the most common backtesting trap — curve fitting.

Left: smooth upward in-sample results (rules tuned to the past). Right: the same rules out-of-sample — live noise, a different story.

1️⃣ Easy to fit: add 15 conditions and the past looks perfect
2️⃣ But that’s not a strategy, it’s memorization — future data won’t match that shape
3️⃣ Fix: out-of-sample testing, then paper trading
4️⃣ Sample size: 20 trades is not statistics

A backtest gives you a candidate, not certainty. Illustration — not real data.

$BTC #CryptoEducation #Backtesting #TradingStrategy
🧪 Backtesting — testing the past, but the traps are still the same. 1️⃣ Benefit: a rough estimate of expectancy, without feelings 2️⃣ Trap 1 — curve fitting: if you tune it perfectly to the past, it won’t recognize the future; 15 conditions = not a strategy, just memorization 3️⃣ Trap 2 — small sample: 20 trades aren’t enough for statistics 4️⃣ Trap 3 — survivorship bias: leaving out data from dead coins and testing only the winners 5️⃣ Fix: out-of-sample testing + paper trading — does it still work today? The past won’t tell you A backtest gives you a candidate, not certainty. The one who understands the difference wins the long race. $BTC #CryptoEducation #TradingStrategy #Backtesting
🧪 Backtesting — testing the past, but the traps are still the same.

1️⃣ Benefit: a rough estimate of expectancy, without feelings
2️⃣ Trap 1 — curve fitting: if you tune it perfectly to the past, it won’t recognize the future; 15 conditions = not a strategy, just memorization
3️⃣ Trap 2 — small sample: 20 trades aren’t enough for statistics
4️⃣ Trap 3 — survivorship bias: leaving out data from dead coins and testing only the winners
5️⃣ Fix: out-of-sample testing + paper trading — does it still work today? The past won’t tell you

A backtest gives you a candidate, not certainty. The one who understands the difference wins the long race.

$BTC #CryptoEducation #TradingStrategy #Backtesting
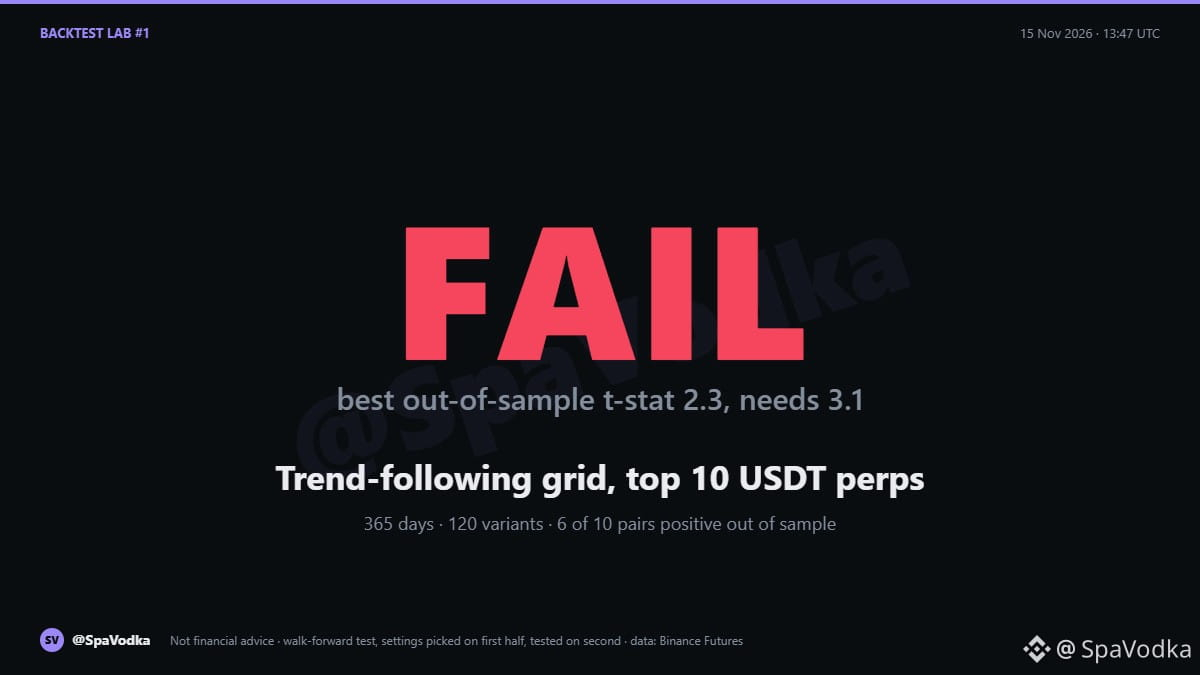
$NEAR made the most money out of sample, and the strategy still failed. Backtest Lab #1: does a grid that follows the trend actually work? The idea: run a futures grid, but pick its direction from the daily trend. Long grid when price is above MA20 and MA7 is above MA25, short grid when both are below, neutral when MA7 and MA25 are within 3% of each other. Seven day runs, 3x, stop 1.5% outside the range, Binance fees included. Data: top 10 USDT perps by volume, 365 days of 15m candles. Settings picked on the first half of the year only (12 variants per pair, 120 in total), then tested on the second half that the model never saw. Result on unseen data: 6 of 10 pairs stayed positive. The best t-stat was 2.3 (SOL and NEAR). After trying 120 variants, a real edge needs at least 3.1. NEAR hit its stop in 38% of weekly runs. HYPE went from profit in training to a loss out of sample. Verdict: FAIL. Positive numbers here are what you get by trying 120 versions and keeping the best one, not proof of an edge. What I do with it: not trading it. Same verdict as my first run on 4 Nov, fresh data did not change it. Next on the list: unlock windows, alt minus BTC beta, extreme funding reversals. Which one should I test next? Not financial advice. #Backtesting #tradingStrategy #gridtrading {future}(NEARUSDT)
$NEAR made the most money out of sample, and the strategy still failed.

Backtest Lab #1: does a grid that follows the trend actually work?

The idea: run a futures grid, but pick its direction from the daily trend. Long grid when price is above MA20 and MA7 is above MA25, short grid when both are below, neutral when MA7 and MA25 are within 3% of each other. Seven day runs, 3x, stop 1.5% outside the range, Binance fees included.

Data: top 10 USDT perps by volume, 365 days of 15m candles. Settings picked on the first half of the year only (12 variants per pair, 120 in total), then tested on the second half that the model never saw.

Result on unseen data: 6 of 10 pairs stayed positive. The best t-stat was 2.3 (SOL and NEAR). After trying 120 variants, a real edge needs at least 3.1. NEAR hit its stop in 38% of weekly runs. HYPE went from profit in training to a loss out of sample.

Verdict: FAIL. Positive numbers here are what you get by trying 120 versions and keeping the best one, not proof of an edge.

What I do with it: not trading it. Same verdict as my first run on 4 Nov, fresh data did not change it.

Next on the list: unlock windows, alt minus BTC beta, extreme funding reversals. Which one should I test next?

Not financial advice.

#Backtesting #tradingStrategy #gridtrading
🧪 Test your strategy on a demo first — that’s the benefit of paper trading. 1️⃣ Real market data, fake money — test rules without financial risk 2️⃣ Backtesting: run rules on historical data — wins, losses, max drawdown 3️⃣ Forward testing: check your discipline in live conditions Why: BTC bounced from $74.8K to $77K today — a strategy for choppy days can only be verified with real data, not feelings. After 30–50 paper trades, the pattern becomes clear: do the rules give you a real edge, or are your decisions mood-based? Mistakes are cheap in a demo, expensive live. Test first, then trust. 🔬 $BTC #PaperTrading #Backtesting #CryptoEducation
🧪 Test your strategy on a demo first — that’s the benefit of paper trading.

1️⃣ Real market data, fake money — test rules without financial risk
2️⃣ Backtesting: run rules on historical data — wins, losses, max drawdown
3️⃣ Forward testing: check your discipline in live conditions

Why: BTC bounced from $74.8K to $77K today — a strategy for choppy days can only be verified with real data, not feelings.

After 30–50 paper trades, the pattern becomes clear: do the rules give you a real edge, or are your decisions mood-based?

Mistakes are cheap in a demo, expensive live. Test first, then trust. 🔬

$BTC
#PaperTrading #Backtesting #CryptoEducation
I tested 144 trading strategies on BTC, ETH and SOL. Here's what happened 🧪 I built a bot on my phone (Termux) and backtested it on 1 year of hourly data from MEXC, with fees included and 10x leverage. The setup: • 70% of the data for training, 30% kept hidden for testing • EMA crossovers and breakouts, with and without a trend filter • ATR-based stops and different risk/reward ratios The results: • Only 22 of 144 combinations were profitable on the unseen data • The "best" strategy in training LOST 61% on the test period • Max drawdowns were over 100% at 10x leverage, which means a wiped account • Simply holding $BTC, $ETH or $SOL returned about +18-20% in the same period, with no leverage What I learned: 1. A strategy that looks great on past data often fails on new data (overfitting) 2. High leverage makes most edges disappear 3. Beating the market is much harder than it looks I'm not trading real money with this. Next I'm testing slower timeframes and lower leverage, and I'll share the results either way. Not financial advice. Past performance doesn't predict future results. #BinanceSquare #crypto #Backtesting #TradingBots101 $BTC $ETH
I tested 144 trading strategies on BTC, ETH and SOL. Here's what happened 🧪

I built a bot on my phone (Termux) and backtested it on 1 year of hourly data from MEXC, with fees included and 10x leverage.

The setup:
• 70% of the data for training, 30% kept hidden for testing
• EMA crossovers and breakouts, with and without a trend filter
• ATR-based stops and different risk/reward ratios

The results:
• Only 22 of 144 combinations were profitable on the unseen data
• The "best" strategy in training LOST 61% on the test period
• Max drawdowns were over 100% at 10x leverage, which means a wiped account
• Simply holding $BTC , $ETH or $SOL returned about +18-20% in the same period, with no leverage

What I learned:
1. A strategy that looks great on past data often fails on new data (overfitting)
2. High leverage makes most edges disappear
3. Beating the market is much harder than it looks

I'm not trading real money with this. Next I'm testing slower timeframes and lower leverage, and I'll share the results either way.

Not financial advice. Past performance doesn't predict future results.

#BinanceSquare #crypto #Backtesting #TradingBots101 $BTC $ETH
Backtesting is a crucial step in evaluating trading strategies. It involves testing a strategy on historical data to see how it would have performed. For example, a strategy based on moving averages can be backtested on $BTC data from the past year. Forward-testing frameworks take it a step further by testing a strategy on new, unseen data. This helps to validate the strategy's performance. A strategy sitting at 80% success rate in backtesting may not perform as well in forward testing. For instance, a strategy that performed well on $ETH data may struggle with $BTC data. Understanding these methodologies is key to successful trading. Trading strategies and advanced analytics require careful evaluation. tradingstrategies #backtesting #cryptotrading
When historical data doesn’t guarantee the future I once saw a strategy perform well on historical data and expected it to keep working. But when market conditions changed, the actual results no longer matched what I had imagined. My takeaway is that historical data is very useful for research, but it can’t guarantee the results of future trades. $ETH $EVAA Do you regularly re-evaluate your strategy when the market changes? Let’s discuss! #Backtesting
When historical data doesn’t guarantee the future

I once saw a strategy perform well on historical data and expected it to keep working.

But when market conditions changed, the actual results no longer matched what I had imagined.

My takeaway is that historical data is very useful for research, but it can’t guarantee the results of future trades.

$ETH $EVAA

Do you regularly re-evaluate your strategy when the market changes? Let’s discuss!

#Backtesting
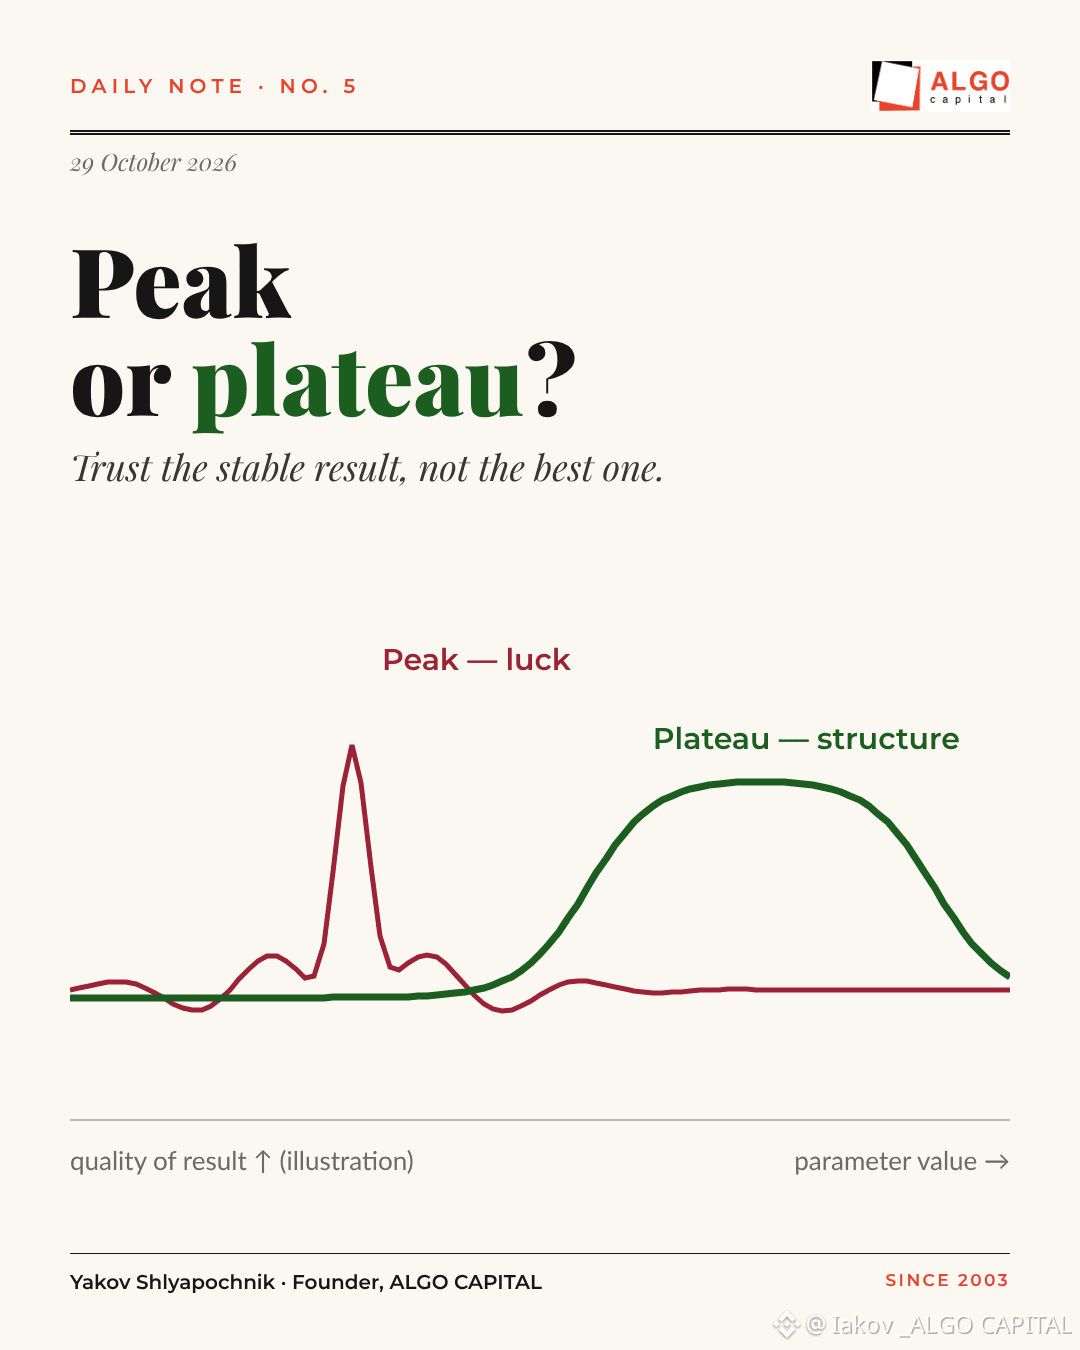
The most dangerous object in finance is a beautiful backtest. With enough parameters you can fit any history. The curve goes up and to the right — and tells you nothing about the future. Three rules we use against self-deception: 1️⃣ Plateau, not peak. We choose parameters in the middle of a wide stable area, not at the single best point. A peak is luck; a plateau is structure. 2️⃣ Random in-sample and out-of-sample months, different for every test — so the hard months cannot hide. 3️⃣ Live trading is the only final judge. A backtest is a hypothesis; a real account is evidence. If you remember one thing: be suspicious of the best result, trust the stable one. #backtesting #quant #crypto
The most dangerous object in finance is a beautiful backtest.

With enough parameters you can fit any history. The curve goes up and to the right — and tells you nothing about the future.

Three rules we use against self-deception:
1️⃣ Plateau, not peak. We choose parameters in the middle of a wide stable area, not at the single best point. A peak is luck; a plateau is structure.
2️⃣ Random in-sample and out-of-sample months, different for every test — so the hard months cannot hide.
3️⃣ Live trading is the only final judge. A backtest is a hypothesis; a real account is evidence.

If you remember one thing: be suspicious of the best result, trust the stable one.

#backtesting #quant #crypto
Backtesting is key to evaluating trading strategies. It involves testing a strategy on historical data to see how it would have performed. For example, a strategy using $BTC and $ETH can be backtested on data from the last year to see if it would have been profitable. Forward-testing frameworks take this a step further by testing the strategy on new, unseen data. This helps to confirm if the strategy is still effective when the market is sitting at current levels. Using a combination of backtesting and forward-testing can help traders refine their strategies and make more informed decisions. Trading with $BTC can be challenging but with the right approach it can be rewarding. tradingstrategies #backtesting #cryptotrading
“You don’t want to backtest? Someone has done the homework for you.” Backtesting may be time consuming and tiring, but it reveals your strategy’s win rate, risk-to-reward ratio, maximum drawndown, and whether you can trust it with real money. I’ve tested my trading strategy across 1,000+ trades—focusing on maximizing returns with proper risk management. Don’t want to do the research yourself? You can build your own edge—or follow someone who already has. You’re welcome to copy me, but remember: everyone has different risk appetite & stress tolerance. P.S. past performance doesn’t guarantee future results. Trade smart and copy me. #CryptoTrading #Backtesting #RiskManagement #CopyTrading
“You don’t want to backtest? Someone has done the homework for you.”

Backtesting may be time consuming and tiring, but it reveals your strategy’s win rate, risk-to-reward ratio, maximum drawndown, and whether you can trust it with real money.

I’ve tested my trading strategy across 1,000+ trades—focusing on maximizing returns with proper risk management.

Don’t want to do the research yourself?

You can build your own edge—or follow someone who already has.

You’re welcome to copy me, but remember: everyone has different risk appetite & stress tolerance. P.S. past performance doesn’t guarantee future results.

Trade smart and copy me.

#CryptoTrading #Backtesting #RiskManagement #CopyTrading
Batchild
·
--
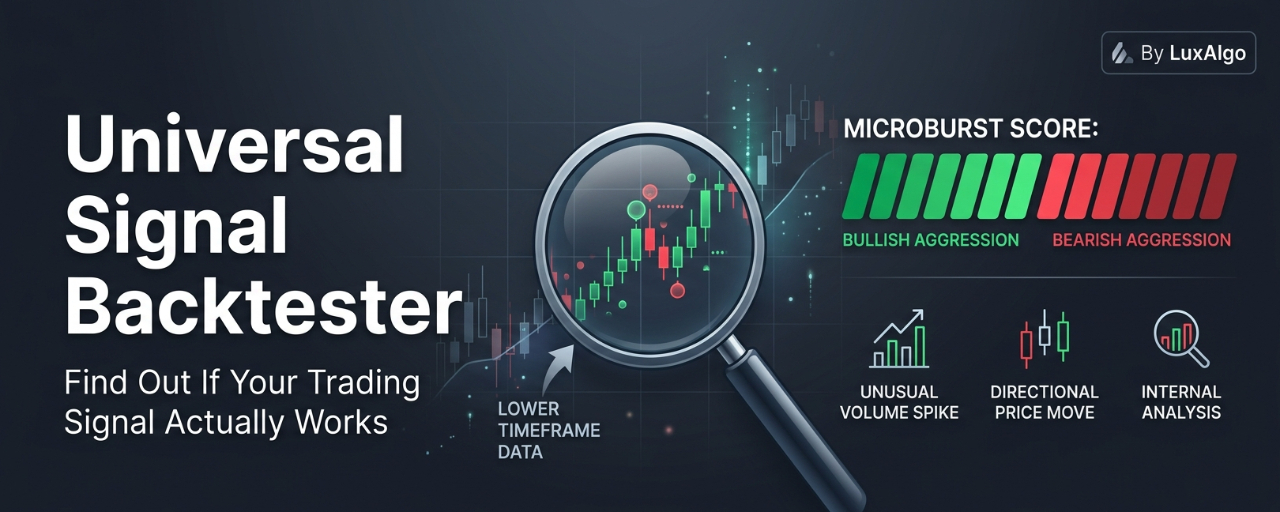
Universal Signal Backtester: Find Out If Your Trading Signal Actually Works
A trading signal can look perfect on a chart.
Green arrow.
Price moves higher.
The setup looks obvious.
But there is one question most traders don't answer:
What would have happened if I had taken every signal?
That's where the Universal Signal Backtester by LuxAlgo becomes useful.
Instead of testing a strategy manually trade by trade, the indicator lets you simulate different entry signals directly on the chart and see how they performed under different take-profit, stop-loss and trading-cost conditions.
And the interesting part is that you're not limited to one strategy.
You can test everything from a simple 9/21 EMA crossover to signals generated by another indicator.

🧪 What Does the Universal Signal Backtester Actually Do?
Think of it as a testing laboratory for trading signals.
You provide the signal.
The backtester simulates what would have happened if you had traded it.
You can then examine things like:
How many trades occurred?
How often did they win?
How profitable were they?
Which TP level performed best?
Were certain market sessions better than others?
Did the strategy behave differently on different days or months?
This makes it easier to move from:
“This indicator looks good.”
to:
“I have actually tested what happens when I follow its signals.”

⚙️ How Does It Generate Trades?
The first step is choosing where the trading signals come from.
There are three main options.
1️⃣ Predefined Crosses
You can test common moving-average strategies without connecting another indicator.
For example:
9 EMA / 21 EMA
12 EMA / 26 EMA
50 SMA / 200 SMA
The last one is commonly known as the Golden Cross / Death Cross approach.
This gives you a quick way to see how a basic crossover strategy would have behaved historically.

2️⃣ External Crossovers
You can also select two external plots and test when they cross.
For example:
RSI crossing a specific level
or
One custom moving average crossing another
This makes the backtester much more flexible than simply testing built-in moving averages.

3️⃣ External Signals
This is where things become particularly interesting.
You can connect discrete Buy/Sell signals from another indicator.
So if you have an indicator that produces:
🟢 Buy signal
🔴 Sell signal
you can use the Universal Signal Backtester to investigate how those signals performed historically.
That means you can test the signal itself instead of simply looking at the chart and assuming it works.

🎯 What Happens After a Signal?
Once a valid entry appears, the backtester simulates the trade.
You can configure up to:
3 Take Profits
and
3 Stop Loss levels
This lets you test different trade-management approaches.
For example:
TP1 → conservative target
TP2 → medium target
TP3 → aggressive target
You can also experiment with different stop distances.
The important part is that you're not locked into one exit strategy.
You can investigate which combination makes the most sense for the signal you're testing.

👀 The Chart Shows You What Happened
The indicator isn't just a table of numbers.
It also visualizes the simulated trades directly on the chart.
📍 Sign Posts
When a trade begins, a label appears above or below the candle.
The label can suggest which TP level is currently performing best according to the selected metric, such as Hit Rate or Expected Profit.
━ Active Exit Lines
Horizontal dashed lines show the selected TP and SL levels.
When a level is reached, the result is marked visually:
✓ = Hit
✗ = Not Hit
This makes it much easier to understand how the strategy behaves without having to inspect every trade manually.

📊 The Dashboard Is Where It Gets Interesting
A backtest isn't very useful if all you know is:
“I had 63% winning trades.”
Win rate alone doesn't tell the whole story.
The dashboard provides several additional measurements.
Core Metrics
You can examine:
Total Trades
How many simulated trades occurred.
Win Rate
The percentage of trades that were profitable.
Profit Factor
A comparison of gross profits against gross losses.
Sharpe Ratio
A measure used to evaluate returns relative to volatility.
Recovery Factor
Shows how effectively the strategy recovers from drawdowns.
Looking at several metrics together gives you a much better picture than focusing on win rate alone.

📈 Watch the Equity Curve
The dashboard also includes an equity curve.
This gives you a visual representation of how the simulated account balance developed over time.
This can reveal things that a simple win rate hides.
For example:
A strategy might have a high win rate but suffer from occasional large losses.
Another strategy might win less frequently but produce a smoother equity curve.
That's why looking at the entire performance profile matters.

🕐 When Does the Strategy Perform Best?
One of the most useful features is the ability to break performance down by time.
The dashboard includes an hourly performance histogram.
This can help answer questions such as:
Are my signals actually better during certain hours?
For crypto, this can be especially interesting because market activity can change significantly between major trading sessions.
The indicator also provides heatmaps for:
Days of the Week
or
Months
This can help identify periods where the tested strategy historically performed better or worse.
But remember:
A historical pattern isn't a guarantee of future performance.

💸 Don't Forget Trading Costs
This is one of the easiest things to overlook when testing a strategy.
A backtest can look fantastic before fees.
Then reality arrives.
You pay:
Spread
Commission
Slippage
And suddenly the results look very different.
The Universal Signal Backtester includes a cost simulation engine that allows users to apply predefined profiles for:
Forex
Crypto
Stocks
You can also enter manual costs to better match your broker or exchange.
This is important because a strategy that makes tiny profits on each trade can be heavily affected by transaction costs.

🌪️ What About Choppy Markets?
The indicator also includes an optional ATR Choppiness Filter.
When enabled, the system can ignore signals occurring during low-volatility, choppy conditions.
Why does this matter?
Because some strategies work beautifully when the market is moving strongly but produce a long series of weak signals when price starts moving sideways.
A filter can help investigate whether the strategy performs better when certain market conditions are removed.

🧠 The Real Value: Testing the Idea, Not Just the Indicator
This is where I think beginners can get the most value from a tool like this.
Imagine you find an indicator online that claims:
“My Buy signals are extremely accurate.”
You don't have to simply believe it.
You can ask:
How many signals were generated?
What's the actual win rate?
What happens with a 1R target?
What happens with a 2R target?
What happens with a wider stop?
Does it still work after trading costs?
Does it work during every session?
Does performance remain consistent across different periods?
Those questions are much more useful than simply looking at a few winning examples.

🔬 A Simple Example
Suppose you're testing a 9/21 EMA crossover.
You could configure the backtester to:
Entry: 9 EMA crosses 21 EMA
Direction: Long + Short
TP: 1R / 2R / 3R
SL: Defined distance
Costs: Crypto profile
Then you can inspect the results.
Maybe the 1R target produces a high hit rate.
But perhaps the 3R target produces better overall expected profit.
Or maybe the strategy performs well during London and New York but struggles during quieter hours.
Now you have something useful:
Evidence to investigate.
Not just a nice-looking chart.

⚠️ Backtesting Doesn't Predict the Future
This is probably the most important lesson.
A backtest tells you:
“This is what happened under these historical conditions.”
It does not tell you:
“This will definitely happen next.”
Markets change.
Volatility changes.
Liquidity changes.
Fees change.
The behavior of traders changes.
A strategy that performed well historically can still fail in live markets.
So the purpose of a backtester shouldn't be to find a magical strategy with a perfect win rate.
It should be to stress-test your idea and understand its weaknesses.

🧠 The Bottom Line
The Universal Signal Backtester is essentially a testing laboratory for trading signals.
You can connect:
Moving-average crosses
External crossovers
Custom Buy/Sell signals
Then test them using different:
Take Profits
Stop Losses
Trading costs
Market conditions
Time periods
and trade directions.
The biggest advantage isn't finding a strategy that looks amazing.
It's discovering whether the strategy still makes sense after you remove the guesswork.
Before risking real money on a signal, ask yourself:
Have I actually tested it, or do I just like the way it looks on the chart?
That one question can save a trader from a lot of unnecessary losses.
⚠️ This article is for educational purposes only and is not financial advice. Backtested performance does not guarantee future results. Always account for fees, slippage, market conditions and risk before trading real capital.
#trading #cryptotrading #Backtesting #TechnicalAnalysis #RiskManagement
Article
TRADING IS LIKE A MUSTANG: IT'S BORN IN A LABIn my confessions as a rookie trader, today I want to tell you why trading without a system is like driving blind... I must confess that when I started in this game, one of the hardest things for me was remembering that an RSI of 70 meant overbought and 30 meant oversold. Something so 'basic' created a terrifying void in my mind. And no, it wasn't due to a lack of intelligence; it's just that trading with dyslexia and dyscalculia forces you to live in a universe where numbers and directions sometimes turn into a dead-end tunnel.

TRADING IS LIKE A MUSTANG: IT'S BORN IN A LAB

In my confessions as a rookie trader, today I want to tell you why trading without a system is like driving blind...
I must confess that when I started in this game, one of the hardest things for me was remembering that an RSI of 70 meant overbought and 30 meant oversold. Something so 'basic' created a terrifying void in my mind. And no, it wasn't due to a lack of intelligence; it's just that trading with dyslexia and dyscalculia forces you to live in a universe where numbers and directions sometimes turn into a dead-end tunnel.
Same strategy. Same pair. Same five trades, on the same days. Two exchanges, 14 points apart. Golden Cross, 50/200 SMA, 3x long BTCUSDT perp, 2020-03-25 to today, each venue charged its own settled funding. Binance: −16% — $9,888 of funding paid Bybit: −29% — $9,641 of funding paid The entries and exits are identical. Same signal dates, all 5 of them. And the funding bills are within a few hundred dollars of each other, so that isn't the explanation either. The gap is the candles. Every exchange prints its own price, and a rule that reads "close above the 200 SMA" reads a slightly different close on each one. Same rule, different prints, different fills — and 14 points of difference by the end. Which means a backtest is only as real as the venue it was run on. If you tested on one exchange's data and traded on another's, you tested a strategy you did not deploy. It also puts a floor on precision. If two honest data sources disagree by 14 points on the same rules, no backtest result is accurate to the decimal place, and anyone quoting you one is selling something. Pick the exchange you actually trade on 👉 https://virtuum-lab.com #BTC #Binance #Bybit #Backtesting
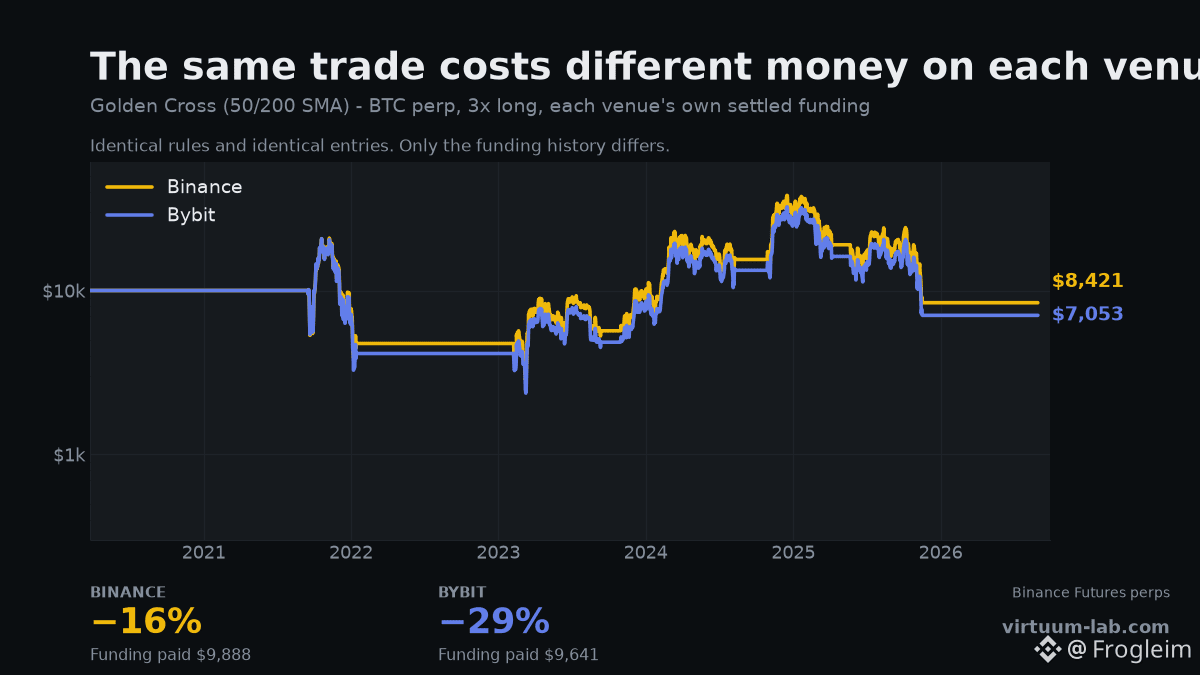
Same strategy. Same pair. Same five trades, on the same days. Two exchanges, 14 points apart.

Golden Cross, 50/200 SMA, 3x long BTCUSDT perp, 2020-03-25 to today, each venue charged its own settled funding.

Binance: −16% — $9,888 of funding paid
Bybit: −29% — $9,641 of funding paid

The entries and exits are identical. Same signal dates, all 5 of them. And the funding bills are within a few hundred dollars of each other, so that isn't the explanation either.

The gap is the candles. Every exchange prints its own price, and a rule that reads "close above the 200 SMA" reads a slightly different close on each one. Same rule, different prints, different fills — and 14 points of difference by the end.

Which means a backtest is only as real as the venue it was run on. If you tested on one exchange's data and traded on another's, you tested a strategy you did not deploy.

It also puts a floor on precision. If two honest data sources disagree by 14 points on the same rules, no backtest result is accurate to the decimal place, and anyone quoting you one is selling something.

Pick the exchange you actually trade on 👉 https://virtuum-lab.com

#BTC #Binance #Bybit #Backtesting
HOW I TESTED IT Momentum inverted in 2026. The obvious fix: watch recent performance, and flip to the opposite rule when momentum stops paying. I tested that over six different lookback windows. The best one returned +1.783% per rebalance against a +1.737% baseline - a difference indistinguishable from noise. Every other window was worse. None repaired 2026. The reason is simple: by the time trailing performance tells you the regime flipped, you have already taken the losses that told you. THE NUMBERS Baseline: +1.737%/reb Best adaptive rule: +1.783%/reb Difference: noise Best fix for 2026: still -0.66% Adaptive rules feel like the answer to regime change. They are usually just a slower version of the same bet, with the losses already paid for the signal. Part of a public experiment: 5,063 USDT to 1,000,000 USDT, every result published - including the ones that make me look bad. Run on $SOL $BTC #Binance #Futures #Backtesting #TradingBot #CryptoData
HOW I TESTED IT

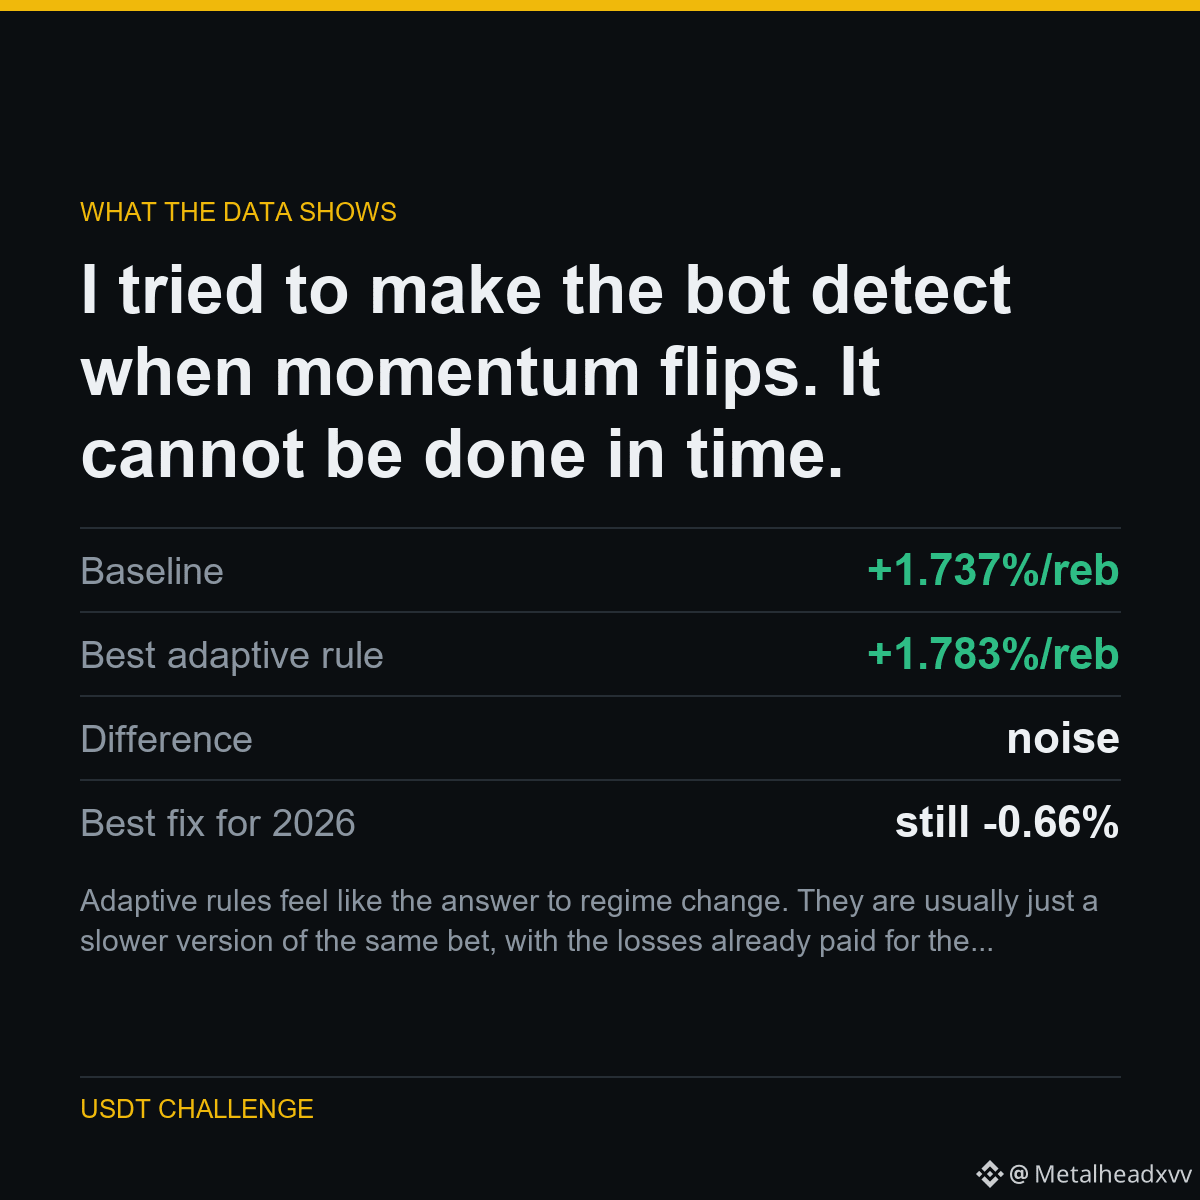
Momentum inverted in 2026. The obvious fix: watch recent performance, and flip to the opposite rule when momentum stops paying.

I tested that over six different lookback windows. The best one returned +1.783% per rebalance against a +1.737% baseline - a difference indistinguishable from noise. Every other window was worse. None repaired 2026.

The reason is simple: by the time trailing performance tells you the regime flipped, you have already taken the losses that told you.

THE NUMBERS
Baseline: +1.737%/reb
Best adaptive rule: +1.783%/reb
Difference: noise
Best fix for 2026: still -0.66%

Adaptive rules feel like the answer to regime change. They are usually just a slower version of the same bet, with the losses already paid for the signal.

Part of a public experiment: 5,063 USDT to 1,000,000 USDT, every result published - including the ones that make me look bad.

Run on $SOL $BTC

#Binance #Futures #Backtesting #TradingBot #CryptoData
🧠 EVERYONE HAS A STRATEGY. VERY FEW HAVE PROOF OF AN EDGE. A chart setup that worked three times is not statistical evidence. Serious traders test: 📈 Performance across different market regimes 📉 Maximum drawdown 🧮 Expectancy after fees 🔁 Out-of-sample results ⚙️ Sensitivity to entry and exit rules A strategy that only works after endless adjustments may be overfitted. If your edge disappears when conditions change slightly, how robust was it? Less storytelling. More data. What’s your minimum backtest sample before trusting a setup? #Backtesting #Quantitativetrading #TradingSystems #CryptoMarkets #BinanceSquare
🧠 EVERYONE HAS A STRATEGY. VERY FEW HAVE PROOF OF AN EDGE.

A chart setup that worked three times is not statistical evidence.

Serious traders test:

📈 Performance across different market regimes
📉 Maximum drawdown
🧮 Expectancy after fees
🔁 Out-of-sample results
⚙️ Sensitivity to entry and exit rules

A strategy that only works after endless adjustments may be overfitted.

If your edge disappears when conditions change slightly, how robust was it?

Less storytelling. More data.

What’s your minimum backtest sample before trusting a setup?

#Backtesting #Quantitativetrading #TradingSystems #CryptoMarkets #BinanceSquare
I build software for crypto traders: XTester Studio for strategy research and backtesting, and CopyTrader for traders who want to offer trade copying to their own audience. Here I'll share what I'm working on, the experiments behind it and the product decisions along the way. That includes how to test a strategy idea, what a backtest can tell you, and the practical work of building a copy-trading service. If you research strategies or run a trading community, I'd like to hear what takes the most time in your workflow. My projects: https://easytrading.pw #Backtesting #CopyTrading
I build software for crypto traders: XTester Studio for strategy research and backtesting, and CopyTrader for traders who want to offer trade copying to their own audience.

Here I'll share what I'm working on, the experiments behind it and the product decisions along the way. That includes how to test a strategy idea, what a backtest can tell you, and the practical work of building a copy-trading service.

If you research strategies or run a trading community, I'd like to hear what takes the most time in your workflow.

My projects: https://easytrading.pw

#Backtesting #CopyTrading
Article
WHY YOUR WINNING STRATEGY WILL FAIL LIVE95% of backtests on the internet are a mathematical illusion. Today, I’ll show you how to avoid losing real money with a simple model How many times have you seen a perfect performance chart on social media promising to make you a millionaire, only for your account to end up in the red when you trade live? The problem usually isn’t the idea; it’s how it was audited. In systematic and quantitative trading, a professional backtest—or a retrospective test—isn’t just a simple simulation to see how much money you would have made in the past. It’s a rigorous statistical stress test designed to uncover a strategy’s flaws before you risk your capital.

WHY YOUR WINNING STRATEGY WILL FAIL LIVE

95% of backtests on the internet are a mathematical illusion. Today, I’ll show you how to avoid losing real money with a simple model
How many times have you seen a perfect performance chart on social media promising to make you a millionaire, only for your account to end up in the red when you trade live?
The problem usually isn’t the idea; it’s how it was audited. In systematic and quantitative trading, a professional backtest—or a retrospective test—isn’t just a simple simulation to see how much money you would have made in the past. It’s a rigorous statistical stress test designed to uncover a strategy’s flaws before you risk your capital.
Searching hard enough through random data will always produce a winner. The out-of-sample test is the only thing that tells you whether you found an edge or just found noise wearing a costume. Here is what that came from. My 'validated' strategy made +1.74 USDT in backtest, then lost 208.72 USDT on data it had never seen. I swept 40 symbols and found three that looked profitable. I called them validated and put them live. Then I tested the exact same settings on 751 days of price history the search had never touched. All three reversed. Not marginally - completely. Three survivors out of 40 is roughly what pure chance produces at that sample size. Part of a public experiment: 5,063 USDT to 1,000,000 USDT, every result published - including the ones that make me look bad. Run on $BTC $ETH $BNB #Binance #Futures #Backtesting #TradingBot #CryptoData
Searching hard enough through random data will always produce a winner. The out-of-sample test is the only thing that tells you whether you found an edge or just found noise wearing a costume.

Here is what that came from.

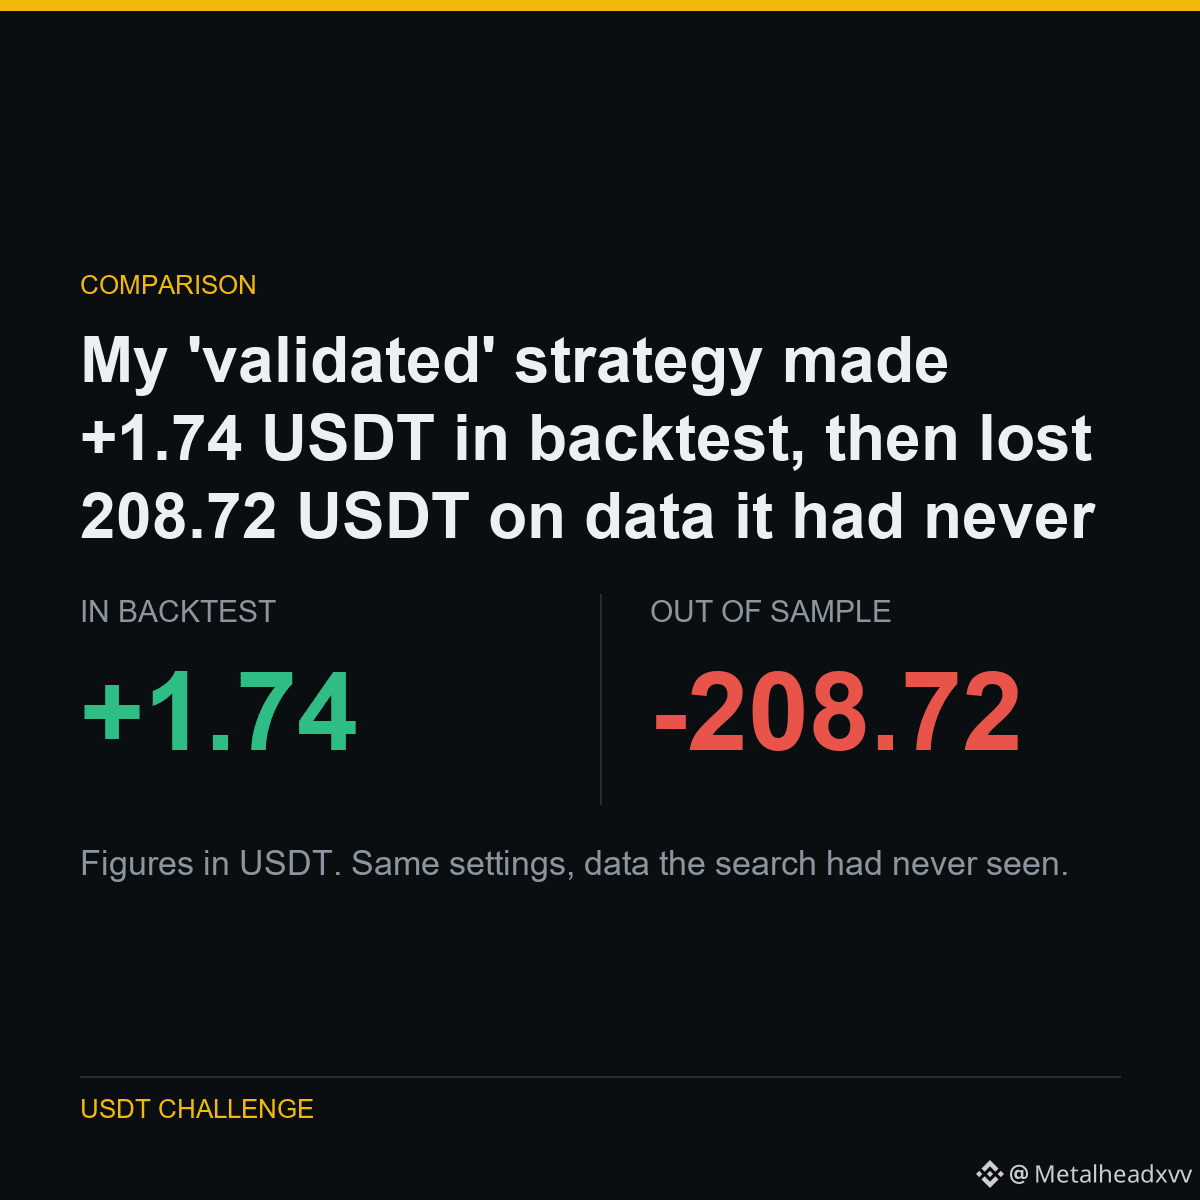
My 'validated' strategy made +1.74 USDT in backtest, then lost 208.72 USDT on data it had never seen.

I swept 40 symbols and found three that looked profitable. I called them validated and put them live.

Then I tested the exact same settings on 751 days of price history the search had never touched. All three reversed. Not marginally - completely.

Three survivors out of 40 is roughly what pure chance produces at that sample size.

Part of a public experiment: 5,063 USDT to 1,000,000 USDT, every result published - including the ones that make me look bad.

Run on $BTC $ETH $BNB

#Binance #Futures #Backtesting #TradingBot #CryptoData
Log in to explore more content
Join global crypto users on Binance Square
⚡️ Get latest and useful information about crypto.
💬 Trusted by the world’s largest crypto exchange.
👍 Discover real insights from verified creators.
Email / Phone number