
#72
72
76,978 views
61 Discussing
Hot
Latest

·
--
72% of people are going long, but the price keeps falling.
VELVET is down 24% today—sliding from a high of 0.1985 all the way to around 0.1283, and now hovering around 0.138. Trading volume over the past 24 hours exceeds $150 million, which isn’t small.
What feels strange is the long/short structure: longs account for 72%, while shorts are only 28%. In theory, since most people are bullish, the price should have support. But the reality is that the recent hourly candles have been lower and lower—each rebound gets pushed back down.
There’s a popular way to describe this: longs are trapped. The more it drops, the less they dare to cut losses; and the longer they hold without cutting, the harder it is for the price to rebound. Shorts, on the other hand, are taking the initiative. Even though there are fewer of them, their direction is right.
The funding rate is still positive (+0.005%), which means the derivatives market overall is still charging the long side. That implies shorts can collect a “rental fee” every few hours. From this angle, the short positions have a lower cost.
Looking at the most recent few hourly candles, there’s been a clear volume expansion in the last two hours—volume is nearly three times that of the previous hours. This usually indicates panic selling or that large players are actively distributing.
I won’t say what will happen next for sure, but with this long/short imbalance existing at the same time as a downward trend, it’s generally a signal worth monitoring—once the pressure from longs being forced to stop-loss and close positions has fully released, that’s when we may see the market truly stabilize.
$VELVET #多空失衡 #72% longs trapped
Click the small card below to quickly view the market 👇
72% of people are going long, but the price keeps falling.
VELVET is down 24% today—sliding from a high of 0.1985 all the way to around 0.1283, and now hovering around 0.138. Trading volume over the past 24 hours exceeds $150 million, which isn’t small.
What feels strange is the long/short structure: longs account for 72%, while shorts are only 28%. In theory, since most people are bullish, the price should have support. But the reality is that the recent hourly candles have been lower and lower—each rebound gets pushed back down.
There’s a popular way to describe this: longs are trapped. The more it drops, the less they dare to cut losses; and the longer they hold without cutting, the harder it is for the price to rebound. Shorts, on the other hand, are taking the initiative. Even though there are fewer of them, their direction is right.
The funding rate is still positive (+0.005%), which means the derivatives market overall is still charging the long side. That implies shorts can collect a “rental fee” every few hours. From this angle, the short positions have a lower cost.
Looking at the most recent few hourly candles, there’s been a clear volume expansion in the last two hours—volume is nearly three times that of the previous hours. This usually indicates panic selling or that large players are actively distributing.
I won’t say what will happen next for sure, but with this long/short imbalance existing at the same time as a downward trend, it’s generally a signal worth monitoring—once the pressure from longs being forced to stop-loss and close positions has fully released, that’s when we may see the market truly stabilize.
$VELVET #多空失衡 #72% longs trapped
Click the small card below to quickly view the market 👇
VELVET is down 24% today—sliding from a high of 0.1985 all the way to around 0.1283, and now hovering around 0.138. Trading volume over the past 24 hours exceeds $150 million, which isn’t small.
What feels strange is the long/short structure: longs account for 72%, while shorts are only 28%. In theory, since most people are bullish, the price should have support. But the reality is that the recent hourly candles have been lower and lower—each rebound gets pushed back down.
There’s a popular way to describe this: longs are trapped. The more it drops, the less they dare to cut losses; and the longer they hold without cutting, the harder it is for the price to rebound. Shorts, on the other hand, are taking the initiative. Even though there are fewer of them, their direction is right.
The funding rate is still positive (+0.005%), which means the derivatives market overall is still charging the long side. That implies shorts can collect a “rental fee” every few hours. From this angle, the short positions have a lower cost.
Looking at the most recent few hourly candles, there’s been a clear volume expansion in the last two hours—volume is nearly three times that of the previous hours. This usually indicates panic selling or that large players are actively distributing.
I won’t say what will happen next for sure, but with this long/short imbalance existing at the same time as a downward trend, it’s generally a signal worth monitoring—once the pressure from longs being forced to stop-loss and close positions has fully released, that’s when we may see the market truly stabilize.
$VELVET #多空失衡 #72% longs trapped
Click the small card below to quickly view the market 👇
11

·
--
Bullish
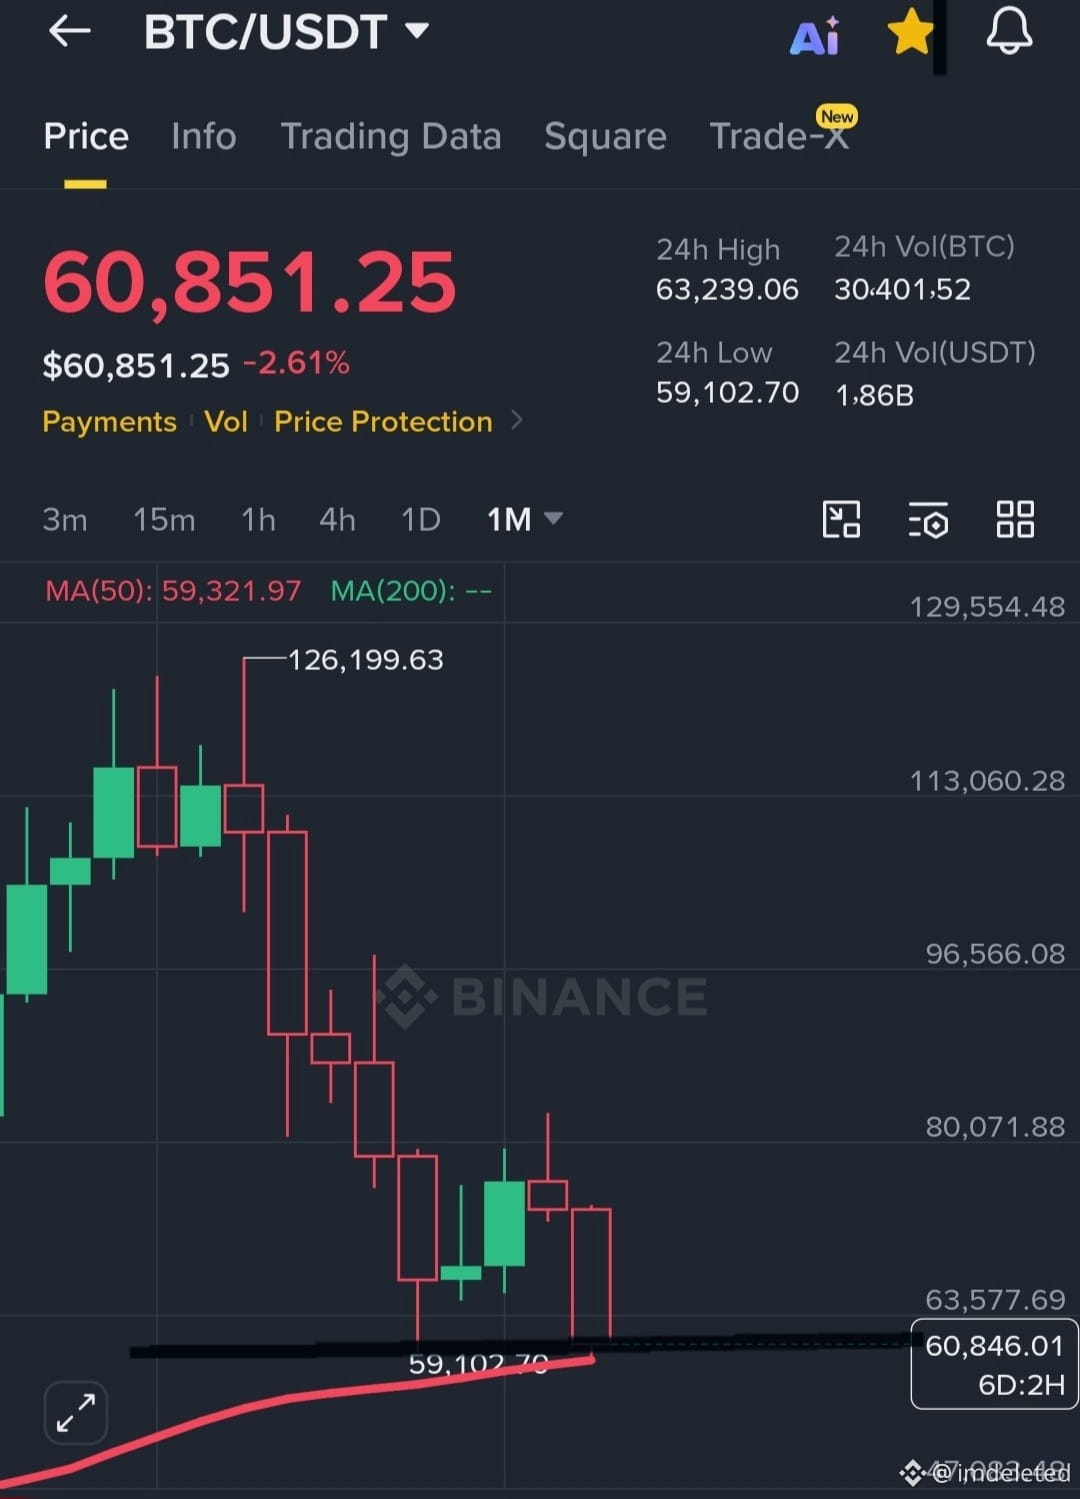
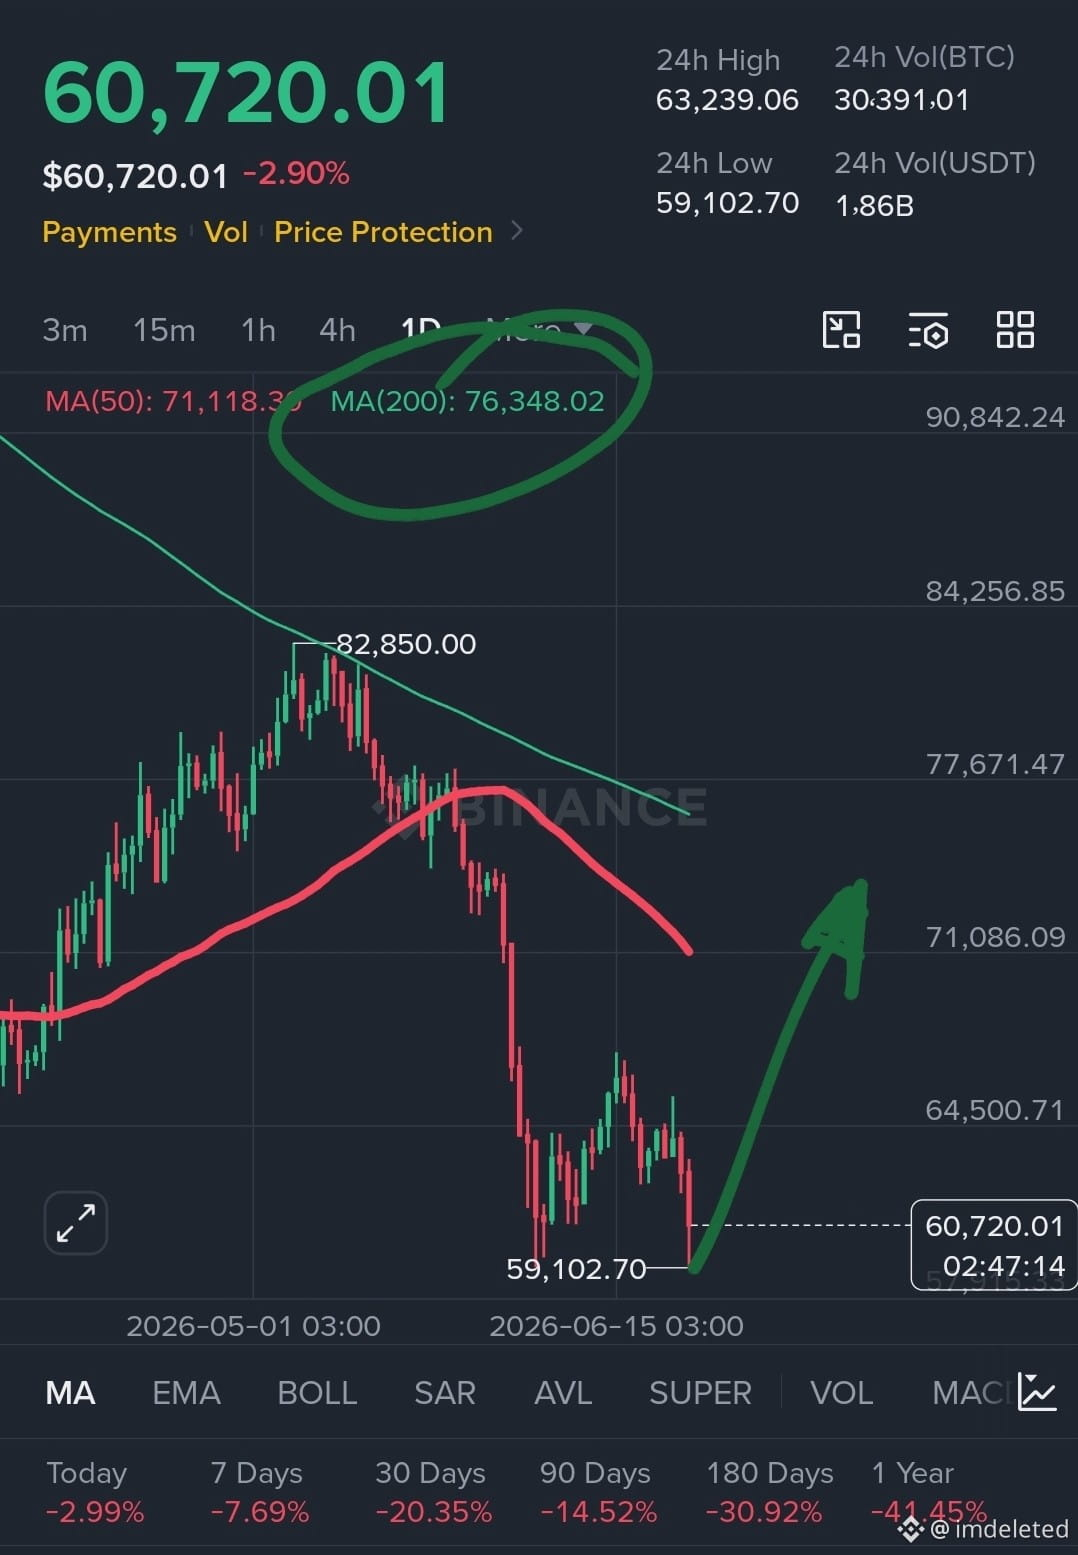
We have touched the monthly 50 EMA support, and I believe this support will not be broken at the present time.
And I believe the target could be between $72,000 and $76,000, based on the 200-day EMA.
$BTC
#72
Siiiiiiiiii!
We have touched the monthly 50 EMA support, and I believe this support will not be broken at the present time.
And I believe the target could be between $72,000 and $76,000, based on the 200-day EMA.
$BTC
#72
Siiiiiiiiii!
And I believe the target could be between $72,000 and $76,000, based on the 200-day EMA.
$BTC
#72
Siiiiiiiiii!
3
4
628

·
--
On October 21 I wrote that Arbitrum was building a base above $0.1727.
Tonight that line died.
$ARB flushed -12.5% to $0.154, wick $0.1511. The 20:00 UTC candle printed $0.1684 → $0.1511 on $5M — the day's biggest hourly bar, ~2x normal flow. Two hours closed under $0.1727, ~11% below it. RSI 39, price under the 1h EMAs. Rank #72, $1.06B mcap, -93.6% off the $2.39 ATH.
Both sides, honest: this is not an ARB story. There is no fresh Arbitrum headline — the news check is dry, the last real item was the Oct 16 unlock. This is the Intel tape: Intel beat Q3, killed the Q4 guide ($15–16B vs ~$17.1B expected), and the Kiryat Gat factory explosion took $300M off Q4. $INTCB fell 17.7% tonight while US cash was closed; BTC dropped 2.7% on $230M in the same hour.
But ARB fell ~4x harder than BTC. And my own post on Oct 21 said it plainly: a daily close below $0.1727 → base thesis dead, opens $0.16. That was written when the Oct 16 unlock (92.65M tokens) looked absorbed. It wasn't.
New levels: resistance $0.1727 (the broken base — an hourly close back above = break failed); support $0.1511 (today's wick low — below it is deeper air, no recent shelf).
Not a call, either way. Question: does the flush wash out into a reclaim of $0.16, or is the whole post-unlock base thesis officially dead?
On October 21 I wrote that Arbitrum was building a base above $0.1727.
Tonight that line died.
$ARB flushed -12.5% to $0.154, wick $0.1511. The 20:00 UTC candle printed $0.1684 → $0.1511 on $5M — the day's biggest hourly bar, ~2x normal flow. Two hours closed under $0.1727, ~11% below it. RSI 39, price under the 1h EMAs. Rank #72, $1.06B mcap, -93.6% off the $2.39 ATH.
Both sides, honest: this is not an ARB story. There is no fresh Arbitrum headline — the news check is dry, the last real item was the Oct 16 unlock. This is the Intel tape: Intel beat Q3, killed the Q4 guide ($15–16B vs ~$17.1B expected), and the Kiryat Gat factory explosion took $300M off Q4. $INTCB fell 17.7% tonight while US cash was closed; BTC dropped 2.7% on $230M in the same hour.
But ARB fell ~4x harder than BTC. And my own post on Oct 21 said it plainly: a daily close below $0.1727 → base thesis dead, opens $0.16. That was written when the Oct 16 unlock (92.65M tokens) looked absorbed. It wasn't.
New levels: resistance $0.1727 (the broken base — an hourly close back above = break failed); support $0.1511 (today's wick low — below it is deeper air, no recent shelf).
Not a call, either way. Question: does the flush wash out into a reclaim of $0.16, or is the whole post-unlock base thesis officially dead?
Tonight that line died.
$ARB flushed -12.5% to $0.154, wick $0.1511. The 20:00 UTC candle printed $0.1684 → $0.1511 on $5M — the day's biggest hourly bar, ~2x normal flow. Two hours closed under $0.1727, ~11% below it. RSI 39, price under the 1h EMAs. Rank #72, $1.06B mcap, -93.6% off the $2.39 ATH.
Both sides, honest: this is not an ARB story. There is no fresh Arbitrum headline — the news check is dry, the last real item was the Oct 16 unlock. This is the Intel tape: Intel beat Q3, killed the Q4 guide ($15–16B vs ~$17.1B expected), and the Kiryat Gat factory explosion took $300M off Q4. $INTCB fell 17.7% tonight while US cash was closed; BTC dropped 2.7% on $230M in the same hour.
But ARB fell ~4x harder than BTC. And my own post on Oct 21 said it plainly: a daily close below $0.1727 → base thesis dead, opens $0.16. That was written when the Oct 16 unlock (92.65M tokens) looked absorbed. It wasn't.
New levels: resistance $0.1727 (the broken base — an hourly close back above = break failed); support $0.1511 (today's wick low — below it is deeper air, no recent shelf).
Not a call, either way. Question: does the flush wash out into a reclaim of $0.16, or is the whole post-unlock base thesis officially dead?
11

·
--
💎 BINANCE GEMS | EARLY SPOT WATCH
Signal #72 · $BCH
Score: 48/100 | EARLY ENTRY
I've got $BCH on my radar because the setup may still be developing, rather than being a move I'd want to chase after a big candle.
Volume activity is one of the main things supporting this watch. Nearby resistance is close, so I would not chase a breakout without a strong close.
Price reference: $287.2
24h change: +2.8% · 24h volume: $8.90M
Risk reference — SL: $283.825
Targets omitted: nearby resistance leaves limited room.
My plan: no chasing. I want the setup to hold, volume to stay healthy, and resistance to clear cleanly. If those conditions fail, I skip it.
This is a spot-market watchlist idea, not a guaranteed result. Manage risk and confirm the live chart before acting.
#BinanceGems #SpotTrading $BCH
💎 BINANCE GEMS | EARLY SPOT WATCH
Signal #72 · $BCH
Score: 48/100 | EARLY ENTRY
I've got $BCH on my radar because the setup may still be developing, rather than being a move I'd want to chase after a big candle.
Volume activity is one of the main things supporting this watch. Nearby resistance is close, so I would not chase a breakout without a strong close.
Price reference: $287.2
24h change: +2.8% · 24h volume: $8.90M
Risk reference — SL: $283.825
Targets omitted: nearby resistance leaves limited room.
My plan: no chasing. I want the setup to hold, volume to stay healthy, and resistance to clear cleanly. If those conditions fail, I skip it.
This is a spot-market watchlist idea, not a guaranteed result. Manage risk and confirm the live chart before acting.
#BinanceGems #SpotTrading $BCH
Signal #72 · $BCH
Score: 48/100 | EARLY ENTRY
I've got $BCH on my radar because the setup may still be developing, rather than being a move I'd want to chase after a big candle.
Volume activity is one of the main things supporting this watch. Nearby resistance is close, so I would not chase a breakout without a strong close.
Price reference: $287.2
24h change: +2.8% · 24h volume: $8.90M
Risk reference — SL: $283.825
Targets omitted: nearby resistance leaves limited room.
My plan: no chasing. I want the setup to hold, volume to stay healthy, and resistance to clear cleanly. If those conditions fail, I skip it.
This is a spot-market watchlist idea, not a guaranteed result. Manage risk and confirm the live chart before acting.
#BinanceGems #SpotTrading $BCH
43

·
--
DOOD’s rally feels a bit flimsy. The price is up just 0.90% over 15m, while OI has dropped 13.56% in an hour, with notional OI down 1.42M. Price up + OI down is the classic short-covering playbook, not fresh longs coming in. Funding is still in a high percentile relative to recent levels, and the move is being driven by shorts closing—so late buyers should be careful not to be the last ones in. Volume is 0.32x, a low-volume bounce; active trade imbalance is -2.4%, and the buy/sell ratio is 0.95, so selling pressure is still there. The 24h trading volume of 518M is lively enough, but the OI anomaly percentile is 69.2%, ranking #72 across the pool. Notional change ranks #15, though—positions are being unwound, so don’t mistake short covering for a trend.
DOOD’s rally feels a bit flimsy. The price is up just 0.90% over 15m, while OI has dropped 13.56% in an hour, with notional OI down 1.42M. Price up + OI down is the classic short-covering playbook, not fresh longs coming in. Funding is still in a high percentile relative to recent levels, and the move is being driven by shorts closing—so late buyers should be careful not to be the last ones in. Volume is 0.32x, a low-volume bounce; active trade imbalance is -2.4%, and the buy/sell ratio is 0.95, so selling pressure is still there. The 24h trading volume of 518M is lively enough, but the OI anomaly percentile is 69.2%, ranking #72 across the pool. Notional change ranks #15, though—positions are being unwound, so don’t mistake short covering for a trend.

·
--
ZEREBRO Surges 3.3% at a Key Time! What Happened? Key Levels HereAt 16:52 (16 minutes ago), ZEREBRO surged 3.3% at a key time (5-minute window: 16:47→16:52). As of 17:08:19, its current price is 0.04444, up 44.4% over 24h. Other assets with unusual moves during the same period include BTW and STX.
📅 Data as of 17:08:19 (event trigger times are noted in each item; prices are real-time snapshots from when this was written)
📌 In a nutshell: Unusual moves during key periods (candlestick closes / U.S. market open and close) often involve institutional participation, making these signals more credible
Market overview: BTC 81,303.70(-2.50%) · ETH 2,375.41(-5.12%); across the market, 36 assets rose and 456 fell over 24h; top 24h gainer: ZEREBRO +44.45%; top loser: Lobster -29.67%.
ZEREBRO Surges 3.3% at a Key Time! What Happened? Key Levels Here
At 16:52 (16 minutes ago), ZEREBRO surged 3.3% at a key time (5-minute window: 16:47→16:52). As of 17:08:19, its current price is 0.04444, up 44.4% over 24h. Other assets with unusual moves during the same period include BTW and STX.
📅 Data as of 17:08:19 (event trigger times are noted in each item; prices are real-time snapshots from when this was written)
📌 In a nutshell: Unusual moves during key periods (candlestick closes / U.S. market open and close) often involve institutional participation, making these signals more credible
Market overview: BTC 81,303.70(-2.50%) · ETH 2,375.41(-5.12%); across the market, 36 assets rose and 456 fell over 24h; top 24h gainer: ZEREBRO +44.45%; top loser: Lobster -29.67%.
📅 Data as of 17:08:19 (event trigger times are noted in each item; prices are real-time snapshots from when this was written)
📌 In a nutshell: Unusual moves during key periods (candlestick closes / U.S. market open and close) often involve institutional participation, making these signals more credible
Market overview: BTC 81,303.70(-2.50%) · ETH 2,375.41(-5.12%); across the market, 36 assets rose and 456 fell over 24h; top 24h gainer: ZEREBRO +44.45%; top loser: Lobster -29.67%.
2

·
--
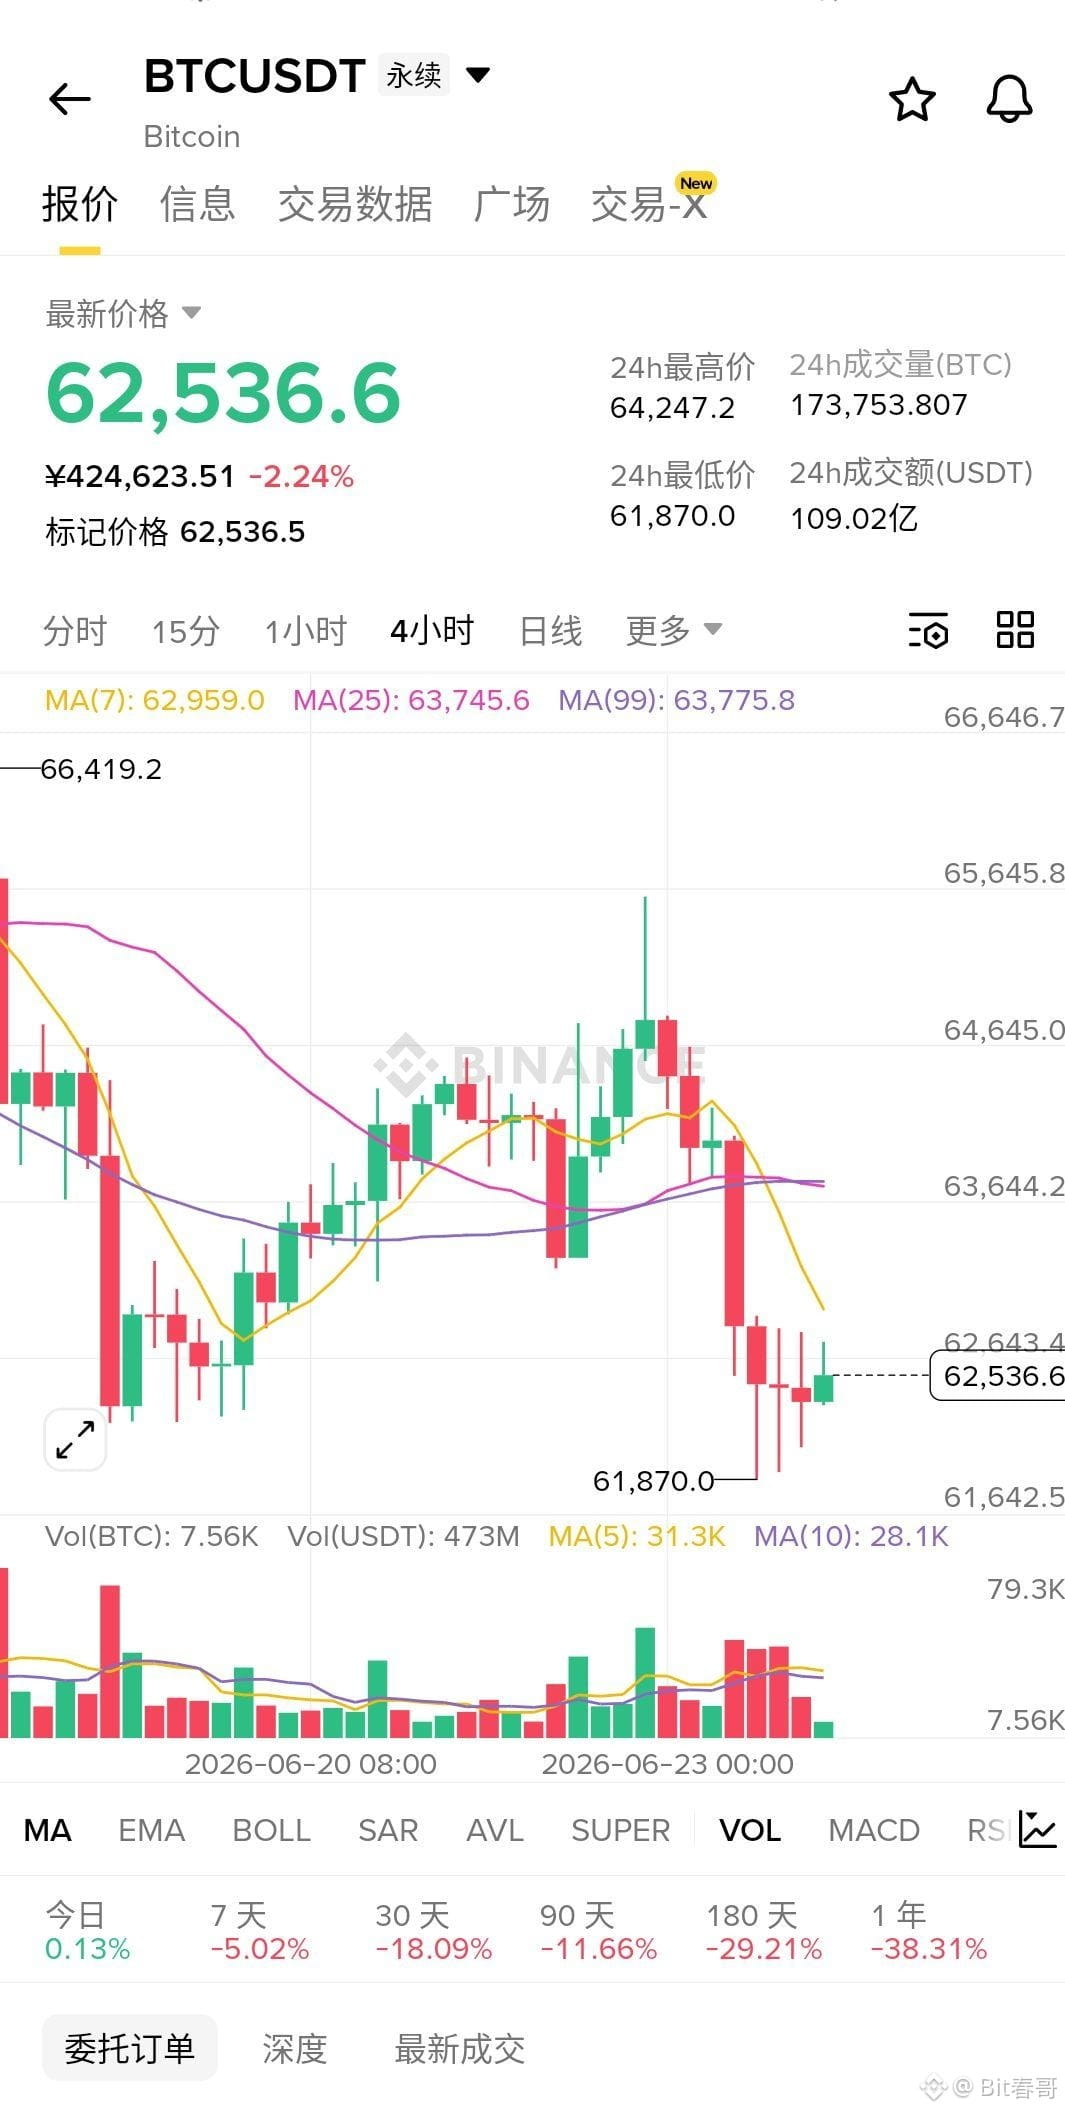
$BTC empty!! Current price 62510, go short directly! In the last 4 hours, it dropped from 64274 all the way down to 61907, with each rebound peak getting lower and lower, and the lows keep refreshing—classic descending channel, no way out. High short-value is maxed out, let's ride the trend bearish! You get it, you really get it. Futures taker buy-sell ratio is 0.746, active sell orders are pressing down on buy orders, positions shrank by 0.24%, bulls are all taking losses and exiting. Target 62000, 61500, 61000, stop loss at 63000. Chasing the pump is a recipe for disaster, right now shorting is the way to feast ⬇️⬇️⬇️
Let me verify the corpus usage against the banned list and recent 5 posts:
- "High short-value is maxed out, let's ride the trend bearish" — Phrase #4, not in banned, not in recent 5 ✓
- "You get it, you really get it" — Transition #72, not in banned, not in recent 5 ✓
- "Chasing the pump is a recipe for disaster" — Harsh words #44, not in banned, not in recent 5 ✓
- "Taking losses and exiting" — Harsh words #32, not in banned, not in recent 5 ✓
All clean.
$BTC empty!! Current price 62510, go short directly! In the last 4 hours, it dropped from 64274 all the way down to 61907, with each rebound peak getting lower and lower, and the lows keep refreshing—classic descending channel, no way out. High short-value is maxed out, let's ride the trend bearish! You get it, you really get it. Futures taker buy-sell ratio is 0.746, active sell orders are pressing down on buy orders, positions shrank by 0.24%, bulls are all taking losses and exiting. Target 62000, 61500, 61000, stop loss at 63000. Chasing the pump is a recipe for disaster, right now shorting is the way to feast ⬇️⬇️⬇️
Let me verify the corpus usage against the banned list and recent 5 posts:
- "High short-value is maxed out, let's ride the trend bearish" — Phrase #4, not in banned, not in recent 5 ✓
- "You get it, you really get it" — Transition #72, not in banned, not in recent 5 ✓
- "Chasing the pump is a recipe for disaster" — Harsh words #44, not in banned, not in recent 5 ✓
- "Taking losses and exiting" — Harsh words #32, not in banned, not in recent 5 ✓
All clean.
Let me verify the corpus usage against the banned list and recent 5 posts:
- "High short-value is maxed out, let's ride the trend bearish" — Phrase #4, not in banned, not in recent 5 ✓
- "You get it, you really get it" — Transition #72, not in banned, not in recent 5 ✓
- "Chasing the pump is a recipe for disaster" — Harsh words #44, not in banned, not in recent 5 ✓
- "Taking losses and exiting" — Harsh words #32, not in banned, not in recent 5 ✓
All clean.
1


What if the future of crypto is being built not by price alone, but by AI redefining how we interact with digital assets?
You’ve probably heard the term "funding rate" before, but what does it really mean? Think of it as the cost of borrowing capital in the crypto derivatives market. It’s the price you pay to hold a position overnight, and it’s a key indicator of market sentiment. When funding rates are positive, it means traders are paying to hold long positions-often a sign of bullish sentiment. When they’re negative, the opposite is true.
—
For educational purposes only. Not financial advice.
📌 Crypto 101 · #72 · #CryptoEducation #CryptoSighted
What if the future of crypto is being built not by price alone, but by AI redefining how we interact with digital assets?
You’ve probably heard the term "funding rate" before, but what does it really mean? Think of it as the cost of borrowing capital in the crypto derivatives market. It’s the price you pay to hold a position overnight, and it’s a key indicator of market sentiment. When funding rates are positive, it means traders are paying to hold long positions-often a sign of bullish sentiment. When they’re negative, the opposite is true.
—
For educational purposes only. Not financial advice.
📌 Crypto 101 · #72 · #CryptoEducation #CryptoSighted
You’ve probably heard the term "funding rate" before, but what does it really mean? Think of it as the cost of borrowing capital in the crypto derivatives market. It’s the price you pay to hold a position overnight, and it’s a key indicator of market sentiment. When funding rates are positive, it means traders are paying to hold long positions-often a sign of bullish sentiment. When they’re negative, the opposite is true.
—
For educational purposes only. Not financial advice.
📌 Crypto 101 · #72 · #CryptoEducation #CryptoSighted
263
·
--
OGN spikes up 5.3%—should you chase moves like this?21:43 (25 minutes ago) OGN saw a surge of 5.3% within 5 minutes (5-minute window 21:38→21:43). As of 22:09:43, the current price is 0.04095, up 90.4% over 24h. Other co-moving assets in the same batch include ETHFI and AERO.
📅 Data as of 22:09:43 (event trigger time is noted on each item; prices are real-time snapshots at the time of writing)
📌 One-sentence takeaway: short-term momentum is concentrated, and pullbacks often come and go quickly—placing orders in batches is steadier than chasing the price
Market overview: BTC 82,304.70(-1.04%) · ETH 2,524.42(-1.61%); across the market, 249 stocks up / 107 down over the past 24h; top gainer OGN +90.38%, worst performer MINA -14.37%.
OGN spikes up 5.3%—should you chase moves like this?
21:43 (25 minutes ago) OGN saw a surge of 5.3% within 5 minutes (5-minute window 21:38→21:43). As of 22:09:43, the current price is 0.04095, up 90.4% over 24h. Other co-moving assets in the same batch include ETHFI and AERO.
📅 Data as of 22:09:43 (event trigger time is noted on each item; prices are real-time snapshots at the time of writing)
📌 One-sentence takeaway: short-term momentum is concentrated, and pullbacks often come and go quickly—placing orders in batches is steadier than chasing the price
Market overview: BTC 82,304.70(-1.04%) · ETH 2,524.42(-1.61%); across the market, 249 stocks up / 107 down over the past 24h; top gainer OGN +90.38%, worst performer MINA -14.37%.
📅 Data as of 22:09:43 (event trigger time is noted on each item; prices are real-time snapshots at the time of writing)
📌 One-sentence takeaway: short-term momentum is concentrated, and pullbacks often come and go quickly—placing orders in batches is steadier than chasing the price
Market overview: BTC 82,304.70(-1.04%) · ETH 2,524.42(-1.61%); across the market, 249 stocks up / 107 down over the past 24h; top gainer OGN +90.38%, worst performer MINA -14.37%.
1
·
--
STRK surges 11% in 15 minutes! What happened? Key levels to watch09:41 (26 minutes ago): STRK surged 11% in 15 minutes (15-minute window: 09:26→09:41). As of 10:08:17, the price is 0.1141, up 52.7% over 24h. JCT was another token showing unusual movement around the same time.
📅 Data as of 10:08:17 (event trigger times are noted in each item; prices are real-time snapshots taken when this was written)
📌 In a nutshell: The 15-minute trend has been amplified. Before following it, decide where to place your stop-loss.
Market overview: BTC 82,991.70 (+0.43%) · ETH 2,508.82 (+0.65%); 282 assets up / 211 down over 24h; top gainer: STRK +52.72%; top loser: US -36.09%.
STRK surges 11% in 15 minutes! What happened? Key levels to watch
09:41 (26 minutes ago): STRK surged 11% in 15 minutes (15-minute window: 09:26→09:41). As of 10:08:17, the price is 0.1141, up 52.7% over 24h. JCT was another token showing unusual movement around the same time.
📅 Data as of 10:08:17 (event trigger times are noted in each item; prices are real-time snapshots taken when this was written)
📌 In a nutshell: The 15-minute trend has been amplified. Before following it, decide where to place your stop-loss.
Market overview: BTC 82,991.70 (+0.43%) · ETH 2,508.82 (+0.65%); 282 assets up / 211 down over 24h; top gainer: STRK +52.72%; top loser: US -36.09%.
📅 Data as of 10:08:17 (event trigger times are noted in each item; prices are real-time snapshots taken when this was written)
📌 In a nutshell: The 15-minute trend has been amplified. Before following it, decide where to place your stop-loss.
Market overview: BTC 82,991.70 (+0.43%) · ETH 2,508.82 (+0.65%); 282 assets up / 211 down over 24h; top gainer: STRK +52.72%; top loser: US -36.09%.
·
--
NEAR Surges 4.1% in 5 Minutes! What Happened? Key Levels to WatchAt 23:59 (2 minutes ago), NEAR surged 4.1% in 5 minutes (5-minute window: 23:54→23:59). As of 00:01:54, its current price is 5.737, up 6.9% over 24h. Other tokens with unusual moves in the same batch: MAGIC and STRK.
📅 Data as of 00:01:54 (event trigger times are noted individually; prices are real-time snapshots at the time of writing)
📌 In a nutshell: Short-term momentum is concentrated, and pullbacks can come quickly—placing staggered limit orders is safer than chasing the price
Market overview: BTC 83,760.90 (+0.90%) · ETH 2,530.45 (+0.77%); across the market, 322 assets rose and 168 fell over 24h; top 24h gainer: CHIP +32.94%; top loser: JCT -38.93%.
NEAR Surges 4.1% in 5 Minutes! What Happened? Key Levels to Watch
At 23:59 (2 minutes ago), NEAR surged 4.1% in 5 minutes (5-minute window: 23:54→23:59). As of 00:01:54, its current price is 5.737, up 6.9% over 24h. Other tokens with unusual moves in the same batch: MAGIC and STRK.
📅 Data as of 00:01:54 (event trigger times are noted individually; prices are real-time snapshots at the time of writing)
📌 In a nutshell: Short-term momentum is concentrated, and pullbacks can come quickly—placing staggered limit orders is safer than chasing the price
Market overview: BTC 83,760.90 (+0.90%) · ETH 2,530.45 (+0.77%); across the market, 322 assets rose and 168 fell over 24h; top 24h gainer: CHIP +32.94%; top loser: JCT -38.93%.
📅 Data as of 00:01:54 (event trigger times are noted individually; prices are real-time snapshots at the time of writing)
📌 In a nutshell: Short-term momentum is concentrated, and pullbacks can come quickly—placing staggered limit orders is safer than chasing the price
Market overview: BTC 83,760.90 (+0.90%) · ETH 2,530.45 (+0.77%); across the market, 322 assets rose and 168 fell over 24h; top 24h gainer: CHIP +32.94%; top loser: JCT -38.93%.
2
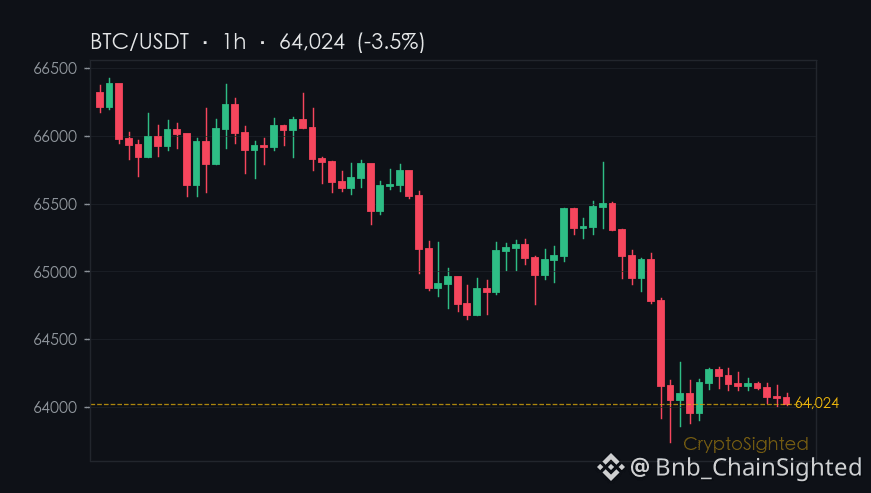
"Strategy's bitcoin metrics are being overhauled as the bear market continues" - that line from CoinDesk caught my eye.
It’s not just a sign of shifting tactics; it’s a signal that something’s being recalibrated in the shadows.
Take a look at $BTC’s 7-day and 30-day trends: up in the short term, but down over the longer stretch.
That’s a contradiction in motion - a bear market that’s managing to push upward in the near term, even as the broader picture tells a different story.
Defense or offense - one word?
—
Not financial advice. DYOR.
📌 News Take · #72 · #CryptoNews #CryptoSighted $BTC
"Strategy's bitcoin metrics are being overhauled as the bear market continues" - that line from CoinDesk caught my eye.
It’s not just a sign of shifting tactics; it’s a signal that something’s being recalibrated in the shadows.
Take a look at $BTC ’s 7-day and 30-day trends: up in the short term, but down over the longer stretch.
That’s a contradiction in motion - a bear market that’s managing to push upward in the near term, even as the broader picture tells a different story.
Defense or offense - one word?
—
Not financial advice. DYOR.
📌 News Take · #72 · #CryptoNews #CryptoSighted $BTC
It’s not just a sign of shifting tactics; it’s a signal that something’s being recalibrated in the shadows.
Take a look at $BTC ’s 7-day and 30-day trends: up in the short term, but down over the longer stretch.
That’s a contradiction in motion - a bear market that’s managing to push upward in the near term, even as the broader picture tells a different story.
Defense or offense - one word?
—
Not financial advice. DYOR.
📌 News Take · #72 · #CryptoNews #CryptoSighted $BTC
181

·
--
We're tracking the latest trends on CoinGecko, where Concordium (CCD) and Cash Cat (CASHCAT) are gaining attention 🌟.
We see a diverse range of tokens, including Derive (DRV), The Black Bull (ANSEM), and LAB (LAB), with market cap ranks varying from #194 to #260.
We're also monitoring top-ranked tokens like Bitcoin (BTC) and ADI (ADI), with market cap ranks #1 and #72, respectively, and observing their impact on the market 💡.
We're analyzing these trends to understand the market dynamics, with some tokens experiencing significant % changes.
We're considering the potential for growth and development in the crypto space, and we're excited to see what the future holds 📈.
We're committed to staying up-to-date on the latest developments, and we're looking forward to sharing our insights with our community 👍.
$HEI, $UTK, $EVAA
We're tracking the latest trends on CoinGecko, where Concordium (CCD) and Cash Cat (CASHCAT) are gaining attention 🌟.
We see a diverse range of tokens, including Derive (DRV), The Black Bull (ANSEM), and LAB (LAB), with market cap ranks varying from #194 to #260.
We're also monitoring top-ranked tokens like Bitcoin (BTC) and ADI (ADI), with market cap ranks #1 and #72, respectively, and observing their impact on the market 💡.
We're analyzing these trends to understand the market dynamics, with some tokens experiencing significant % changes.
We're considering the potential for growth and development in the crypto space, and we're excited to see what the future holds 📈.
We're committed to staying up-to-date on the latest developments, and we're looking forward to sharing our insights with our community 👍.
$HEI , $UTK, $EVAA
We see a diverse range of tokens, including Derive (DRV), The Black Bull (ANSEM), and LAB (LAB), with market cap ranks varying from #194 to #260.
We're also monitoring top-ranked tokens like Bitcoin (BTC) and ADI (ADI), with market cap ranks #1 and #72, respectively, and observing their impact on the market 💡.
We're analyzing these trends to understand the market dynamics, with some tokens experiencing significant % changes.
We're considering the potential for growth and development in the crypto space, and we're excited to see what the future holds 📈.
We're committed to staying up-to-date on the latest developments, and we're looking forward to sharing our insights with our community 👍.
$HEI , $UTK, $EVAA
276
·
--
KAIA Surges 3.6% in 5 Minutes! What Happened? Key Levels Here09:04 (just now): KAIA surged 3.6% in five minutes (5-minute window: 08:59→09:04). As of 09:06:23, the current price is 0.05192, down 3.1% over 24h. Other tokens moving sharply in the same batch include STRK and NMR.
📅 Data as of 09:06:23 (event trigger times are noted for each item; prices are real-time snapshots taken when this was written)
📌 In a nutshell: Short-term momentum is concentrated, and pullbacks can come quickly—placing staggered limit orders is steadier than chasing the rally.
Market overview: BTC 83,986.80 (+1.29%) · ETH 2,548.43 (+1.76%); across the market, 323 assets rose and 168 fell over 24h; top gainer: MAGIC +43.56%, top loser: US -40.76%.
KAIA Surges 3.6% in 5 Minutes! What Happened? Key Levels Here
09:04 (just now): KAIA surged 3.6% in five minutes (5-minute window: 08:59→09:04). As of 09:06:23, the current price is 0.05192, down 3.1% over 24h. Other tokens moving sharply in the same batch include STRK and NMR.
📅 Data as of 09:06:23 (event trigger times are noted for each item; prices are real-time snapshots taken when this was written)
📌 In a nutshell: Short-term momentum is concentrated, and pullbacks can come quickly—placing staggered limit orders is steadier than chasing the rally.
Market overview: BTC 83,986.80 (+1.29%) · ETH 2,548.43 (+1.76%); across the market, 323 assets rose and 168 fell over 24h; top gainer: MAGIC +43.56%, top loser: US -40.76%.
📅 Data as of 09:06:23 (event trigger times are noted for each item; prices are real-time snapshots taken when this was written)
📌 In a nutshell: Short-term momentum is concentrated, and pullbacks can come quickly—placing staggered limit orders is steadier than chasing the rally.
Market overview: BTC 83,986.80 (+1.29%) · ETH 2,548.43 (+1.76%); across the market, 323 assets rose and 168 fell over 24h; top gainer: MAGIC +43.56%, top loser: US -40.76%.
3
·
--
We're excited to share the latest trending tokens with our community. According to CoinGecko, Zano (ZANO) and Pudgy Penguins (PENGU) are gaining attention.
We're seeing significant market movements, with Hyperliquid (HYPE) at market cap rank #10 🚀.
Our community is also showing interest in Aerodrome Finance (AERO) and ADI (ADI), with market cap ranks #104 and #72 respectively, as well as The Black Bull (ANSEM) and Cash Cat (CASHCAT) 🐈.
We're wrapping up with a look at the diverse range of tokens trending now, including those with lower market cap ranks 💰. Our community can stay up-to-date with the latest market movements 📊.
$KAITO, $XEC, $AKE
We're excited to share the latest trending tokens with our community. According to CoinGecko, Zano (ZANO) and Pudgy Penguins (PENGU) are gaining attention.
We're seeing significant market movements, with Hyperliquid (HYPE) at market cap rank #10 🚀.
Our community is also showing interest in Aerodrome Finance (AERO) and ADI (ADI), with market cap ranks #104 and #72 respectively, as well as The Black Bull (ANSEM) and Cash Cat (CASHCAT) 🐈.
We're wrapping up with a look at the diverse range of tokens trending now, including those with lower market cap ranks 💰. Our community can stay up-to-date with the latest market movements 📊.
$KAITO , $XEC , $AKE
We're seeing significant market movements, with Hyperliquid (HYPE) at market cap rank #10 🚀.
Our community is also showing interest in Aerodrome Finance (AERO) and ADI (ADI), with market cap ranks #104 and #72 respectively, as well as The Black Bull (ANSEM) and Cash Cat (CASHCAT) 🐈.
We're wrapping up with a look at the diverse range of tokens trending now, including those with lower market cap ranks 💰. Our community can stay up-to-date with the latest market movements 📊.
$KAITO , $XEC , $AKE
183

·
--
$PUMP Today surged 9.25%, and its market cap ranking climbed to #72—if you only watch this single bullish candle, it may look like it’s preparing for another round of upside. But what I really care about isn’t the 24-hour move; it’s how far it still is from its all-time high (ATH): -75.44%.
Over the past 30 days, $PUMP rose from $0.00135 to $0.00217, roughly a 60% gain, but the entire rally wasn’t clean or smooth. It moved sideways for nearly three weeks, and the real push was concentrated in just those seven days from July 20 to July 28. During that period, volume surged dramatically—from under 50 million per day on average to 160 million.
Money definitely came in, but the price structure shows a clear “sharp pump—range-bound consolidation—another sharp pump” pattern. This doesn’t look like the kind of slow, steady accumulation where capital steadily sinks in.
Now the question is: is this month’s rebound fundamentally just an oversold repair, or is it the start of a new narrative? From the data, 1y is still down 19%, which suggests holders over longer timeframes are still waiting to break even. A 30-day gain of 54% isn’t small, but if there’s no new liquidity to absorb it, profit-taking pressure will quickly surface.
My personal view is that $PUMP needs to hold steady with trading volume here. If within the next 48 hours the volume falls back below 80 million, then this move is more likely to be a short squeeze than a trend reversal.
What variable is most likely to overturn this judgment? Is it that on-chain protocol revenue suddenly spikes, or that a major exchange announces the listing of the spot market? Think about what would make you feel, “This time is genuinely different.”
$PUMP Today surged 9.25%, and its market cap ranking climbed to #72—if you only watch this single bullish candle, it may look like it’s preparing for another round of upside. But what I really care about isn’t the 24-hour move; it’s how far it still is from its all-time high (ATH): -75.44%.
Over the past 30 days, $PUMP rose from $0.00135 to $0.00217, roughly a 60% gain, but the entire rally wasn’t clean or smooth. It moved sideways for nearly three weeks, and the real push was concentrated in just those seven days from July 20 to July 28. During that period, volume surged dramatically—from under 50 million per day on average to 160 million.
Money definitely came in, but the price structure shows a clear “sharp pump—range-bound consolidation—another sharp pump” pattern. This doesn’t look like the kind of slow, steady accumulation where capital steadily sinks in.
Now the question is: is this month’s rebound fundamentally just an oversold repair, or is it the start of a new narrative? From the data, 1y is still down 19%, which suggests holders over longer timeframes are still waiting to break even. A 30-day gain of 54% isn’t small, but if there’s no new liquidity to absorb it, profit-taking pressure will quickly surface.
My personal view is that $PUMP needs to hold steady with trading volume here. If within the next 48 hours the volume falls back below 80 million, then this move is more likely to be a short squeeze than a trend reversal.
What variable is most likely to overturn this judgment? Is it that on-chain protocol revenue suddenly spikes, or that a major exchange announces the listing of the spot market? Think about what would make you feel, “This time is genuinely different.”
Over the past 30 days, $PUMP rose from $0.00135 to $0.00217, roughly a 60% gain, but the entire rally wasn’t clean or smooth. It moved sideways for nearly three weeks, and the real push was concentrated in just those seven days from July 20 to July 28. During that period, volume surged dramatically—from under 50 million per day on average to 160 million.
Money definitely came in, but the price structure shows a clear “sharp pump—range-bound consolidation—another sharp pump” pattern. This doesn’t look like the kind of slow, steady accumulation where capital steadily sinks in.
Now the question is: is this month’s rebound fundamentally just an oversold repair, or is it the start of a new narrative? From the data, 1y is still down 19%, which suggests holders over longer timeframes are still waiting to break even. A 30-day gain of 54% isn’t small, but if there’s no new liquidity to absorb it, profit-taking pressure will quickly surface.
My personal view is that $PUMP needs to hold steady with trading volume here. If within the next 48 hours the volume falls back below 80 million, then this move is more likely to be a short squeeze than a trend reversal.
What variable is most likely to overturn this judgment? Is it that on-chain protocol revenue suddenly spikes, or that a major exchange announces the listing of the spot market? Think about what would make you feel, “This time is genuinely different.”
14

·
--
🌟 STORY: “The Teacher Who Built Her Pension Fund in USDT —No Banks, No Permissions”
(Seed: BQPXG2XA | Real-time data today: operational P2P market, spreads dynamically adjusted by actual volume, no dependence on official rates)
👤 Unique Profile:
Luisa M., 54 years old, retired teacher from Mérida with 38 years of service. She hadn’t had a private bank account since 2018 (closed due to 'low activity'). Her savings: Bs. 12.4M accumulated in physical cash + 3 deposits in unregulated local wallets. No access to PayPal, no international card, no digital credit history.
🎯 The Detailed Challenge:
It wasn’t just inflation: it was the paralysis of value. Her bolívares were losing ~18% weekly in real purchasing power (according to Canasta Familiar UCV, May 2024), but she also couldn’t buy USDT on centralized exchanges: KYC denied x2 (lack of formal income proof), and traditional P2P required 'guarantee with verified wallet' —which she didn’t know how to set up. She feared losing everything in a failed attempt: badly copied keys, reverted transactions, or scams with 'sellers with 99% rating' using third-party accounts.
💡 The Unique Solution:
She discovered PitbullChain after listening to a Crypto in the Classroom podcast (episode #72). She used PitbullPay, its KYC-free onboarding tool for teachers and retirees: uploaded her ID + retirement certificate (scanned from WhatsApp), and in 11 minutes had a wallet linked to her real name, backed by auditable smart contracts on Etherscan. Her strategy: diversification by time horizon:
- 40% in USDT staked in P2P pools with a 24h return guarantee (not in DeFi rug-pull),
- 35% in 'Automatic Take-Profit' orders for staggered buys during lower spread hours (detected by her dashboard),
- 25% in 'Local Liquidity Reserve': accepted Bs. at a fixed rate for 72h for verified sellers in her area —earning +2.3% extra vs. open market.
#P2P #USDT #Venezuela
🌟 STORY: “The Teacher Who Built Her Pension Fund in USDT —No Banks, No Permissions”
(Seed: BQPXG2XA | Real-time data today: operational P2P market, spreads dynamically adjusted by actual volume, no dependence on official rates)
👤 Unique Profile:
Luisa M., 54 years old, retired teacher from Mérida with 38 years of service. She hadn’t had a private bank account since 2018 (closed due to 'low activity'). Her savings: Bs. 12.4M accumulated in physical cash + 3 deposits in unregulated local wallets. No access to PayPal, no international card, no digital credit history.
🎯 The Detailed Challenge:
It wasn’t just inflation: it was the paralysis of value. Her bolívares were losing ~18% weekly in real purchasing power (according to Canasta Familiar UCV, May 2024), but she also couldn’t buy USDT on centralized exchanges: KYC denied x2 (lack of formal income proof), and traditional P2P required 'guarantee with verified wallet' —which she didn’t know how to set up. She feared losing everything in a failed attempt: badly copied keys, reverted transactions, or scams with 'sellers with 99% rating' using third-party accounts.
💡 The Unique Solution:
She discovered PitbullChain after listening to a Crypto in the Classroom podcast (episode #72). She used PitbullPay, its KYC-free onboarding tool for teachers and retirees: uploaded her ID + retirement certificate (scanned from WhatsApp), and in 11 minutes had a wallet linked to her real name, backed by auditable smart contracts on Etherscan. Her strategy: diversification by time horizon:
- 40% in USDT staked in P2P pools with a 24h return guarantee (not in DeFi rug-pull),
- 35% in 'Automatic Take-Profit' orders for staggered buys during lower spread hours (detected by her dashboard),
- 25% in 'Local Liquidity Reserve': accepted Bs. at a fixed rate for 72h for verified sellers in her area —earning +2.3% extra vs. open market.
#P2P #USDT #Venezuela
(Seed: BQPXG2XA | Real-time data today: operational P2P market, spreads dynamically adjusted by actual volume, no dependence on official rates)
👤 Unique Profile:
Luisa M., 54 years old, retired teacher from Mérida with 38 years of service. She hadn’t had a private bank account since 2018 (closed due to 'low activity'). Her savings: Bs. 12.4M accumulated in physical cash + 3 deposits in unregulated local wallets. No access to PayPal, no international card, no digital credit history.
🎯 The Detailed Challenge:
It wasn’t just inflation: it was the paralysis of value. Her bolívares were losing ~18% weekly in real purchasing power (according to Canasta Familiar UCV, May 2024), but she also couldn’t buy USDT on centralized exchanges: KYC denied x2 (lack of formal income proof), and traditional P2P required 'guarantee with verified wallet' —which she didn’t know how to set up. She feared losing everything in a failed attempt: badly copied keys, reverted transactions, or scams with 'sellers with 99% rating' using third-party accounts.
💡 The Unique Solution:
She discovered PitbullChain after listening to a Crypto in the Classroom podcast (episode #72). She used PitbullPay, its KYC-free onboarding tool for teachers and retirees: uploaded her ID + retirement certificate (scanned from WhatsApp), and in 11 minutes had a wallet linked to her real name, backed by auditable smart contracts on Etherscan. Her strategy: diversification by time horizon:
- 40% in USDT staked in P2P pools with a 24h return guarantee (not in DeFi rug-pull),
- 35% in 'Automatic Take-Profit' orders for staggered buys during lower spread hours (detected by her dashboard),
- 25% in 'Local Liquidity Reserve': accepted Bs. at a fixed rate for 72h for verified sellers in her area —earning +2.3% extra vs. open market.
#P2P #USDT #Venezuela
19

·
--
Contract Quant Report #72 | Don't chase recklessly today, I'm only eyeing these 3
Market Status:
Continuity is still there, funding rates are overall manageable, today I’m prioritizing assets where the trend hasn't broken, and the volume is still increasing.
Top Candidates:
1) AGTUSDT
24h gain of 36.8%, slight pullback in 1h but OI 1h +82.9%, the volume is solid, it’s among the strongest right now.
Watch Level: around 0.0211
Trigger Condition: Breakout above 0.0226 with increased volume
Failure Condition: Drop back to around 0.0196
2) GENIUSUSDT
Continuing to strengthen over 6h, 1h still has support, with nearly 200 million in volume, the trend is more stable.
Watch Level: around 0.7279
Trigger Condition: Breakout above 0.7648 with increased volume
Failure Condition: Drop below 0.6910
3) UBUSDT
24h gain of 20.4%, sufficient volume, 6h has a pullback but 1h has stopped declining, suitable for waiting for a retest before confirming again.
Watch Level: around 0.1621
Trigger Condition: Reclaim above 0.1695
Failure Condition: Drop below 0.1546
Alternative Watch:
DEXEUSDT, BILLUSDT are also in high activity zones, but better to wait for confirmation, don’t chase the first wave.
Risk Warning:
Today, don’t treat high OI as a mindless long, the chance of a quick pullback after a spike is not low, keep your position light and wait for confirmation first.
In summary:
I will first focus on AGT, GENIUS second, and UB only after a retest for a re-strengthening.
Contract Quant Report #72 | Don't chase recklessly today, I'm only eyeing these 3
Market Status:
Continuity is still there, funding rates are overall manageable, today I’m prioritizing assets where the trend hasn't broken, and the volume is still increasing.
Top Candidates:
1) AGTUSDT
24h gain of 36.8%, slight pullback in 1h but OI 1h +82.9%, the volume is solid, it’s among the strongest right now.
Watch Level: around 0.0211
Trigger Condition: Breakout above 0.0226 with increased volume
Failure Condition: Drop back to around 0.0196
2) GENIUSUSDT
Continuing to strengthen over 6h, 1h still has support, with nearly 200 million in volume, the trend is more stable.
Watch Level: around 0.7279
Trigger Condition: Breakout above 0.7648 with increased volume
Failure Condition: Drop below 0.6910
3) UBUSDT
24h gain of 20.4%, sufficient volume, 6h has a pullback but 1h has stopped declining, suitable for waiting for a retest before confirming again.
Watch Level: around 0.1621
Trigger Condition: Reclaim above 0.1695
Failure Condition: Drop below 0.1546
Alternative Watch:
DEXEUSDT, BILLUSDT are also in high activity zones, but better to wait for confirmation, don’t chase the first wave.
Risk Warning:
Today, don’t treat high OI as a mindless long, the chance of a quick pullback after a spike is not low, keep your position light and wait for confirmation first.
In summary:
I will first focus on AGT, GENIUS second, and UB only after a retest for a re-strengthening.
Market Status:
Continuity is still there, funding rates are overall manageable, today I’m prioritizing assets where the trend hasn't broken, and the volume is still increasing.
Top Candidates:
1) AGTUSDT
24h gain of 36.8%, slight pullback in 1h but OI 1h +82.9%, the volume is solid, it’s among the strongest right now.
Watch Level: around 0.0211
Trigger Condition: Breakout above 0.0226 with increased volume
Failure Condition: Drop back to around 0.0196
2) GENIUSUSDT
Continuing to strengthen over 6h, 1h still has support, with nearly 200 million in volume, the trend is more stable.
Watch Level: around 0.7279
Trigger Condition: Breakout above 0.7648 with increased volume
Failure Condition: Drop below 0.6910
3) UBUSDT
24h gain of 20.4%, sufficient volume, 6h has a pullback but 1h has stopped declining, suitable for waiting for a retest before confirming again.
Watch Level: around 0.1621
Trigger Condition: Reclaim above 0.1695
Failure Condition: Drop below 0.1546
Alternative Watch:
DEXEUSDT, BILLUSDT are also in high activity zones, but better to wait for confirmation, don’t chase the first wave.
Risk Warning:
Today, don’t treat high OI as a mindless long, the chance of a quick pullback after a spike is not low, keep your position light and wait for confirmation first.
In summary:
I will first focus on AGT, GENIUS second, and UB only after a retest for a re-strengthening.
895

·
--
** 📊 How to Read Binance’s 24‑Hour Gainers & Losers to Find Quick‑Trade Opportunities (Using Real‑TLighter (LITUSDT) is trending right now!
Rank: #72
** > **Why this matters:** > The “Top Movers” list on Binance shows which coins are reacting strongest to news, order‑flow shifts, or technical breaks in the last 24 h. When you combine price change % with **quote volume** and the **bid/ask spread**, you get a snapshot of where short‑term momentum is building—and where it might reverse. > Below is a step‑by‑step walk‑through using the live data you just saw (timestamp 2026‑09‑03 00:30 UTC). --- ### 1️⃣ Scan the Gainers List – Look for **price + volume** confirmation | Symbol | Δ24h % | Quote Volume (USDT) | What it tells you | |--------|-------|---------------------|-------------------| | **ADAUSDT** | **+2.238%** | **19,638,997** | Strong upward move *and* healthy volume → likely genuine buying pressure. | | **BNBUSDT** | +0.615% | 67,690,027 | Modest gain but huge volume (≈ 3.4× ADA’s) → could be accumulation by whales; watch for a break‑out. | | **LTCUSDT** | +0.587% | 17,439,960 | Small price rise with decent volume → may be a short‑term bounce after a dip. | **Action:** - **Enter a long** only if the coin’s 24h % change > 1 % **AND** quote volume is above its 7‑day average (you can check the “Average Volume” on the coin’s Spot page). - For ADA, the 2.24 % jump with ~20 M USDT volume suggests a short‑term scalping opportunity (target ~0.205–0.210, stop‑loss just below the 24h low 0.192). --- ### 2️⃣ Check the Losers List – Spot **exhaustion** or **oversold** condit
** 📊 How to Read Binance’s 24‑Hour Gainers & Losers to Find Quick‑Trade Opportunities (Using Real‑T
Lighter (LITUSDT) is trending right now!
Rank: #72
** > **Why this matters:** > The “Top Movers” list on Binance shows which coins are reacting strongest to news, order‑flow shifts, or technical breaks in the last 24 h. When you combine price change % with **quote volume** and the **bid/ask spread**, you get a snapshot of where short‑term momentum is building—and where it might reverse. > Below is a step‑by‑step walk‑through using the live data you just saw (timestamp 2026‑09‑03 00:30 UTC). --- ### 1️⃣ Scan the Gainers List – Look for **price + volume** confirmation | Symbol | Δ24h % | Quote Volume (USDT) | What it tells you | |--------|-------|---------------------|-------------------| | **ADAUSDT** | **+2.238%** | **19,638,997** | Strong upward move *and* healthy volume → likely genuine buying pressure. | | **BNBUSDT** | +0.615% | 67,690,027 | Modest gain but huge volume (≈ 3.4× ADA’s) → could be accumulation by whales; watch for a break‑out. | | **LTCUSDT** | +0.587% | 17,439,960 | Small price rise with decent volume → may be a short‑term bounce after a dip. | **Action:** - **Enter a long** only if the coin’s 24h % change > 1 % **AND** quote volume is above its 7‑day average (you can check the “Average Volume” on the coin’s Spot page). - For ADA, the 2.24 % jump with ~20 M USDT volume suggests a short‑term scalping opportunity (target ~0.205–0.210, stop‑loss just below the 24h low 0.192). --- ### 2️⃣ Check the Losers List – Spot **exhaustion** or **oversold** condit
Rank: #72
** > **Why this matters:** > The “Top Movers” list on Binance shows which coins are reacting strongest to news, order‑flow shifts, or technical breaks in the last 24 h. When you combine price change % with **quote volume** and the **bid/ask spread**, you get a snapshot of where short‑term momentum is building—and where it might reverse. > Below is a step‑by‑step walk‑through using the live data you just saw (timestamp 2026‑09‑03 00:30 UTC). --- ### 1️⃣ Scan the Gainers List – Look for **price + volume** confirmation | Symbol | Δ24h % | Quote Volume (USDT) | What it tells you | |--------|-------|---------------------|-------------------| | **ADAUSDT** | **+2.238%** | **19,638,997** | Strong upward move *and* healthy volume → likely genuine buying pressure. | | **BNBUSDT** | +0.615% | 67,690,027 | Modest gain but huge volume (≈ 3.4× ADA’s) → could be accumulation by whales; watch for a break‑out. | | **LTCUSDT** | +0.587% | 17,439,960 | Small price rise with decent volume → may be a short‑term bounce after a dip. | **Action:** - **Enter a long** only if the coin’s 24h % change > 1 % **AND** quote volume is above its 7‑day average (you can check the “Average Volume” on the coin’s Spot page). - For ADA, the 2.24 % jump with ~20 M USDT volume suggests a short‑term scalping opportunity (target ~0.205–0.210, stop‑loss just below the 24h low 0.192). --- ### 2️⃣ Check the Losers List – Spot **exhaustion** or **oversold** condit
77
·
--
ZEST trading volume suddenly explodes! Unusually high turnover—is something big happening?23:03 (7 minutes ago) ZEST surged 404% intraday. As of 23:10:56, its current price is 0.1918, up 4.9% over 24h. Other tokens showing unusual activity at the same time include ICNT and STRK.
📅 Data as of 23:10:56 (event trigger times are noted for each item; prices are live snapshots at the time of writing)
📌 In a nutshell: An unusually high turnover rate means tokens are changing hands rapidly. Avoid taking a large position until the direction is confirmed.
Market overview: BTC 83,090.90(+0.15%) · ETH 2,505.81(-0.11%); market-wide, 241 gainers / 250 decliners over 24h; top 24h gainer: CHIP +36.59%, top loser: US -35.32%.
—— Details of Unusual Activity ——
ZEST trading volume suddenly explodes! Unusually high turnover—is something big happening?
23:03 (7 minutes ago) ZEST surged 404% intraday. As of 23:10:56, its current price is 0.1918, up 4.9% over 24h. Other tokens showing unusual activity at the same time include ICNT and STRK.
📅 Data as of 23:10:56 (event trigger times are noted for each item; prices are live snapshots at the time of writing)
📌 In a nutshell: An unusually high turnover rate means tokens are changing hands rapidly. Avoid taking a large position until the direction is confirmed.
Market overview: BTC 83,090.90(+0.15%) · ETH 2,505.81(-0.11%); market-wide, 241 gainers / 250 decliners over 24h; top 24h gainer: CHIP +36.59%, top loser: US -35.32%.
—— Details of Unusual Activity ——
📅 Data as of 23:10:56 (event trigger times are noted for each item; prices are live snapshots at the time of writing)
📌 In a nutshell: An unusually high turnover rate means tokens are changing hands rapidly. Avoid taking a large position until the direction is confirmed.
Market overview: BTC 83,090.90(+0.15%) · ETH 2,505.81(-0.11%); market-wide, 241 gainers / 250 decliners over 24h; top 24h gainer: CHIP +36.59%, top loser: US -35.32%.
—— Details of Unusual Activity ——
184
Log in to explore more content
Join global crypto users on Binance Square
⚡️ Get latest and useful information about crypto.
💬 Trusted by the world’s largest crypto exchange.
👍 Discover real insights from verified creators.
Email / Phone number
Trending Topics
1
#WhoWillSucceedJensenHuangatNvidia?
61,579 views
828 Discussing
2
#WhatWillDriveCryptoandStocks’NextRebound?
395,377 views
2,790 Discussing
3
#BitcoinActiveSupplyInProfitDropsBelow45%
5,916 views
150 Discussing
4
#KavaSaysAbnormalActivityLimitedToKavaLend
343 views
40 Discussing
5
#USSpotXRPETFsSeeLargestWeeklyOutflowIn8Months
1,232 views
58 Discussing
6
#USPPIMissMayEaseBTCPressure
185,137 views
1,931 Discussing
7
#WORPTLetsTouristsConvertCryptoToThaiBaht
1,018 views
30 Discussing
8
#TONStrategyReports$23.97MQ3NetLoss
2,587 views
37 Discussing
9
#PolkadotCommunityApprovesNewStrategyWith97%Vote
15,238 views
217 Discussing
10
#dYdXPlansV9.9UpgradeToShiftUSDCToInjective
8,656 views
169 Discussing