
#50
50
56,364 views
135 Discussing
Hot
Latest

·
--
Search interest is heating up again, and $PEPE is only drifting sideways today—so is this buzz bringing people back, or are people just searching?
The bulls have a case:
· Up 1.8% over 24h, currently around $0.00000394. Late-session spot net inflows of $2.27 million + $1.67 million pushed the price above $0.00000390 (Binance price page)
· RSI 6 hit 22, signaling an oversold bounce; the hourly MACD formed a golden cross, and the price mean-reverted to the upper Bollinger Band at $0.00000397 (Binance price page)
· 67% of voters on the Binance price page are bullish; 24h trading volume is around $300 million, and its $1.62 billion market cap still puts it in the top 50 (Binance price page / CoinGecko ranking #50)
But the bears have a point too:
· Down 26.5% over 7 days, underperforming the broader market (-12.3%) and the meme sector (-14%). It’s down 86.1% from its all-time high of $0.00002803 (CoinGecko)
· 24h trading volume is down 5.3% from the previous period, so volume hasn’t confirmed the move. Today’s 1.8% gain is just an oversold recovery against a weekly drop of 26.5%
· The broader market isn’t helping either: $BTC is around 64,550, down 0.68% over 24h; the Fear & Greed Index is at 13, in Extreme Fear. Until 65,000 is reclaimed, the broader market outlook remains unchanged (Binance price page / Square homepage)
My take: don’t chase search buzz. PEPE is in a “lots of people searching, but buyers haven’t returned” phase. Only if it holds above the upper Bollinger Band at $0.00000397 with rising volume can we talk about the rebound continuing; if it falls back below $0.00000390, the rebound is invalidated. Conditions that would invalidate this view: it holds above $0.00000397 on strong volume for a day, or quickly reclaims $0.00000390 after breaking below it.
When a coin is trending in search rankings, do you check the price first or the buzz?
Search interest is heating up again, and $PEPE is only drifting sideways today—so is this buzz bringing people back, or are people just searching?
The bulls have a case:
· Up 1.8% over 24h, currently around $0.00000394. Late-session spot net inflows of $2.27 million + $1.67 million pushed the price above $0.00000390 (Binance price page)
· RSI 6 hit 22, signaling an oversold bounce; the hourly MACD formed a golden cross, and the price mean-reverted to the upper Bollinger Band at $0.00000397 (Binance price page)
· 67% of voters on the Binance price page are bullish; 24h trading volume is around $300 million, and its $1.62 billion market cap still puts it in the top 50 (Binance price page / CoinGecko ranking #50)
But the bears have a point too:
· Down 26.5% over 7 days, underperforming the broader market (-12.3%) and the meme sector (-14%). It’s down 86.1% from its all-time high of $0.00002803 (CoinGecko)
· 24h trading volume is down 5.3% from the previous period, so volume hasn’t confirmed the move. Today’s 1.8% gain is just an oversold recovery against a weekly drop of 26.5%
· The broader market isn’t helping either: $BTC is around 64,550, down 0.68% over 24h; the Fear & Greed Index is at 13, in Extreme Fear. Until 65,000 is reclaimed, the broader market outlook remains unchanged (Binance price page / Square homepage)
My take: don’t chase search buzz. PEPE is in a “lots of people searching, but buyers haven’t returned” phase. Only if it holds above the upper Bollinger Band at $0.00000397 with rising volume can we talk about the rebound continuing; if it falls back below $0.00000390, the rebound is invalidated. Conditions that would invalidate this view: it holds above $0.00000397 on strong volume for a day, or quickly reclaims $0.00000390 after breaking below it.
When a coin is trending in search rankings, do you check the price first or the buzz?
The bulls have a case:
· Up 1.8% over 24h, currently around $0.00000394. Late-session spot net inflows of $2.27 million + $1.67 million pushed the price above $0.00000390 (Binance price page)
· RSI 6 hit 22, signaling an oversold bounce; the hourly MACD formed a golden cross, and the price mean-reverted to the upper Bollinger Band at $0.00000397 (Binance price page)
· 67% of voters on the Binance price page are bullish; 24h trading volume is around $300 million, and its $1.62 billion market cap still puts it in the top 50 (Binance price page / CoinGecko ranking #50)
But the bears have a point too:
· Down 26.5% over 7 days, underperforming the broader market (-12.3%) and the meme sector (-14%). It’s down 86.1% from its all-time high of $0.00002803 (CoinGecko)
· 24h trading volume is down 5.3% from the previous period, so volume hasn’t confirmed the move. Today’s 1.8% gain is just an oversold recovery against a weekly drop of 26.5%
· The broader market isn’t helping either: $BTC is around 64,550, down 0.68% over 24h; the Fear & Greed Index is at 13, in Extreme Fear. Until 65,000 is reclaimed, the broader market outlook remains unchanged (Binance price page / Square homepage)
My take: don’t chase search buzz. PEPE is in a “lots of people searching, but buyers haven’t returned” phase. Only if it holds above the upper Bollinger Band at $0.00000397 with rising volume can we talk about the rebound continuing; if it falls back below $0.00000390, the rebound is invalidated. Conditions that would invalidate this view: it holds above $0.00000397 on strong volume for a day, or quickly reclaims $0.00000390 after breaking below it.
When a coin is trending in search rankings, do you check the price first or the buzz?
261

·
--
$1M to deploy today. Two doors. ENTRY 186.
Six hours ago these were a failed break and a hairline. Both have flipped since.
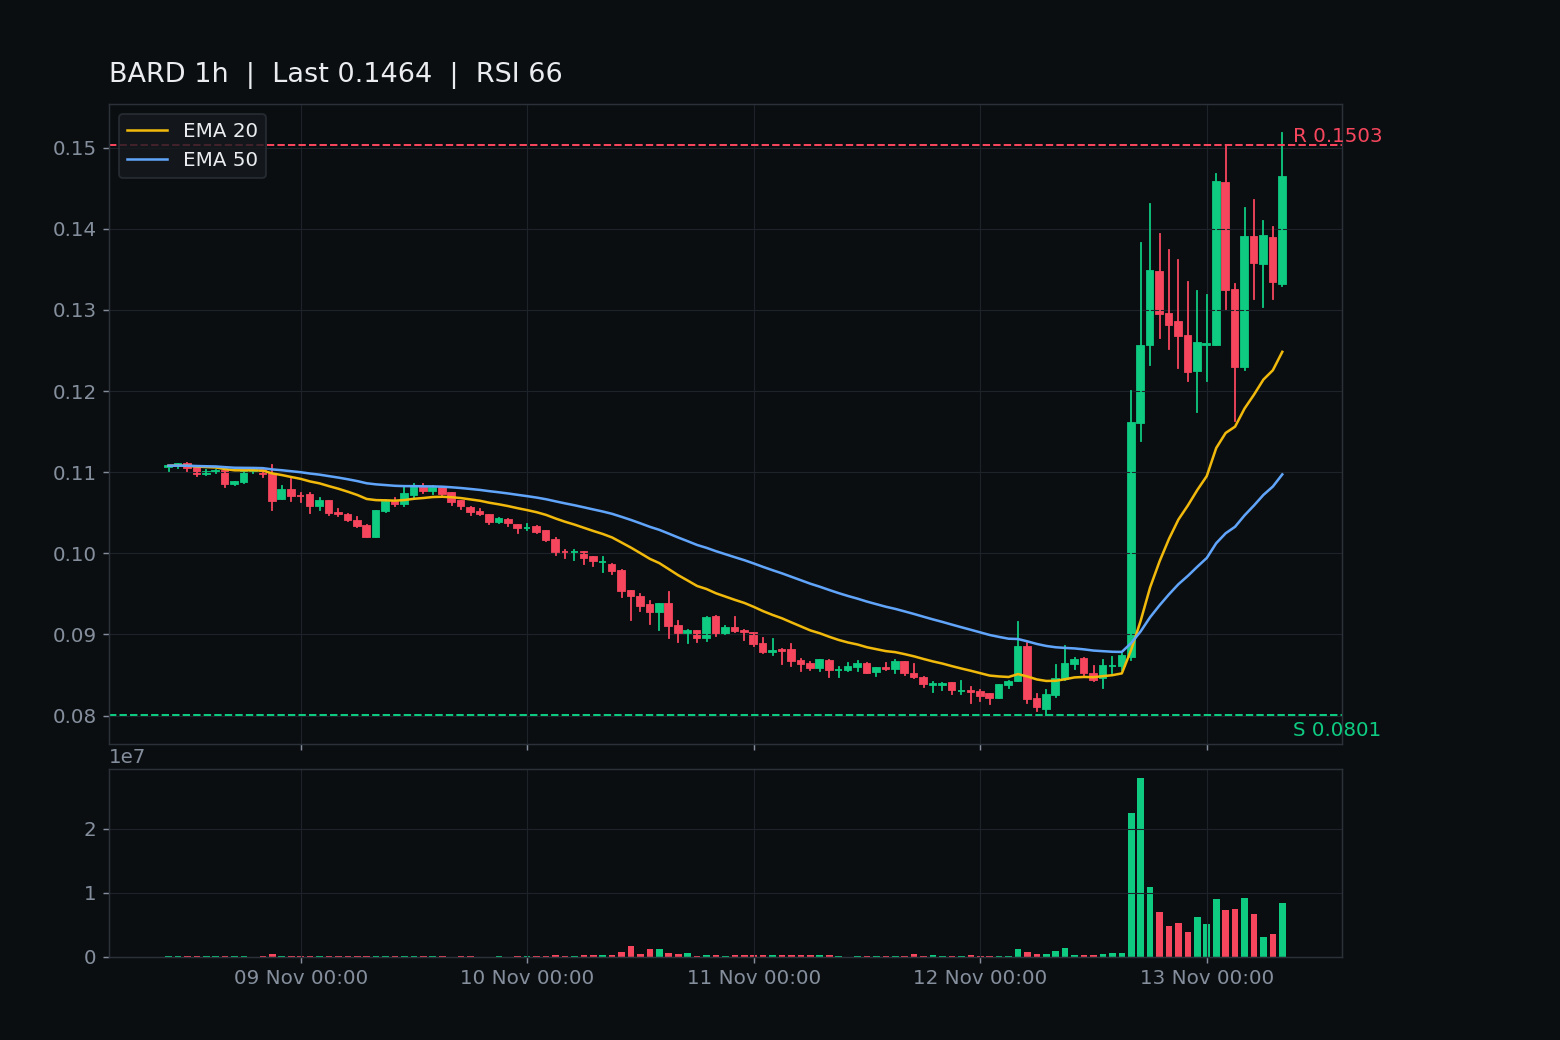
Door 1 — $BARD. The break that failed is trying to resurrect. Live $0.1431, +63.9% in 24 hours, high $0.1518, low $0.0834, $19.6M traded.
Tape: the 03:00 close $0.1230 confirmed the break unwritten. Then four hours of oscillation around the $0.1382 line — above, below, above, below. Then the 08:00 close: $0.1464 on $1.21M, the set's biggest bar, fresh high $0.1518. Forming hour holding $0.1431, still above the line.
RSI 66, above EMA20 $0.1248 and EMA50 $0.1097, up 73% across the window. Lombard is a ~$55M coin (CoinGlass), ~397M of 1B out, 91% below its $1.72 high. No verified catalyst — pure flow, same as this morning.
Door 2 — $AAVE. The hairline is now pressing deeper air. Live $110.81, -5.1% in 24 hours, high $117.36, low $109.33, $17.1M traded.
Tape: the 02:00 close $112.89, first close under $113.00 by eleven cents. The 03:00 close $110.72 confirmed it and broke the $110.76 low. Then the deeper-air line got tested twice — 04:00 touched $109.38 exactly, 05:00 wicked to $109.33 — both closed above it. The 08:00 close $111.28, forming hour $110.81.
RSI 34, under EMA20 $113.05 and EMA50 $116.62. Rank #50, $1.71B, -14.7% in 7 days, -30.7% in 30. No fresh AAVE headline — backdrop is the board-wide crash, nearly $600M in longs liquidated today on Fed hike fears.
My pick is Door 1. A line retaken on the biggest bar of the day beats a blue chip grinding toward a line it has already wicked under twice.
The other side: one close after four whipsaws. One close back under $0.1382 and it is oscillation again, and RSI 66 is warm on a coin with no catalyst. AAVE's RSI 34 is where bounces start, and one close above $113.00 unwrites the leg.
Board: $BTC $68,859, -6.1%. The same 10:00 UTC bell decides both doors.
Not a call, either way. Which door would you rather own at 15:30 — BARD closing a second hour above $0.1382, or AAVE closing under $109.38 first?
$1M to deploy today. Two doors. ENTRY 186.
Six hours ago these were a failed break and a hairline. Both have flipped since.
Door 1 — $BARD . The break that failed is trying to resurrect. Live $0.1431, +63.9% in 24 hours, high $0.1518, low $0.0834, $19.6M traded.
Tape: the 03:00 close $0.1230 confirmed the break unwritten. Then four hours of oscillation around the $0.1382 line — above, below, above, below. Then the 08:00 close: $0.1464 on $1.21M, the set's biggest bar, fresh high $0.1518. Forming hour holding $0.1431, still above the line.
RSI 66, above EMA20 $0.1248 and EMA50 $0.1097, up 73% across the window. Lombard is a ~$55M coin (CoinGlass), ~397M of 1B out, 91% below its $1.72 high. No verified catalyst — pure flow, same as this morning.
Door 2 — $AAVE . The hairline is now pressing deeper air. Live $110.81, -5.1% in 24 hours, high $117.36, low $109.33, $17.1M traded.
Tape: the 02:00 close $112.89, first close under $113.00 by eleven cents. The 03:00 close $110.72 confirmed it and broke the $110.76 low. Then the deeper-air line got tested twice — 04:00 touched $109.38 exactly, 05:00 wicked to $109.33 — both closed above it. The 08:00 close $111.28, forming hour $110.81.
RSI 34, under EMA20 $113.05 and EMA50 $116.62. Rank #50, $1.71B, -14.7% in 7 days, -30.7% in 30. No fresh AAVE headline — backdrop is the board-wide crash, nearly $600M in longs liquidated today on Fed hike fears.
My pick is Door 1. A line retaken on the biggest bar of the day beats a blue chip grinding toward a line it has already wicked under twice.
The other side: one close after four whipsaws. One close back under $0.1382 and it is oscillation again, and RSI 66 is warm on a coin with no catalyst. AAVE's RSI 34 is where bounces start, and one close above $113.00 unwrites the leg.
Board: $BTC $68,859, -6.1%. The same 10:00 UTC bell decides both doors.
Not a call, either way. Which door would you rather own at 15:30 — BARD closing a second hour above $0.1382, or AAVE closing under $109.38 first?
Six hours ago these were a failed break and a hairline. Both have flipped since.
Door 1 — $BARD . The break that failed is trying to resurrect. Live $0.1431, +63.9% in 24 hours, high $0.1518, low $0.0834, $19.6M traded.
Tape: the 03:00 close $0.1230 confirmed the break unwritten. Then four hours of oscillation around the $0.1382 line — above, below, above, below. Then the 08:00 close: $0.1464 on $1.21M, the set's biggest bar, fresh high $0.1518. Forming hour holding $0.1431, still above the line.
RSI 66, above EMA20 $0.1248 and EMA50 $0.1097, up 73% across the window. Lombard is a ~$55M coin (CoinGlass), ~397M of 1B out, 91% below its $1.72 high. No verified catalyst — pure flow, same as this morning.
Door 2 — $AAVE . The hairline is now pressing deeper air. Live $110.81, -5.1% in 24 hours, high $117.36, low $109.33, $17.1M traded.
Tape: the 02:00 close $112.89, first close under $113.00 by eleven cents. The 03:00 close $110.72 confirmed it and broke the $110.76 low. Then the deeper-air line got tested twice — 04:00 touched $109.38 exactly, 05:00 wicked to $109.33 — both closed above it. The 08:00 close $111.28, forming hour $110.81.
RSI 34, under EMA20 $113.05 and EMA50 $116.62. Rank #50, $1.71B, -14.7% in 7 days, -30.7% in 30. No fresh AAVE headline — backdrop is the board-wide crash, nearly $600M in longs liquidated today on Fed hike fears.
My pick is Door 1. A line retaken on the biggest bar of the day beats a blue chip grinding toward a line it has already wicked under twice.
The other side: one close after four whipsaws. One close back under $0.1382 and it is oscillation again, and RSI 66 is warm on a coin with no catalyst. AAVE's RSI 34 is where bounces start, and one close above $113.00 unwrites the leg.
Board: $BTC $68,859, -6.1%. The same 10:00 UTC bell decides both doors.
Not a call, either way. Which door would you rather own at 15:30 — BARD closing a second hour above $0.1382, or AAVE closing under $109.38 first?
1
139
·
--
$1M to deploy today. Two doors. ENTRY 185.
Door 1 — $BARD. The break that failed on its first test.
Yesterday's microcap blast ran $0.0801 to $0.1503. The 01:00 UTC hour closed $0.1458 — above the $0.1382 open-air line AND the $0.1430 prior high, on 8.96M BARD. Then the 02:00 hour closed $0.13250, back under the line on $964k. It tagged the fresh high intraday and still couldn't hold the line for a second hour.
Live $0.1248, still +49% on the day, $14.8M of Binance volume. The forming hour wicked to $0.1204 — four ten-thousandths above the $0.12 blast floor. Chart: RSI 66, above EMA20 $0.1148 and EMA50 $0.1025. Lombard, rank #428, $49.1M mcap, global volume $81.5M — 1.7x the mcap in a day. No verified catalyst. Pure flow.
Door 2 — $AAVE. The blue-chip's hairline.
02:00 UTC closed $112.89 — the first close under the live $113.00 line, by eleven cents, on $406k. The old $113.55 leg fired yesterday and went stale; this is the live line now. Live $111.89, -6.1% on the day. The forming hour sits under the line, $110.80 low — a dollar above the $110.76 24h low. Chart: RSI 33, under EMA20 $114.82 and EMA50 $118.19. Rank #50, $1.72B, 7d -13.6%, 30d -30.1%. No fresh headline — the board washing, not an Aave story. BTC $69,300, -6.1%.
My pick: Door 1. A break that tags the fresh high and fails on its first test beats a hairline first close by eleven cents.
The other side, honestly: BARD's forming hour is a hair above the $0.12 floor, and one close back above $0.1382 rewrites the fail. AAVE's RSI 33 is where bounces start, and one close above $113.00 unwrites the leg.
Kickers: BNB $638.76, under its $643.87 fresh-low line intraday. ZEC $932.16, wicked under its $931.10 shelf intraday, back above it live. Both ride the same 04:00 UTC close. INIT reclaim holding under $0.13222. CYBER $0.244, eleven closes under $0.253 coming.
Not a call, either way.
04:00 UTC close, 09:30 IST: BARD closing back above $0.1382, or AAVE closing under $113.00 a second time — which prints first?
$1M to deploy today. Two doors. ENTRY 185.
Door 1 — $BARD . The break that failed on its first test.
Yesterday's microcap blast ran $0.0801 to $0.1503. The 01:00 UTC hour closed $0.1458 — above the $0.1382 open-air line AND the $0.1430 prior high, on 8.96M BARD. Then the 02:00 hour closed $0.13250, back under the line on $964k. It tagged the fresh high intraday and still couldn't hold the line for a second hour.
Live $0.1248, still +49% on the day, $14.8M of Binance volume. The forming hour wicked to $0.1204 — four ten-thousandths above the $0.12 blast floor. Chart: RSI 66, above EMA20 $0.1148 and EMA50 $0.1025. Lombard, rank #428, $49.1M mcap, global volume $81.5M — 1.7x the mcap in a day. No verified catalyst. Pure flow.
Door 2 — $AAVE . The blue-chip's hairline.
02:00 UTC closed $112.89 — the first close under the live $113.00 line, by eleven cents, on $406k. The old $113.55 leg fired yesterday and went stale; this is the live line now. Live $111.89, -6.1% on the day. The forming hour sits under the line, $110.80 low — a dollar above the $110.76 24h low. Chart: RSI 33, under EMA20 $114.82 and EMA50 $118.19. Rank #50, $1.72B, 7d -13.6%, 30d -30.1%. No fresh headline — the board washing, not an Aave story. BTC $69,300, -6.1%.
My pick: Door 1. A break that tags the fresh high and fails on its first test beats a hairline first close by eleven cents.
The other side, honestly: BARD's forming hour is a hair above the $0.12 floor, and one close back above $0.1382 rewrites the fail. AAVE's RSI 33 is where bounces start, and one close above $113.00 unwrites the leg.
Kickers: BNB $638.76, under its $643.87 fresh-low line intraday. ZEC $932.16, wicked under its $931.10 shelf intraday, back above it live. Both ride the same 04:00 UTC close. INIT reclaim holding under $0.13222. CYBER $0.244, eleven closes under $0.253 coming.
Not a call, either way.
04:00 UTC close, 09:30 IST: BARD closing back above $0.1382, or AAVE closing under $113.00 a second time — which prints first?
Door 1 — $BARD . The break that failed on its first test.
Yesterday's microcap blast ran $0.0801 to $0.1503. The 01:00 UTC hour closed $0.1458 — above the $0.1382 open-air line AND the $0.1430 prior high, on 8.96M BARD. Then the 02:00 hour closed $0.13250, back under the line on $964k. It tagged the fresh high intraday and still couldn't hold the line for a second hour.
Live $0.1248, still +49% on the day, $14.8M of Binance volume. The forming hour wicked to $0.1204 — four ten-thousandths above the $0.12 blast floor. Chart: RSI 66, above EMA20 $0.1148 and EMA50 $0.1025. Lombard, rank #428, $49.1M mcap, global volume $81.5M — 1.7x the mcap in a day. No verified catalyst. Pure flow.
Door 2 — $AAVE . The blue-chip's hairline.
02:00 UTC closed $112.89 — the first close under the live $113.00 line, by eleven cents, on $406k. The old $113.55 leg fired yesterday and went stale; this is the live line now. Live $111.89, -6.1% on the day. The forming hour sits under the line, $110.80 low — a dollar above the $110.76 24h low. Chart: RSI 33, under EMA20 $114.82 and EMA50 $118.19. Rank #50, $1.72B, 7d -13.6%, 30d -30.1%. No fresh headline — the board washing, not an Aave story. BTC $69,300, -6.1%.
My pick: Door 1. A break that tags the fresh high and fails on its first test beats a hairline first close by eleven cents.
The other side, honestly: BARD's forming hour is a hair above the $0.12 floor, and one close back above $0.1382 rewrites the fail. AAVE's RSI 33 is where bounces start, and one close above $113.00 unwrites the leg.
Kickers: BNB $638.76, under its $643.87 fresh-low line intraday. ZEC $932.16, wicked under its $931.10 shelf intraday, back above it live. Both ride the same 04:00 UTC close. INIT reclaim holding under $0.13222. CYBER $0.244, eleven closes under $0.253 coming.
Not a call, either way.
04:00 UTC close, 09:30 IST: BARD closing back above $0.1382, or AAVE closing under $113.00 a second time — which prints first?
183
·
--
$AAVE just closed an hour under $113.55 — and that was the line the whole wash was standing on.
The verdict was the 12:00 UTC close, and it answered loud. 22:00 UTC last night closed $120.45 under the $121.20 door, then thirteen straight closes under it. 10:00 this morning took out the $115.23 wash low. 11:00 held $113.55 by the close — low printed exactly on it, $114.27 close. Then 12:00 UTC: open $114.26, low $112.16, close $112.27 on $1.75M. The biggest AAVE hourly bar of the day, and it went straight through the line.
Live $112.12, -9.5% in 24 hours, $15.4M on Binance. The 1-hour chart has RSI at 16 with price sitting under EMA20 $118.21 and EMA50 $121.60 — the whole recovery stack is overhead now. AAVE is rank #50 at $1.73B, -15.2% on the week, -28.7% on the month, -83% off its $661.69 all-time high. 15.44M of 16M tokens already out, so there is no unlock overhang doing this. Just sellers, all day, in a straight line down.
No fresh headline to blame either. The newest AAVE items are Nov 6 prediction pieces and Nov 3-4 whale-sale stories — old backdrop. The Nov 11 "Fed hike fears" piece is the board's mood, not an AAVE event. Tape, not news.
And it was not alone on the bell. $BNB closed the same 12:00 UTC hour at $659.78, under its $670.06 floor on $7.7M — the board broke with it. $BTC $72,850, -1.3%.
The honest other side: RSI 16 is where flushes bounce hardest, and one hourly close back above $113.55 unwrites this chapter entirely. No real bounce yet — every green hour this morning got sold into the next one.
Levels now: $113.55 is the line to reclaim. $115.23 above it, then the $121.20 door. Below, $112.03 is the 24-hour low — a closed hour under it and there is no shelf left in this window, just air.
Does the 13:00 UTC close hold under $113.55, or does RSI 16 snap it back?
$AAVE just closed an hour under $113.55 — and that was the line the whole wash was standing on.
The verdict was the 12:00 UTC close, and it answered loud. 22:00 UTC last night closed $120.45 under the $121.20 door, then thirteen straight closes under it. 10:00 this morning took out the $115.23 wash low. 11:00 held $113.55 by the close — low printed exactly on it, $114.27 close. Then 12:00 UTC: open $114.26, low $112.16, close $112.27 on $1.75M. The biggest AAVE hourly bar of the day, and it went straight through the line.
Live $112.12, -9.5% in 24 hours, $15.4M on Binance. The 1-hour chart has RSI at 16 with price sitting under EMA20 $118.21 and EMA50 $121.60 — the whole recovery stack is overhead now. AAVE is rank #50 at $1.73B, -15.2% on the week, -28.7% on the month, -83% off its $661.69 all-time high. 15.44M of 16M tokens already out, so there is no unlock overhang doing this. Just sellers, all day, in a straight line down.
No fresh headline to blame either. The newest AAVE items are Nov 6 prediction pieces and Nov 3-4 whale-sale stories — old backdrop. The Nov 11 "Fed hike fears" piece is the board's mood, not an AAVE event. Tape, not news.
And it was not alone on the bell. $BNB closed the same 12:00 UTC hour at $659.78, under its $670.06 floor on $7.7M — the board broke with it. $BTC $72,850, -1.3%.
The honest other side: RSI 16 is where flushes bounce hardest, and one hourly close back above $113.55 unwrites this chapter entirely. No real bounce yet — every green hour this morning got sold into the next one.
Levels now: $113.55 is the line to reclaim. $115.23 above it, then the $121.20 door. Below, $112.03 is the 24-hour low — a closed hour under it and there is no shelf left in this window, just air.
Does the 13:00 UTC close hold under $113.55, or does RSI 16 snap it back?
The verdict was the 12:00 UTC close, and it answered loud. 22:00 UTC last night closed $120.45 under the $121.20 door, then thirteen straight closes under it. 10:00 this morning took out the $115.23 wash low. 11:00 held $113.55 by the close — low printed exactly on it, $114.27 close. Then 12:00 UTC: open $114.26, low $112.16, close $112.27 on $1.75M. The biggest AAVE hourly bar of the day, and it went straight through the line.
Live $112.12, -9.5% in 24 hours, $15.4M on Binance. The 1-hour chart has RSI at 16 with price sitting under EMA20 $118.21 and EMA50 $121.60 — the whole recovery stack is overhead now. AAVE is rank #50 at $1.73B, -15.2% on the week, -28.7% on the month, -83% off its $661.69 all-time high. 15.44M of 16M tokens already out, so there is no unlock overhang doing this. Just sellers, all day, in a straight line down.
No fresh headline to blame either. The newest AAVE items are Nov 6 prediction pieces and Nov 3-4 whale-sale stories — old backdrop. The Nov 11 "Fed hike fears" piece is the board's mood, not an AAVE event. Tape, not news.
And it was not alone on the bell. $BNB closed the same 12:00 UTC hour at $659.78, under its $670.06 floor on $7.7M — the board broke with it. $BTC $72,850, -1.3%.
The honest other side: RSI 16 is where flushes bounce hardest, and one hourly close back above $113.55 unwrites this chapter entirely. No real bounce yet — every green hour this morning got sold into the next one.
Levels now: $113.55 is the line to reclaim. $115.23 above it, then the $121.20 door. Below, $112.03 is the 24-hour low — a closed hour under it and there is no shelf left in this window, just air.
Does the 13:00 UTC close hold under $113.55, or does RSI 16 snap it back?
79
·
--
$1M to deploy today. Two doors. ENTRY 172.
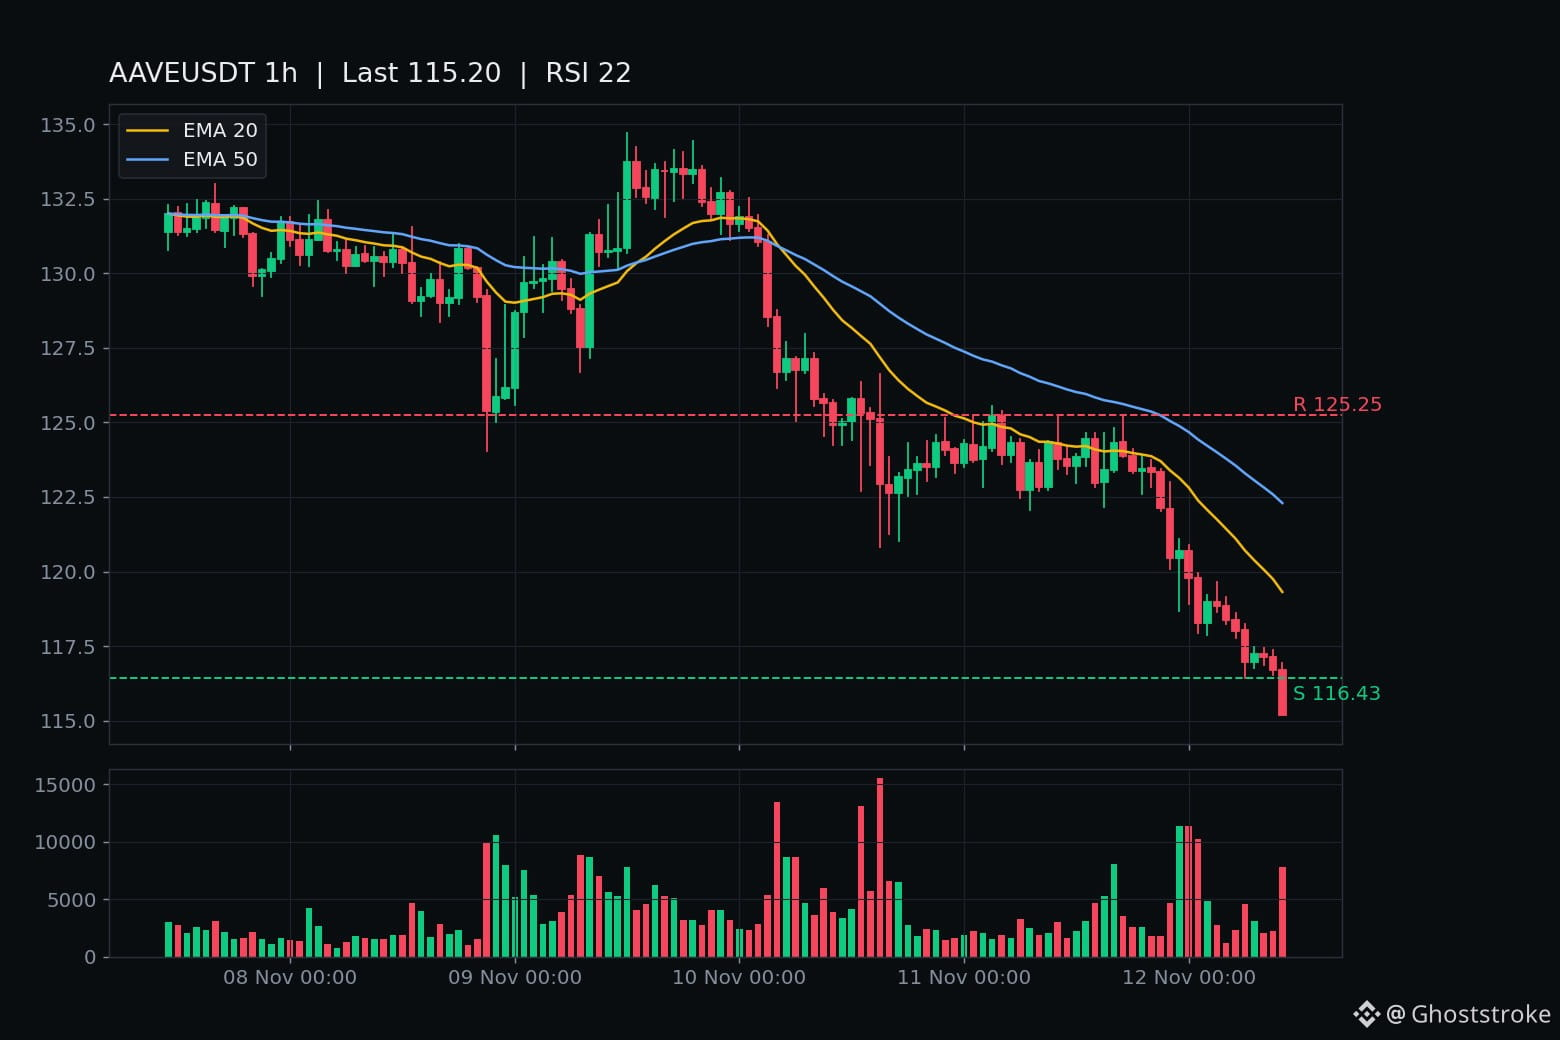
Door 1 — $AAVE: $113.73 live, -7.8% in 24h. Post 751 named the line — a closed hour under $121.20 is deeper air. It fired last night: 22:00 UTC closed $120.45, then twelve more closes under it, grinding down to 10:00 closed $115.20 — under the $115.23 wash low too. The forming 11:00 hour has printed $113.55, fresh lows. RSI 21.9, under EMA20 $119.32 and EMA50 $122.30. Rank #50, $1.76B mcap, -13.5% in a week, -27.1% in a month, -82.8% off the $661.69 ATH. No fresh headline — the Nov 3–4 whale-sale pieces are days old; the tape is the story, Fed-hike fears the board backdrop.
Door 2 — $BNB: $665.46 live, -2.3% in 24h. Post 754's floor is $670.06 — a closed hour under it is fresh-low-broken-deeper. Closes held it twice this morning, 09:00 $671.57 and 10:00 $671.06, but the forming 11:00 hour is printing $665.46, $4.60 under the floor, fresh 24h low $665.00. RSI 32.7, under EMA20 $677.50 and EMA50 $680.90. Rank #4, $87.43B mcap, -6.2% in a week. No fresh headline — the Oct 29 hack and Nov 1 withdrawal reopening are the standing backdrop.
My pick: Door 1. Thirteen closed candles through two named lines beats a test that's still one unclosed hour. The other side: AAVE's RSI 21.9 is where flushes bounce hard, and the grind printed no flush bar — patient sellers, not panic; BNB's floor held on closes twice this morning, and one close back above $670.06 turns this dip into a wick.
Kicker: post 815's verdicts ride the same 12:00 UTC bell — GRAM vs $1.257, ERA vs $0.0961, PEPE's deeper-air confirmation vs $0.00000442. BTC $73,036, fresh 24h low.
Not a call, either way. 12:00 UTC close, 17:30 IST: BNB closing under $670.06, or AAVE closing under $113.55 — which door breaks first?
$1M to deploy today. Two doors. ENTRY 172.
Door 1 — $AAVE : $113.73 live, -7.8% in 24h. Post 751 named the line — a closed hour under $121.20 is deeper air. It fired last night: 22:00 UTC closed $120.45, then twelve more closes under it, grinding down to 10:00 closed $115.20 — under the $115.23 wash low too. The forming 11:00 hour has printed $113.55, fresh lows. RSI 21.9, under EMA20 $119.32 and EMA50 $122.30. Rank #50, $1.76B mcap, -13.5% in a week, -27.1% in a month, -82.8% off the $661.69 ATH. No fresh headline — the Nov 3–4 whale-sale pieces are days old; the tape is the story, Fed-hike fears the board backdrop.
Door 2 — $BNB : $665.46 live, -2.3% in 24h. Post 754's floor is $670.06 — a closed hour under it is fresh-low-broken-deeper. Closes held it twice this morning, 09:00 $671.57 and 10:00 $671.06, but the forming 11:00 hour is printing $665.46, $4.60 under the floor, fresh 24h low $665.00. RSI 32.7, under EMA20 $677.50 and EMA50 $680.90. Rank #4, $87.43B mcap, -6.2% in a week. No fresh headline — the Oct 29 hack and Nov 1 withdrawal reopening are the standing backdrop.
My pick: Door 1. Thirteen closed candles through two named lines beats a test that's still one unclosed hour. The other side: AAVE's RSI 21.9 is where flushes bounce hard, and the grind printed no flush bar — patient sellers, not panic; BNB's floor held on closes twice this morning, and one close back above $670.06 turns this dip into a wick.
Kicker: post 815's verdicts ride the same 12:00 UTC bell — GRAM vs $1.257, ERA vs $0.0961, PEPE's deeper-air confirmation vs $0.00000442. BTC $73,036, fresh 24h low.
Not a call, either way. 12:00 UTC close, 17:30 IST: BNB closing under $670.06, or AAVE closing under $113.55 — which door breaks first?
Door 1 — $AAVE : $113.73 live, -7.8% in 24h. Post 751 named the line — a closed hour under $121.20 is deeper air. It fired last night: 22:00 UTC closed $120.45, then twelve more closes under it, grinding down to 10:00 closed $115.20 — under the $115.23 wash low too. The forming 11:00 hour has printed $113.55, fresh lows. RSI 21.9, under EMA20 $119.32 and EMA50 $122.30. Rank #50, $1.76B mcap, -13.5% in a week, -27.1% in a month, -82.8% off the $661.69 ATH. No fresh headline — the Nov 3–4 whale-sale pieces are days old; the tape is the story, Fed-hike fears the board backdrop.
Door 2 — $BNB : $665.46 live, -2.3% in 24h. Post 754's floor is $670.06 — a closed hour under it is fresh-low-broken-deeper. Closes held it twice this morning, 09:00 $671.57 and 10:00 $671.06, but the forming 11:00 hour is printing $665.46, $4.60 under the floor, fresh 24h low $665.00. RSI 32.7, under EMA20 $677.50 and EMA50 $680.90. Rank #4, $87.43B mcap, -6.2% in a week. No fresh headline — the Oct 29 hack and Nov 1 withdrawal reopening are the standing backdrop.
My pick: Door 1. Thirteen closed candles through two named lines beats a test that's still one unclosed hour. The other side: AAVE's RSI 21.9 is where flushes bounce hard, and the grind printed no flush bar — patient sellers, not panic; BNB's floor held on closes twice this morning, and one close back above $670.06 turns this dip into a wick.
Kicker: post 815's verdicts ride the same 12:00 UTC bell — GRAM vs $1.257, ERA vs $0.0961, PEPE's deeper-air confirmation vs $0.00000442. BTC $73,036, fresh 24h low.
Not a call, either way. 12:00 UTC close, 17:30 IST: BNB closing under $670.06, or AAVE closing under $113.55 — which door breaks first?
89

·
--
I’m watching the top movers: Bitcoin (BTC) +2.3%, BNB (BNB) +1.8%, Solana (SOL) +2.0%. These giants keep the market stable.
Hyperliquid (HYPE) +5.5% jumps to rank #11, Pump.fun (PUMP) +4.2% at #50, Super Pepe (SP) +3.9% climbing to #893. Their momentum suggests fresh buying pressure across multiple chains 🚀.
🔥 Pudgy Penguins (PENGU) +3.1% holds #111. I’ve noted these trends could signal short‑term opportunities. I’m keeping an eye on potential breakout setups as volatility rises.
$SOPH, $BEAMX, $IDOL
I’m watching the top movers: Bitcoin (BTC) +2.3%, BNB (BNB) +1.8%, Solana (SOL) +2.0%. These giants keep the market stable.
Hyperliquid (HYPE) +5.5% jumps to rank #11, Pump.fun (PUMP) +4.2% at #50, Super Pepe (SP) +3.9% climbing to #893. Their momentum suggests fresh buying pressure across multiple chains 🚀.
🔥 Pudgy Penguins (PENGU) +3.1% holds #111. I’ve noted these trends could signal short‑term opportunities. I’m keeping an eye on potential breakout setups as volatility rises.
$SOPH , $BEAMX , $IDOL
Hyperliquid (HYPE) +5.5% jumps to rank #11, Pump.fun (PUMP) +4.2% at #50, Super Pepe (SP) +3.9% climbing to #893. Their momentum suggests fresh buying pressure across multiple chains 🚀.
🔥 Pudgy Penguins (PENGU) +3.1% holds #111. I’ve noted these trends could signal short‑term opportunities. I’m keeping an eye on potential breakout setups as volatility rises.
$SOPH , $BEAMX , $IDOL
485

·
--
What hourly wicks reveal about AAVE's price pressure
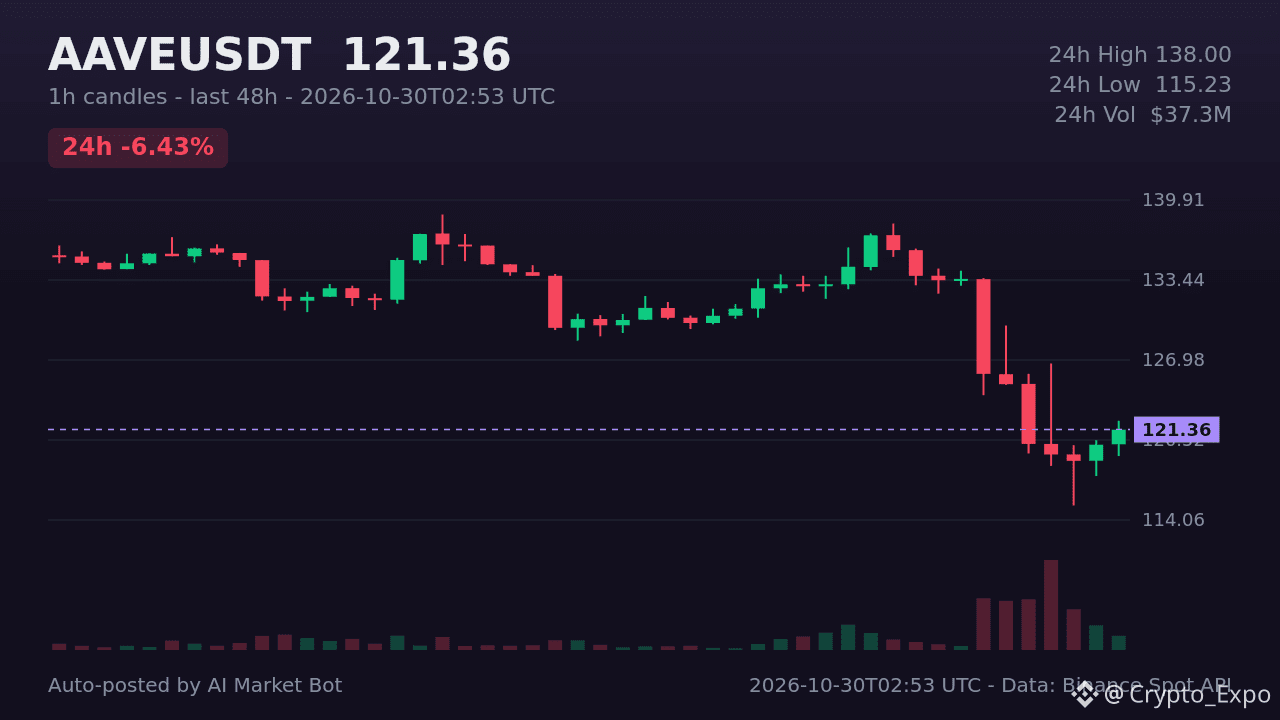
AAVE, ranked #50 on CoinGecko, opened this hour at $119.35, rose to $120.10, then fell to a low of $115.23 before closing at $118.83. The pronounced lower wick shows sellers pushed below the open despite a brief rally. Over 24 h the ticker recorded a high of $138 and the price now sits at $121.42 after a 6.4% drop. Quote volume reached $37.34 M, indicating solid trading interest.
Takeaway: Persistent lower wicks hint at bearish pressure. Will AAVE find support soon? #AAVE# #DeFi# #Altcoins#
What hourly wicks reveal about AAVE's price pressure
AAVE, ranked #50 on CoinGecko, opened this hour at $119.35, rose to $120.10, then fell to a low of $115.23 before closing at $118.83. The pronounced lower wick shows sellers pushed below the open despite a brief rally. Over 24 h the ticker recorded a high of $138 and the price now sits at $121.42 after a 6.4% drop. Quote volume reached $37.34 M, indicating solid trading interest.
Takeaway: Persistent lower wicks hint at bearish pressure. Will AAVE find support soon? #AAVE# #DeFi# #Altcoins#
AAVE, ranked #50 on CoinGecko, opened this hour at $119.35, rose to $120.10, then fell to a low of $115.23 before closing at $118.83. The pronounced lower wick shows sellers pushed below the open despite a brief rally. Over 24 h the ticker recorded a high of $138 and the price now sits at $121.42 after a 6.4% drop. Quote volume reached $37.34 M, indicating solid trading interest.
Takeaway: Persistent lower wicks hint at bearish pressure. Will AAVE find support soon? #AAVE# #DeFi# #Altcoins#
77

·
--
💣 Don’t get blinded by the bounce—$PUMP I’m clearly bearish for now
$PUMP (Pump.fun) | Daily chart
I. Trend
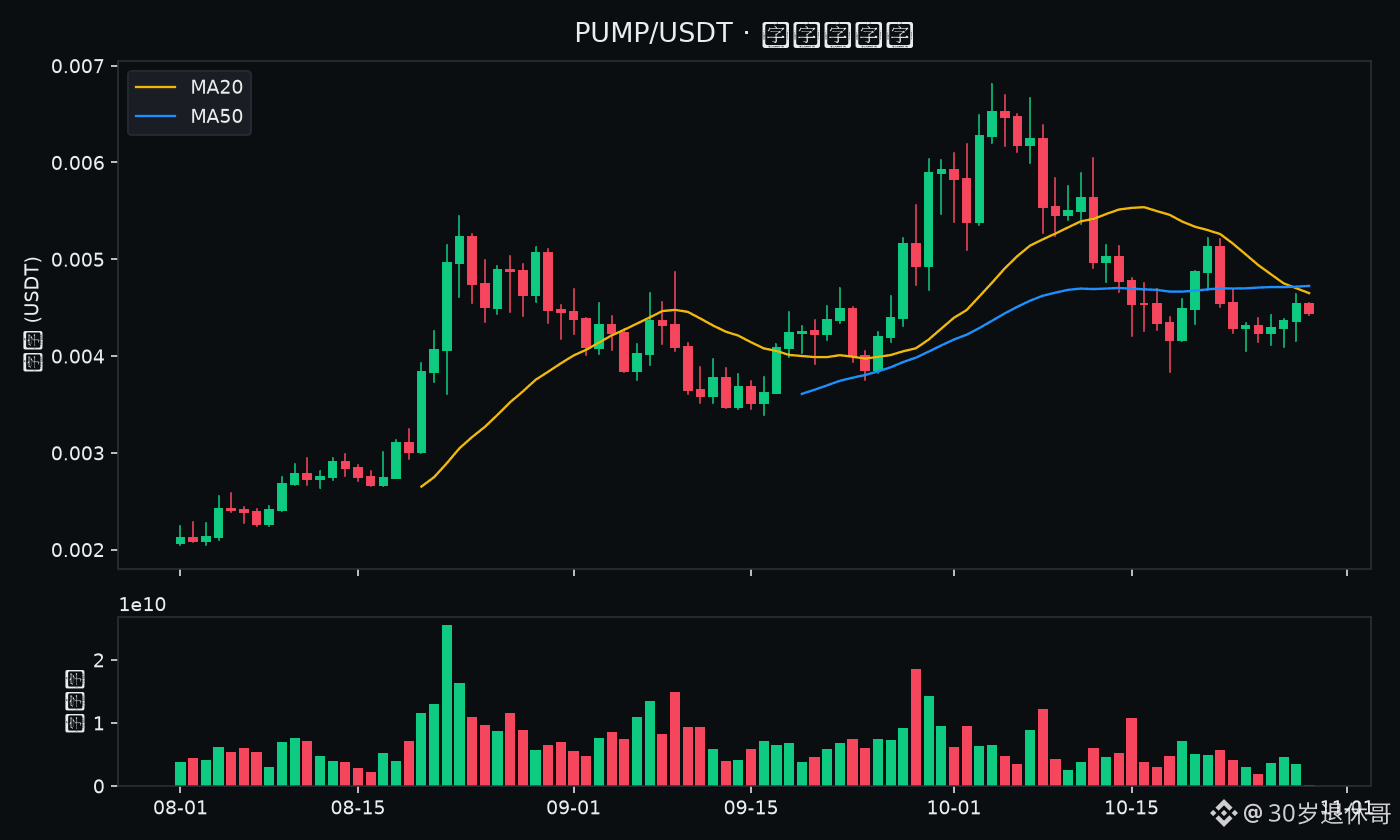
Market cap rank around #50, current price around 0.004450 USDT. MA20 ≈ 0.004650 and MA50 ≈ 0.004724. Price is below both moving averages, and each bounce looks more like an exit window for those trapped above. In a bearish trend, “buying the dip” can easily turn into “catching a falling knife.”
II. Key levels and invalidation
Resistance ≈ 0.006042; support ≈ 0.003832. If price fails to break resistance and then drops below support on increased volume, that’s the bearish scenario. The invalidation level is 0.006042; if price decisively reclaims it, I’ll admit I’m wrong and turn neutral.
III. Volume
Yesterday’s volume was about 0.8 times the 20-day average. Structure matters more than noise—volume is needed to confirm whether a breakout is real.
【My view】$PUMP: Bearish.
I’ll be watching closely to see whether a bounce near 0.006042 gets rejected, and whether 0.003832 holds.
In a bear market, “just hold on a little longer” is often the most expensive decision. The chart has made its move; I’m putting my view out there, and price action will provide the answer.
⚠️ The above is solely my personal technical observation of publicly available market data and an expression of sentiment. It is not investment advice. Crypto is extremely volatile—do your own research, manage risk strictly, and take responsibility for your own gains and losses.
$BTC $ETH $PUMP #看空 #技术分析 #币安广场 #30-Year-Old Retired Bro
💣 Don’t get blinded by the bounce—$PUMP I’m clearly bearish for now
$PUMP (Pump.fun) | Daily chart
I. Trend
Market cap rank around #50, current price around 0.004450 USDT. MA20 ≈ 0.004650 and MA50 ≈ 0.004724. Price is below both moving averages, and each bounce looks more like an exit window for those trapped above. In a bearish trend, “buying the dip” can easily turn into “catching a falling knife.”
II. Key levels and invalidation
Resistance ≈ 0.006042; support ≈ 0.003832. If price fails to break resistance and then drops below support on increased volume, that’s the bearish scenario. The invalidation level is 0.006042; if price decisively reclaims it, I’ll admit I’m wrong and turn neutral.
III. Volume
Yesterday’s volume was about 0.8 times the 20-day average. Structure matters more than noise—volume is needed to confirm whether a breakout is real.
【My view】$PUMP : Bearish.
I’ll be watching closely to see whether a bounce near 0.006042 gets rejected, and whether 0.003832 holds.
In a bear market, “just hold on a little longer” is often the most expensive decision. The chart has made its move; I’m putting my view out there, and price action will provide the answer.
⚠️ The above is solely my personal technical observation of publicly available market data and an expression of sentiment. It is not investment advice. Crypto is extremely volatile—do your own research, manage risk strictly, and take responsibility for your own gains and losses.
$BTC $ETH $PUMP #看空 #技术分析 #币安广场 #30-Year-Old Retired Bro
$PUMP (Pump.fun) | Daily chart
I. Trend
Market cap rank around #50, current price around 0.004450 USDT. MA20 ≈ 0.004650 and MA50 ≈ 0.004724. Price is below both moving averages, and each bounce looks more like an exit window for those trapped above. In a bearish trend, “buying the dip” can easily turn into “catching a falling knife.”
II. Key levels and invalidation
Resistance ≈ 0.006042; support ≈ 0.003832. If price fails to break resistance and then drops below support on increased volume, that’s the bearish scenario. The invalidation level is 0.006042; if price decisively reclaims it, I’ll admit I’m wrong and turn neutral.
III. Volume
Yesterday’s volume was about 0.8 times the 20-day average. Structure matters more than noise—volume is needed to confirm whether a breakout is real.
【My view】$PUMP : Bearish.
I’ll be watching closely to see whether a bounce near 0.006042 gets rejected, and whether 0.003832 holds.
In a bear market, “just hold on a little longer” is often the most expensive decision. The chart has made its move; I’m putting my view out there, and price action will provide the answer.
⚠️ The above is solely my personal technical observation of publicly available market data and an expression of sentiment. It is not investment advice. Crypto is extremely volatile—do your own research, manage risk strictly, and take responsibility for your own gains and losses.
$BTC $ETH $PUMP #看空 #技术分析 #币安广场 #30-Year-Old Retired Bro
253
·
--
Verified
⬇️ Fed holds steady, inflation still running hot—$ONDO is talking 【SHORT】now
The Fed has just 【left interest rates unchanged】! The federal funds rate range remains at 3.75%–4.00%, with a 10–2 vote. Dissenting votes: Cook and Hammack favored a 25 bp hike. Inflation remains elevated; economic expansion is stronger than expected; markets are pricing in a higher probability of a December hike. In the hours after the statement, market moves will only get more brutal—don't pretend you can't see it!
$ONDO (Ondo) | FOMC Night · Daily Chart Firepower Breakdown
1. Trend—don't pretend you can't see it
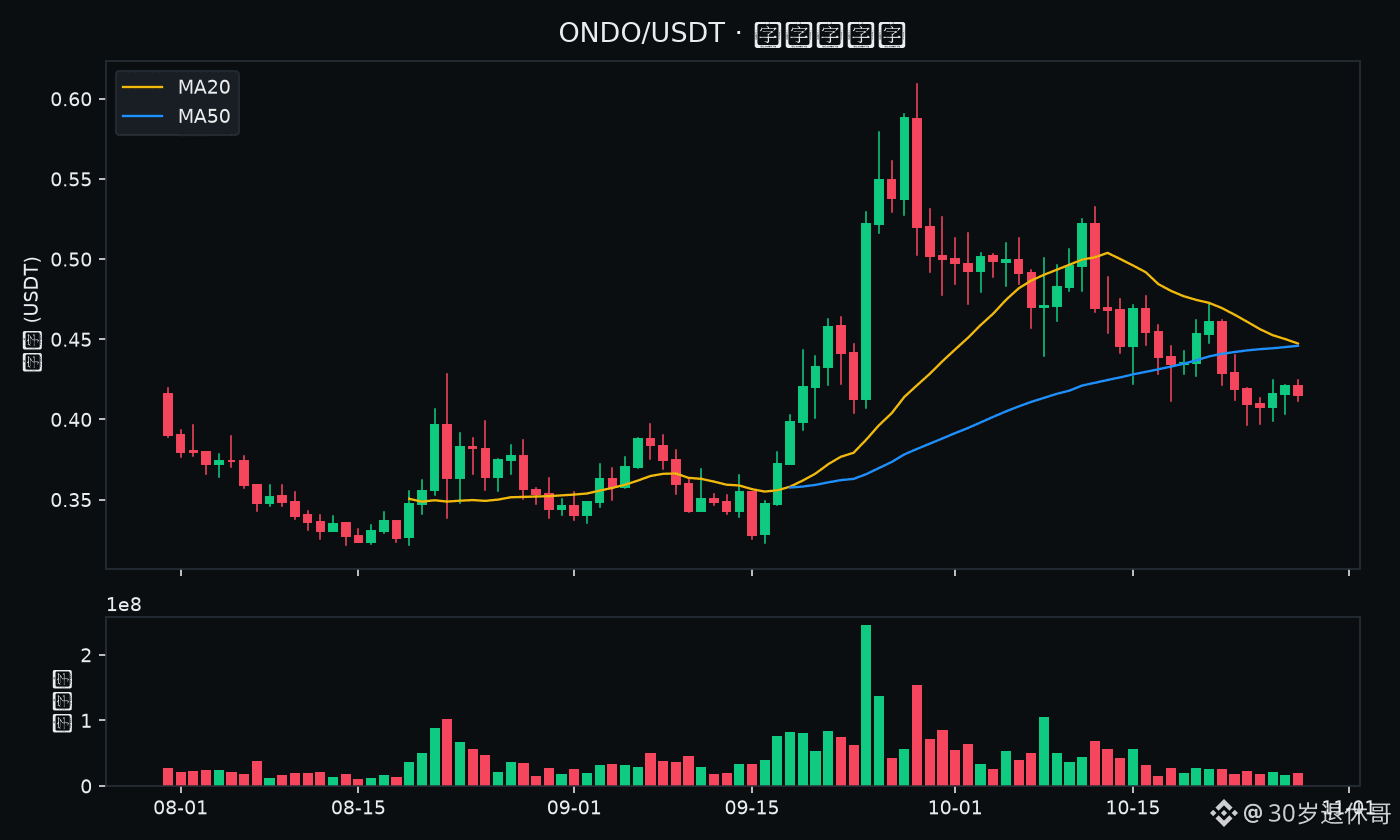
Market cap around #50, current price around 0.415400 USDT. MA20 ≈ 0.447345, MA50 ≈ 0.445946—when price is below the moving averages, post-meeting rebounds are often opportunities to sell. Let me put it bluntly: rates on hold + elevated inflation is no license to blindly buy the dip. The words “catching a falling knife” are written all over this.
2. Key levels—this is where the decision gets made
Key levels are set: resistance ≈ 0.532500, support ≈ 0.396600. If price can't break resistance and then crashes through support on heavy volume, the bearish script is set. Until price gets back above the moving averages, don't let bullish slogans turn you into exit liquidity.
3. Volume—is the money flow telling the truth?
Volume has shrunk to 0.6 times its 20-day average—big moves are often brewing in the quiet!
【Directional verdict | FOMC Night】$ONDO → 【SHORT】!
Watchlist framework: look for bearish pressure on a rebound to resistance; a high-volume break below support signals acceleration. If you're still “holding and doing nothing,” ask yourself: is it conviction or inertia?
The statement is out, the charts have laid it all bare—$ONDO is calling 【SHORT】now. Don't pretend you can't see it!
⚠️ The above is solely personal commentary on publicly available market data and sentiment, and does not constitute investment advice. Crypto is extremely volatile; do your own research, manage risk strictly, and bear responsibility for your own gains and losses.
$ONDO #做空 #FOMC #TechnicalAnalysis
⬇️ Fed holds steady, inflation still running hot—$ONDO is talking 【SHORT】now
The Fed has just 【left interest rates unchanged】! The federal funds rate range remains at 3.75%–4.00%, with a 10–2 vote. Dissenting votes: Cook and Hammack favored a 25 bp hike. Inflation remains elevated; economic expansion is stronger than expected; markets are pricing in a higher probability of a December hike. In the hours after the statement, market moves will only get more brutal—don't pretend you can't see it!
$ONDO (Ondo) | FOMC Night · Daily Chart Firepower Breakdown
1. Trend—don't pretend you can't see it
Market cap around #50, current price around 0.415400 USDT. MA20 ≈ 0.447345, MA50 ≈ 0.445946—when price is below the moving averages, post-meeting rebounds are often opportunities to sell. Let me put it bluntly: rates on hold + elevated inflation is no license to blindly buy the dip. The words “catching a falling knife” are written all over this.
2. Key levels—this is where the decision gets made
Key levels are set: resistance ≈ 0.532500, support ≈ 0.396600. If price can't break resistance and then crashes through support on heavy volume, the bearish script is set. Until price gets back above the moving averages, don't let bullish slogans turn you into exit liquidity.
3. Volume—is the money flow telling the truth?
Volume has shrunk to 0.6 times its 20-day average—big moves are often brewing in the quiet!
【Directional verdict | FOMC Night】$ONDO → 【SHORT】!
Watchlist framework: look for bearish pressure on a rebound to resistance; a high-volume break below support signals acceleration. If you're still “holding and doing nothing,” ask yourself: is it conviction or inertia?
The statement is out, the charts have laid it all bare—$ONDO is calling 【SHORT】now. Don't pretend you can't see it!
⚠️ The above is solely personal commentary on publicly available market data and sentiment, and does not constitute investment advice. Crypto is extremely volatile; do your own research, manage risk strictly, and bear responsibility for your own gains and losses.
$ONDO #做空 #FOMC #TechnicalAnalysis
The Fed has just 【left interest rates unchanged】! The federal funds rate range remains at 3.75%–4.00%, with a 10–2 vote. Dissenting votes: Cook and Hammack favored a 25 bp hike. Inflation remains elevated; economic expansion is stronger than expected; markets are pricing in a higher probability of a December hike. In the hours after the statement, market moves will only get more brutal—don't pretend you can't see it!
$ONDO (Ondo) | FOMC Night · Daily Chart Firepower Breakdown
1. Trend—don't pretend you can't see it
Market cap around #50, current price around 0.415400 USDT. MA20 ≈ 0.447345, MA50 ≈ 0.445946—when price is below the moving averages, post-meeting rebounds are often opportunities to sell. Let me put it bluntly: rates on hold + elevated inflation is no license to blindly buy the dip. The words “catching a falling knife” are written all over this.
2. Key levels—this is where the decision gets made
Key levels are set: resistance ≈ 0.532500, support ≈ 0.396600. If price can't break resistance and then crashes through support on heavy volume, the bearish script is set. Until price gets back above the moving averages, don't let bullish slogans turn you into exit liquidity.
3. Volume—is the money flow telling the truth?
Volume has shrunk to 0.6 times its 20-day average—big moves are often brewing in the quiet!
【Directional verdict | FOMC Night】$ONDO → 【SHORT】!
Watchlist framework: look for bearish pressure on a rebound to resistance; a high-volume break below support signals acceleration. If you're still “holding and doing nothing,” ask yourself: is it conviction or inertia?
The statement is out, the charts have laid it all bare—$ONDO is calling 【SHORT】now. Don't pretend you can't see it!
⚠️ The above is solely personal commentary on publicly available market data and sentiment, and does not constitute investment advice. Crypto is extremely volatile; do your own research, manage risk strictly, and bear responsibility for your own gains and losses.
$ONDO #做空 #FOMC #TechnicalAnalysis
1
326
·
--
【Daily Overview】$ONDO (Ondo)
Market cap rank: approximately #50. Current price: approximately 0.413500 USDT.
1. Trend
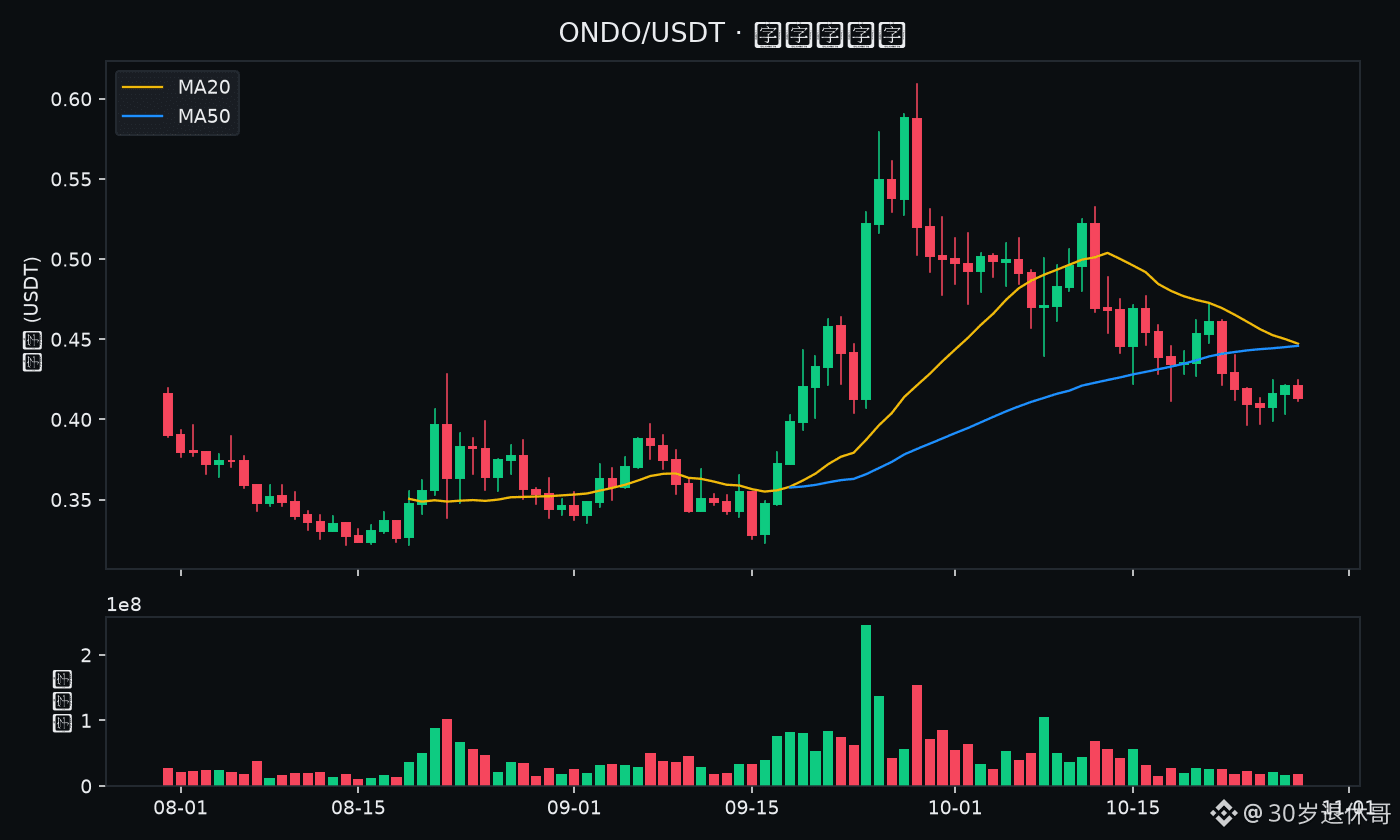
The price has fallen below MA20, indicating weaker short-term momentum. MA20 ≈ 0.447250; MA50 ≈ 0.445908. In terms of trading: first watch to see whether the price can move back above the moving averages.
2. Key Levels
近20日支撑参考 ≈ 0.396600;压力参考 ≈ 0.532500。跌破支撑或放量突破压力,再调整预期。
3. Volume
Today's trading volume is approximately 0.6 times the average of the past 20 days, indicating relatively quiet trading.
4. Risk Warning
Crypto assets are highly volatile. The above is only a technical observation based on publicly available market data and does not constitute investment advice. Please make your own judgments and manage your position size.
$BTC $ETH $ONDO #技术分析 #BinanceSquare
【Daily Overview】$ONDO (Ondo)
Market cap rank: approximately #50. Current price: approximately 0.413500 USDT.
1. Trend
The price has fallen below MA20, indicating weaker short-term momentum. MA20 ≈ 0.447250; MA50 ≈ 0.445908. In terms of trading: first watch to see whether the price can move back above the moving averages.
2. Key Levels
近20日支撑参考 ≈ 0.396600;压力参考 ≈ 0.532500。跌破支撑或放量突破压力,再调整预期。
3. Volume
Today's trading volume is approximately 0.6 times the average of the past 20 days, indicating relatively quiet trading.
4. Risk Warning
Crypto assets are highly volatile. The above is only a technical observation based on publicly available market data and does not constitute investment advice. Please make your own judgments and manage your position size.
$BTC $ETH $ONDO #技术分析 #BinanceSquare
Market cap rank: approximately #50. Current price: approximately 0.413500 USDT.
1. Trend
The price has fallen below MA20, indicating weaker short-term momentum. MA20 ≈ 0.447250; MA50 ≈ 0.445908. In terms of trading: first watch to see whether the price can move back above the moving averages.
2. Key Levels
近20日支撑参考 ≈ 0.396600;压力参考 ≈ 0.532500。跌破支撑或放量突破压力,再调整预期。
3. Volume
Today's trading volume is approximately 0.6 times the average of the past 20 days, indicating relatively quiet trading.
4. Risk Warning
Crypto assets are highly volatile. The above is only a technical observation based on publicly available market data and does not constitute investment advice. Please make your own judgments and manage your position size.
$BTC $ETH $ONDO #技术分析 #BinanceSquare
182

🚀 $BNB COMMUNITY RALLY TO CRACK TOP 20! 🟢
The $BNB crew is on a sprint—just one click can shift the leaderboard. With 1,300 votes locked in at rank #50 , the next 2‑3K votes are the final thrust to breach the Top 20 before the 24‑hour deadline. 📊 Every single vote is pure liquidity, a micro‑burst that fuels the collective momentum. 📈
Smart money loves a tight‑knit swarm; the tighter the coordination, the sharper the price swing when the community’s pulse hits the exchange floor. 🌊💡 Ready to lock in the push and watch $BNB ride the wave? 💬
⚠️ Not financial advice. Always manage your risk. 🛡️
🏷️ #BNB #CommunityPush #Vote #Crypto
🔥 💎
🚀 $BNB COMMUNITY RALLY TO CRACK TOP 20! 🟢
The $BNB crew is on a sprint—just one click can shift the leaderboard. With 1,300 votes locked in at rank #50 , the next 2‑3K votes are the final thrust to breach the Top 20 before the 24‑hour deadline. 📊 Every single vote is pure liquidity, a micro‑burst that fuels the collective momentum. 📈
Smart money loves a tight‑knit swarm; the tighter the coordination, the sharper the price swing when the community’s pulse hits the exchange floor. 🌊💡 Ready to lock in the push and watch $BNB ride the wave? 💬
⚠️ Not financial advice. Always manage your risk. 🛡️
🏷️ #BNB #CommunityPush #Vote #Crypto
🔥 💎
The $BNB crew is on a sprint—just one click can shift the leaderboard. With 1,300 votes locked in at rank #50 , the next 2‑3K votes are the final thrust to breach the Top 20 before the 24‑hour deadline. 📊 Every single vote is pure liquidity, a micro‑burst that fuels the collective momentum. 📈
Smart money loves a tight‑knit swarm; the tighter the coordination, the sharper the price swing when the community’s pulse hits the exchange floor. 🌊💡 Ready to lock in the push and watch $BNB ride the wave? 💬
⚠️ Not financial advice. Always manage your risk. 🛡️
🏷️ #BNB #CommunityPush #Vote #Crypto
🔥 💎
16

Article
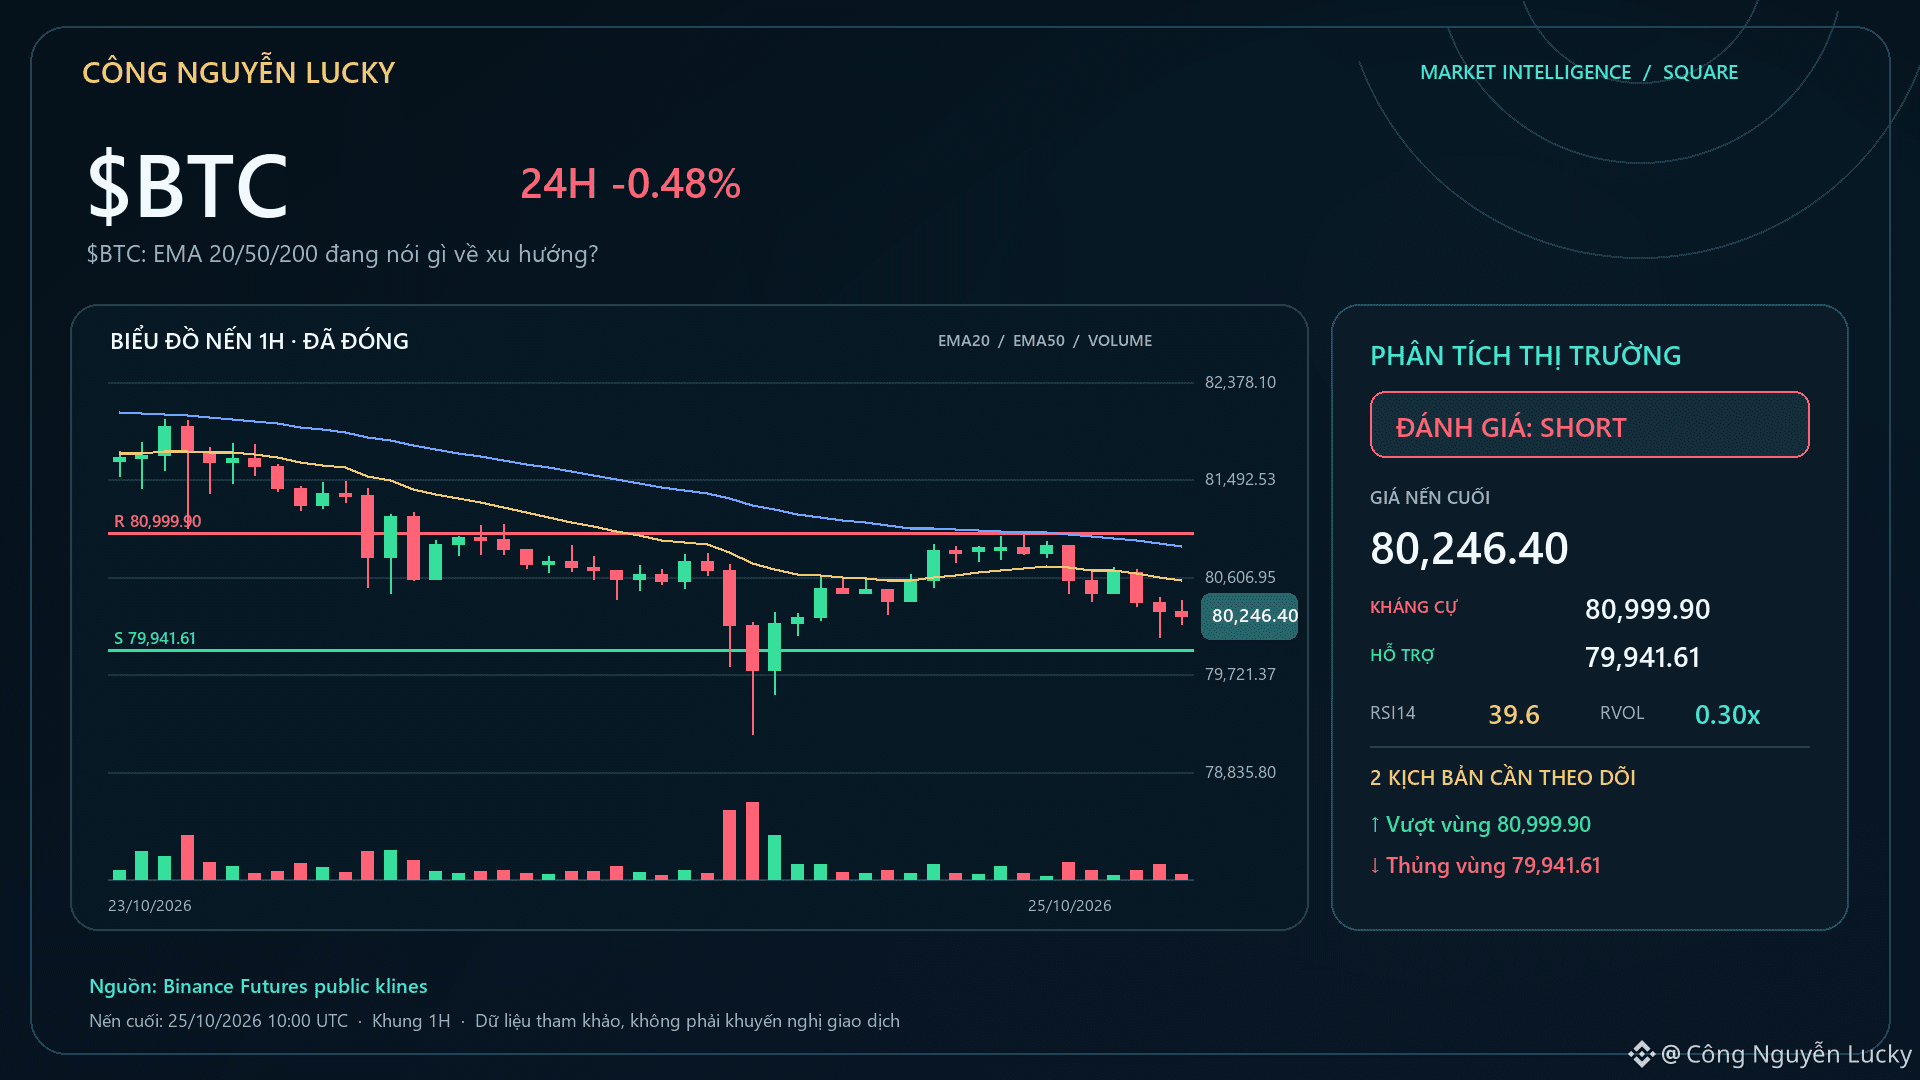
$BTC: What are the 20/50/200 EMAs saying about the trend?📈 $BTC: The EMA set is giving a clearer read than looking at a single candle. Market: 80,350.30 · 24h -0.25% · volume ~8,802.1M USDT · 2,269,220 trades.
EMA20 80,571.41 · EMA50 80,885.16 · EMA200 81,623.68.
Structure: EXPANDING_RANGE · RSI14 39.6 · MACD histogram -19.7984. Technical bias: SHORT 100/100. EMAs are only a trend filter; I’ll increase conviction only when structure + momentum + money flow all confirm.
Nearby support/resistance: 79,941.61 / 80,999.90. Technical levels are selected based on the regime:
$BTC: What are the 20/50/200 EMAs saying about the trend?
📈 $BTC : The EMA set is giving a clearer read than looking at a single candle. Market: 80,350.30 · 24h -0.25% · volume ~8,802.1M USDT · 2,269,220 trades.
EMA20 80,571.41 · EMA50 80,885.16 · EMA200 81,623.68.
Structure: EXPANDING_RANGE · RSI14 39.6 · MACD histogram -19.7984. Technical bias: SHORT 100/100. EMAs are only a trend filter; I’ll increase conviction only when structure + momentum + money flow all confirm.
Nearby support/resistance: 79,941.61 / 80,999.90. Technical levels are selected based on the regime:
EMA20 80,571.41 · EMA50 80,885.16 · EMA200 81,623.68.
Structure: EXPANDING_RANGE · RSI14 39.6 · MACD histogram -19.7984. Technical bias: SHORT 100/100. EMAs are only a trend filter; I’ll increase conviction only when structure + momentum + money flow all confirm.
Nearby support/resistance: 79,941.61 / 80,999.90. Technical levels are selected based on the regime:
1
276
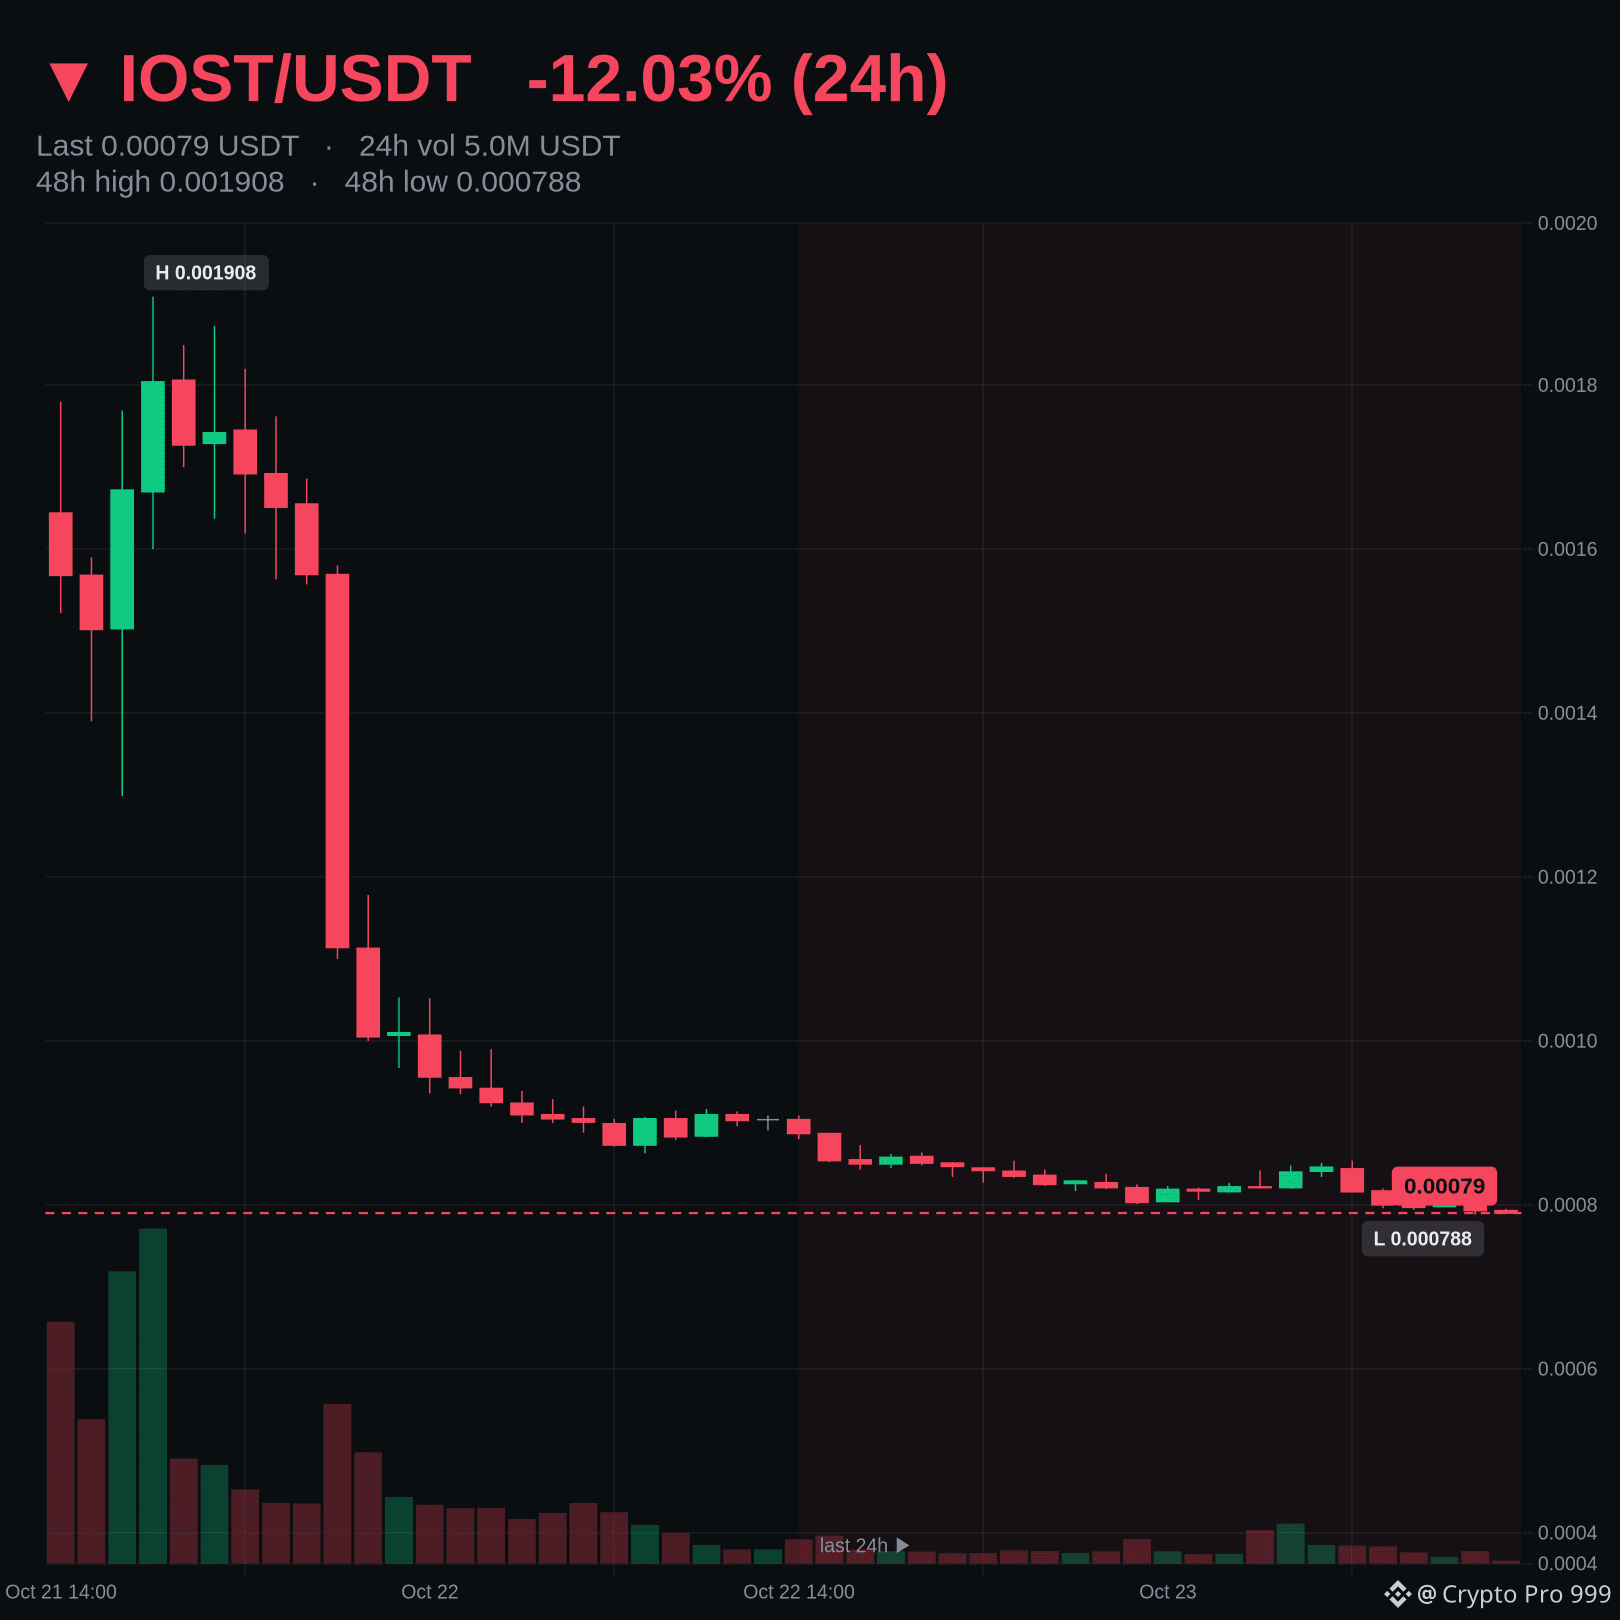
Sharp drop: $IOST -12.03% in 24h, last at 0.00079 USDT.
• 24h range: 0.000788 – 0.000909 USDT, trading near its 24h low
• 24h volume: 5,180,394 USDT (#50 of 50 liquid USDT pairs)
• Underperforming BTC (-0.11%)
Underperforming compared to Bitcoin movement.
Data: Binance spot, 2026-10-23 13:15 UTC. Educational content, not financial advice.
Sharp drop: $IOST -12.03% in 24h, last at 0.00079 USDT.
• 24h range: 0.000788 – 0.000909 USDT, trading near its 24h low
• 24h volume: 5,180,394 USDT (#50 of 50 liquid USDT pairs)
• Underperforming BTC (-0.11%)
Underperforming compared to Bitcoin movement.
Data: Binance spot, 2026-10-23 13:15 UTC. Educational content, not financial advice.
• 24h range: 0.000788 – 0.000909 USDT, trading near its 24h low
• 24h volume: 5,180,394 USDT (#50 of 50 liquid USDT pairs)
• Underperforming BTC (-0.11%)
Underperforming compared to Bitcoin movement.
Data: Binance spot, 2026-10-23 13:15 UTC. Educational content, not financial advice.
23

·
--
💗 PEPE MOONSHOT IS COMING! 💚
Current price: $0.00000420-$0.00000406
📈 +3.7% in 24 hours ⌚
Trading volume: $220M-$248M$💲
Market cap: $1.68 billion-$1.73 billion 💰
Rank: #50 globally 💎
Technical analysis:
Strong resistance: $0.000004083-
$0.000004117
In the last hour, at $0.000004070, below resistance
If it breaks above $0.000004083 = an upward explosion 🚀
Support:
First support: $0.000004057
Strong support: $0.00000394 — if it stays above this,
target: $0.00000449
PEPE#PepeCoin#MemeCoin
💗 PEPE MOONSHOT IS COMING! 💚
Current price: $0.00000420-$0.00000406
📈 +3.7% in 24 hours ⌚
Trading volume: $220M-$248M$💲
Market cap: $1.68 billion-$1.73 billion 💰
Rank: #50 globally 💎
Technical analysis:
Strong resistance: $0.000004083-
$0.000004117
In the last hour, at $0.000004070, below resistance
If it breaks above $0.000004083 = an upward explosion 🚀
Support:
First support: $0.000004057
Strong support: $0.00000394 — if it stays above this,
target: $0.00000449
PEPE#PepeCoin#MemeCoin
Current price: $0.00000420-$0.00000406
📈 +3.7% in 24 hours ⌚
Trading volume: $220M-$248M$💲
Market cap: $1.68 billion-$1.73 billion 💰
Rank: #50 globally 💎
Technical analysis:
Strong resistance: $0.000004083-
$0.000004117
In the last hour, at $0.000004070, below resistance
If it breaks above $0.000004083 = an upward explosion 🚀
Support:
First support: $0.000004057
Strong support: $0.00000394 — if it stays above this,
target: $0.00000449
PEPE#PepeCoin#MemeCoin

4
589

·
--
$MORPHO ’s 24-hour +14.20% “return” becomes invalid within 30 days: 30 days is only +12.80%, while 7 days is +32.79%. With 7 days overtaking 30 days, it means most of this month has been in decline. On September 16, it briefly came back to $2.08; the upside has only been repaired back within the last week.
The volume disparity is even more concrete. In mid-September, daily volume was only around $13M. Yesterday it returned to $66.5M—more than four times. Only after that liquidity came back did the price move from $2.08 to $2.87, pushing the market cap above $2.01B and bringing it up to #50. This is a rapid “re-pricing” repair, not a slow grind-up.
What needs to be confirmed is this: relative to the ATH of $4.17, it’s still down -31%. The real resistance is the de-risking/exit sell wall sitting above $3—not the bullish candle in front of you.
From a short-term perspective, $2.51 was yesterday’s low; if it breaks, treat it as a sentiment pulse. From a swing-trade perspective, whether $2.92 can stand above it with volume—and whether a daily trading value on the order of $60M can hold for three days—will determine whether that 32% move over 7 days was a “thin-liquidity” puff, or a genuine change in hands.
Are you holding for a short-term move or a swing trade? The answer is different, and the levels you should watch are completely different.
$MORPHO ’s 24-hour +14.20% “return” becomes invalid within 30 days: 30 days is only +12.80%, while 7 days is +32.79%. With 7 days overtaking 30 days, it means most of this month has been in decline. On September 16, it briefly came back to $2.08; the upside has only been repaired back within the last week.
The volume disparity is even more concrete. In mid-September, daily volume was only around $13M. Yesterday it returned to $66.5M—more than four times. Only after that liquidity came back did the price move from $2.08 to $2.87, pushing the market cap above $2.01B and bringing it up to #50. This is a rapid “re-pricing” repair, not a slow grind-up.
What needs to be confirmed is this: relative to the ATH of $4.17, it’s still down -31%. The real resistance is the de-risking/exit sell wall sitting above $3—not the bullish candle in front of you.
From a short-term perspective, $2.51 was yesterday’s low; if it breaks, treat it as a sentiment pulse. From a swing-trade perspective, whether $2.92 can stand above it with volume—and whether a daily trading value on the order of $60M can hold for three days—will determine whether that 32% move over 7 days was a “thin-liquidity” puff, or a genuine change in hands.
Are you holding for a short-term move or a swing trade? The answer is different, and the levels you should watch are completely different.
The volume disparity is even more concrete. In mid-September, daily volume was only around $13M. Yesterday it returned to $66.5M—more than four times. Only after that liquidity came back did the price move from $2.08 to $2.87, pushing the market cap above $2.01B and bringing it up to #50. This is a rapid “re-pricing” repair, not a slow grind-up.
What needs to be confirmed is this: relative to the ATH of $4.17, it’s still down -31%. The real resistance is the de-risking/exit sell wall sitting above $3—not the bullish candle in front of you.
From a short-term perspective, $2.51 was yesterday’s low; if it breaks, treat it as a sentiment pulse. From a swing-trade perspective, whether $2.92 can stand above it with volume—and whether a daily trading value on the order of $60M can hold for three days—will determine whether that 32% move over 7 days was a “thin-liquidity” puff, or a genuine change in hands.
Are you holding for a short-term move or a swing trade? The answer is different, and the levels you should watch are completely different.
79

·
--
$AAVE Today, I’ll make a quick basic-fundamentals note—no calls to buy or sell.
Aave’s current pricing looks more like the market is re-evaluating the strength of the narrative than simply reacting to candlestick colors.
Current price: $100
Market cap: $1.54B
Rank: #50
FDV: $0.0000
7D / 30D: +5.3% / +14.7%
What I care about most is the supply structure:
Circulating supply is about 96.4%, so any future unlocks/supply pressure must be factored into the valuation.
Daily trend: Bullish 📈
RSI: 58.1
Support: $87
Resistance: $103
My read: If $AAVE can reclaim resistance, the market may start assigning it a narrative premium; if it breaks support, that would suggest the capital still isn’t willing to buy this story. NFA.
Do you think $AAVE is undervalued, or just another rebound trap?
$AAVE Today, I’ll make a quick basic-fundamentals note—no calls to buy or sell.
Aave’s current pricing looks more like the market is re-evaluating the strength of the narrative than simply reacting to candlestick colors.
Current price: $100
Market cap: $1.54B
Rank: #50
FDV: $0.0000
7D / 30D: +5.3% / +14.7%
What I care about most is the supply structure:
Circulating supply is about 96.4%, so any future unlocks/supply pressure must be factored into the valuation.
Daily trend: Bullish 📈
RSI: 58.1
Support: $87
Resistance: $103
My read: If $AAVE can reclaim resistance, the market may start assigning it a narrative premium; if it breaks support, that would suggest the capital still isn’t willing to buy this story. NFA.
Do you think $AAVE is undervalued, or just another rebound trap?
Aave’s current pricing looks more like the market is re-evaluating the strength of the narrative than simply reacting to candlestick colors.
Current price: $100
Market cap: $1.54B
Rank: #50
FDV: $0.0000
7D / 30D: +5.3% / +14.7%
What I care about most is the supply structure:
Circulating supply is about 96.4%, so any future unlocks/supply pressure must be factored into the valuation.
Daily trend: Bullish 📈
RSI: 58.1
Support: $87
Resistance: $103
My read: If $AAVE can reclaim resistance, the market may start assigning it a narrative premium; if it breaks support, that would suggest the capital still isn’t willing to buy this story. NFA.
Do you think $AAVE is undervalued, or just another rebound trap?
159
·
--
$AAVE The current situation feels like a person slowly climbing within the 80 to 100 range, calmly standing at $98. The 24h gain of 0.56% isn’t much, but the 7-day rise of 1.6% and the 30-day increase of 6.7% look more like capital carefully probing the depth of buy orders, rather than a single big “pump.”
The key isn’t whether $100 can be broken; it’s the process on Tuesday when it fell from $101.69 to $98—throughout that move, trading volume stayed in the $250M to $290M range. Volume didn’t ebb away, but the price started to flatten. That suggests some are collecting near $100, while others are preparing to take profits in that zone. Down 85% from ATH and still ranked #50 by market cap, the market has assigned it a valuation premium as a “veteran DeFi blue chip,” but it hasn’t provided a “strong buy” signal.
What really needs confirmation isn’t that it rose 6% this month, but whether there’s willingness from the capital to push it through $100 and hold above it. If trading volume continues to contract, this kind of consolidation could turn into a warning sign of a failed buildup.
For me, the most worth-asking question right now is: at the $98 level, is AAVE actually building up to move in a certain direction, or is liquidity quietly draining? People with different technical interpretations may give completely opposite answers.
$AAVE The current situation feels like a person slowly climbing within the 80 to 100 range, calmly standing at $98. The 24h gain of 0.56% isn’t much, but the 7-day rise of 1.6% and the 30-day increase of 6.7% look more like capital carefully probing the depth of buy orders, rather than a single big “pump.”
The key isn’t whether $100 can be broken; it’s the process on Tuesday when it fell from $101.69 to $98—throughout that move, trading volume stayed in the $250M to $290M range. Volume didn’t ebb away, but the price started to flatten. That suggests some are collecting near $100, while others are preparing to take profits in that zone. Down 85% from ATH and still ranked #50 by market cap, the market has assigned it a valuation premium as a “veteran DeFi blue chip,” but it hasn’t provided a “strong buy” signal.
What really needs confirmation isn’t that it rose 6% this month, but whether there’s willingness from the capital to push it through $100 and hold above it. If trading volume continues to contract, this kind of consolidation could turn into a warning sign of a failed buildup.
For me, the most worth-asking question right now is: at the $98 level, is AAVE actually building up to move in a certain direction, or is liquidity quietly draining? People with different technical interpretations may give completely opposite answers.
The key isn’t whether $100 can be broken; it’s the process on Tuesday when it fell from $101.69 to $98—throughout that move, trading volume stayed in the $250M to $290M range. Volume didn’t ebb away, but the price started to flatten. That suggests some are collecting near $100, while others are preparing to take profits in that zone. Down 85% from ATH and still ranked #50 by market cap, the market has assigned it a valuation premium as a “veteran DeFi blue chip,” but it hasn’t provided a “strong buy” signal.
What really needs confirmation isn’t that it rose 6% this month, but whether there’s willingness from the capital to push it through $100 and hold above it. If trading volume continues to contract, this kind of consolidation could turn into a warning sign of a failed buildup.
For me, the most worth-asking question right now is: at the $98 level, is AAVE actually building up to move in a certain direction, or is liquidity quietly draining? People with different technical interpretations may give completely opposite answers.
54

·
--
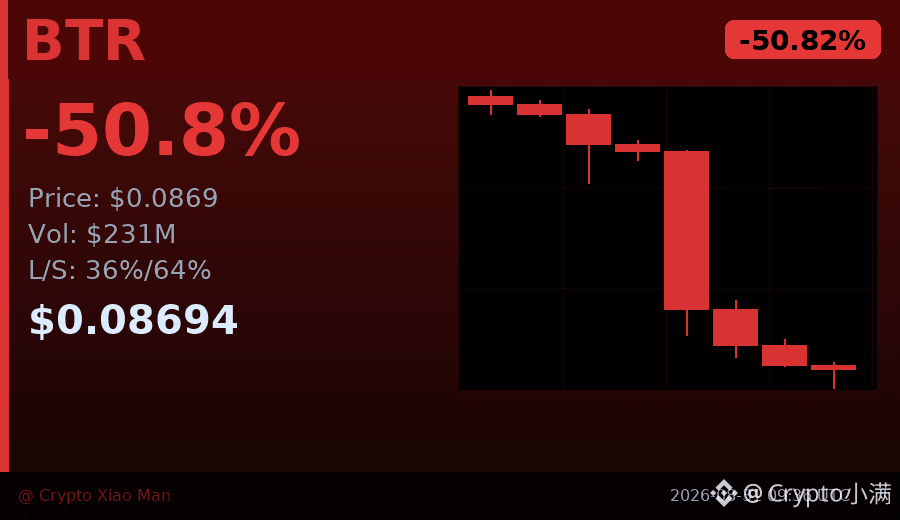
To be honest, $BTR —I had to look at today’s drop twice before I confirmed it. Within 24 hours, it was basically slashed in half: from the highest $0.183 down to the current $0.087, a drop of over 50%.
This volume spike is extremely abnormal. Look at the data: when the price was around $0.15, the trading volume on a single candlestick suddenly surged to 400 million USDT—several times higher than the previous average. This kind of "high-volume crash" usually indicates that large holders are dumping in a concentrated manner, not that retail traders are selling slowly over time.
Then check the long/short ratio: now 64% of people are betting on the drop, while only 36% are betting on the rise. This figure itself is a signal—when most participants in the market start shorting, you need to be careful about a "short squeeze trap" (i.e., the price suddenly rebounds and the people who had been shorting are forced to close at a loss). That process can temporarily push the price higher.
But based on the current chart, the candlesticks are still closing in the negative consecutively, and selling pressure hasn’t clearly weakened. If, going forward, you see trading volume noticeably contracting around $0.08, then that would be a sign that the downtrend might be slowing.
I’ll focus especially on whether the $0.082 low holds. If it breaks, this wave of panic may not be over yet.
$BTR #腰斩暴跌 #50% drop
Click the small card below to quickly check the market👇
To be honest, $BTR —I had to look at today’s drop twice before I confirmed it. Within 24 hours, it was basically slashed in half: from the highest $0.183 down to the current $0.087, a drop of over 50%.
This volume spike is extremely abnormal. Look at the data: when the price was around $0.15, the trading volume on a single candlestick suddenly surged to 400 million USDT—several times higher than the previous average. This kind of "high-volume crash" usually indicates that large holders are dumping in a concentrated manner, not that retail traders are selling slowly over time.
Then check the long/short ratio: now 64% of people are betting on the drop, while only 36% are betting on the rise. This figure itself is a signal—when most participants in the market start shorting, you need to be careful about a "short squeeze trap" (i.e., the price suddenly rebounds and the people who had been shorting are forced to close at a loss). That process can temporarily push the price higher.
But based on the current chart, the candlesticks are still closing in the negative consecutively, and selling pressure hasn’t clearly weakened. If, going forward, you see trading volume noticeably contracting around $0.08, then that would be a sign that the downtrend might be slowing.
I’ll focus especially on whether the $0.082 low holds. If it breaks, this wave of panic may not be over yet.
$BTR #腰斩暴跌 #50% drop
Click the small card below to quickly check the market👇
This volume spike is extremely abnormal. Look at the data: when the price was around $0.15, the trading volume on a single candlestick suddenly surged to 400 million USDT—several times higher than the previous average. This kind of "high-volume crash" usually indicates that large holders are dumping in a concentrated manner, not that retail traders are selling slowly over time.
Then check the long/short ratio: now 64% of people are betting on the drop, while only 36% are betting on the rise. This figure itself is a signal—when most participants in the market start shorting, you need to be careful about a "short squeeze trap" (i.e., the price suddenly rebounds and the people who had been shorting are forced to close at a loss). That process can temporarily push the price higher.
But based on the current chart, the candlesticks are still closing in the negative consecutively, and selling pressure hasn’t clearly weakened. If, going forward, you see trading volume noticeably contracting around $0.08, then that would be a sign that the downtrend might be slowing.
I’ll focus especially on whether the $0.082 low holds. If it breaks, this wave of panic may not be over yet.
$BTR #腰斩暴跌 #50% drop
Click the small card below to quickly check the market👇
105

$ONDO is down in 24 hours - and its funding rate is negative for the first time this month.
That’s the kind of number that makes you stop and ask: what’s going on?
The token has been quietly slipping, and the market doesn’t seem to be picking it up.
Look at the 7-day and 30-day performance: up 30 days but down 7 - the momentum is fading.
And the funding rate? It’s now negative, which usually means traders are closing long positions or opening short ones.
That’s not a sign of strength - it’s a sign of caution.
What’s interesting is that this comes as tokenized securities are making waves elsewhere.
DTCC is now moving tokenized securities into live trading, marking a milestone for Wall Street's blockchain push.
Cantor is also working on blockchain-based IPOs - a big deal.
Wall Street is finally taking blockchain seriously.
But for ONDO, the story is different.
It’s not just not catching the wave - it’s getting left behind.
Could this be the beginning of a new era for traditional institutions embracing blockchain?
Maybe. But for now, ONDO is showing signs of struggle - not leadership.
Risk Reminder: Funding hasn’t cooled yet. Leveraged positions take note - the market is shifting, and it’s not clear where it’s headed.
—
For educational purposes only. Not financial advice.
📌 Crypto 101 · #50 · #CryptoEducation #CryptoSighted $ONDO
$ONDO is down in 24 hours - and its funding rate is negative for the first time this month.
That’s the kind of number that makes you stop and ask: what’s going on?
The token has been quietly slipping, and the market doesn’t seem to be picking it up.
Look at the 7-day and 30-day performance: up 30 days but down 7 - the momentum is fading.
And the funding rate? It’s now negative, which usually means traders are closing long positions or opening short ones.
That’s not a sign of strength - it’s a sign of caution.
What’s interesting is that this comes as tokenized securities are making waves elsewhere.
DTCC is now moving tokenized securities into live trading, marking a milestone for Wall Street's blockchain push.
Cantor is also working on blockchain-based IPOs - a big deal.
Wall Street is finally taking blockchain seriously.
But for ONDO, the story is different.
It’s not just not catching the wave - it’s getting left behind.
Could this be the beginning of a new era for traditional institutions embracing blockchain?
Maybe. But for now, ONDO is showing signs of struggle - not leadership.
Risk Reminder: Funding hasn’t cooled yet. Leveraged positions take note - the market is shifting, and it’s not clear where it’s headed.
—
For educational purposes only. Not financial advice.
📌 Crypto 101 · #50 · #CryptoEducation #CryptoSighted $ONDO
That’s the kind of number that makes you stop and ask: what’s going on?
The token has been quietly slipping, and the market doesn’t seem to be picking it up.
Look at the 7-day and 30-day performance: up 30 days but down 7 - the momentum is fading.
And the funding rate? It’s now negative, which usually means traders are closing long positions or opening short ones.
That’s not a sign of strength - it’s a sign of caution.
What’s interesting is that this comes as tokenized securities are making waves elsewhere.
DTCC is now moving tokenized securities into live trading, marking a milestone for Wall Street's blockchain push.
Cantor is also working on blockchain-based IPOs - a big deal.
Wall Street is finally taking blockchain seriously.
But for ONDO, the story is different.
It’s not just not catching the wave - it’s getting left behind.
Could this be the beginning of a new era for traditional institutions embracing blockchain?
Maybe. But for now, ONDO is showing signs of struggle - not leadership.
Risk Reminder: Funding hasn’t cooled yet. Leveraged positions take note - the market is shifting, and it’s not clear where it’s headed.
—
For educational purposes only. Not financial advice.
📌 Crypto 101 · #50 · #CryptoEducation #CryptoSighted $ONDO
388
$ZEC · TREND UP: real breakout or just a 24h fluctuation?🧠 Smart Money rhythm at $ZEC: 5 wallets/trader smart · BUY. Market: 1,352.75 · 24h +11.28% · volume ~4,482.1M USDT · 13,019,525 transactions.
Observed Smart Money net flow: ~-0.00M USD.
Maximum signal increase: +0.3% · exit rate 81.0%. Smart Money data is evidence for verification, not a copy-trading order.
Confirmation price if: Exceeding 1,396.00 with an expanded volume will make the continuation scenario more credible.
$ZEC · TREND UP: real breakout or just a 24h fluctuation?
🧠 Smart Money rhythm at $ZEC : 5 wallets/trader smart · BUY. Market: 1,352.75 · 24h +11.28% · volume ~4,482.1M USDT · 13,019,525 transactions.
Observed Smart Money net flow: ~-0.00M USD.
Maximum signal increase: +0.3% · exit rate 81.0%. Smart Money data is evidence for verification, not a copy-trading order.
Confirmation price if: Exceeding 1,396.00 with an expanded volume will make the continuation scenario more credible.
Observed Smart Money net flow: ~-0.00M USD.
Maximum signal increase: +0.3% · exit rate 81.0%. Smart Money data is evidence for verification, not a copy-trading order.
Confirmation price if: Exceeding 1,396.00 with an expanded volume will make the continuation scenario more credible.
261
Log in to explore more content
Join global crypto users on Binance Square
⚡️ Get latest and useful information about crypto.
💬 Trusted by the world’s largest crypto exchange.
👍 Discover real insights from verified creators.
Email / Phone number
Trending Topics
1
#CanBTCReboundAfterFallingBelow60K?
138,954 views
574 Discussing
2
#GlobalStocksFaceLongestLosingStreakSince2023
58,584 views
543 Discussing
3
#AnthropicPlungesTowardIPOPriceonDay2
20,918 views
228 Discussing
4
#BNBDropsBelow540USDTWith8.46%DailyDecline
342 views
13 Discussing
5
#MorganStanleyEndsAnthropicStockSupportAfterOneDay
312 views
8 Discussing
6
#CryptoBilisAttackerMoves25000ETHToTornadoCash
306 views
11 Discussing
7
#GaoTengBitcoinETFListsOnHKEX
39,132 views
397 Discussing
8
#TradFiForBeginners
1M views
5,849 Discussing
9
#NvidiaBoardReportedlySplitOverHuang’sReturn
409,751 views
2,587 Discussing
10
#TetherBurns8BillionUSDTInPast20Days
49,341 views
167 Discussing