
#33
33
30,159 views
160 Discussing
Hot
Latest

·
--
Bullish
@MANTRA_Chain $MANTRA
@katievorhan
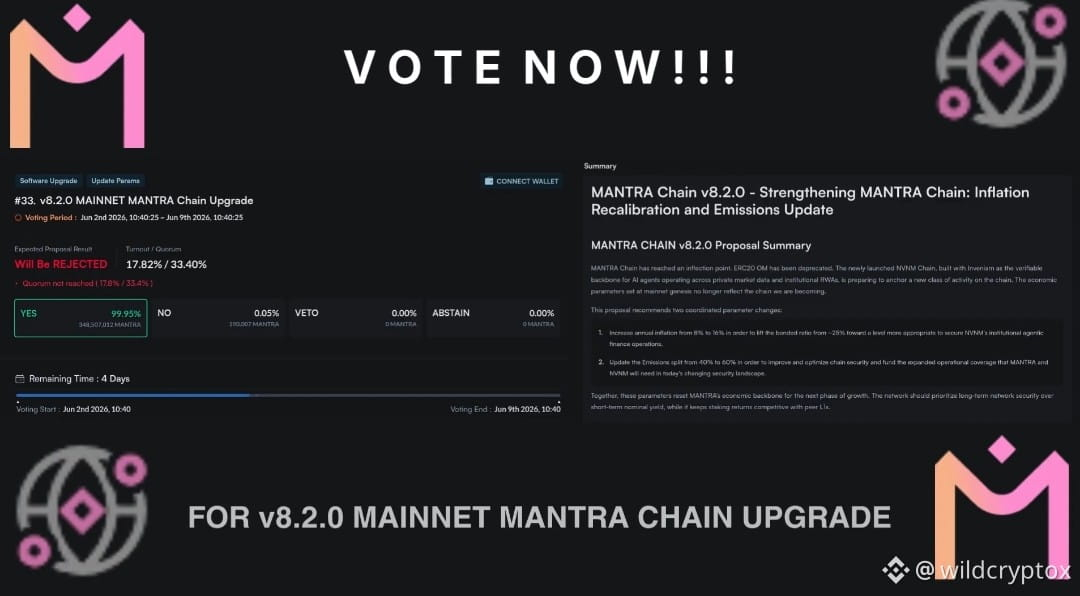
🚨 Kind Reminder: VOTE on the latest
@MANTRA_Chain 's Governance
Proposal #33 ‼️ >1 DAY LEFT ‼️
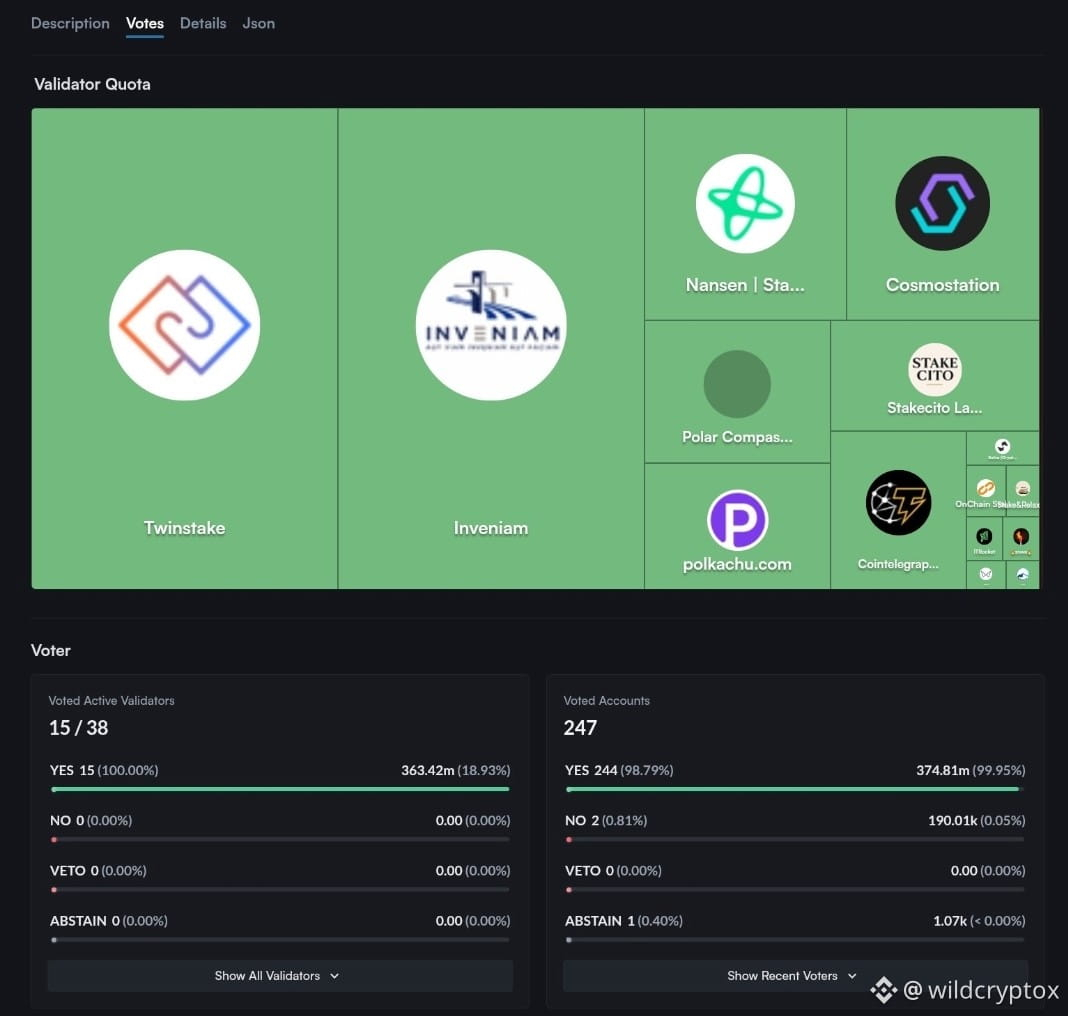
Current Stats 👇
🔹 15 out of 38 Active Validators voted "YES"
🔹 244 Individual Accounts Voted "YES"
🗳️ How to Vote on the @MANTRA_Chain 's Governance Proposal #33 in 5 Simple Steps 👇
1. Visit http://mintscan.io/mantra/proposals/33 or http://explorer.mantrachain.io/MANTRA/gov/33
2. Connect your @keplrwallet
& Select Active Proposal #33
3. Review Proposal Details
4. Click Vote and Select ''YES''
5. Sign the Approval Transaction with your connected wallet
Congratulations, you've successfully cast your vote.
$MANTRA 🕉 #DEFi #RWAs
@MANTRA $MANTRA
@Katie V Holmes
🚨 Kind Reminder: VOTE on the latest
@MANTRA 's Governance
Proposal #33 ‼️ >1 DAY LEFT ‼️
Current Stats 👇
🔹 15 out of 38 Active Validators voted "YES"
🔹 244 Individual Accounts Voted "YES"
🗳️ How to Vote on the @MANTRA 's Governance Proposal #33 in 5 Simple Steps 👇
1. Visit http://mintscan.io/mantra/proposals/33 or http://explorer.mantrachain.io/MANTRA/gov/33
2. Connect your @keplrwallet
& Select Active Proposal #33
3. Review Proposal Details
4. Click Vote and Select ''YES''
5. Sign the Approval Transaction with your connected wallet
Congratulations, you've successfully cast your vote.
$MANTRA 🕉 #DEFi #RWAs
@Katie V Holmes
🚨 Kind Reminder: VOTE on the latest
@MANTRA 's Governance
Proposal #33 ‼️ >1 DAY LEFT ‼️
Current Stats 👇
🔹 15 out of 38 Active Validators voted "YES"
🔹 244 Individual Accounts Voted "YES"
🗳️ How to Vote on the @MANTRA 's Governance Proposal #33 in 5 Simple Steps 👇
1. Visit http://mintscan.io/mantra/proposals/33 or http://explorer.mantrachain.io/MANTRA/gov/33
2. Connect your @keplrwallet
& Select Active Proposal #33
3. Review Proposal Details
4. Click Vote and Select ''YES''
5. Sign the Approval Transaction with your connected wallet
Congratulations, you've successfully cast your vote.
$MANTRA 🕉 #DEFi #RWAs
3
1
284

·
--
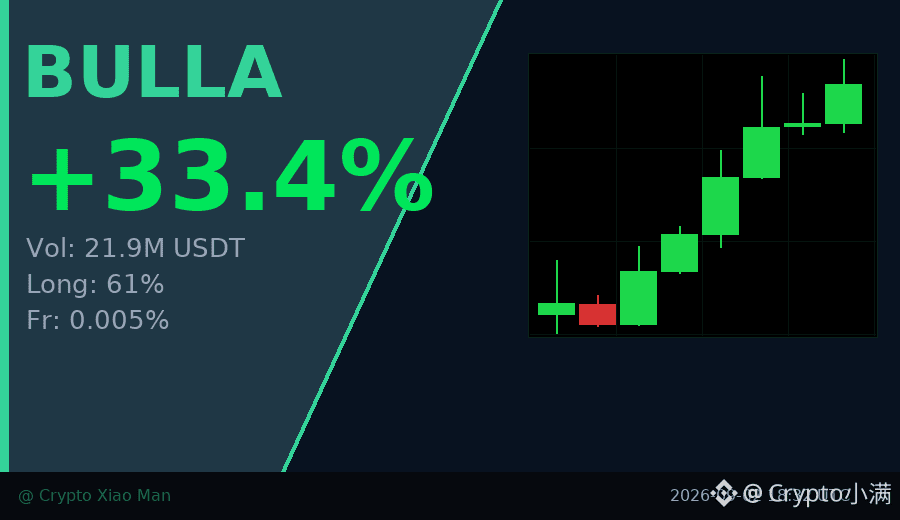
33% single-day rise, trading volume hits 21.90 million USDT — BULLA is acting a bit interesting today.
On the hourly chart, candles have been closing green in a row. The price has been pushed up from 0.017 to 0.0234, and the buy-side pressure is clearly accelerating.
However, the bulls already account for 61%, and the positions aren’t light. People chasing the price are starting to increase.
The funding rate is still only 0.005%, which suggests leverage hasn’t gone crazy yet—this is relatively healthy.
For a stock with a rise in both volume and price, the key is whether it can hold the 0.022 level next.
If it holds, the trend remains intact. If it doesn’t, short-term profit-takers may start to exit.
$BULLA #强势币 #33%涨幅
Click the small card below to quickly check the market 👇
33% single-day rise, trading volume hits 21.90 million USDT — BULLA is acting a bit interesting today.
On the hourly chart, candles have been closing green in a row. The price has been pushed up from 0.017 to 0.0234, and the buy-side pressure is clearly accelerating.
However, the bulls already account for 61%, and the positions aren’t light. People chasing the price are starting to increase.
The funding rate is still only 0.005%, which suggests leverage hasn’t gone crazy yet—this is relatively healthy.
For a stock with a rise in both volume and price, the key is whether it can hold the 0.022 level next.
If it holds, the trend remains intact. If it doesn’t, short-term profit-takers may start to exit.
$BULLA #强势币 #33%涨幅
Click the small card below to quickly check the market 👇
On the hourly chart, candles have been closing green in a row. The price has been pushed up from 0.017 to 0.0234, and the buy-side pressure is clearly accelerating.
However, the bulls already account for 61%, and the positions aren’t light. People chasing the price are starting to increase.
The funding rate is still only 0.005%, which suggests leverage hasn’t gone crazy yet—this is relatively healthy.
For a stock with a rise in both volume and price, the key is whether it can hold the 0.022 level next.
If it holds, the trend remains intact. If it doesn’t, short-term profit-takers may start to exit.
$BULLA #强势币 #33%涨幅
Click the small card below to quickly check the market 👇
81

·
--
Morning market update: Prices barely moved overnight, the 200-day moving average is still holding, and the unrealized profit on the short positions edged up again.
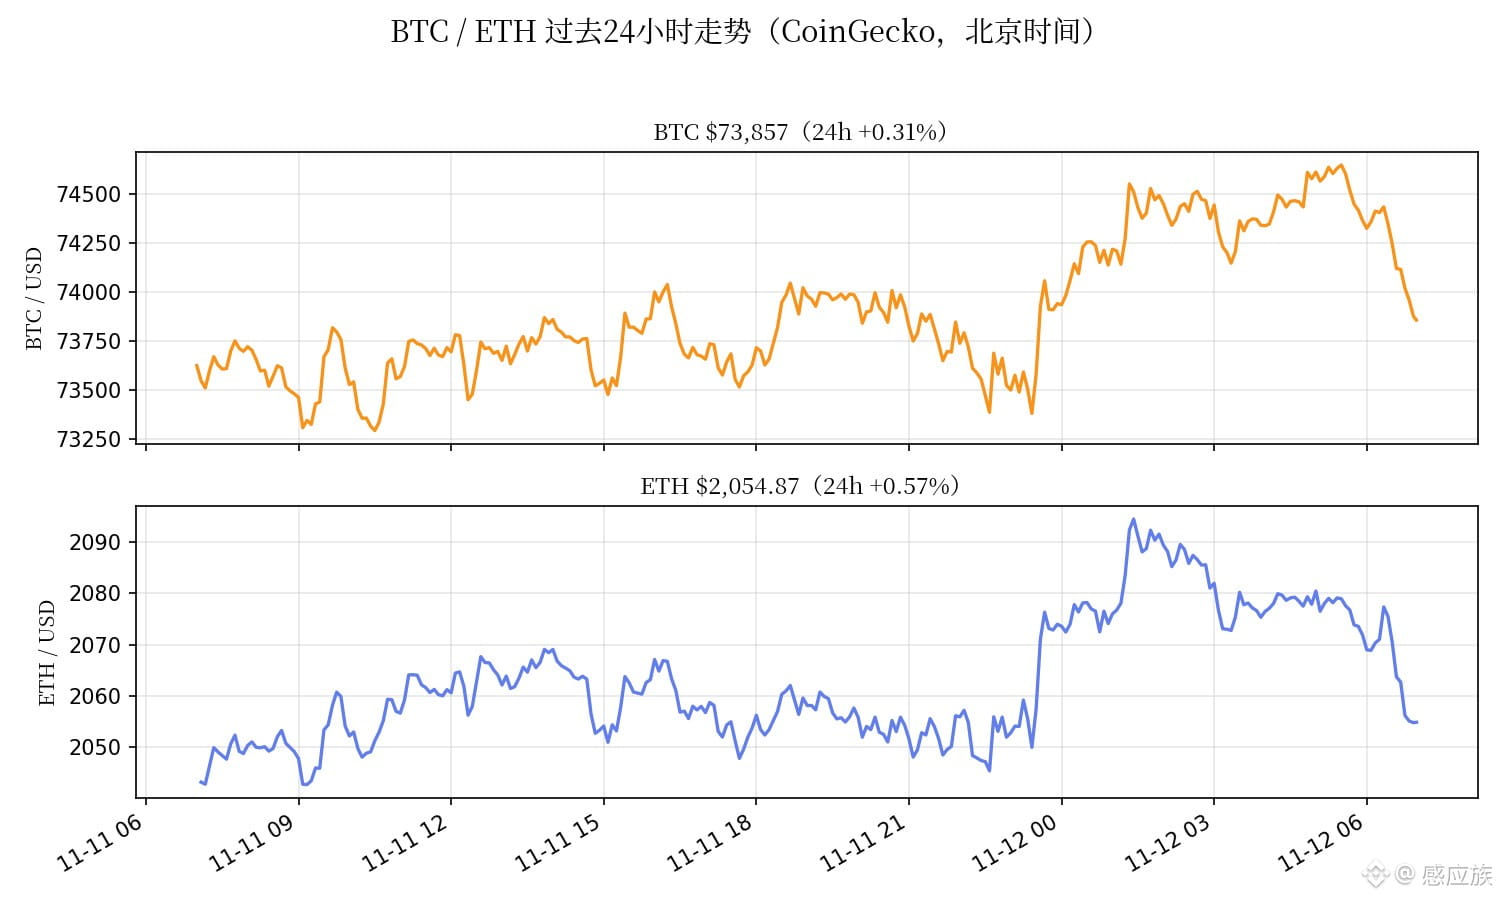
07:00: $BTC was about $73,862, up 0.3% in 24 hours; $ETH was about $2,055, up 0.4% in 24 hours (live CoinGecko data). Compared with 21:00 last night ($73,901), prices basically moved sideways all night. The 24-hour range was $73,463–$74,612—so narrow it feels like a holiday.
Short position tracking #33: Shorts opened November 7 at 13:00 in the $75,800–$76,100 range, with a $75,950 average entry. At the current price of $73,862, the price is down 2.75%; with 100x leverage, the remaining half has an unrealized paper profit of about +275%—up from +270% at 21:00 last night. The added short (entry range $74,700–$75,000, average entry $74,850) is now up about +132%, versus +127% last night. Half the position was already closed at Target 1, $73,200: the original position made +362% and the added short +220%. Those are realized gains, not unrealized profits.
The most important level this morning comes at 08:00, one hour from now: the daily close. Yesterday's close was $73,796 (Finnhub data), holding above the 200-day moving average at around $73,191 (using coinlab's figures). The current price of $73,862 is still about $670 above it. If this morning's 08:00 close is also above the line, that would make it a second consecutive day holding above it. A close below would mark the first breakdown in nearly three months, with $71,500–$72,500 as the next stop. On the 4-hour chart: the 00:00 candle closed at $73,935 and the 04:00 candle at $74,338—those were the 17th and 18th consecutive closes below $75,000 since November 9 at 08:00. The longer it stays below, the more firmly the breakdown is confirmed.
Two quick headlines: U.S. spot BTC ETFs saw $95 million in net outflows on Tuesday (Farside data, via CoinDesk), their fourth consecutive day of outflows, though the pace is slowing—$201 million on Monday, $412 million last Friday, and $430 million last Thursday. BlackRock's IBIT alone saw $78.2 million in outflows, marking its eighth consecutive trading day of net redemptions. Wednesday's flow figures are due tonight; whether outflows continue for a fifth straight day or finally reverse is today's second thing to watch. The market has largely priced in a 25-basis-point rate hike in December; the probability of a 50-basis-point hike is about 11.5% (CME FedWatch).
PEPE is down 12.5% in the trending searches over the past day—meme coins are losing steam. ZEC has dropped out of the top 15 trending searches, and the privacy-coin rally has faded. Small-cap coins are just a thermometer; I'm not touching them.
The plan is unchanged: keep holding the remaining half of the short, with Target 2 at $68,000. The stop-loss at $77,500 and the invalidation level of a 4-hour close above $76,250 remain untouched. A rebound to $75,300–$75,500 is still an opportunity to add to the short. Only consider going long if the price reclaims $78,000 and holds above it. If it breaks below $71,500 but fails to recover on a 4-hour close, don't chase the short—hold and wait for $68,000. Use only a very small portion of total capital for 100x leverage. Next up: the 08:00 daily close (whether the 200-day moving average holds), ETF flows tonight, and Friday, November 13: PPI and the expiry of 33,902 BTC options (max pain at $77,000). Do you think this morning's daily close can hold above the 200-day moving average? Let's discuss in the comments. (Prices: live CoinGecko data at 07:00 Beijing time, November 12; chart shows the past 24 hours.)
Morning market update: Prices barely moved overnight, the 200-day moving average is still holding, and the unrealized profit on the short positions edged up again.
07:00: $BTC was about $73,862, up 0.3% in 24 hours; $ETH was about $2,055, up 0.4% in 24 hours (live CoinGecko data). Compared with 21:00 last night ($73,901), prices basically moved sideways all night. The 24-hour range was $73,463–$74,612—so narrow it feels like a holiday.
Short position tracking #33: Shorts opened November 7 at 13:00 in the $75,800–$76,100 range, with a $75,950 average entry. At the current price of $73,862, the price is down 2.75%; with 100x leverage, the remaining half has an unrealized paper profit of about +275%—up from +270% at 21:00 last night. The added short (entry range $74,700–$75,000, average entry $74,850) is now up about +132%, versus +127% last night. Half the position was already closed at Target 1, $73,200: the original position made +362% and the added short +220%. Those are realized gains, not unrealized profits.
The most important level this morning comes at 08:00, one hour from now: the daily close. Yesterday's close was $73,796 (Finnhub data), holding above the 200-day moving average at around $73,191 (using coinlab's figures). The current price of $73,862 is still about $670 above it. If this morning's 08:00 close is also above the line, that would make it a second consecutive day holding above it. A close below would mark the first breakdown in nearly three months, with $71,500–$72,500 as the next stop. On the 4-hour chart: the 00:00 candle closed at $73,935 and the 04:00 candle at $74,338—those were the 17th and 18th consecutive closes below $75,000 since November 9 at 08:00. The longer it stays below, the more firmly the breakdown is confirmed.
Two quick headlines: U.S. spot BTC ETFs saw $95 million in net outflows on Tuesday (Farside data, via CoinDesk), their fourth consecutive day of outflows, though the pace is slowing—$201 million on Monday, $412 million last Friday, and $430 million last Thursday. BlackRock's IBIT alone saw $78.2 million in outflows, marking its eighth consecutive trading day of net redemptions. Wednesday's flow figures are due tonight; whether outflows continue for a fifth straight day or finally reverse is today's second thing to watch. The market has largely priced in a 25-basis-point rate hike in December; the probability of a 50-basis-point hike is about 11.5% (CME FedWatch).
PEPE is down 12.5% in the trending searches over the past day—meme coins are losing steam. ZEC has dropped out of the top 15 trending searches, and the privacy-coin rally has faded. Small-cap coins are just a thermometer; I'm not touching them.
The plan is unchanged: keep holding the remaining half of the short, with Target 2 at $68,000. The stop-loss at $77,500 and the invalidation level of a 4-hour close above $76,250 remain untouched. A rebound to $75,300–$75,500 is still an opportunity to add to the short. Only consider going long if the price reclaims $78,000 and holds above it. If it breaks below $71,500 but fails to recover on a 4-hour close, don't chase the short—hold and wait for $68,000. Use only a very small portion of total capital for 100x leverage. Next up: the 08:00 daily close (whether the 200-day moving average holds), ETF flows tonight, and Friday, November 13: PPI and the expiry of 33,902 BTC options (max pain at $77,000). Do you think this morning's daily close can hold above the 200-day moving average? Let's discuss in the comments. (Prices: live CoinGecko data at 07:00 Beijing time, November 12; chart shows the past 24 hours.)
07:00: $BTC was about $73,862, up 0.3% in 24 hours; $ETH was about $2,055, up 0.4% in 24 hours (live CoinGecko data). Compared with 21:00 last night ($73,901), prices basically moved sideways all night. The 24-hour range was $73,463–$74,612—so narrow it feels like a holiday.
Short position tracking #33: Shorts opened November 7 at 13:00 in the $75,800–$76,100 range, with a $75,950 average entry. At the current price of $73,862, the price is down 2.75%; with 100x leverage, the remaining half has an unrealized paper profit of about +275%—up from +270% at 21:00 last night. The added short (entry range $74,700–$75,000, average entry $74,850) is now up about +132%, versus +127% last night. Half the position was already closed at Target 1, $73,200: the original position made +362% and the added short +220%. Those are realized gains, not unrealized profits.
The most important level this morning comes at 08:00, one hour from now: the daily close. Yesterday's close was $73,796 (Finnhub data), holding above the 200-day moving average at around $73,191 (using coinlab's figures). The current price of $73,862 is still about $670 above it. If this morning's 08:00 close is also above the line, that would make it a second consecutive day holding above it. A close below would mark the first breakdown in nearly three months, with $71,500–$72,500 as the next stop. On the 4-hour chart: the 00:00 candle closed at $73,935 and the 04:00 candle at $74,338—those were the 17th and 18th consecutive closes below $75,000 since November 9 at 08:00. The longer it stays below, the more firmly the breakdown is confirmed.
Two quick headlines: U.S. spot BTC ETFs saw $95 million in net outflows on Tuesday (Farside data, via CoinDesk), their fourth consecutive day of outflows, though the pace is slowing—$201 million on Monday, $412 million last Friday, and $430 million last Thursday. BlackRock's IBIT alone saw $78.2 million in outflows, marking its eighth consecutive trading day of net redemptions. Wednesday's flow figures are due tonight; whether outflows continue for a fifth straight day or finally reverse is today's second thing to watch. The market has largely priced in a 25-basis-point rate hike in December; the probability of a 50-basis-point hike is about 11.5% (CME FedWatch).
PEPE is down 12.5% in the trending searches over the past day—meme coins are losing steam. ZEC has dropped out of the top 15 trending searches, and the privacy-coin rally has faded. Small-cap coins are just a thermometer; I'm not touching them.
The plan is unchanged: keep holding the remaining half of the short, with Target 2 at $68,000. The stop-loss at $77,500 and the invalidation level of a 4-hour close above $76,250 remain untouched. A rebound to $75,300–$75,500 is still an opportunity to add to the short. Only consider going long if the price reclaims $78,000 and holds above it. If it breaks below $71,500 but fails to recover on a 4-hour close, don't chase the short—hold and wait for $68,000. Use only a very small portion of total capital for 100x leverage. Next up: the 08:00 daily close (whether the 200-day moving average holds), ETF flows tonight, and Friday, November 13: PPI and the expiry of 33,902 BTC options (max pain at $77,000). Do you think this morning's daily close can hold above the 200-day moving average? Let's discuss in the comments. (Prices: live CoinGecko data at 07:00 Beijing time, November 12; chart shows the past 24 hours.)
8

Article
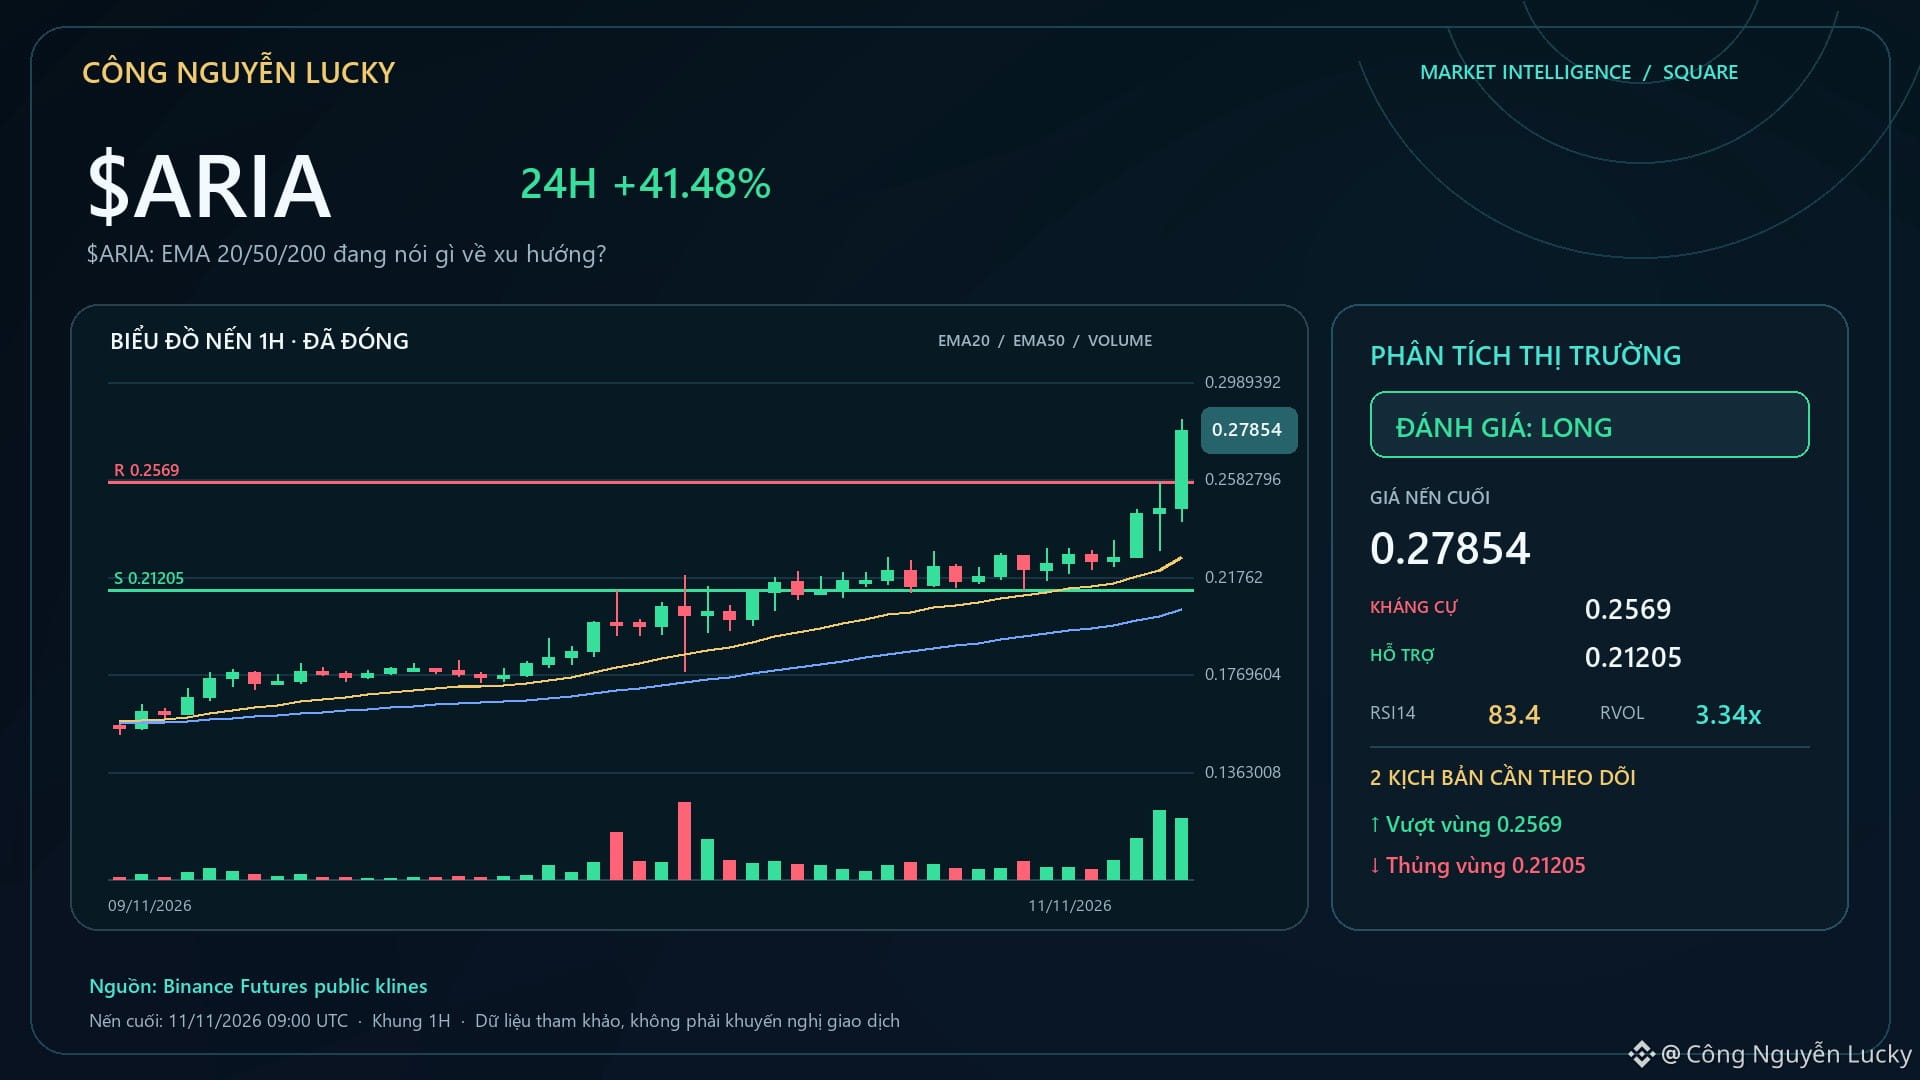
$ARIA: What are the 20/50/200 EMAs saying about the trend?🚨 $ARIA Currently in a BREAKOUT UP state — a genuine breakout or a move likely to be reversed? Market: 0.2583 · 24h +31.81% · volume ~210.2M USDT · 3,374,066 trades.
EMA20 0.22595807 · EMA50 0.20414663 · EMA200 0.15872731.
Structure: HH_HL · RSI14 83.4 · MACD histogram 0.00351239. Technical bias: LONG 99/100. EMA is only a trend filter; I only increase conviction when structure + momentum + money flow all confirm.
Nearby support/resistance: 0.21205 / 0.2569. The technical layers are selected based on the regime:
$ARIA: What are the 20/50/200 EMAs saying about the trend?
🚨 $ARIA Currently in a BREAKOUT UP state — a genuine breakout or a move likely to be reversed? Market: 0.2583 · 24h +31.81% · volume ~210.2M USDT · 3,374,066 trades.
EMA20 0.22595807 · EMA50 0.20414663 · EMA200 0.15872731.
Structure: HH_HL · RSI14 83.4 · MACD histogram 0.00351239. Technical bias: LONG 99/100. EMA is only a trend filter; I only increase conviction when structure + momentum + money flow all confirm.
Nearby support/resistance: 0.21205 / 0.2569. The technical layers are selected based on the regime:
EMA20 0.22595807 · EMA50 0.20414663 · EMA200 0.15872731.
Structure: HH_HL · RSI14 83.4 · MACD histogram 0.00351239. Technical bias: LONG 99/100. EMA is only a trend filter; I only increase conviction when structure + momentum + money flow all confirm.
Nearby support/resistance: 0.21205 / 0.2569. The technical layers are selected based on the regime:
619

A real chart, with no name or date.
Round #33: Will it go up or down over the next 10 trading sessions? Open until midnight.
tradinglogica.com/?src=bsq&p=f33-a-cur-auto
A real chart, with no name or date.
Round #33: Will it go up or down over the next 10 trading sessions? Open until midnight.
tradinglogica.com/?src=bsq&p=f33-a-cur-auto
Round #33: Will it go up or down over the next 10 trading sessions? Open until midnight.
tradinglogica.com/?src=bsq&p=f33-a-cur-auto
108

·
--
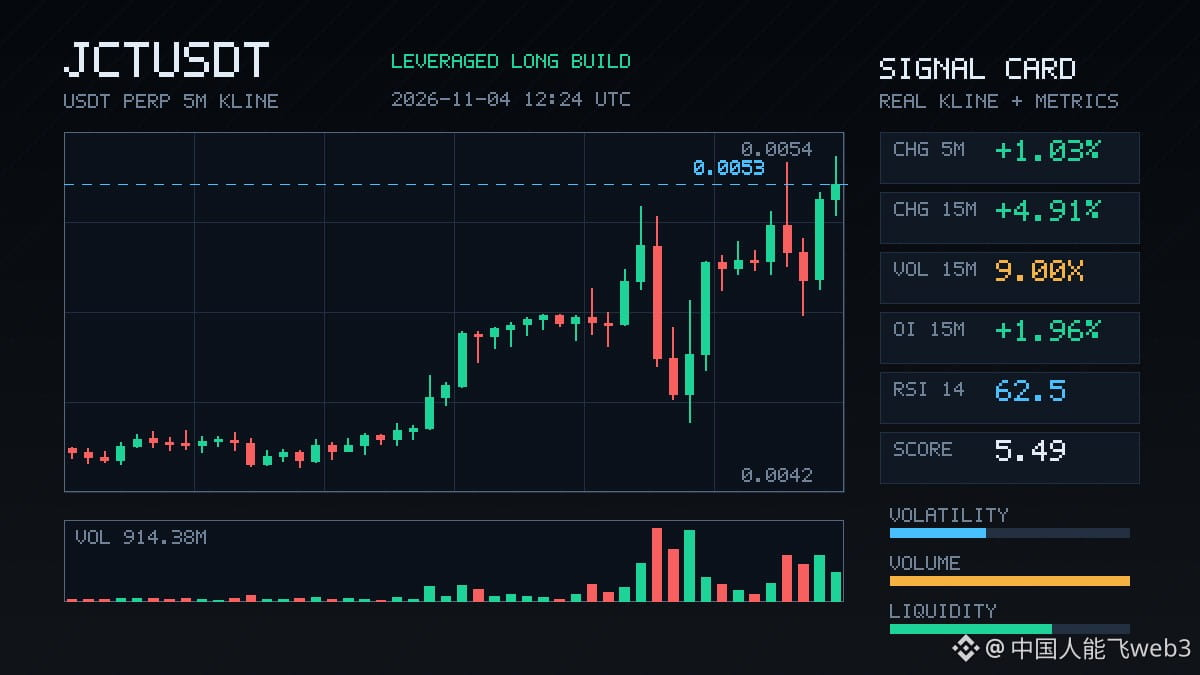
$JCT This 15m move was pretty sharp—up 4.9% in one go. Volume surged to 9x, but the aggressive trade imbalance is still -0.3% and the buy/sell ratio is 0.99, which suggests spot buyers aren't driving the move. OI is the key here: up 4.87% over 1h, with 1.99M in notional value, and it's still climbing over 15m. Price up + OI up is a classic sign of leveraged longs piling in. The anomaly percentile is 92.1%, ranked #33 across the whole pool, while notional change ranks #16—these are significant numbers. 24h trading volume is already over 100 million, and depth confirms there's real liquidity, not just inflated volume. At this point, the rally is being fueled by stacked leveraged longs. Momentum looks strong, but aggressive buying hasn't followed through. If you're chasing the move, think carefully—don't end up being the last one holding the bag.
$JCT This 15m move was pretty sharp—up 4.9% in one go. Volume surged to 9x, but the aggressive trade imbalance is still -0.3% and the buy/sell ratio is 0.99, which suggests spot buyers aren't driving the move. OI is the key here: up 4.87% over 1h, with 1.99M in notional value, and it's still climbing over 15m. Price up + OI up is a classic sign of leveraged longs piling in. The anomaly percentile is 92.1%, ranked #33 across the whole pool, while notional change ranks #16—these are significant numbers. 24h trading volume is already over 100 million, and depth confirms there's real liquidity, not just inflated volume. At this point, the rally is being fueled by stacked leveraged longs. Momentum looks strong, but aggressive buying hasn't followed through. If you're chasing the move, think carefully—don't end up being the last one holding the bag.
3

·
--
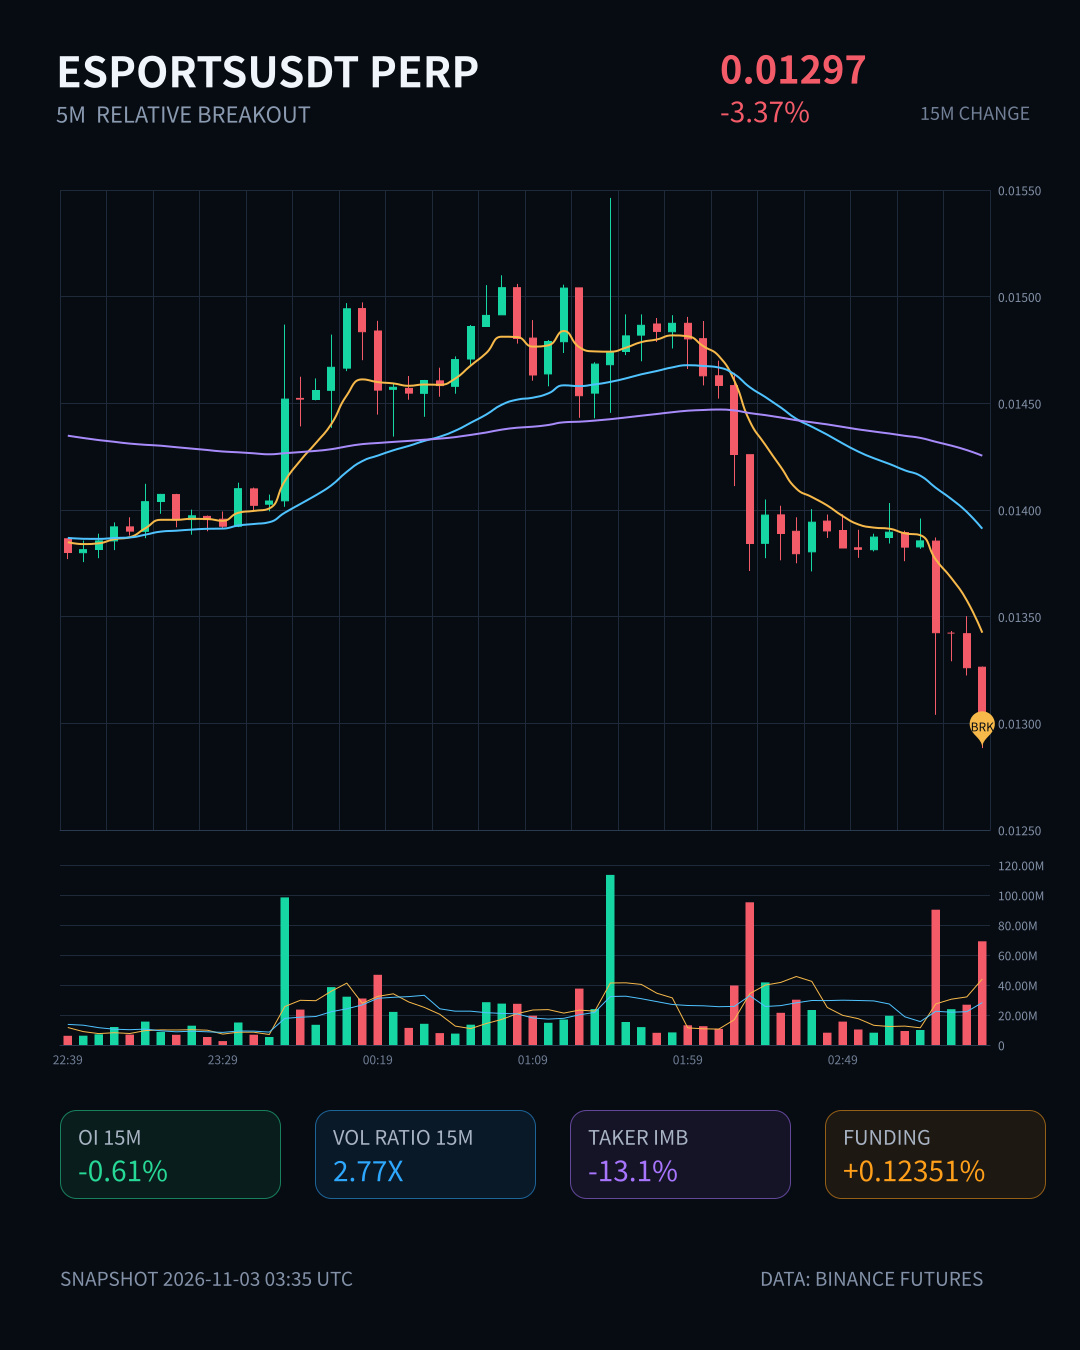
$ESPORTS This 15m high-volume sell-off looks significant: volume jumped straight to 2.77x, price broke below the lower bound of the past 20 5m ranges, and the aggressive trade imbalance was -13.1%—the selling pressure is real.
But take a look at OI: -0.61% over 15m, -2.06% over 1h, with notional value down by 770k U. Price fell while OI declined, so this wasn't new shorts entering; it looks more like longs deleveraging and stop-losses getting swept. It ranked #33 for anomalies across the entire pool and #13 for notional change, and the depth confirms the move.
With 235M in 24h trading volume, liquidity isn't lacking. I’m more inclined to see this structure as a shakeout after positions contracted, rather than a trend-driven sell-off. First, see if price can reclaim the lower bound of the range; if it can't, then reassess.
$ESPORTS This 15m high-volume sell-off looks significant: volume jumped straight to 2.77x, price broke below the lower bound of the past 20 5m ranges, and the aggressive trade imbalance was -13.1%—the selling pressure is real.
But take a look at OI: -0.61% over 15m, -2.06% over 1h, with notional value down by 770k U. Price fell while OI declined, so this wasn't new shorts entering; it looks more like longs deleveraging and stop-losses getting swept. It ranked #33 for anomalies across the entire pool and #13 for notional change, and the depth confirms the move.
With 235M in 24h trading volume, liquidity isn't lacking. I’m more inclined to see this structure as a shakeout after positions contracted, rather than a trend-driven sell-off. First, see if price can reclaim the lower bound of the range; if it can't, then reassess.
But take a look at OI: -0.61% over 15m, -2.06% over 1h, with notional value down by 770k U. Price fell while OI declined, so this wasn't new shorts entering; it looks more like longs deleveraging and stop-losses getting swept. It ranked #33 for anomalies across the entire pool and #13 for notional change, and the depth confirms the move.
With 235M in 24h trading volume, liquidity isn't lacking. I’m more inclined to see this structure as a shakeout after positions contracted, rather than a trend-driven sell-off. First, see if price can reclaim the lower bound of the range; if it can't, then reassess.
3

·
--
$SOON This 15m rally has something behind it. A 1.80% gain isn’t huge, but volume hit 1.64 times its usual level, and the Z-score of 3.74 pushed right up to the top of the recent range. The closing price also held above the highs of the previous 20 5m candles.
The key point is the 40% aggressive trade imbalance and a buy/sell ratio of 2.33, suggesting buyers are actively sweeping the order book—not creating a fake breakout with stacked limit orders. OI only ticked up 0.01%, but the notional change was 108K USDT. Alongside the price move, that looks more like new leveraged longs entering than shorts closing out.
The pool-wide anomaly percentile is 86.5%, ranking #16, with the notional change at #33. Depth confirmation also came through: volume was above normal, price touched the range boundary, and aggressive flow leaned bullish. 24h trading volume is only 7.84M, so the pool is small. A move of this size is worth watching to see whether it continues.
$SOON This 15m rally has something behind it. A 1.80% gain isn’t huge, but volume hit 1.64 times its usual level, and the Z-score of 3.74 pushed right up to the top of the recent range. The closing price also held above the highs of the previous 20 5m candles.
The key point is the 40% aggressive trade imbalance and a buy/sell ratio of 2.33, suggesting buyers are actively sweeping the order book—not creating a fake breakout with stacked limit orders. OI only ticked up 0.01%, but the notional change was 108K USDT. Alongside the price move, that looks more like new leveraged longs entering than shorts closing out.
The pool-wide anomaly percentile is 86.5%, ranking #16, with the notional change at #33. Depth confirmation also came through: volume was above normal, price touched the range boundary, and aggressive flow leaned bullish. 24h trading volume is only 7.84M, so the pool is small. A move of this size is worth watching to see whether it continues.
The key point is the 40% aggressive trade imbalance and a buy/sell ratio of 2.33, suggesting buyers are actively sweeping the order book—not creating a fake breakout with stacked limit orders. OI only ticked up 0.01%, but the notional change was 108K USDT. Alongside the price move, that looks more like new leveraged longs entering than shorts closing out.
The pool-wide anomaly percentile is 86.5%, ranking #16, with the notional change at #33. Depth confirmation also came through: volume was above normal, price touched the range boundary, and aggressive flow leaned bullish. 24h trading volume is only 7.84M, so the pool is small. A move of this size is worth watching to see whether it continues.
3

·
--
$G This drop is pretty interesting. It plunged 3.89% in 15m, with volume reaching 5.96 times the norm, but OI actually rose 23.84% in an hour—price down, open interest up: a classic influx of new shorts, not a sell-off caused by old positions closing. The funding rate is -0.0952%, at the 99th percentile in the near term, with shorts so crowded they're nearing historical extremes. Notional change ranks #33 across the entire pool, with an anomaly percentile of 94%, and depth confirms it too. In this kind of setup, I generally don't chase shorts; I'd wait for funding to converge or OI to start turning before making a move. $G
$G This drop is pretty interesting. It plunged 3.89% in 15m, with volume reaching 5.96 times the norm, but OI actually rose 23.84% in an hour—price down, open interest up: a classic influx of new shorts, not a sell-off caused by old positions closing. The funding rate is -0.0952%, at the 99th percentile in the near term, with shorts so crowded they're nearing historical extremes. Notional change ranks #33 across the entire pool, with an anomaly percentile of 94%, and depth confirms it too. In this kind of setup, I generally don't chase shorts; I'd wait for funding to converge or OI to start turning before making a move. $G
7
·
--
$XMR 's 15m move is looking interesting: volume surged to 2.15x, the closing price broke above the upper end of the past 20 5m candles, the buy/sell ratio was 1.20, and the aggressive trade imbalance was +9.2%—buyers are definitely pushing.
But OI is edging down slightly on both the 15m and 1h timeframes. Price is up while open interest is down, which looks more like short covering and position reduction than a structure driven by large-scale new long entries. The notional change ranks #33 across the entire pool, and the anomaly percentile is only 50.8%. There's depth, but we'll have to see whether fresh money steps in after the covering is done to determine if the move can continue.
24h trading volume is 51M, so the pool isn't particularly deep. At this level, I'd rather wait to see if it can hold above the range's upper boundary before chasing the price.
$XMR 's 15m move is looking interesting: volume surged to 2.15x, the closing price broke above the upper end of the past 20 5m candles, the buy/sell ratio was 1.20, and the aggressive trade imbalance was +9.2%—buyers are definitely pushing.
But OI is edging down slightly on both the 15m and 1h timeframes. Price is up while open interest is down, which looks more like short covering and position reduction than a structure driven by large-scale new long entries. The notional change ranks #33 across the entire pool, and the anomaly percentile is only 50.8%. There's depth, but we'll have to see whether fresh money steps in after the covering is done to determine if the move can continue.
24h trading volume is 51M, so the pool isn't particularly deep. At this level, I'd rather wait to see if it can hold above the range's upper boundary before chasing the price.
But OI is edging down slightly on both the 15m and 1h timeframes. Price is up while open interest is down, which looks more like short covering and position reduction than a structure driven by large-scale new long entries. The notional change ranks #33 across the entire pool, and the anomaly percentile is only 50.8%. There's depth, but we'll have to see whether fresh money steps in after the covering is done to determine if the move can continue.
24h trading volume is 51M, so the pool isn't particularly deep. At this level, I'd rather wait to see if it can hold above the range's upper boundary before chasing the price.
66
·
--
LINK is looking interesting on the 15m. Price broke below the lower bound of the past 20 five-minute ranges, falling 1%, while volume surged to 3.57x normal levels. But OI didn’t rise along with it; it was actually down slightly by 0.12% on the 1h, with nearly 700K U in notional turnover—a classic “price down + OI down” combo, suggesting more long deleveraging and stop-loss exits than fresh shorts piling in.
The taker flow delta is -11%, and the buy/sell ratio is 0.80, so selling pressure is there. But funding rates are still in the upper end of their recent range, while price is breaking down—this mismatch is worth watching. 24h volume of 346M is not exactly quiet, and combined with a volume anomaly percentile of 77.4%, it ranks #33 across the pool for anomalies and #15 for notional change, making it one of today’s more conspicuous moves.
Let’s see if buyers step in after this wave of deleveraging. $LINK
LINK is looking interesting on the 15m. Price broke below the lower bound of the past 20 five-minute ranges, falling 1%, while volume surged to 3.57x normal levels. But OI didn’t rise along with it; it was actually down slightly by 0.12% on the 1h, with nearly 700K U in notional turnover—a classic “price down + OI down” combo, suggesting more long deleveraging and stop-loss exits than fresh shorts piling in.
The taker flow delta is -11%, and the buy/sell ratio is 0.80, so selling pressure is there. But funding rates are still in the upper end of their recent range, while price is breaking down—this mismatch is worth watching. 24h volume of 346M is not exactly quiet, and combined with a volume anomaly percentile of 77.4%, it ranks #33 across the pool for anomalies and #15 for notional change, making it one of today’s more conspicuous moves.
Let’s see if buyers step in after this wave of deleveraging. $LINK
The taker flow delta is -11%, and the buy/sell ratio is 0.80, so selling pressure is there. But funding rates are still in the upper end of their recent range, while price is breaking down—this mismatch is worth watching. 24h volume of 346M is not exactly quiet, and combined with a volume anomaly percentile of 77.4%, it ranks #33 across the pool for anomalies and #15 for notional change, making it one of today’s more conspicuous moves.
Let’s see if buyers step in after this wave of deleveraging. $LINK
5
·
--
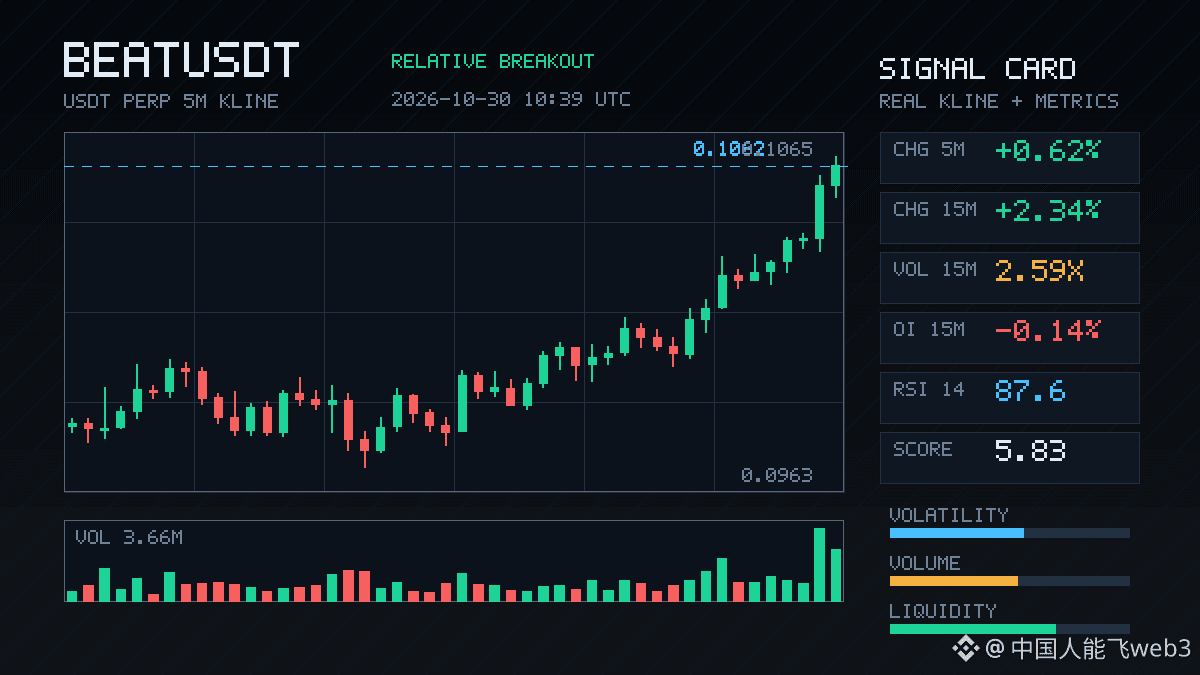
$BEAT 's 15m rally was pretty sharp: +2.34%, with volume jumping to 2.59x, and the close even moved above the highs of nearly the last 20 5m candles.
But there's an interesting detail: price is moving up while OI is falling—down 0.14% on the 15m and 0.45% on the 1h. This setup looks more like short covering than new longs entering. The taker buy/sell delta is +10%, and the buy/sell ratio is 1.22, so there is some chasing, but the futures side isn't following through.
So don't rush to chase it as a trend. First, see whether a pullback can hold above the top of this range. The 24h trading volume is 116M, and its anomaly ranking in the pool is #33. There's definitely some short-term buzz, but with a breakout diverging from OI like this, the biggest risk is a quick spike that goes nowhere.
$BEAT 's 15m rally was pretty sharp: +2.34%, with volume jumping to 2.59x, and the close even moved above the highs of nearly the last 20 5m candles.
But there's an interesting detail: price is moving up while OI is falling—down 0.14% on the 15m and 0.45% on the 1h. This setup looks more like short covering than new longs entering. The taker buy/sell delta is +10%, and the buy/sell ratio is 1.22, so there is some chasing, but the futures side isn't following through.
So don't rush to chase it as a trend. First, see whether a pullback can hold above the top of this range. The 24h trading volume is 116M, and its anomaly ranking in the pool is #33. There's definitely some short-term buzz, but with a breakout diverging from OI like this, the biggest risk is a quick spike that goes nowhere.
But there's an interesting detail: price is moving up while OI is falling—down 0.14% on the 15m and 0.45% on the 1h. This setup looks more like short covering than new longs entering. The taker buy/sell delta is +10%, and the buy/sell ratio is 1.22, so there is some chasing, but the futures side isn't following through.
So don't rush to chase it as a trend. First, see whether a pullback can hold above the top of this range. The 24h trading volume is 116M, and its anomaly ranking in the pool is #33. There's definitely some short-term buzz, but with a breakout diverging from OI like this, the biggest risk is a quick spike that goes nowhere.
·
--
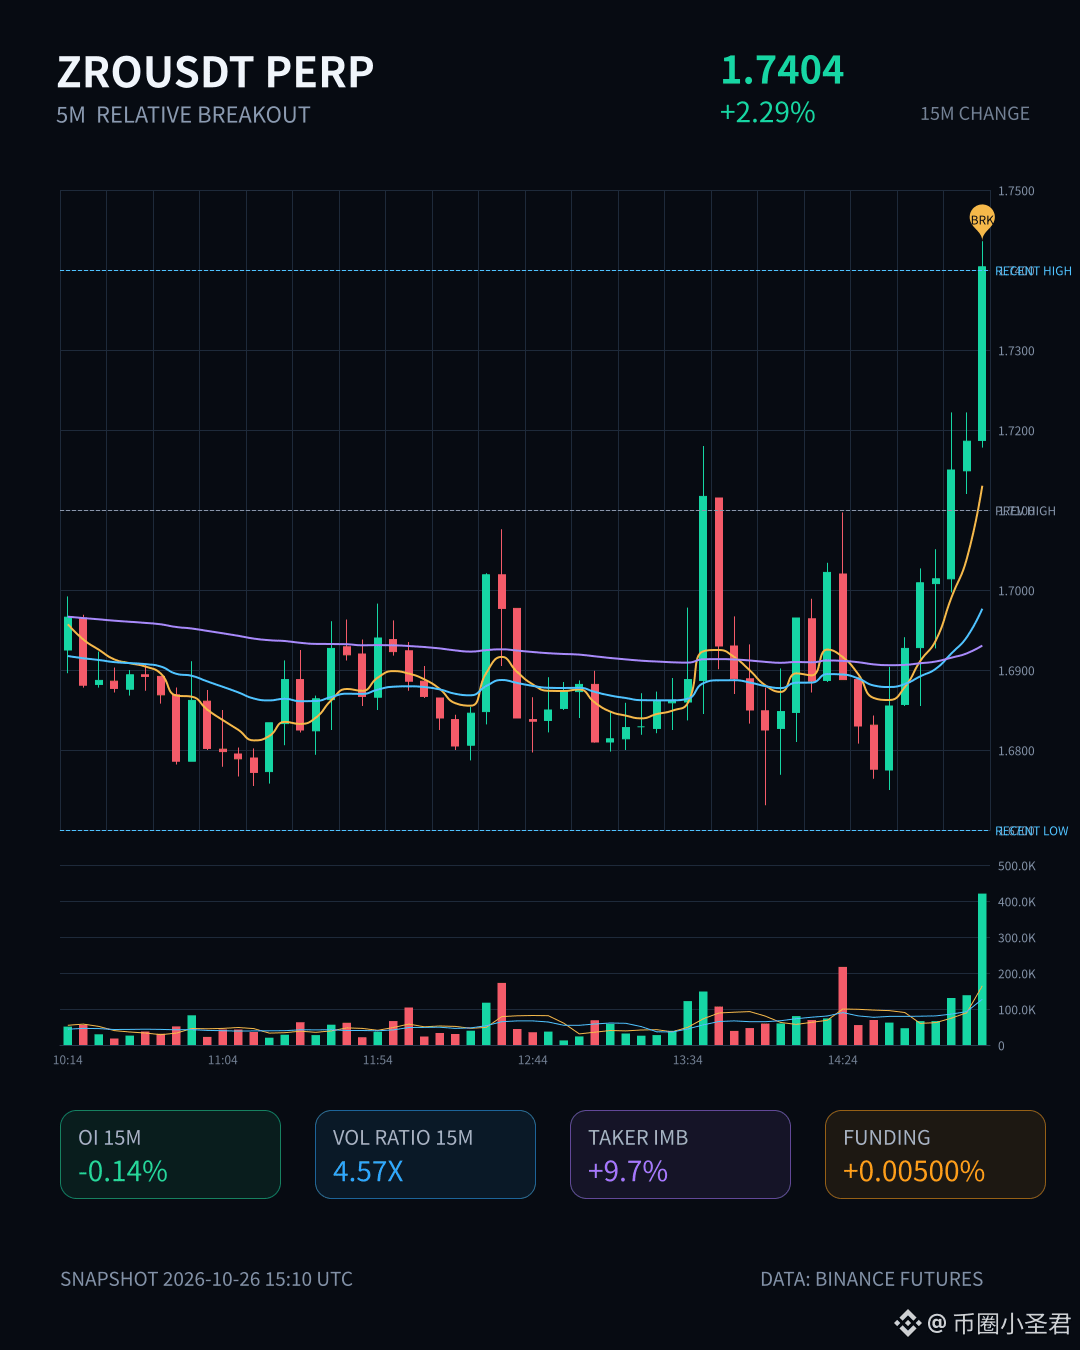
$ZRO 's 15m move is pretty aggressive: up 2.29% on 4.5x volume, breaking straight through the highs of the last 20 5m candles. But here's the interesting part: OI is falling—down 0.14% on the 15m and 0.26% on the 1h. Price is rising while positions are shrinking, a classic short-covering rally, not fresh longs coming in.
The active trade imbalance is 9.7%, and the buy/sell ratio is 1.22, so buyers are still chasing in the short term. Funding rates have also climbed to a recent high percentile, while the OI anomaly percentile is 88.7%, ranking #33 across the entire pool. This has persisted for several consecutive periods, so it’s not just a single spike.
My take: this setup looks more like a short squeeze. Be careful chasing longs—the rally could run out of steam once short covering ends. I’d wait for OI to stabilize and see whether genuine longs step in.
$ZRO 's 15m move is pretty aggressive: up 2.29% on 4.5x volume, breaking straight through the highs of the last 20 5m candles. But here's the interesting part: OI is falling—down 0.14% on the 15m and 0.26% on the 1h. Price is rising while positions are shrinking, a classic short-covering rally, not fresh longs coming in.
The active trade imbalance is 9.7%, and the buy/sell ratio is 1.22, so buyers are still chasing in the short term. Funding rates have also climbed to a recent high percentile, while the OI anomaly percentile is 88.7%, ranking #33 across the entire pool. This has persisted for several consecutive periods, so it’s not just a single spike.
My take: this setup looks more like a short squeeze. Be careful chasing longs—the rally could run out of steam once short covering ends. I’d wait for OI to stabilize and see whether genuine longs step in.
The active trade imbalance is 9.7%, and the buy/sell ratio is 1.22, so buyers are still chasing in the short term. Funding rates have also climbed to a recent high percentile, while the OI anomaly percentile is 88.7%, ranking #33 across the entire pool. This has persisted for several consecutive periods, so it’s not just a single spike.
My take: this setup looks more like a short squeeze. Be careful chasing longs—the rally could run out of steam once short covering ends. I’d wait for OI to stabilize and see whether genuine longs step in.
·
--
$MAGMA has taken a pretty hard hit here: down 2.76% in 15m, with volume surging to 6.5 times normal and a Z-score of 6.87—clearly more than just a random wobble. Price broke below the lower bound of the recent 20-candle 5m range, taker volume delta is -29.3%, and the buy/sell ratio is 0.55. Sellers are really piling on the pressure.
What’s interesting is that OI is still rising: +0.42% over 15m and +0.55% over 1h. Its anomaly percentile is 93.3%, ranking #33 across the entire pool. Price down + OI up looks more like new shorts entering with leverage to chase the move, rather than old longs closing out. Notional change is negative, at -224K, suggesting the positioning is shifting toward shorts.
24h trading volume is 56.8M, and market depth still looks decent. But be careful chasing shorts at this level—it’s already approaching a historically extreme range. I’ll wait and see whether these leveraged shorts get squeezed before making a move.
$MAGMA has taken a pretty hard hit here: down 2.76% in 15m, with volume surging to 6.5 times normal and a Z-score of 6.87—clearly more than just a random wobble. Price broke below the lower bound of the recent 20-candle 5m range, taker volume delta is -29.3%, and the buy/sell ratio is 0.55. Sellers are really piling on the pressure.
What’s interesting is that OI is still rising: +0.42% over 15m and +0.55% over 1h. Its anomaly percentile is 93.3%, ranking #33 across the entire pool. Price down + OI up looks more like new shorts entering with leverage to chase the move, rather than old longs closing out. Notional change is negative, at -224K, suggesting the positioning is shifting toward shorts.
24h trading volume is 56.8M, and market depth still looks decent. But be careful chasing shorts at this level—it’s already approaching a historically extreme range. I’ll wait and see whether these leveraged shorts get squeezed before making a move.
What’s interesting is that OI is still rising: +0.42% over 15m and +0.55% over 1h. Its anomaly percentile is 93.3%, ranking #33 across the entire pool. Price down + OI up looks more like new shorts entering with leverage to chase the move, rather than old longs closing out. Notional change is negative, at -224K, suggesting the positioning is shifting toward shorts.
24h trading volume is 56.8M, and market depth still looks decent. But be careful chasing shorts at this level—it’s already approaching a historically extreme range. I’ll wait and see whether these leveraged shorts get squeezed before making a move.
Article
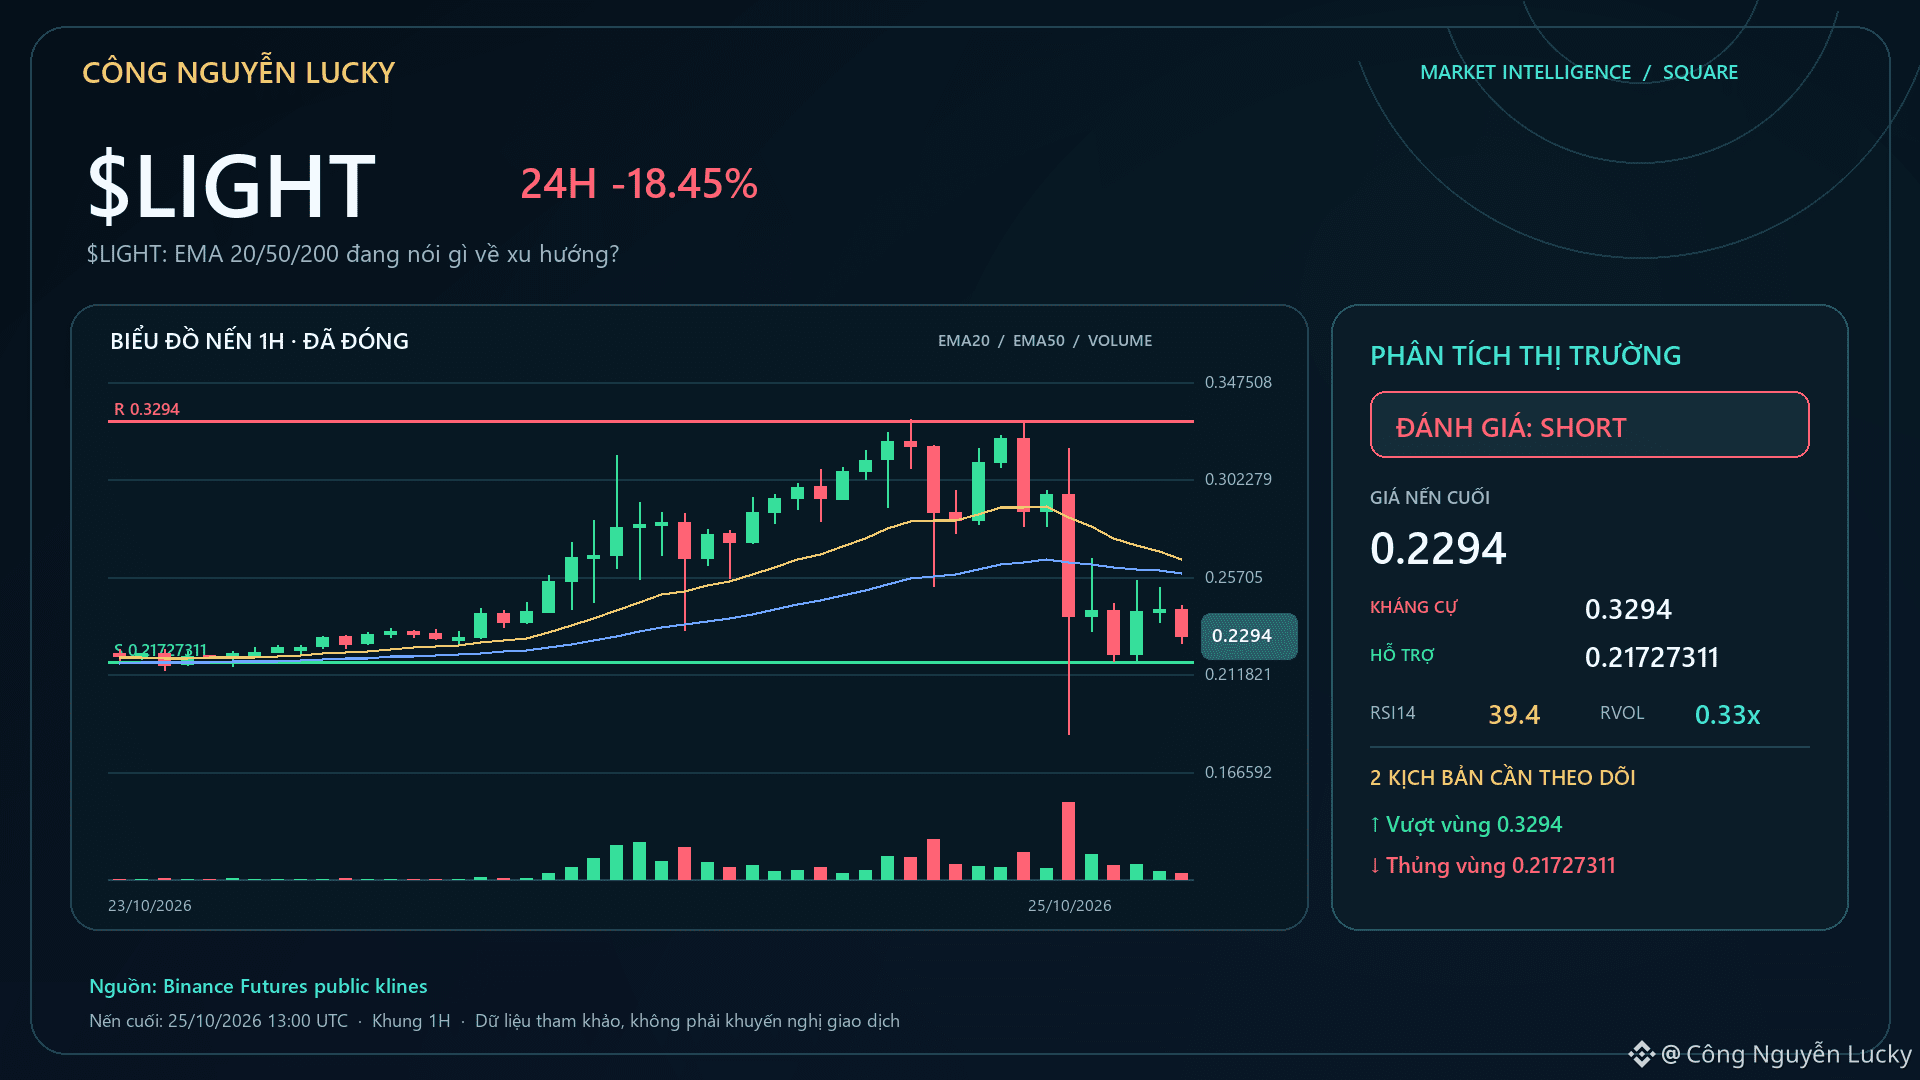
$LIGHT: What are the 20/50/200 EMAs saying about the trend?🔥 $LIGHT is down -12.40% — but the percentage change alone isn’t enough to call this a good setup. Market: 0.2487 · 24h -12.40% · volume ~95.4M USDT · 1,811,566 trades.
EMA20 0.26518899 · EMA50 0.25870307 · EMA200 0.22856191.
Structure: LH_LL · RSI14 39.4 · MACD histogram -0.00976176. Technical bias: SHORT 79/100. EMA is only a trend filter; I’ll only increase conviction when structure + momentum + money flow all confirm.
Nearby support/resistance: 0.21727311 / 0.3294. The technical layers are selected based on the regime:
$LIGHT: What are the 20/50/200 EMAs saying about the trend?
🔥 $LIGHT is down -12.40% — but the percentage change alone isn’t enough to call this a good setup. Market: 0.2487 · 24h -12.40% · volume ~95.4M USDT · 1,811,566 trades.
EMA20 0.26518899 · EMA50 0.25870307 · EMA200 0.22856191.
Structure: LH_LL · RSI14 39.4 · MACD histogram -0.00976176. Technical bias: SHORT 79/100. EMA is only a trend filter; I’ll only increase conviction when structure + momentum + money flow all confirm.
Nearby support/resistance: 0.21727311 / 0.3294. The technical layers are selected based on the regime:
EMA20 0.26518899 · EMA50 0.25870307 · EMA200 0.22856191.
Structure: LH_LL · RSI14 39.4 · MACD histogram -0.00976176. Technical bias: SHORT 79/100. EMA is only a trend filter; I’ll only increase conviction when structure + momentum + money flow all confirm.
Nearby support/resistance: 0.21727311 / 0.3294. The technical layers are selected based on the regime:
340
·
--
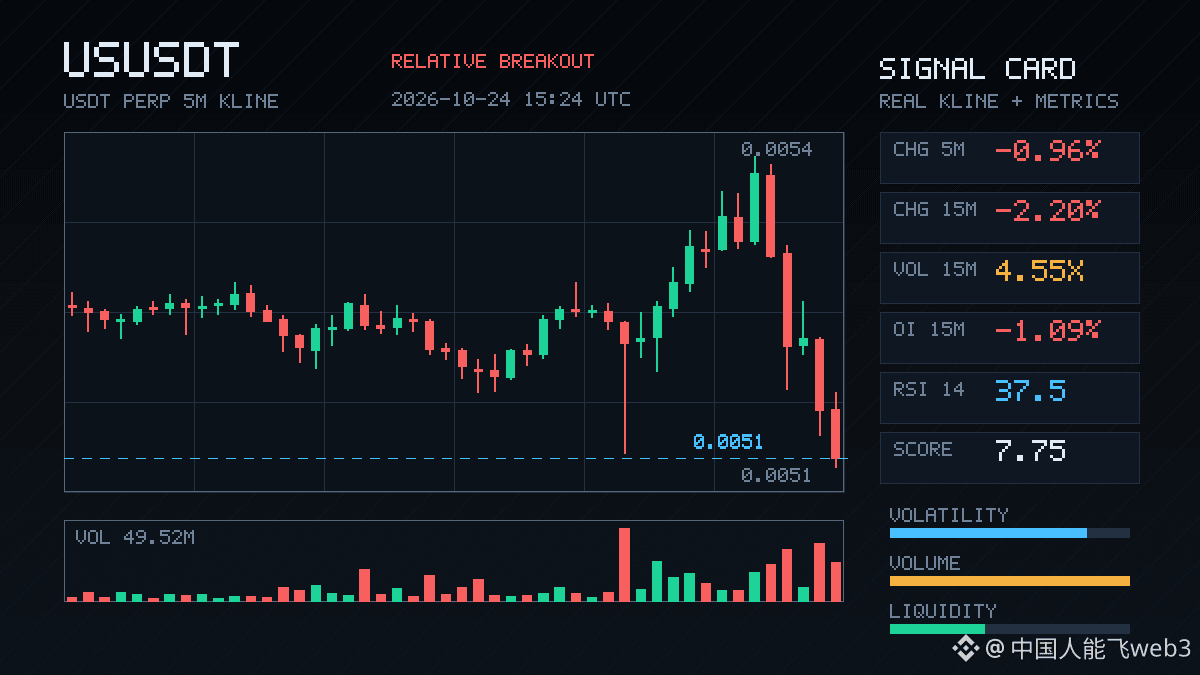
$US dropped 2.2% in 15m, with volume surging to 4.55 times normal and a Z-score of 3.28—clear signs of concentrated position exits. OI fell 1.09% over 15m and continued to decline over 1h. Price down + OI down looks more like longs deleveraging than new shorts entering. The active trade imbalance was -7.2%, and the buy/sell ratio was 0.87, with selling pressure driving the move. The close has already fallen below the lower end of the range for the last 20 5m candles. The OI anomaly percentile is 98.6%, ranking #33 across the entire pool. Keep an eye on this kind of anomaly persisting across several consecutive periods. Don’t rush to buy the dip—first see whether it can reclaim the lower boundary.
$US dropped 2.2% in 15m, with volume surging to 4.55 times normal and a Z-score of 3.28—clear signs of concentrated position exits. OI fell 1.09% over 15m and continued to decline over 1h. Price down + OI down looks more like longs deleveraging than new shorts entering. The active trade imbalance was -7.2%, and the buy/sell ratio was 0.87, with selling pressure driving the move. The close has already fallen below the lower end of the range for the last 20 5m candles. The OI anomaly percentile is 98.6%, ranking #33 across the entire pool. Keep an eye on this kind of anomaly persisting across several consecutive periods. Don’t rush to buy the dip—first see whether it can reclaim the lower boundary.
5
·
--
$WLD just rose 2.41% in 15m, with volume expanding to 3.3x and an aggressive buy/sell ratio of 1.51, indicating clear buying pressure. The closing price also broke above the range formed by the last 20 5m candles. OI rose at the same time, which looks more like new leveraged longs entering than short covering. It ranks #33 for anomalies across the pool and #9 for notional change—not quite at the top, but now on the watchlist. Price and volume are currently aligned well; next, watch to see whether the price can hold above the range high and avoid a mere wick-driven move.
$WLD just rose 2.41% in 15m, with volume expanding to 3.3x and an aggressive buy/sell ratio of 1.51, indicating clear buying pressure. The closing price also broke above the range formed by the last 20 5m candles. OI rose at the same time, which looks more like new leveraged longs entering than short covering. It ranks #33 for anomalies across the pool and #9 for notional change—not quite at the top, but now on the watchlist. Price and volume are currently aligned well; next, watch to see whether the price can hold above the range high and avoid a mere wick-driven move.
1
·
--
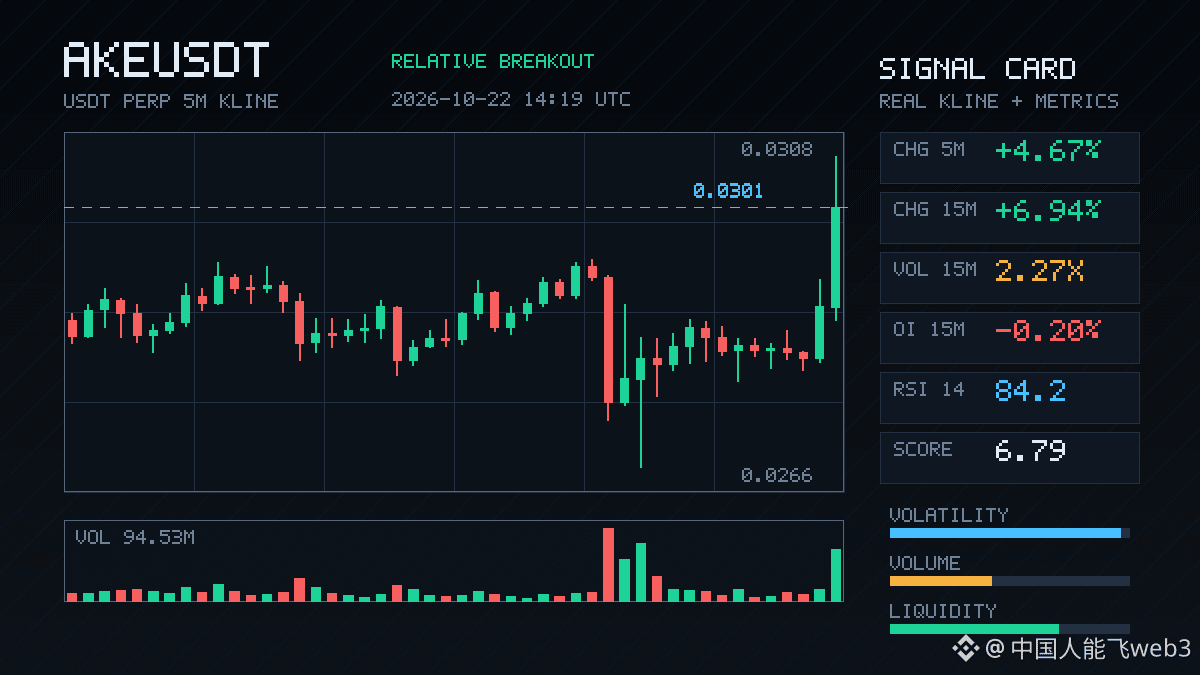
$AKE surged 6.94% over this 15-minute period, with volume at 2.27x and volatility Z at 3.85. It looks pretty strong, but a closer look shows OI is down: 15-minute futures OI fell 0.20%. Price up + OI down is a classic short squeeze, not new longs entering. The 1-hour OI is up 0.63%, which barely suggests some position rebuilding, but overall positioning is still light.
The closing price broke above the highs of the last 20 five-minute candles. The aggressive trade imbalance was 7.4%, and the buy/sell ratio was 1.16, so there was buying pressure behind the short-term move. The anomaly percentile is 78.4%; it ranks #33 across the full pool and #25 for notional change—near the top, but not extreme.
24-hour trading volume is 127M, with adequate depth. My take: chasing a move with this structure carries considerable risk. Once the short-covering pressure lets up, the price could easily pull back. Wait for OI to pick up again; this isn’t the time to take a heavy position.
$AKE surged 6.94% over this 15-minute period, with volume at 2.27x and volatility Z at 3.85. It looks pretty strong, but a closer look shows OI is down: 15-minute futures OI fell 0.20%. Price up + OI down is a classic short squeeze, not new longs entering. The 1-hour OI is up 0.63%, which barely suggests some position rebuilding, but overall positioning is still light.
The closing price broke above the highs of the last 20 five-minute candles. The aggressive trade imbalance was 7.4%, and the buy/sell ratio was 1.16, so there was buying pressure behind the short-term move. The anomaly percentile is 78.4%; it ranks #33 across the full pool and #25 for notional change—near the top, but not extreme.
24-hour trading volume is 127M, with adequate depth. My take: chasing a move with this structure carries considerable risk. Once the short-covering pressure lets up, the price could easily pull back. Wait for OI to pick up again; this isn’t the time to take a heavy position.
The closing price broke above the highs of the last 20 five-minute candles. The aggressive trade imbalance was 7.4%, and the buy/sell ratio was 1.16, so there was buying pressure behind the short-term move. The anomaly percentile is 78.4%; it ranks #33 across the full pool and #25 for notional change—near the top, but not extreme.
24-hour trading volume is 127M, with adequate depth. My take: chasing a move with this structure carries considerable risk. Once the short-covering pressure lets up, the price could easily pull back. Wait for OI to pick up again; this isn’t the time to take a heavy position.
1
·
--
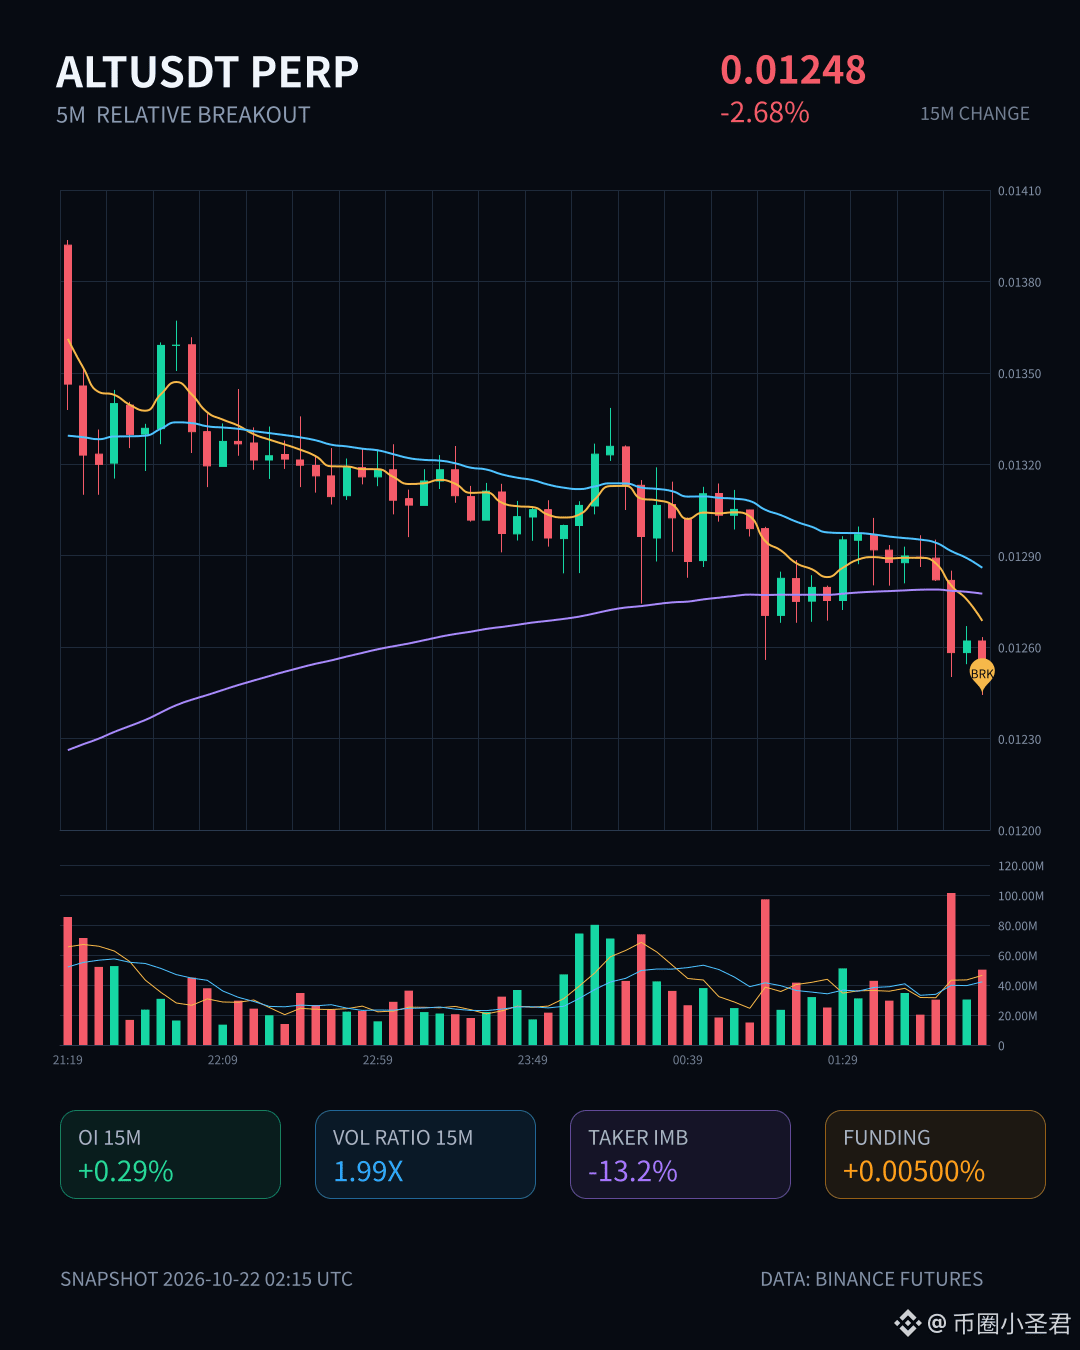
ALT is down 2.68% over the past 15m—not a huge move, but the structure is interesting: price is falling while OI is rising, up 1.05% over 1h. The anomaly percentile has reached 86.7%, ranking #33 across the entire pool. This looks more like new leveraged shorts entering to push the price down than longs giving up and exiting.
Volume confirms the move: 15m volume is 1.99x, taker flow is -13.2%, and the buy/sell ratio is 0.77, showing a clear bias toward selling. Price has already broken below the lower end of the range formed by the last 20 or so 5m candles, so the short-term boundary has been breached.
What I’m watching now is the amount of short leverage built up here. If the breakdown fails to continue, it could instead become fuel for a short squeeze. 24h trading volume is 132M and the pool is sizable, so don’t rush to chase—wait for confirmation.
ALT is down 2.68% over the past 15m—not a huge move, but the structure is interesting: price is falling while OI is rising, up 1.05% over 1h. The anomaly percentile has reached 86.7%, ranking #33 across the entire pool. This looks more like new leveraged shorts entering to push the price down than longs giving up and exiting.
Volume confirms the move: 15m volume is 1.99x, taker flow is -13.2%, and the buy/sell ratio is 0.77, showing a clear bias toward selling. Price has already broken below the lower end of the range formed by the last 20 or so 5m candles, so the short-term boundary has been breached.
What I’m watching now is the amount of short leverage built up here. If the breakdown fails to continue, it could instead become fuel for a short squeeze. 24h trading volume is 132M and the pool is sizable, so don’t rush to chase—wait for confirmation.
Volume confirms the move: 15m volume is 1.99x, taker flow is -13.2%, and the buy/sell ratio is 0.77, showing a clear bias toward selling. Price has already broken below the lower end of the range formed by the last 20 or so 5m candles, so the short-term boundary has been breached.
What I’m watching now is the amount of short leverage built up here. If the breakdown fails to continue, it could instead become fuel for a short squeeze. 24h trading volume is 132M and the pool is sizable, so don’t rush to chase—wait for confirmation.
32
·
--
$GTC This 15m move was pretty decisive. +2.3% isn’t outrageous, but the key is that OI moved up alongside it—15m +2.13%, 1h +0.71%—and volume came in at 1.99x. This looks more like new leveraged longs entering than a hollow spike caused by shorts covering.
The OI anomaly percentile is 87.1%, ranking #38 across the pool, with nominal change at #33. It’s been building over several consecutive periods, and that sustained momentum is more convincing than a single spike. 24h trading volume is 145M; the order book bid/ask ratio is 1.02 and the taker flow imbalance is 0.7%—buyers have a slight edge, but it’s not one-sided.
Price is now right at the top of its recent range, so whether it can break through the sell orders above on strong volume is crucial. OI has already piled up here; if price can’t push through, these new longs could easily become fuel for a pullback. First, watch to see if this level holds—don’t rush to chase.
$GTC This 15m move was pretty decisive. +2.3% isn’t outrageous, but the key is that OI moved up alongside it—15m +2.13%, 1h +0.71%—and volume came in at 1.99x. This looks more like new leveraged longs entering than a hollow spike caused by shorts covering.
The OI anomaly percentile is 87.1%, ranking #38 across the pool, with nominal change at #33. It’s been building over several consecutive periods, and that sustained momentum is more convincing than a single spike. 24h trading volume is 145M; the order book bid/ask ratio is 1.02 and the taker flow imbalance is 0.7%—buyers have a slight edge, but it’s not one-sided.
Price is now right at the top of its recent range, so whether it can break through the sell orders above on strong volume is crucial. OI has already piled up here; if price can’t push through, these new longs could easily become fuel for a pullback. First, watch to see if this level holds—don’t rush to chase.
The OI anomaly percentile is 87.1%, ranking #38 across the pool, with nominal change at #33. It’s been building over several consecutive periods, and that sustained momentum is more convincing than a single spike. 24h trading volume is 145M; the order book bid/ask ratio is 1.02 and the taker flow imbalance is 0.7%—buyers have a slight edge, but it’s not one-sided.
Price is now right at the top of its recent range, so whether it can break through the sell orders above on strong volume is crucial. OI has already piled up here; if price can’t push through, these new longs could easily become fuel for a pullback. First, watch to see if this level holds—don’t rush to chase.
70
Log in to explore more content
Join global crypto users on Binance Square
⚡️ Get latest and useful information about crypto.
💬 Trusted by the world’s largest crypto exchange.
👍 Discover real insights from verified creators.
Email / Phone number
Trending Topics
1
#HuangRisksOusterOverReportedAffairWithSubordinate
65,520 views
894 Discussing
2
#AnthropicRejectsIPODelayValuationinQuestion
524,437 views
4,288 Discussing
3
#CoreWeaveJumps10%On168%RevenueGrowth
93,624 views
1,101 Discussing
4
#ZcashFallsBelow$1000ForFirstTimeSinceSeptember
50,687 views
220 Discussing
5
#MSCIRemovalMayCurbStrategy’sBitcoinBuying
12,462 views
219 Discussing
6
#HKSFCSaysTokenizationMovingToCommercialUse
1,514 views
39 Discussing
7
#CanNvidiaEarningsEaseMarketConcerns?
202,706 views
2,002 Discussing
8
#SouthKoreaToLetExchangesSuspendWithdrawalsOnSuspectedHacks
204 views
13 Discussing
9
#PythAddsNYSERealTimeDataToMarketplace
6,100 views
144 Discussing
10
#SolanaCompanyReports$3.4MQ3Revenue
1,489 views
31 Discussing