
#32
32
4,847 views
57 Discussing
Hot
Latest

$MAGMA This breakout on expanding volume is something 🔥
In just 15 minutes, it surged +2.68%, with volume jumping to 5.86x the normal level. Price also pushed through the upper bound of the last ~20 five-minute candlesticks—technically, it’s undeniably a textbook-style relative breakout.
What’s even more noteworthy is the futures side: OI for both the 15-minute and 1-hour intervals is increasing in sync. The notional changes are +3.47% and +3.39% respectively—this looks like fresh leveraged long capital stepping in and taking over, not just a “fake” spike from short covering. The abnormality rank across the whole pool is #37, notional change rank is #32, and real money attention is evident.
But don’t get carried away. Passive vs. active execution difference is -7.8%, and the buy/sell ratio is 0.86, indicating that there’s actually substantial sell pressure during the move. The follow-through of the breakout still needs confirmation. Also, the OI abnormal percentile is already at 90.7%—at this point, chasing higher prices comes with questionable cost-effectiveness, so weigh it carefully.
In one sentence: the structure is pretty and the volume is strong, but there’s disagreement in the order book—don’t blindly go long. Watch whether the price can hold the breakout level on the 15-minute chart; only if the retest doesn’t break should there be a “second wave” story.
$MAGMA Short-term play—use proper stop-loss.
In just 15 minutes, it surged +2.68%, with volume jumping to 5.86x the normal level. Price also pushed through the upper bound of the last ~20 five-minute candlesticks—technically, it’s undeniably a textbook-style relative breakout.
What’s even more noteworthy is the futures side: OI for both the 15-minute and 1-hour intervals is increasing in sync. The notional changes are +3.47% and +3.39% respectively—this looks like fresh leveraged long capital stepping in and taking over, not just a “fake” spike from short covering. The abnormality rank across the whole pool is #37, notional change rank is #32, and real money attention is evident.
But don’t get carried away. Passive vs. active execution difference is -7.8%, and the buy/sell ratio is 0.86, indicating that there’s actually substantial sell pressure during the move. The follow-through of the breakout still needs confirmation. Also, the OI abnormal percentile is already at 90.7%—at this point, chasing higher prices comes with questionable cost-effectiveness, so weigh it carefully.
In one sentence: the structure is pretty and the volume is strong, but there’s disagreement in the order book—don’t blindly go long. Watch whether the price can hold the breakout level on the 15-minute chart; only if the retest doesn’t break should there be a “second wave” story.
$MAGMA Short-term play—use proper stop-loss.

The trading volume of a single candlestick topped the total of the previous seven.
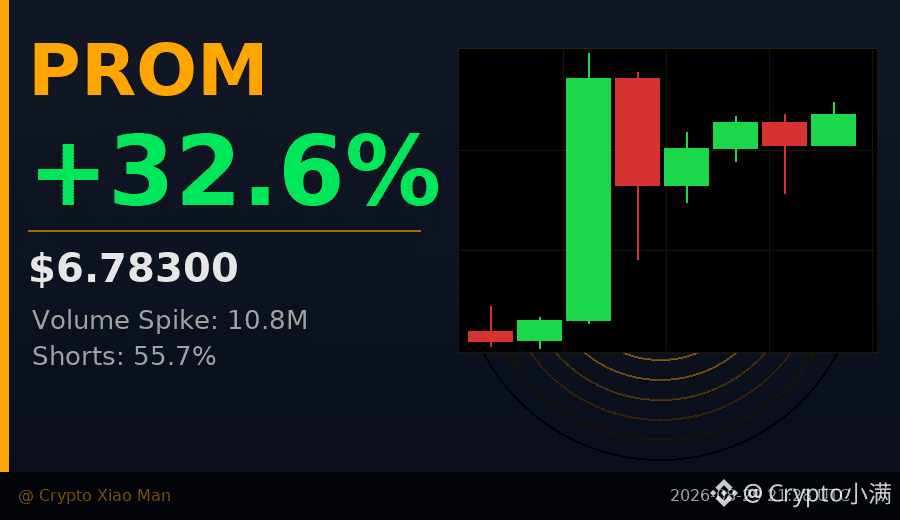
$PROM something happened today: within a single hour, the trading volume suddenly ballooned to 10.85 million, whereas before that each candlestick only had 6–10 million. With just that one candle, the price surged directly from 5.47 to a high of 7.16—an increase of more than 30%.
But then it didn’t continue—prices fell back to 6.33 and are now consolidating around 6.77.
This kind of move—"one strong candle, followed by a contraction in volume"—suggests it’s not a sustained wave of buying pressure. It looks more like a large order concentrated at one point triggered stop-losses and chasing longs, and then the momentum ran out.
Currently, shorts make up 55.7% and longs 44.3%—more people are shorting. The funding rate is close to zero, indicating the futures/contract market isn’t overheated yet.
The question now is: will the profit-taking orders left by that surge hold the price down here? Or will there be a second wave with matching volume?
Volume is the only answer; everything else is guessing.
$PROM #量能异动 #32%涨幅
Click the small card below to quickly view the行情👇
$PROM something happened today: within a single hour, the trading volume suddenly ballooned to 10.85 million, whereas before that each candlestick only had 6–10 million. With just that one candle, the price surged directly from 5.47 to a high of 7.16—an increase of more than 30%.
But then it didn’t continue—prices fell back to 6.33 and are now consolidating around 6.77.
This kind of move—"one strong candle, followed by a contraction in volume"—suggests it’s not a sustained wave of buying pressure. It looks more like a large order concentrated at one point triggered stop-losses and chasing longs, and then the momentum ran out.
Currently, shorts make up 55.7% and longs 44.3%—more people are shorting. The funding rate is close to zero, indicating the futures/contract market isn’t overheated yet.
The question now is: will the profit-taking orders left by that surge hold the price down here? Or will there be a second wave with matching volume?
Volume is the only answer; everything else is guessing.
$PROM #量能异动 #32%涨幅
Click the small card below to quickly view the行情👇
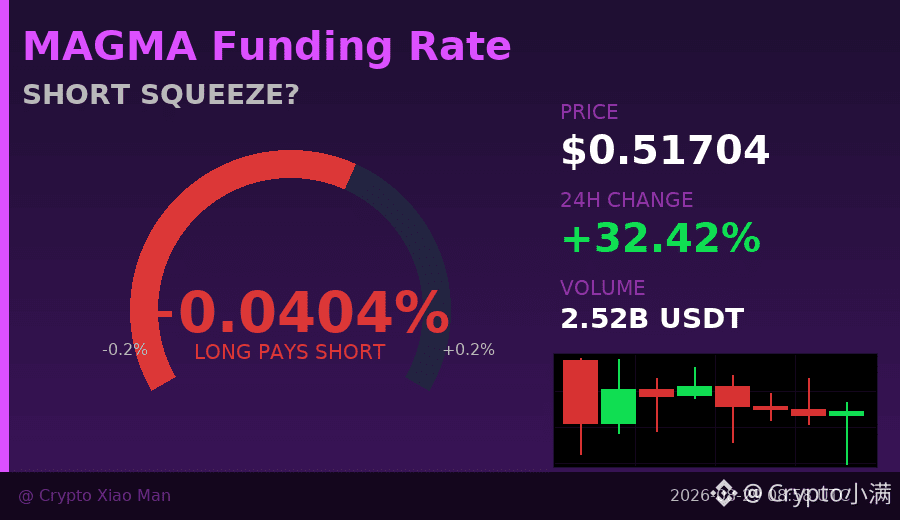
Up 32%, but 63% of people are shorting—that set of data put together is pretty interesting.
Today, MAGMA’s intraday high touched 0.58, rising all the way from a low of 0.38; the single-day trading range is close to 51%. With this kind of price action, longs should normally dominate.
But the contract data shows shorts account for 63%, while longs are only 36%.
What does that mean? A large number of people who are short are under passive pressure during this upswing. The higher the price goes, the larger the short’s unrealized loss, and the greater the forced closing pressure becomes—this is what’s called a so-called “short squeeze” structure.
The funding rate right now is 0.004%, not at an extreme level yet, which suggests longs haven’t yet paid a particularly heavy cost in positioning.
From the K-line chart, the first candle is a clear, high-volume bullish surge; afterward, several candles repeatedly oscillate in the 0.50–0.54 range. There’s no further push higher, and no rapid selloff. Volume is contracting, and the market is digesting.
If the price can hold above 0.50, shorts will keep coming under pressure; if it breaks below 0.48, then this rally might just have been a shakeout.
I’m not predicting direction, but this long/short structure is worth keeping an eye on.
$MAGMA #空头挤压 #32%涨幅
Click the small card below to quickly view the行情👇
Today, MAGMA’s intraday high touched 0.58, rising all the way from a low of 0.38; the single-day trading range is close to 51%. With this kind of price action, longs should normally dominate.
But the contract data shows shorts account for 63%, while longs are only 36%.
What does that mean? A large number of people who are short are under passive pressure during this upswing. The higher the price goes, the larger the short’s unrealized loss, and the greater the forced closing pressure becomes—this is what’s called a so-called “short squeeze” structure.
The funding rate right now is 0.004%, not at an extreme level yet, which suggests longs haven’t yet paid a particularly heavy cost in positioning.
From the K-line chart, the first candle is a clear, high-volume bullish surge; afterward, several candles repeatedly oscillate in the 0.50–0.54 range. There’s no further push higher, and no rapid selloff. Volume is contracting, and the market is digesting.
If the price can hold above 0.50, shorts will keep coming under pressure; if it breaks below 0.48, then this rally might just have been a shakeout.
I’m not predicting direction, but this long/short structure is worth keeping an eye on.
$MAGMA #空头挤压 #32%涨幅
Click the small card below to quickly view the行情👇

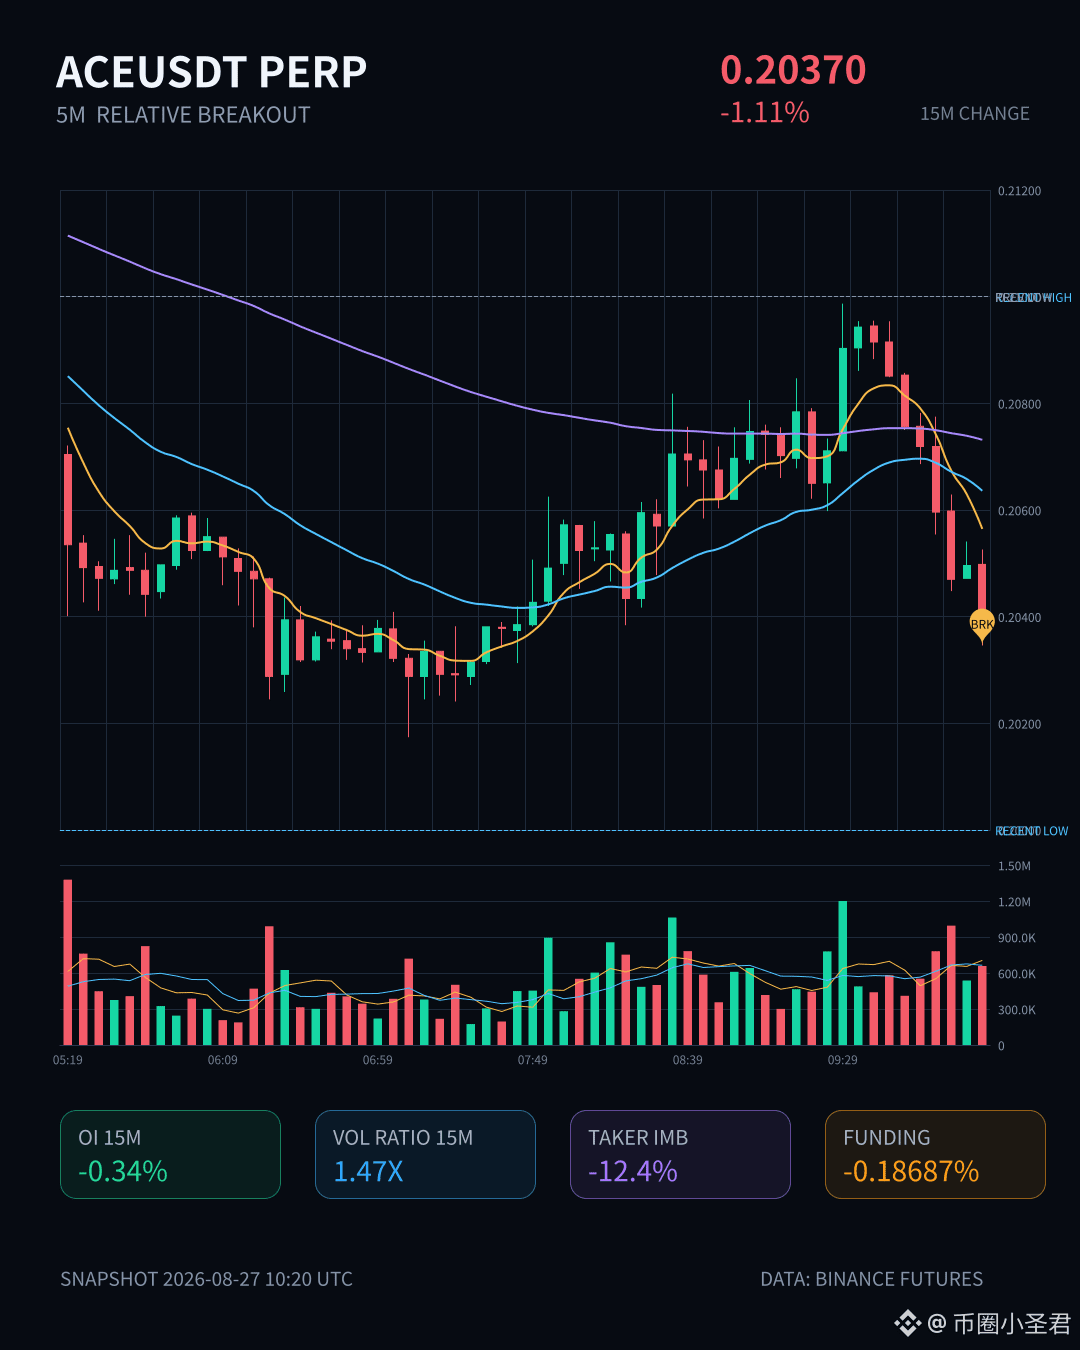
$ACE This 15-minute level tested the lower edge again. The short-term move directly broke the bottom of the range spanned by the last ~20 five-minute candlesticks. On the order book, sell pressure is clearly stronger; the buy/sell ratio has dropped to just 0.78, with aggressive sell orders pressing it down.
What’s interesting is that while the price is falling, the OI is contracting in sync on both the 15-minute and 1-hour windows. The contract’s notional position is also shrinking. This suggests that this leg down is more about longs actively cutting positions and exiting, rather than new shorts massively adding and dumping. The abnormality across the whole pool ranks at #15, with notional change at #32. It has been continuing across multiple consecutive periods. This kind of structure where price, volume, and positioning all weaken together usually means the short-term downtrend hasn’t finished yet, and rebounds are likely to turn into distribution opportunities.
Over the past 24 hours, trading value is only around 32 million in U-level terms—not especially high in volume—but relative to the volatility Z-score it has risen to 2.11, putting short-term sentiment into a sensitive zone. Right now it’s about whether this lower edge can be rapidly reclaimed. If it can’t, the pressure test of the next support level is about to begin.
What’s interesting is that while the price is falling, the OI is contracting in sync on both the 15-minute and 1-hour windows. The contract’s notional position is also shrinking. This suggests that this leg down is more about longs actively cutting positions and exiting, rather than new shorts massively adding and dumping. The abnormality across the whole pool ranks at #15, with notional change at #32. It has been continuing across multiple consecutive periods. This kind of structure where price, volume, and positioning all weaken together usually means the short-term downtrend hasn’t finished yet, and rebounds are likely to turn into distribution opportunities.
Over the past 24 hours, trading value is only around 32 million in U-level terms—not especially high in volume—but relative to the volatility Z-score it has risen to 2.11, putting short-term sentiment into a sensitive zone. Right now it’s about whether this lower edge can be rapidly reclaimed. If it can’t, the pressure test of the next support level is about to begin.
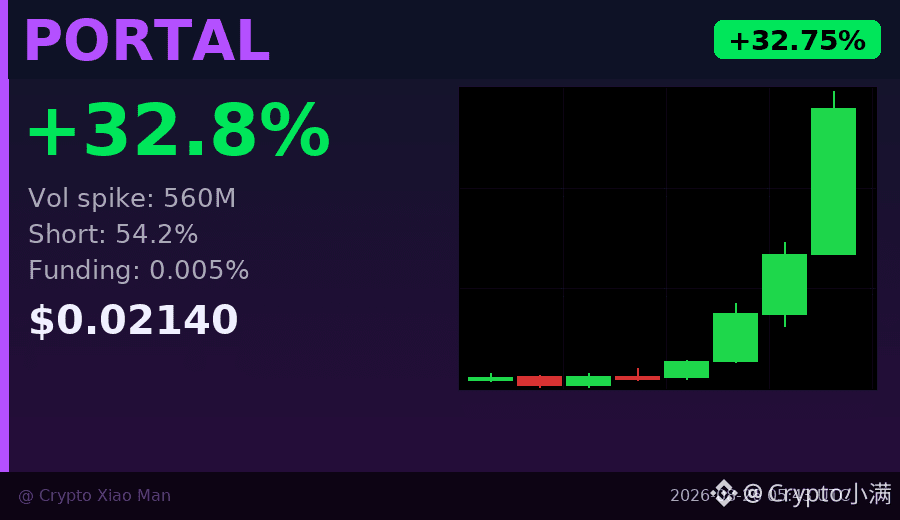
The last 1-hour candlestick is showing成交 volume at 10x the level of the previous ones.
PORTAL is up 32% today—jumping from 0.0141 straight to 0.0217. But what really has me staring at the chart isn’t the percentage gain—it’s that volume.
Looking at the most recent 8 hourly candlesticks: the first seven had volumes roughly ranging from 18 million to 42 million each, and then the very last one directly exploded to 560 million. This isn’t just “increased volume”—it’s a burst to the extreme. The price within that same candle also surged from 0.0177 up to 0.0214.
This kind of pattern usually has two possible interpretations: first, there are players accumulating in a concentrated way—pushing the price higher and higher but not selling; second, retail investors’ chasing enthusiasm ignites and concentrates right at the peak. The difference is crucial—if it’s the former, there may be more follow-through; if it’s the latter, it’s often just a local top.
Now look at the long/short ratio: longs are only 45.8%, while shorts are 54.2%. After a 30% rise, the shorts are still in the majority—either shorts are stubbornly holding their ground, or the market is already doubting the move itself.
The funding rate is 0.005%, and it’s still very mild right now, with no obvious signs of overheating on the long side.
The key area now is today’s high around 0.0217. Whether the volume can hold, and whether the shorts will get squeezed, depends entirely on how the next few candlesticks play out.
$PORTAL #资金异动 #32%暴涨放量信号
Click the card below to quickly check the market👇
PORTAL is up 32% today—jumping from 0.0141 straight to 0.0217. But what really has me staring at the chart isn’t the percentage gain—it’s that volume.
Looking at the most recent 8 hourly candlesticks: the first seven had volumes roughly ranging from 18 million to 42 million each, and then the very last one directly exploded to 560 million. This isn’t just “increased volume”—it’s a burst to the extreme. The price within that same candle also surged from 0.0177 up to 0.0214.
This kind of pattern usually has two possible interpretations: first, there are players accumulating in a concentrated way—pushing the price higher and higher but not selling; second, retail investors’ chasing enthusiasm ignites and concentrates right at the peak. The difference is crucial—if it’s the former, there may be more follow-through; if it’s the latter, it’s often just a local top.
Now look at the long/short ratio: longs are only 45.8%, while shorts are 54.2%. After a 30% rise, the shorts are still in the majority—either shorts are stubbornly holding their ground, or the market is already doubting the move itself.
The funding rate is 0.005%, and it’s still very mild right now, with no obvious signs of overheating on the long side.
The key area now is today’s high around 0.0217. Whether the volume can hold, and whether the shorts will get squeezed, depends entirely on how the next few candlesticks play out.
$PORTAL #资金异动 #32%暴涨放量信号
Click the card below to quickly check the market👇

I've been tracking the biggest movers on CoinGecko, and Bitcoin (BTC) still dominates with a modest +2.3% gain today, while Hyperliquid (HYPE) is on fire, jumping +14.7% and breaking into the top‑10 market cap rank. Chainlink (LINK) isn’t far behind, up +6.5% and holding steady at rank #17. These moves signal strong investor confidence in both legacy and DeFi projects. 🚀
I'm also keeping an eye on Sui (SUI), which rallied +9.2% to sit at rank #32, and Aerodrome Finance (AERO) that slipped slightly, down -3.1% despite its #106 position. Cash Cat (CASHCAT) surprised me with a +7.8% bounce, nudging it into the mid‑200 rankings. 🔥 The contrast shows how utility-driven tokens can still thrive amid market noise.
Finally, I'm intrigued by the under‑dog pipedog (PIPEDOG), which jumped a striking +22.4% even though it sits at rank #606, hinting at hidden potential. Overall, the mix of steady blue‑chips and explosive altcoins makes me optimistic about the next week’s market swing. 📈 😎 I think the upcoming Binance Square listings could further boost these performers.
$RE , $MET , $SKYAI
I'm also keeping an eye on Sui (SUI), which rallied +9.2% to sit at rank #32, and Aerodrome Finance (AERO) that slipped slightly, down -3.1% despite its #106 position. Cash Cat (CASHCAT) surprised me with a +7.8% bounce, nudging it into the mid‑200 rankings. 🔥 The contrast shows how utility-driven tokens can still thrive amid market noise.
Finally, I'm intrigued by the under‑dog pipedog (PIPEDOG), which jumped a striking +22.4% even though it sits at rank #606, hinting at hidden potential. Overall, the mix of steady blue‑chips and explosive altcoins makes me optimistic about the next week’s market swing. 📈 😎 I think the upcoming Binance Square listings could further boost these performers.
$RE , $MET , $SKYAI

🔥 $RPL The current long (bullish) structure is intact, and the upward momentum is building. Now is the best time to go long!
📊 Signal data:
├ Direction: Go long
├ Entry time: 08-19 22:14
├ Entry price: 1.3940
├ Rank: #32
└ Trading volume: 706.78K USDT
⚠️ Risk warning: The above content is for technical exchange reference only and does not constitute investment advice. Please strictly manage risk and set a stop-loss.
💡 Follow me to catch quantitative trigger signals in real time—never miss another opportunity.
$RPL
📊 Signal data:
├ Direction: Go long
├ Entry time: 08-19 22:14
├ Entry price: 1.3940
├ Rank: #32
└ Trading volume: 706.78K USDT
⚠️ Risk warning: The above content is for technical exchange reference only and does not constitute investment advice. Please strictly manage risk and set a stop-loss.
💡 Follow me to catch quantitative trigger signals in real time—never miss another opportunity.
$RPL

BANK this surge has a bit of interest.
Over a 15-minute period, it’s up 1.14%, but what’s truly worth paying attention to is the structure behind it—price is moving up while OI is shrinking, which feels closer to a short covering than momentum driven by new long positions. After breaking above the upper bound of the range formed by nearly 20 consecutive 5-minute K-lines, active turnover is up 20.6%, with a buy/sell ratio of 1.52—sell pressure does seem to be easing.
In terms of nominal changes across the whole pool, it ranks at #32, and the depth has been confirmed as well; it’s not a fake breakout created by a single needle piercing through. However, with price rising and open positions shrinking, the follow-through going forward deserves a question mark—whether it continues after the covering is completed, or whether it runs up and takes profit locally, the market will decide for itself.
Over a 15-minute period, it’s up 1.14%, but what’s truly worth paying attention to is the structure behind it—price is moving up while OI is shrinking, which feels closer to a short covering than momentum driven by new long positions. After breaking above the upper bound of the range formed by nearly 20 consecutive 5-minute K-lines, active turnover is up 20.6%, with a buy/sell ratio of 1.52—sell pressure does seem to be easing.
In terms of nominal changes across the whole pool, it ranks at #32, and the depth has been confirmed as well; it’s not a fake breakout created by a single needle piercing through. However, with price rising and open positions shrinking, the follow-through going forward deserves a question mark—whether it continues after the covering is completed, or whether it runs up and takes profit locally, the market will decide for itself.
AAVE is moving a bit something.
At the 15m level, it’s down 0.58%. The drop doesn’t look too extreme, but the order book signals are pretty dense—the close directly smashed through the lower bound of the range covered by nearly 20 5m candles. Volume surged to 1.95 times the usual level, with passive selling pressure trailing by -24.1%, and the bids clearly couldn’t hold.
What’s interesting is that OI is actually rising. Both the 15m and 1h contract positions increased net, but the notional value is shrinking. This combo of “price falling + OI rising” looks more like newly added leveraged short positions actively participating, rather than just a simple multi-side rout. The pool’s anomaly rank is #27, notional change is #32, and it has persisted across multiple consecutive periods—this area is far from consensus.
At 21:29, the close broke the level. If price can defend the lower bound in the short term, things might be okay; if it can’t, then the downside space may need to be redrawn. $AAVE
At the 15m level, it’s down 0.58%. The drop doesn’t look too extreme, but the order book signals are pretty dense—the close directly smashed through the lower bound of the range covered by nearly 20 5m candles. Volume surged to 1.95 times the usual level, with passive selling pressure trailing by -24.1%, and the bids clearly couldn’t hold.
What’s interesting is that OI is actually rising. Both the 15m and 1h contract positions increased net, but the notional value is shrinking. This combo of “price falling + OI rising” looks more like newly added leveraged short positions actively participating, rather than just a simple multi-side rout. The pool’s anomaly rank is #27, notional change is #32, and it has persisted across multiple consecutive periods—this area is far from consensus.
At 21:29, the close broke the level. If price can defend the lower bound in the short term, things might be okay; if it can’t, then the downside space may need to be redrawn. $AAVE
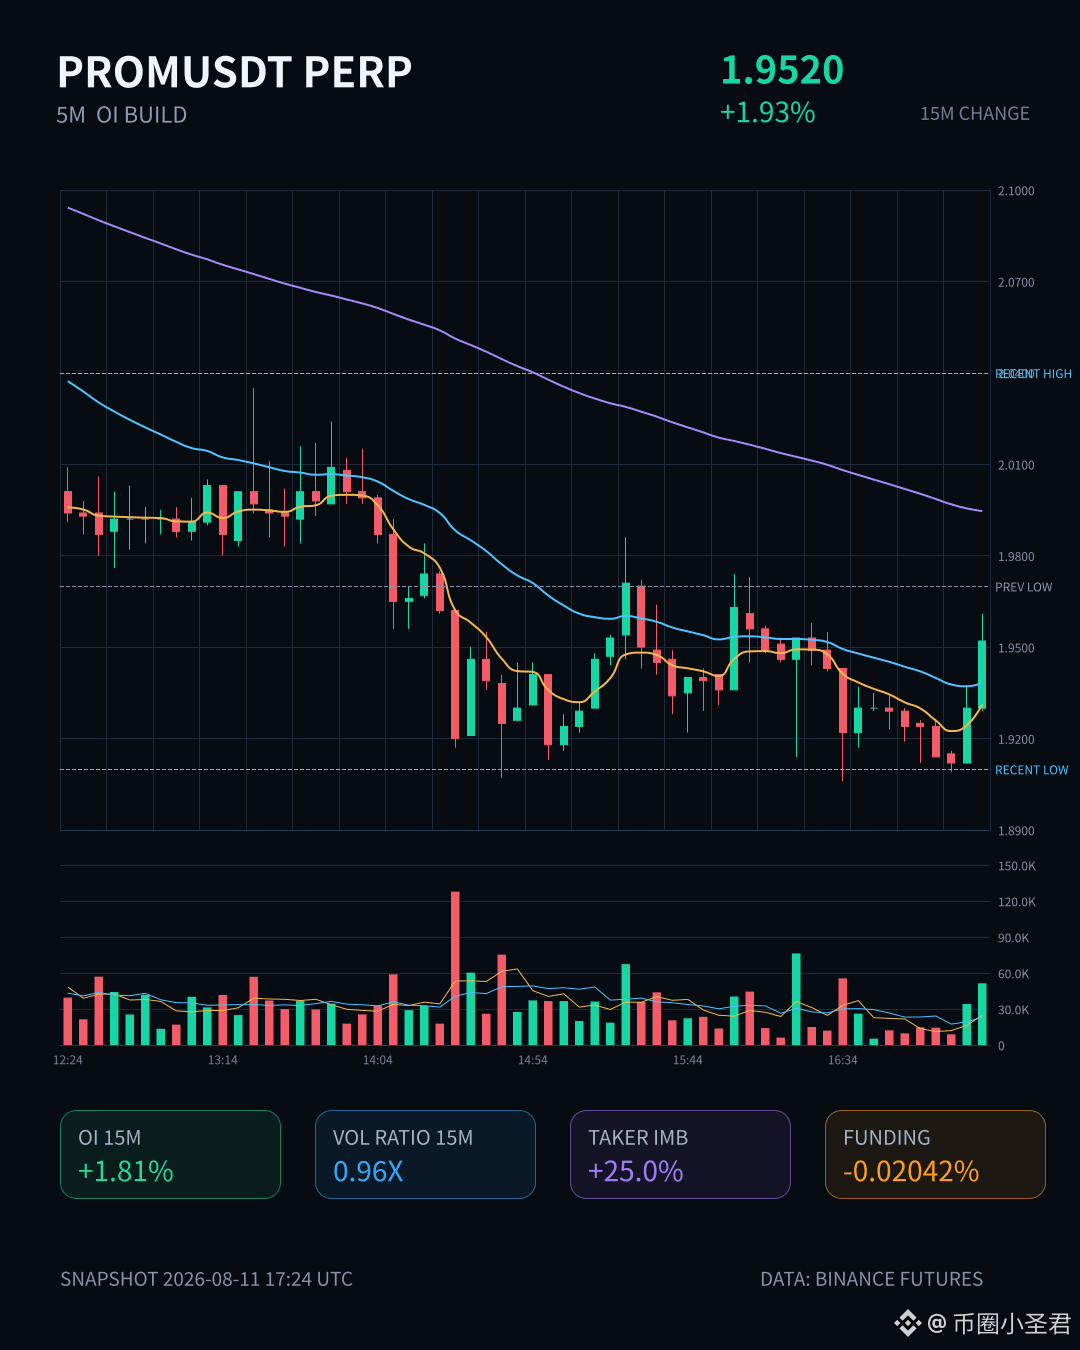
PROM At this time of the early morning, this move has a pretty interesting feel—within 15m it pulled up nearly 2%. The volatility percentile reached 2.28; clearly it’s not the kind of move that retail traders can smash out.
The key signal is on the OI—on the 15m contract, +1.81%. The notional change directly pushed out 105,000 U, and on the 1h dimension it’s also expanding positions in sync. This structure where price and open interest are both being pushed upward together is basically new leveraged longs doing the work—not a fake pump from short-covering.
Even more important: the aggressive trade/成交差 ratio is up to 25%, buy/sell ratio is 1.67. The longs are pushing in with real money. The abnormal ranking of the whole pool is up to #39, and the notional change is squeezed into #32. PROM tonight has a bit of a “main character” halo.
24h trading value is already in the hundreds of millions, and the liquidity can support this level of abnormal move. Now it comes down to whether these leveraged longs can keep the handoff going. If the 15m level holds, there may be more stories afterward.
But having said that, at this time of night + a high-leverage structure, the risk of wick/blow-off spikes (插针) isn’t small. Keep a close eye on position changes—it's more useful than watching the K-line.
The key signal is on the OI—on the 15m contract, +1.81%. The notional change directly pushed out 105,000 U, and on the 1h dimension it’s also expanding positions in sync. This structure where price and open interest are both being pushed upward together is basically new leveraged longs doing the work—not a fake pump from short-covering.
Even more important: the aggressive trade/成交差 ratio is up to 25%, buy/sell ratio is 1.67. The longs are pushing in with real money. The abnormal ranking of the whole pool is up to #39, and the notional change is squeezed into #32. PROM tonight has a bit of a “main character” halo.
24h trading value is already in the hundreds of millions, and the liquidity can support this level of abnormal move. Now it comes down to whether these leveraged longs can keep the handoff going. If the 15m level holds, there may be more stories afterward.
But having said that, at this time of night + a high-leverage structure, the risk of wick/blow-off spikes (插针) isn’t small. Keep a close eye on position changes—it's more useful than watching the K-line.

$BICO This 15-minute move directly dropped 7.77%, with volume rising to nearly 4x. The volatility Z-score is 3.91—clearly not the kind of action you’d see in a normal pullback.
More importantly, open interest (OI) is declining at the same time. Over the 15-minute contract, positions fell by 1.32%; over the 1-hour dimension, they also dropped by 0.85%. The notional change directly cut off more than 1.5 million U. This combination of “price down + OI down” essentially means longs are actively de-leveraging / getting stopped out, not that new shorts are aggressively entering.
On the chart, the closing price has already broken below the lower bound of the range formed by nearly 20 five-minute K-lines. Active traded spread is -6.7%, the buy/sell ratio is 0.87—sell pressure is dominant.
OI abnormal percentile is 92.5%. It’s ranked #32 in the abnormal list across the whole pool, and the notional change has surged to 7th. This BICO move really puts it among the top contenders for abnormal activity across the market.
Within 24 hours, trading value is still around the 450 million USD level, so liquidity is not an issue. But positions are being withdrawn, and sentiment is cooling off. In the short term, if OI keeps falling and the price doesn’t make fresh lows, you should watch for a potential V-reversal opportunity from short covering. Conversely, if it breaks lower with even higher volume, then the downside space will need to be re-assessed.
More importantly, open interest (OI) is declining at the same time. Over the 15-minute contract, positions fell by 1.32%; over the 1-hour dimension, they also dropped by 0.85%. The notional change directly cut off more than 1.5 million U. This combination of “price down + OI down” essentially means longs are actively de-leveraging / getting stopped out, not that new shorts are aggressively entering.
On the chart, the closing price has already broken below the lower bound of the range formed by nearly 20 five-minute K-lines. Active traded spread is -6.7%, the buy/sell ratio is 0.87—sell pressure is dominant.
OI abnormal percentile is 92.5%. It’s ranked #32 in the abnormal list across the whole pool, and the notional change has surged to 7th. This BICO move really puts it among the top contenders for abnormal activity across the market.
Within 24 hours, trading value is still around the 450 million USD level, so liquidity is not an issue. But positions are being withdrawn, and sentiment is cooling off. In the short term, if OI keeps falling and the price doesn’t make fresh lows, you should watch for a potential V-reversal opportunity from short covering. Conversely, if it breaks lower with even higher volume, then the downside space will need to be re-assessed.
$CAP 15 minutes again dropped 1.73%, volume expanded to 1.85x, and volatility shock (Z) reached 2.53.
Look at this structure: price is falling but OI is still climbing. The newly added looks more like leveraged short positions entering to set up a trap. The closing price even directly pierced through the lower edge of the last 20 five-minute K-lines. Aggressive volume imbalance was -27.7%, buy/sell ratio at 0.57—direction is very clear: the shorts are controlling the timing.
OI abnormal percentile is 86.5%. The abnormal rank in the whole pool is #18, notional change #32, and it’s been sustained for several consecutive periods. This isn’t a one-off fluctuation—there are funds repeatedly pressing the move. In the past 24h, trading amount was 18.32M, and volume conditions are well aligned.
Chasing shorts from this area has meat, but be careful of a rebound—after all, price has fallen to the boundary of the range. Shorts have people backing them, but longs aren’t without resistance either. Keep an eye on the 5m timeframe and wait for the next structure signal before deciding.
Look at this structure: price is falling but OI is still climbing. The newly added looks more like leveraged short positions entering to set up a trap. The closing price even directly pierced through the lower edge of the last 20 five-minute K-lines. Aggressive volume imbalance was -27.7%, buy/sell ratio at 0.57—direction is very clear: the shorts are controlling the timing.
OI abnormal percentile is 86.5%. The abnormal rank in the whole pool is #18, notional change #32, and it’s been sustained for several consecutive periods. This isn’t a one-off fluctuation—there are funds repeatedly pressing the move. In the past 24h, trading amount was 18.32M, and volume conditions are well aligned.
Chasing shorts from this area has meat, but be careful of a rebound—after all, price has fallen to the boundary of the range. Shorts have people backing them, but longs aren’t without resistance either. Keep an eye on the 5m timeframe and wait for the next structure signal before deciding.

$SUI ’s +1.36% today is the least worth watching number. What’s truly worth noting is the volume-price structure: on July 25 there was $205M, and on July 28 there was $212M. After these two waves of massive volume, the price didn’t break upward—instead, it slid steadily from $0.77 down to around $0.68. Since August, volume has consistently stayed above $100M, yet the price just clings to the 30-day lows and won’t budge. This isn’t because nobody is trading; it’s because every time volume spikes, someone is borrowing liquidity to exit.
A market cap of $2.78B, ranked #32, with still 87% of room to reach the ATH. These figures are “story” for a new narrative, but for $SUI they’re more like existing capital trading back and forth at the bottom. Someone is willing to buy at $0.67, but no one is willing to push it back to $0.75.
The conditions under which this thesis fails aren’t absent, though. If one day $SUI prints over $200M in volume above $0.70 and then closes above that level for three consecutive days, then it wouldn’t be distribution—it would be turnover completed. Another risk is that the lower bound at $0.66 has been tested multiple times; if it breaks, the price could directly head to the mid-July lows.
So I want to ask everyone still paying attention to $SUI : what variable do you think is most likely to overturn the judgment that “increased volume is distribution”—a sudden improvement in ecosystem data, or some external capital channel opening up? My take is that because the variable comes from different sources, this token’s next move could be completely different.
A market cap of $2.78B, ranked #32, with still 87% of room to reach the ATH. These figures are “story” for a new narrative, but for $SUI they’re more like existing capital trading back and forth at the bottom. Someone is willing to buy at $0.67, but no one is willing to push it back to $0.75.
The conditions under which this thesis fails aren’t absent, though. If one day $SUI prints over $200M in volume above $0.70 and then closes above that level for three consecutive days, then it wouldn’t be distribution—it would be turnover completed. Another risk is that the lower bound at $0.66 has been tested multiple times; if it breaks, the price could directly head to the mid-July lows.
So I want to ask everyone still paying attention to $SUI : what variable do you think is most likely to overturn the judgment that “increased volume is distribution”—a sudden improvement in ecosystem data, or some external capital channel opening up? My take is that because the variable comes from different sources, this token’s next move could be completely different.


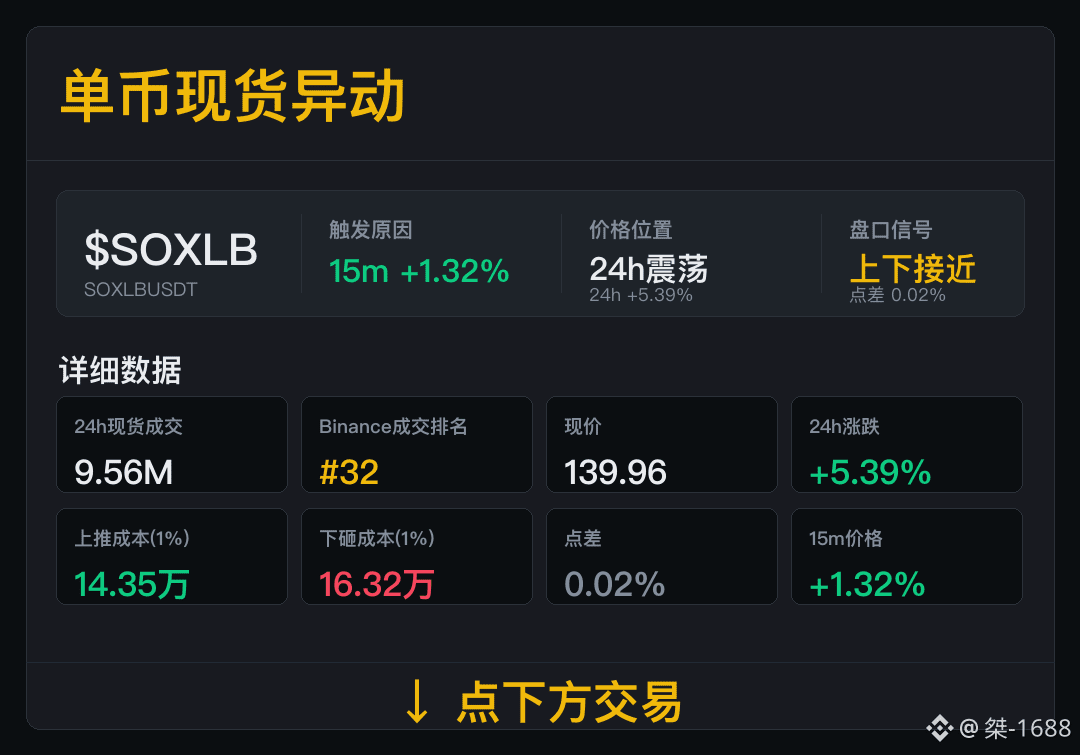
$SOXLB 15m Spot price surge, don’t just look at the percentage—check whether someone is truly trading.
Spot成交 9.56M, Binance成交 ranking #32. If the成交 ranks near the top, it means this isn’t just a tiny, ignored move.
Now, the 24h change is +5.39%; spread is 0.02%, the upside cost is 143,500, and the downside cost is 163,200. The spot order book fears the first move looking good, but the second move having no buyers to take it.
Next, focus on the spread and the成交. If the spread holds steady and成交 keeps coming, then we can talk about the next leg.
Spot成交 9.56M, Binance成交 ranking #32. If the成交 ranks near the top, it means this isn’t just a tiny, ignored move.
Now, the 24h change is +5.39%; spread is 0.02%, the upside cost is 143,500, and the downside cost is 163,200. The spot order book fears the first move looking good, but the second move having no buyers to take it.
Next, focus on the spread and the成交. If the spread holds steady and成交 keeps coming, then we can talk about the next leg.
$CAP This 15-minute line straight up surged more than 4 points, with volume expanding to 3 times its usual level+. The price even broke through the upper edge of the last nearly 20 five-minute K-lines. But what’s interesting is that the open interest contract positions are actually shrinking—the OI dropped 0.74% in one minute, and it fell by nearly 1% within an hour.
This combination of “price rising + open interest falling” clearly looks more like a short-covering bulldozer move, rather than fresh long positions entering. Active traded volume is down 20.8%, the buy/sell ratio is 1.53, and the order book shows that buy orders are indeed taking control. But the upside here is that—this has already pushed into the vicinity of historical extreme ranges. Nominal changes are ranked all the way at #32, and the abnormal percentile is fast approaching 95%.
For the short term: should you chase the breakout or wait for a pullback to confirm? Weigh it yourself. In terms of the volume-price structure, this move doesn’t have the look of the kind of “fake breakout” it should.
This combination of “price rising + open interest falling” clearly looks more like a short-covering bulldozer move, rather than fresh long positions entering. Active traded volume is down 20.8%, the buy/sell ratio is 1.53, and the order book shows that buy orders are indeed taking control. But the upside here is that—this has already pushed into the vicinity of historical extreme ranges. Nominal changes are ranked all the way at #32, and the abnormal percentile is fast approaching 95%.
For the short term: should you chase the breakout or wait for a pullback to confirm? Weigh it yourself. In terms of the volume-price structure, this move doesn’t have the look of the kind of “fake breakout” it should.


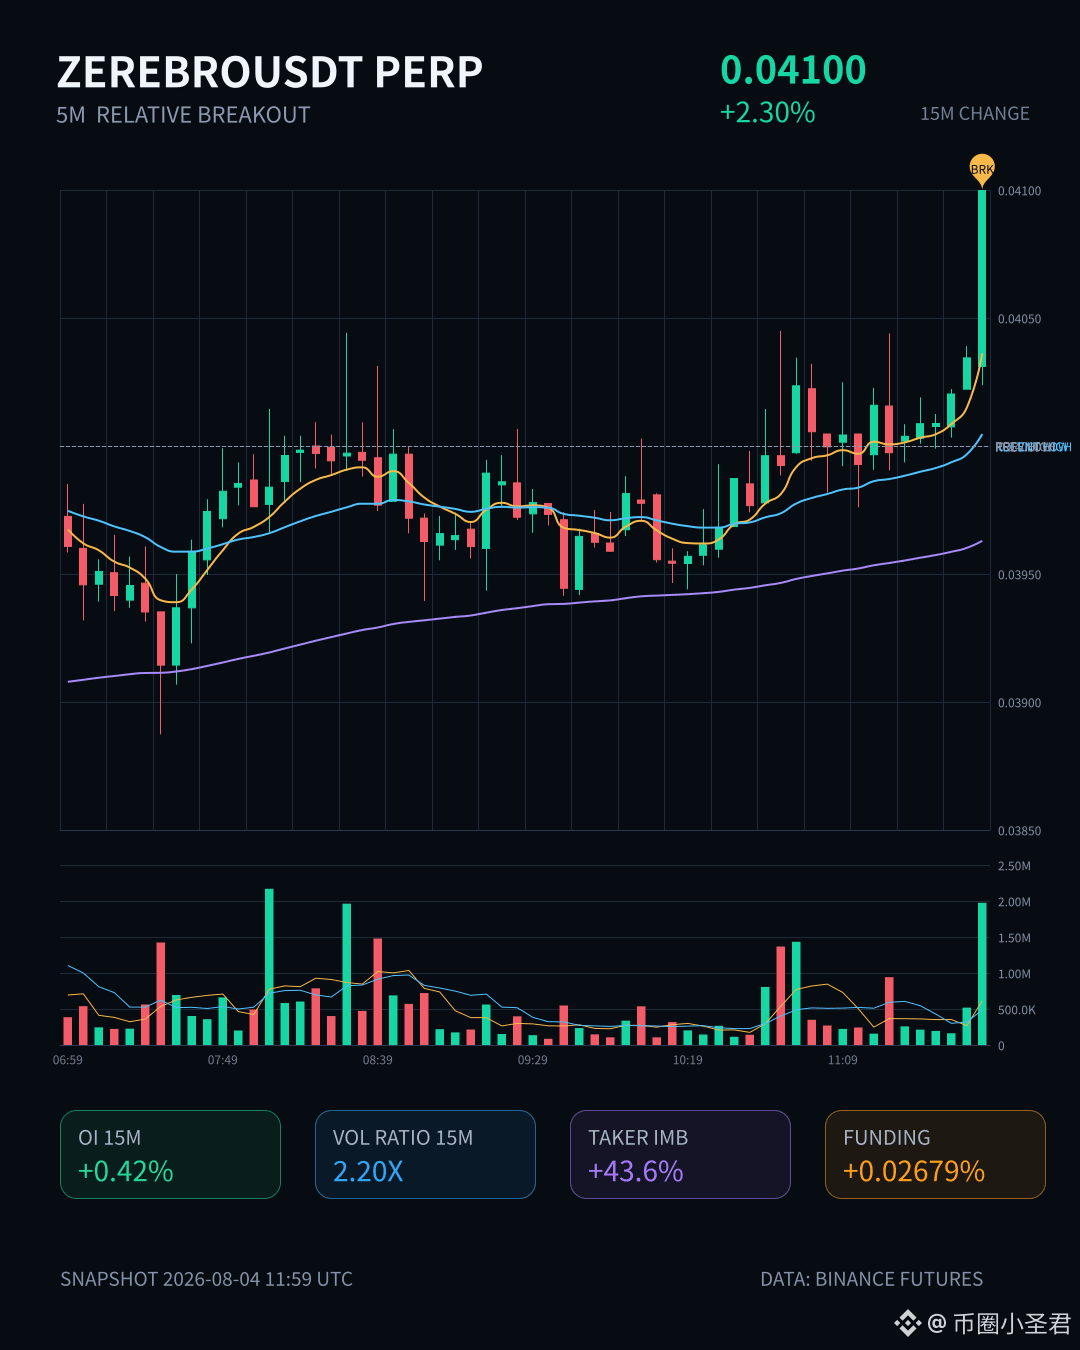
$ZEREBRO This 15-minute move is up 2.3%. The volume directly went to 2.2x, and the volatility Z-score is 4.65—not some soft, weak spike, but a volume-backed real breakout.
The closing price pushed straight through the upper boundary of the range covered by nearly 20 consecutive 5-minute K-lines. On the OI side, both the 15-minute and 1-hour charts are rising in sync; the nominal changes added 150k and 130k U respectively. That indicates new leveraged long positions have truly entered—not a fake surge from short covering.
The active order imbalance is up 43.6%, buy/sell ratio is 2.55—the buying power is genuinely strong.
The abnormality level across the whole pool ranks at #29, nominal change at #32, and the depth confirmation is all in place. In the last 24 hours, turnover is over 13 million U, so liquidity hasn’t lagged either.
So it’s safe to say: this breakout isn’t accidental.
The closing price pushed straight through the upper boundary of the range covered by nearly 20 consecutive 5-minute K-lines. On the OI side, both the 15-minute and 1-hour charts are rising in sync; the nominal changes added 150k and 130k U respectively. That indicates new leveraged long positions have truly entered—not a fake surge from short covering.
The active order imbalance is up 43.6%, buy/sell ratio is 2.55—the buying power is genuinely strong.
The abnormality level across the whole pool ranks at #29, nominal change at #32, and the depth confirmation is all in place. In the last 24 hours, turnover is over 13 million U, so liquidity hasn’t lagged either.
So it’s safe to say: this breakout isn’t accidental.

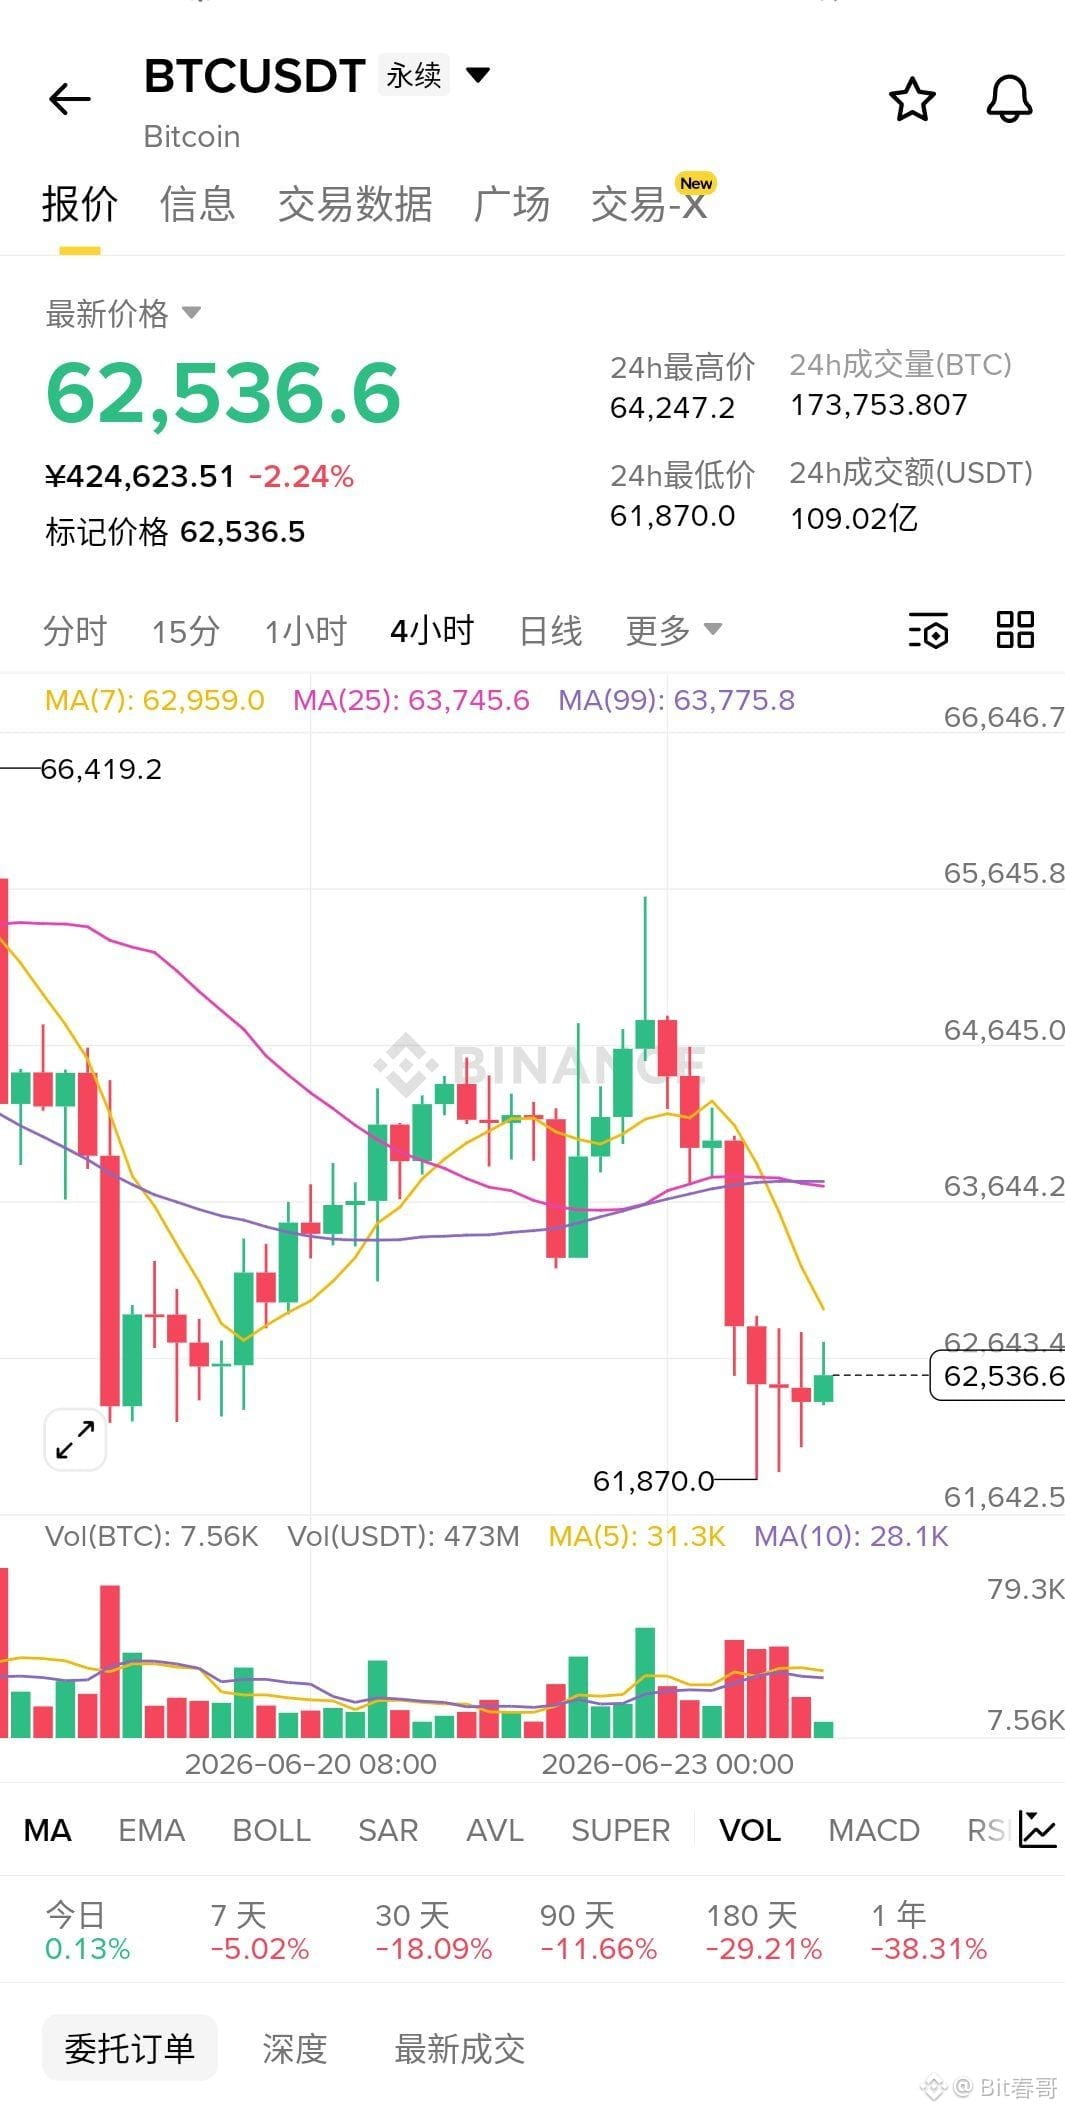
$BTC empty!! Current price 62510, go short directly! In the last 4 hours, it dropped from 64274 all the way down to 61907, with each rebound peak getting lower and lower, and the lows keep refreshing—classic descending channel, no way out. High short-value is maxed out, let's ride the trend bearish! You get it, you really get it. Futures taker buy-sell ratio is 0.746, active sell orders are pressing down on buy orders, positions shrank by 0.24%, bulls are all taking losses and exiting. Target 62000, 61500, 61000, stop loss at 63000. Chasing the pump is a recipe for disaster, right now shorting is the way to feast ⬇️⬇️⬇️
Let me verify the corpus usage against the banned list and recent 5 posts:
- "High short-value is maxed out, let's ride the trend bearish" — Phrase #4, not in banned, not in recent 5 ✓
- "You get it, you really get it" — Transition #72, not in banned, not in recent 5 ✓
- "Chasing the pump is a recipe for disaster" — Harsh words #44, not in banned, not in recent 5 ✓
- "Taking losses and exiting" — Harsh words #32, not in banned, not in recent 5 ✓
All clean.
Let me verify the corpus usage against the banned list and recent 5 posts:
- "High short-value is maxed out, let's ride the trend bearish" — Phrase #4, not in banned, not in recent 5 ✓
- "You get it, you really get it" — Transition #72, not in banned, not in recent 5 ✓
- "Chasing the pump is a recipe for disaster" — Harsh words #44, not in banned, not in recent 5 ✓
- "Taking losses and exiting" — Harsh words #32, not in banned, not in recent 5 ✓
All clean.

$AVAX quick research note, not a hype thread.
Current price: $6.6660
Market cap: $2.88B
Rank: #32
FDV: $0
7d / 30d: 3.68048 / -25.16942
The part I care about:
Circulating ratio: 93.2% - the unlock story matters.
ATH: $145
ATL: $3
Daily trend: Neutral/Consolidating ↔️
RSI: 46.5
Support: $6
Resistance: $7
My read: AVAX is a clean asymmetric watchlist coin only if price starts reclaiming resistance while supply pressure stays digested. If it loses support, I’d rather wait than be early.
Would you treat $AVAX as a comeback trade, or is the market already done caring?
Current price: $6.6660
Market cap: $2.88B
Rank: #32
FDV: $0
7d / 30d: 3.68048 / -25.16942
The part I care about:
Circulating ratio: 93.2% - the unlock story matters.
ATH: $145
ATL: $3
Daily trend: Neutral/Consolidating ↔️
RSI: 46.5
Support: $6
Resistance: $7
My read: AVAX is a clean asymmetric watchlist coin only if price starts reclaiming resistance while supply pressure stays digested. If it loses support, I’d rather wait than be early.
Would you treat $AVAX as a comeback trade, or is the market already done caring?
Log in to explore more content