
#15
15
35,411 views
224 Discussing
Hot
Latest

·
--
Cryptocurrency mining company American Bitcoin Corp (known on the Nasdaq exchange under the ticker ABTC) officially announced the execution of a reverse stock split (Reverse Stock Split) at a ratio of 1 for 15. Share reduction: This split will reduce the company’s issued shares from approximately 1.09 billion shares to about 73 million shares (specifically, a 93.3% reduction). This means the consolidation of shares: every 15 old shares that an investor holds in their portfolio will be automatically consolidated into one corresponding share, and the stock will immediately increase by #15 x to offset the decline. This will take effect officially after the stock market closes on July 2, and trading in the shares will begin on July 6, 2026.
Cryptocurrency mining company American Bitcoin Corp (known on the Nasdaq exchange under the ticker ABTC) officially announced the execution of a reverse stock split (Reverse Stock Split) at a ratio of 1 for 15. Share reduction: This split will reduce the company’s issued shares from approximately 1.09 billion shares to about 73 million shares (specifically, a 93.3% reduction). This means the consolidation of shares: every 15 old shares that an investor holds in their portfolio will be automatically consolidated into one corresponding share, and the stock will immediately increase by #15 x to offset the decline. This will take effect officially after the stock market closes on July 2, and trading in the shares will begin on July 6, 2026.

ABTCUS-0.06%
128


·
--
BULLA Volatility AnalysisBULLA This alert pops up: +27.9% in 24h, still in a continued-uptrend state. Split into 60, but even the bot itself marked it as "too late"—the wave of late additions 5.2 hours ago has continued in the same direction. In plain terms, this is the second leg of the move, not the trigger point.
First look at volume and price. 5m: +1.9%, 1h: +7.2%, and volume is only 2.0x, with OI +1.6%. This combination is kind of interesting: price is being pushed upward, but volume only increases moderately, and open interest doesn’t show any clear buildup. What does that mean? It’s not fresh money rushing in; it’s more like existing capital is pushing, or short positions are being closed passively. This structure can still run, but it won’t go far—once it can’t push anymore, it will pull back.
BULLA Volatility Analysis
BULLA This alert pops up: +27.9% in 24h, still in a continued-uptrend state. Split into 60, but even the bot itself marked it as "too late"—the wave of late additions 5.2 hours ago has continued in the same direction. In plain terms, this is the second leg of the move, not the trigger point.
First look at volume and price. 5m: +1.9%, 1h: +7.2%, and volume is only 2.0x, with OI +1.6%. This combination is kind of interesting: price is being pushed upward, but volume only increases moderately, and open interest doesn’t show any clear buildup. What does that mean? It’s not fresh money rushing in; it’s more like existing capital is pushing, or short positions are being closed passively. This structure can still run, but it won’t go far—once it can’t push anymore, it will pull back.
First look at volume and price. 5m: +1.9%, 1h: +7.2%, and volume is only 2.0x, with OI +1.6%. This combination is kind of interesting: price is being pushed upward, but volume only increases moderately, and open interest doesn’t show any clear buildup. What does that mean? It’s not fresh money rushing in; it’s more like existing capital is pushing, or short positions are being closed passively. This structure can still run, but it won’t go far—once it can’t push anymore, it will pull back.
137

·
--
$RAYSOL It’s kind of interesting how this spike happened late at night.
Over 15 minutes, it rose 1%. The order book shows buy-side initiative is stronger (buy/sell ratio 1.18). The driving force isn’t retail chasing—it's leveraged longs adding to positions. Open interest for the contracts surged 2.49% in the short term, with an implied entry of 277K. The funding rate is also sitting at a high level. The logic is pretty smooth—this is a typical incremental-leverage buildup market.
But honestly, while it ripped up hard over 15 minutes, on the 1-hour timeframe it’s actually reducing positions (-417K). That suggests the newcomers in this window are more aggressive: it’s not steady pushing upward, but quick in and quick out when liquidity is fast, make a quick chunk and leave.
RAYSOL is unusually ranked #15 in the pool. That kind of activity rank isn’t small. Funding-rate percentile is high, and long-side momentum is active. As long as the funding rate doesn’t get out of control, the short-term momentum should still be there.
But as usual—leveraged markets move fast but don’t go far. Keep an eye on the position size. Once, at the 15-minute level, you see a sharp drop with OI simultaneously getting smashed, that crew may run away even faster than the pump itself.
$RAYSOL It’s kind of interesting how this spike happened late at night.
Over 15 minutes, it rose 1%. The order book shows buy-side initiative is stronger (buy/sell ratio 1.18). The driving force isn’t retail chasing—it's leveraged longs adding to positions. Open interest for the contracts surged 2.49% in the short term, with an implied entry of 277K. The funding rate is also sitting at a high level. The logic is pretty smooth—this is a typical incremental-leverage buildup market.
But honestly, while it ripped up hard over 15 minutes, on the 1-hour timeframe it’s actually reducing positions (-417K). That suggests the newcomers in this window are more aggressive: it’s not steady pushing upward, but quick in and quick out when liquidity is fast, make a quick chunk and leave.
RAYSOL is unusually ranked #15 in the pool. That kind of activity rank isn’t small. Funding-rate percentile is high, and long-side momentum is active. As long as the funding rate doesn’t get out of control, the short-term momentum should still be there.
But as usual—leveraged markets move fast but don’t go far. Keep an eye on the position size. Once, at the 15-minute level, you see a sharp drop with OI simultaneously getting smashed, that crew may run away even faster than the pump itself.
Over 15 minutes, it rose 1%. The order book shows buy-side initiative is stronger (buy/sell ratio 1.18). The driving force isn’t retail chasing—it's leveraged longs adding to positions. Open interest for the contracts surged 2.49% in the short term, with an implied entry of 277K. The funding rate is also sitting at a high level. The logic is pretty smooth—this is a typical incremental-leverage buildup market.
But honestly, while it ripped up hard over 15 minutes, on the 1-hour timeframe it’s actually reducing positions (-417K). That suggests the newcomers in this window are more aggressive: it’s not steady pushing upward, but quick in and quick out when liquidity is fast, make a quick chunk and leave.
RAYSOL is unusually ranked #15 in the pool. That kind of activity rank isn’t small. Funding-rate percentile is high, and long-side momentum is active. As long as the funding rate doesn’t get out of control, the short-term momentum should still be there.
But as usual—leveraged markets move fast but don’t go far. Keep an eye on the position size. Once, at the 15-minute level, you see a sharp drop with OI simultaneously getting smashed, that crew may run away even faster than the pump itself.
50

·
--
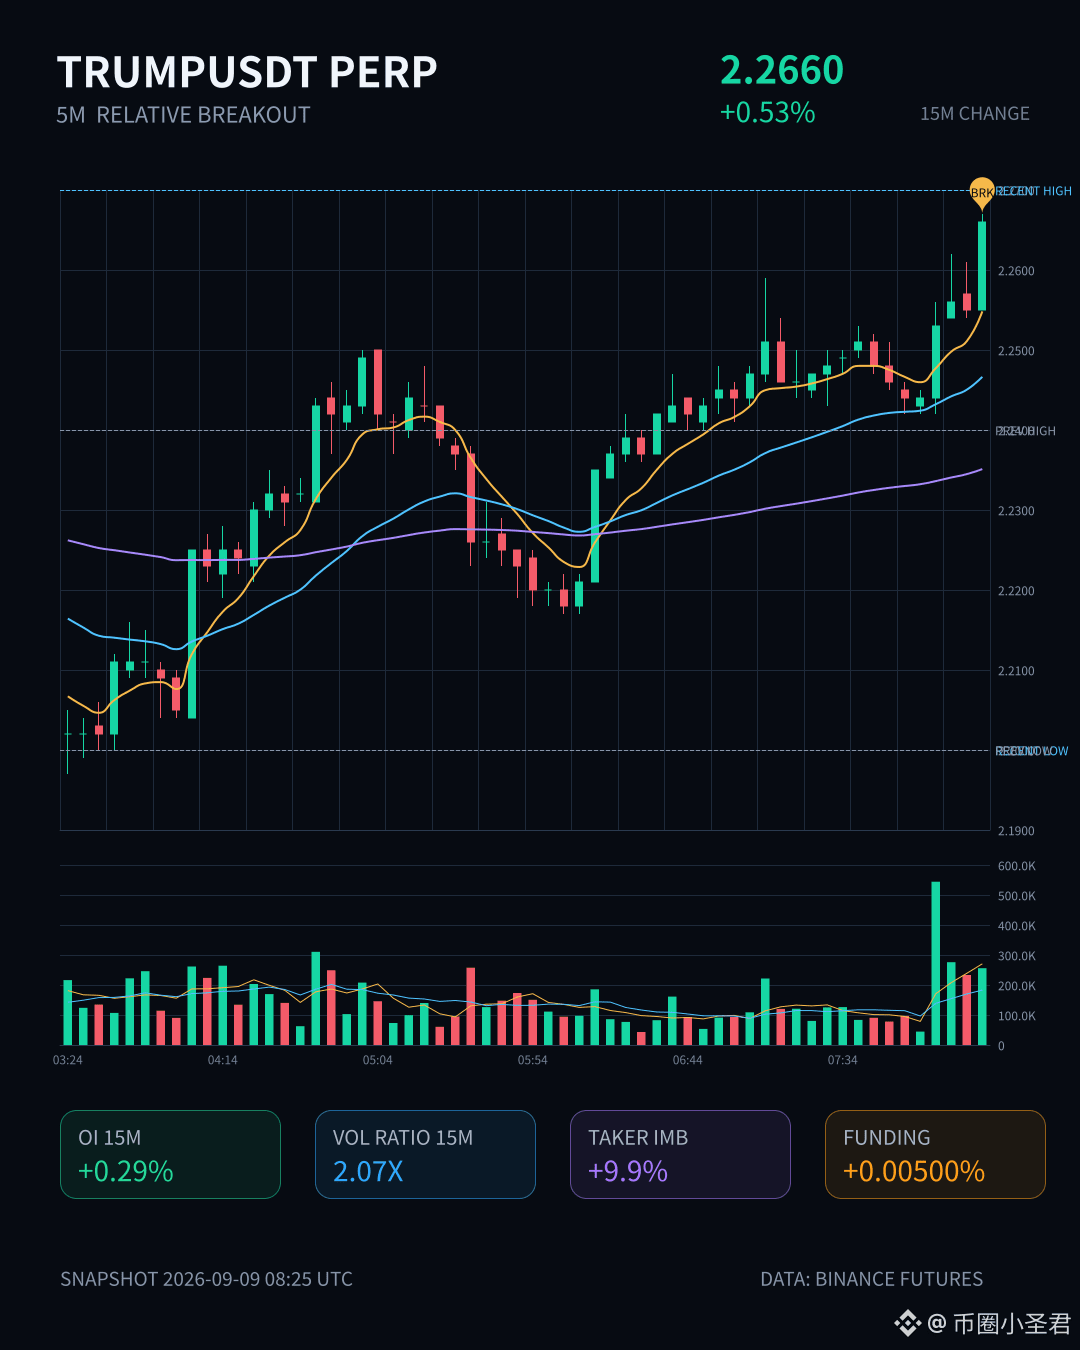
$TRUMP This positioning is a bit something. On the 15-minute timeframe, it directly broke through the top of the range formed by nearly 20 five-minute candlesticks. Volume expanded to more than 2x of normal, and the proportion of aggressive buy orders is close to 10%. The buy/sell ratio is 1.22—clearly this isn’t retail traders trading back and forth with each other. There really is incremental capital stepping in.
The key is that open interest is also rising in sync. On the 1-hour dimension, contract open interest is up 1.4%, with notional change near 1.5 million U. This kind of structure—price rising together with OI—looks much more like newly added leveraged longs actively pushing than a short-covering “fake breakout.” The abnormal percentile of OI has already reached 89.7%, ranking #15 across the whole pool. This kind of abnormal move that continues across multiple consecutive cycles isn’t just a momentary impulse.
The 24-hour trading value has already hit 100 million USD. Liquidity is not an issue. At present, the momentum on short cycles still seems to be there, but the risk/reward of chasing at this level is generally not great. Focus on whether it can hold above the breakout level and keep expanding volume. If it pulls back on decreasing volume, be careful—leveraged longs may be getting crowded. For the TRUMP contract, volatility has always been high, so contract traders must absolutely control their position size.
$TRUMP This positioning is a bit something. On the 15-minute timeframe, it directly broke through the top of the range formed by nearly 20 five-minute candlesticks. Volume expanded to more than 2x of normal, and the proportion of aggressive buy orders is close to 10%. The buy/sell ratio is 1.22—clearly this isn’t retail traders trading back and forth with each other. There really is incremental capital stepping in.
The key is that open interest is also rising in sync. On the 1-hour dimension, contract open interest is up 1.4%, with notional change near 1.5 million U. This kind of structure—price rising together with OI—looks much more like newly added leveraged longs actively pushing than a short-covering “fake breakout.” The abnormal percentile of OI has already reached 89.7%, ranking #15 across the whole pool. This kind of abnormal move that continues across multiple consecutive cycles isn’t just a momentary impulse.
The 24-hour trading value has already hit 100 million USD. Liquidity is not an issue. At present, the momentum on short cycles still seems to be there, but the risk/reward of chasing at this level is generally not great. Focus on whether it can hold above the breakout level and keep expanding volume. If it pulls back on decreasing volume, be careful—leveraged longs may be getting crowded. For the TRUMP contract, volatility has always been high, so contract traders must absolutely control their position size.
The key is that open interest is also rising in sync. On the 1-hour dimension, contract open interest is up 1.4%, with notional change near 1.5 million U. This kind of structure—price rising together with OI—looks much more like newly added leveraged longs actively pushing than a short-covering “fake breakout.” The abnormal percentile of OI has already reached 89.7%, ranking #15 across the whole pool. This kind of abnormal move that continues across multiple consecutive cycles isn’t just a momentary impulse.
The 24-hour trading value has already hit 100 million USD. Liquidity is not an issue. At present, the momentum on short cycles still seems to be there, but the risk/reward of chasing at this level is generally not great. Focus on whether it can hold above the breakout level and keep expanding volume. If it pulls back on decreasing volume, be careful—leveraged longs may be getting crowded. For the TRUMP contract, volatility has always been high, so contract traders must absolutely control their position size.
24

·
--
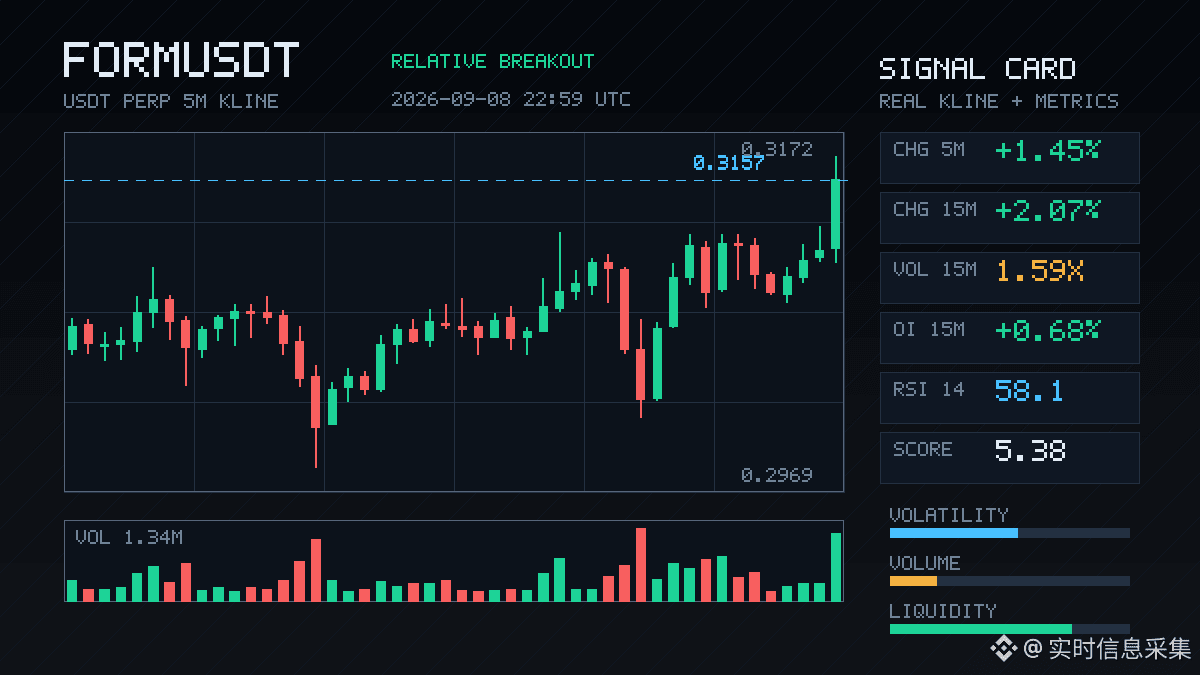
$FORM In the early hours, this move had something to it.
On the 15-minute timeframe, it surged 2% directly; volume rose to 1.6 times the usual level. Price also broke above the upper boundary of the last 20 five-minute candlesticks. The key isn’t how much it went up, but the structure behind it—OI increased by nearly 2% over the past hour in sync; the nominal change reached 877K; and the funding rate is also in the high percentile recently.
This kind of combination—price rising + open interest increasing—most likely reflects newly added leveraged long positions entering the market, not a typical fake breakout from short covering. With the aggressive trade imbalance at +14%, buy/sell ratio at 1.33, the bias is indeed more to the upside.
With a 24-hour trading volume of $180 million, it ranks among the top in this pool. Intraday volatility and abnormal percentiles are also leading ( #15 ).\[$FORM\] (data as of 06:59 Beijing time)
$FORM In the early hours, this move had something to it.
On the 15-minute timeframe, it surged 2% directly; volume rose to 1.6 times the usual level. Price also broke above the upper boundary of the last 20 five-minute candlesticks. The key isn’t how much it went up, but the structure behind it—OI increased by nearly 2% over the past hour in sync; the nominal change reached 877K; and the funding rate is also in the high percentile recently.
This kind of combination—price rising + open interest increasing—most likely reflects newly added leveraged long positions entering the market, not a typical fake breakout from short covering. With the aggressive trade imbalance at +14%, buy/sell ratio at 1.33, the bias is indeed more to the upside.
With a 24-hour trading volume of $180 million, it ranks among the top in this pool. Intraday volatility and abnormal percentiles are also leading ( #15 ).\[$FORM \] (data as of 06:59 Beijing time)
On the 15-minute timeframe, it surged 2% directly; volume rose to 1.6 times the usual level. Price also broke above the upper boundary of the last 20 five-minute candlesticks. The key isn’t how much it went up, but the structure behind it—OI increased by nearly 2% over the past hour in sync; the nominal change reached 877K; and the funding rate is also in the high percentile recently.
This kind of combination—price rising + open interest increasing—most likely reflects newly added leveraged long positions entering the market, not a typical fake breakout from short covering. With the aggressive trade imbalance at +14%, buy/sell ratio at 1.33, the bias is indeed more to the upside.
With a 24-hour trading volume of $180 million, it ranks among the top in this pool. Intraday volatility and abnormal percentiles are also leading ( #15 ).\[$FORM \] (data as of 06:59 Beijing time)
27

·
--
$FLOCK this round was a bit rough, down 2.5% in 15 minutes, but the most interesting part isn’t the price — it’s the position structure.
OI dropped 1.6% in the short cycle, with notional value shrinking by 270k U instantly, while the 1-hour level barely moved — that means this move was purely short-term longs cutting losses and exiting, not new shorts coming in to dump the market. Aggressive selling dominated (buy/sell ratio 0.79), a classic long_unwind chain reaction.
The pool’s anomaly level ranks #15, but 24h trading volume is still supported by $227M, which means it hasn’t reached the kind of misery you see when liquidity dries up. You can still see the market — the blood bag hasn’t quite died yet. 😌
The question now is: after this 15-minute dump, has panic selling been fully flushed out? Let’s wait until the aggressive buy/sell imbalance turns positive again before looking for any recovery opportunities.
$FLOCK this round was a bit rough, down 2.5% in 15 minutes, but the most interesting part isn’t the price — it’s the position structure.
OI dropped 1.6% in the short cycle, with notional value shrinking by 270k U instantly, while the 1-hour level barely moved — that means this move was purely short-term longs cutting losses and exiting, not new shorts coming in to dump the market. Aggressive selling dominated (buy/sell ratio 0.79), a classic long_unwind chain reaction.
The pool’s anomaly level ranks #15, but 24h trading volume is still supported by $227M, which means it hasn’t reached the kind of misery you see when liquidity dries up. You can still see the market — the blood bag hasn’t quite died yet. 😌
The question now is: after this 15-minute dump, has panic selling been fully flushed out? Let’s wait until the aggressive buy/sell imbalance turns positive again before looking for any recovery opportunities.
OI dropped 1.6% in the short cycle, with notional value shrinking by 270k U instantly, while the 1-hour level barely moved — that means this move was purely short-term longs cutting losses and exiting, not new shorts coming in to dump the market. Aggressive selling dominated (buy/sell ratio 0.79), a classic long_unwind chain reaction.
The pool’s anomaly level ranks #15, but 24h trading volume is still supported by $227M, which means it hasn’t reached the kind of misery you see when liquidity dries up. You can still see the market — the blood bag hasn’t quite died yet. 😌
The question now is: after this 15-minute dump, has panic selling been fully flushed out? Let’s wait until the aggressive buy/sell imbalance turns positive again before looking for any recovery opportunities.
123
·
--
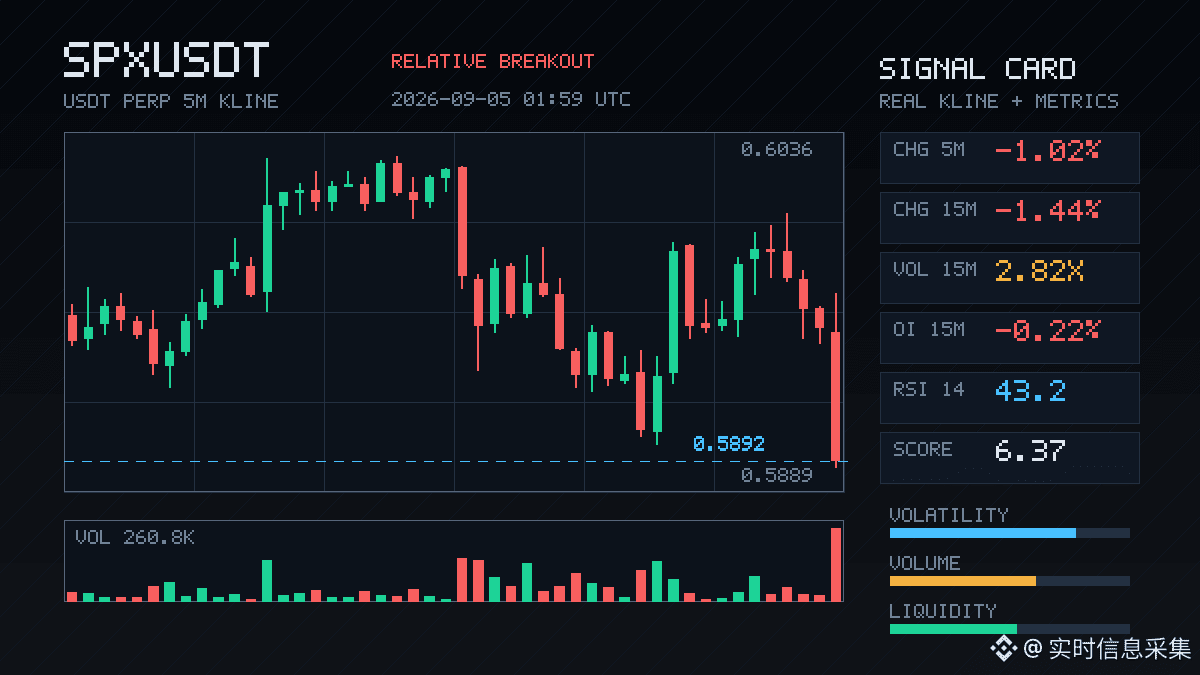
$SPX this move got sold off pretty hard.
It dropped 1.44% in just 15 minutes, with volume surging to 2.8x normal, and price also broke below the lower bound of the recent 20-candle range — purely from the chart, the short-term long idea can be put on hold for now.
What’s interesting is the futures side: OI shrank 0.22% over 15 minutes, with a notional change of -122K USDT (-1.65%), and it’s still declining on the 1-hour timeframe as well. This looks more like longs actively cutting positions or de-risking, rather than a trend selloff from a large wave of new shorts entering. Funding rates are still in a high percentile, aggressive flow imbalance is -27.7%, and the buy/sell ratio is 0.57, with sellers fully in control.
The combination of shrinking positions plus falling price usually shortens the duration of the decline — but only after this "shrinkage" process finishes.
The OI anomaly percentile is 87.7%, ranking #15 in the overall pool, which is already a signal that volatility is likely to expand or that extreme moves may appear.
24-hour trading volume is only 38M, so the market cap is not large and directional moves can be sharp. Now that it has broken the range, watch whether there’s a pullback for confirmation next — don’t rush to catch the bottom. For a structure like $SPX , either wait for stability after violent volatility, or stay away entirely.
$SPX this move got sold off pretty hard.
It dropped 1.44% in just 15 minutes, with volume surging to 2.8x normal, and price also broke below the lower bound of the recent 20-candle range — purely from the chart, the short-term long idea can be put on hold for now.
What’s interesting is the futures side: OI shrank 0.22% over 15 minutes, with a notional change of -122K USDT (-1.65%), and it’s still declining on the 1-hour timeframe as well. This looks more like longs actively cutting positions or de-risking, rather than a trend selloff from a large wave of new shorts entering. Funding rates are still in a high percentile, aggressive flow imbalance is -27.7%, and the buy/sell ratio is 0.57, with sellers fully in control.
The combination of shrinking positions plus falling price usually shortens the duration of the decline — but only after this "shrinkage" process finishes.
The OI anomaly percentile is 87.7%, ranking #15 in the overall pool, which is already a signal that volatility is likely to expand or that extreme moves may appear.
24-hour trading volume is only 38M, so the market cap is not large and directional moves can be sharp. Now that it has broken the range, watch whether there’s a pullback for confirmation next — don’t rush to catch the bottom. For a structure like $SPX , either wait for stability after violent volatility, or stay away entirely.
It dropped 1.44% in just 15 minutes, with volume surging to 2.8x normal, and price also broke below the lower bound of the recent 20-candle range — purely from the chart, the short-term long idea can be put on hold for now.
What’s interesting is the futures side: OI shrank 0.22% over 15 minutes, with a notional change of -122K USDT (-1.65%), and it’s still declining on the 1-hour timeframe as well. This looks more like longs actively cutting positions or de-risking, rather than a trend selloff from a large wave of new shorts entering. Funding rates are still in a high percentile, aggressive flow imbalance is -27.7%, and the buy/sell ratio is 0.57, with sellers fully in control.
The combination of shrinking positions plus falling price usually shortens the duration of the decline — but only after this "shrinkage" process finishes.
The OI anomaly percentile is 87.7%, ranking #15 in the overall pool, which is already a signal that volatility is likely to expand or that extreme moves may appear.
24-hour trading volume is only 38M, so the market cap is not large and directional moves can be sharp. Now that it has broken the range, watch whether there’s a pullback for confirmation next — don’t rush to catch the bottom. For a structure like $SPX , either wait for stability after violent volatility, or stay away entirely.
37

·
--
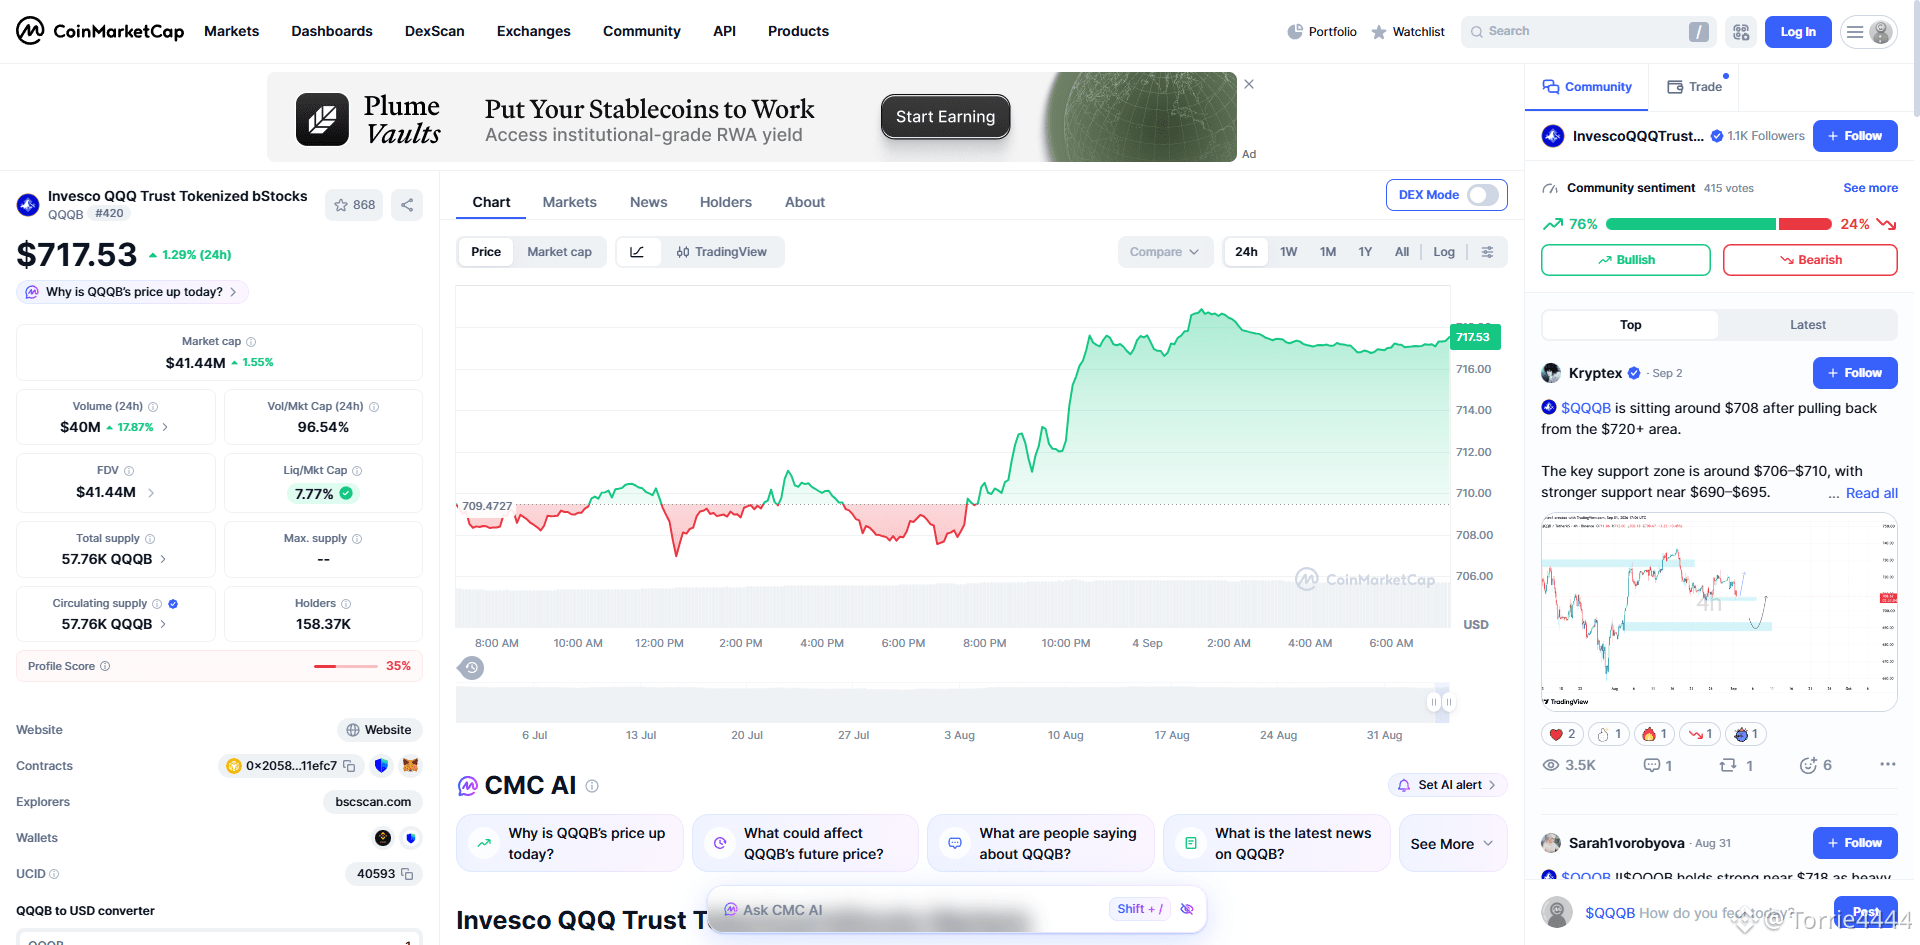
Are everyone looking at US stock tokenized assets? Invesco QQQ Trust Tokenized bStocks $QQQB is currently ranked #15 on CoinMarketCap’s trending list. These assets that are linked to traditional indexes suddenly gained attention—wondering what you value more: their liquidity or their hedging characteristics. 👀 #QQQB #RWA
Are everyone looking at US stock tokenized assets? Invesco QQQ Trust Tokenized bStocks $QQQB is currently ranked #15 on CoinMarketCap’s trending list. These assets that are linked to traditional indexes suddenly gained attention—wondering what you value more: their liquidity or their hedging characteristics. 👀 #QQQB #RWA
78

·
--
The most awkward part of the order book isn’t that $MRVL is up +1.29%—it’s that its 24-hour trading volume is already $93.40M, and the funding rate is still sticking at +0.0000%.
I usually take a closer look when it moves like this.
The price is $209.05, with the intraday high and low at $212.9 and $201.43—there’s been some decent back-and-forth sweeping.
Open interest is still sitting at 181,167 contracts, which suggests there are truly people inside the market continuously watching—not that kind of short-lived excitement where it surges and then immediately disperses.
I’m somewhat bullish, and the reasons aren’t complicated.
First, this one can rank at #15 on the Binance US stocks perpetual trading volume leaderboard, which at least indicates it’s already within the field of vision of active capital.
“Active” doesn’t necessarily mean it will go up, but it does mean it isn’t an ignored cold corner where nobody’s looking.
Second, the name Marvell—based on my own understanding—the bigger direction is still semiconductors and computing infrastructure.
This theme has been traded back and forth repeatedly over the past couple of years. When it’s hot, the noise gets quite intense; when it’s cold, it can also get mistakenly hit along with everything else.
But when the market finally starts asking whether there’s still room for sustained investment, the underlying hardware chain is still something you can’t bypass.
Third, the funding rate hasn’t been pushed up—and I actually like that.
With a lot of stocks, the moment there’s a bit of emotion, the perpetuals side gets overheated first. Once you jump in, you’re more likely to get hit by a “come-back punch.”
$MRVL isn’t currently the kind of situation where, at a glance, everyone in the whole market is crowding into the same side. At least from the funding-rate perspective, it hasn’t gotten to the point of being ridiculously crowded.
I didn’t get the real-time price from the US stocks spot side, so I can’t force a conclusion about the basis.
But judging from how the perpetuals are performing, it feels more like someone is squatting in advance—not just random emotional buying.
Of course, this doesn’t mean you can just blindly hold it.
If later it can’t break through today’s $212.9, and instead chops around for a few days, once short-term capital withdraws, the price can easily drift back toward the intraday midline.
One more thing: on the US stocks side, as long as the overall tech theme cools down, even if a single stock has imagination, it’s still hard for it to carry the move all by itself.
If it were me, I’d put it on a list for stronger observation—more interest in buying the pullback than chasing the high.
I don’t want to short it from this position. If I really had to act, I’d lean toward finding a more comfortable rhythm to watch for the long side.
If it turns out badly, don’t cue me—if it works out, treat me to a cup of coffee. $MRVL #US Stocks
The most awkward part of the order book isn’t that $MRVL is up +1.29%—it’s that its 24-hour trading volume is already $93.40M, and the funding rate is still sticking at +0.0000%.
I usually take a closer look when it moves like this.
The price is $209.05, with the intraday high and low at $212.9 and $201.43—there’s been some decent back-and-forth sweeping.
Open interest is still sitting at 181,167 contracts, which suggests there are truly people inside the market continuously watching—not that kind of short-lived excitement where it surges and then immediately disperses.
I’m somewhat bullish, and the reasons aren’t complicated.
First, this one can rank at #15 on the Binance US stocks perpetual trading volume leaderboard, which at least indicates it’s already within the field of vision of active capital.
“Active” doesn’t necessarily mean it will go up, but it does mean it isn’t an ignored cold corner where nobody’s looking.
Second, the name Marvell—based on my own understanding—the bigger direction is still semiconductors and computing infrastructure.
This theme has been traded back and forth repeatedly over the past couple of years. When it’s hot, the noise gets quite intense; when it’s cold, it can also get mistakenly hit along with everything else.
But when the market finally starts asking whether there’s still room for sustained investment, the underlying hardware chain is still something you can’t bypass.
Third, the funding rate hasn’t been pushed up—and I actually like that.
With a lot of stocks, the moment there’s a bit of emotion, the perpetuals side gets overheated first. Once you jump in, you’re more likely to get hit by a “come-back punch.”
$MRVL isn’t currently the kind of situation where, at a glance, everyone in the whole market is crowding into the same side. At least from the funding-rate perspective, it hasn’t gotten to the point of being ridiculously crowded.
I didn’t get the real-time price from the US stocks spot side, so I can’t force a conclusion about the basis.
But judging from how the perpetuals are performing, it feels more like someone is squatting in advance—not just random emotional buying.
Of course, this doesn’t mean you can just blindly hold it.
If later it can’t break through today’s $212.9, and instead chops around for a few days, once short-term capital withdraws, the price can easily drift back toward the intraday midline.
One more thing: on the US stocks side, as long as the overall tech theme cools down, even if a single stock has imagination, it’s still hard for it to carry the move all by itself.
If it were me, I’d put it on a list for stronger observation—more interest in buying the pullback than chasing the high.
I don’t want to short it from this position. If I really had to act, I’d lean toward finding a more comfortable rhythm to watch for the long side.
If it turns out badly, don’t cue me—if it works out, treat me to a cup of coffee. $MRVL #US Stocks
I usually take a closer look when it moves like this.
The price is $209.05, with the intraday high and low at $212.9 and $201.43—there’s been some decent back-and-forth sweeping.
Open interest is still sitting at 181,167 contracts, which suggests there are truly people inside the market continuously watching—not that kind of short-lived excitement where it surges and then immediately disperses.
I’m somewhat bullish, and the reasons aren’t complicated.
First, this one can rank at #15 on the Binance US stocks perpetual trading volume leaderboard, which at least indicates it’s already within the field of vision of active capital.
“Active” doesn’t necessarily mean it will go up, but it does mean it isn’t an ignored cold corner where nobody’s looking.
Second, the name Marvell—based on my own understanding—the bigger direction is still semiconductors and computing infrastructure.
This theme has been traded back and forth repeatedly over the past couple of years. When it’s hot, the noise gets quite intense; when it’s cold, it can also get mistakenly hit along with everything else.
But when the market finally starts asking whether there’s still room for sustained investment, the underlying hardware chain is still something you can’t bypass.
Third, the funding rate hasn’t been pushed up—and I actually like that.
With a lot of stocks, the moment there’s a bit of emotion, the perpetuals side gets overheated first. Once you jump in, you’re more likely to get hit by a “come-back punch.”
$MRVL isn’t currently the kind of situation where, at a glance, everyone in the whole market is crowding into the same side. At least from the funding-rate perspective, it hasn’t gotten to the point of being ridiculously crowded.
I didn’t get the real-time price from the US stocks spot side, so I can’t force a conclusion about the basis.
But judging from how the perpetuals are performing, it feels more like someone is squatting in advance—not just random emotional buying.
Of course, this doesn’t mean you can just blindly hold it.
If later it can’t break through today’s $212.9, and instead chops around for a few days, once short-term capital withdraws, the price can easily drift back toward the intraday midline.
One more thing: on the US stocks side, as long as the overall tech theme cools down, even if a single stock has imagination, it’s still hard for it to carry the move all by itself.
If it were me, I’d put it on a list for stronger observation—more interest in buying the pullback than chasing the high.
I don’t want to short it from this position. If I really had to act, I’d lean toward finding a more comfortable rhythm to watch for the long side.
If it turns out badly, don’t cue me—if it works out, treat me to a cup of coffee. $MRVL #US Stocks
79

·
--
60-SECOND ALPHA #15 | $AAVE
AAVE demonstrates how DeFi tokens can be influenced by more than speculation. Lending activity, liquidity and borrowing demand all matter to the ecosystem.
👉🏻 When analysing a DeFi token, look beyond the chart. Understanding where the protocol gets its activity can give you a better picture of what drives the token.
{future}(AAVEUSDT)
60-SECOND ALPHA #15 | $AAVE
AAVE demonstrates how DeFi tokens can be influenced by more than speculation. Lending activity, liquidity and borrowing demand all matter to the ecosystem.
👉🏻 When analysing a DeFi token, look beyond the chart. Understanding where the protocol gets its activity can give you a better picture of what drives the token.
AAVE demonstrates how DeFi tokens can be influenced by more than speculation. Lending activity, liquidity and borrowing demand all matter to the ecosystem.
👉🏻 When analysing a DeFi token, look beyond the chart. Understanding where the protocol gets its activity can give you a better picture of what drives the token.
92
·
--
Just wrapped up the trade on the Taiwan stock market, and when my brain switches from a fast pace back to US stocks, I’ll actually start by looking at this kind of stock that isn’t as刺激 (exciting), but is more likely to trend steadily. Tonight I’m staying put with $CRM—not because it’s only up +0.75% over 24 hours, but because of its position. It’s more like the type of stock that funds are willing to come back to repeatedly.
I’m fairly positive on Salesforce. The core isn’t short-term sentiment; it’s that the enterprise software space itself is still moving toward efficiency and automation. From what I understand, companies like CRM eat into enterprises’ long-term budgets, not one-off spending. When the market is hot, everyone chases the front-row AI narrative. But when it cools down, platforms that truly integrate AI, data, and customer management into enterprise workflows are more likely to be repriced upward again.
The price action also looks decent. Its perpetual current price is $256.12, with 24-hour high/low at $262.15 / $252.65, which suggests there’s some selling pressure overhead, but the bids below are still holding—not getting decisively smashed through. Even more important, the funding rate is +0.0000%. This kind of stock is ranked #15 by price gain, yet the funding hasn’t spiked. That implies there isn’t much overcrowding chasing longs yet—it hasn’t become one-sided. Open contract positions are 12,405 contracts, with a trading volume of $2.93M USDT. Interest has picked up, but not to the point that makes me want to flip my position.
I’m not going to chase a gap-up entry. A more practical move is to wait until it pulls back to around 253–254, then try a 3% position size. As long as the long thesis hasn’t broken, I’ll hold. If it drops back below 252.65, I’ll admit the mistake and get out directly. With stocks like this, you’re not making money from one big bullish candle—you’re profiting from the market gradually re-rating it from an “old software company” into a platform that can still tap into ongoing enterprise upgrade budgets.
There are variables too. If enterprise IT spending weakens, the upside elasticity of a stock like this will get compressed first. Also, it’s not a high-beta stock that relies on sentiment to push higher—getting the timing wrong can be very grinding. So in this case, I’ll only take a light position and won’t chase a breakout. $CRM #US stocks
I could also be wrong—I’m making my own judgment.
Just wrapped up the trade on the Taiwan stock market, and when my brain switches from a fast pace back to US stocks, I’ll actually start by looking at this kind of stock that isn’t as刺激 (exciting), but is more likely to trend steadily. Tonight I’m staying put with $CRM —not because it’s only up +0.75% over 24 hours, but because of its position. It’s more like the type of stock that funds are willing to come back to repeatedly.
I’m fairly positive on Salesforce. The core isn’t short-term sentiment; it’s that the enterprise software space itself is still moving toward efficiency and automation. From what I understand, companies like CRM eat into enterprises’ long-term budgets, not one-off spending. When the market is hot, everyone chases the front-row AI narrative. But when it cools down, platforms that truly integrate AI, data, and customer management into enterprise workflows are more likely to be repriced upward again.
The price action also looks decent. Its perpetual current price is $256.12, with 24-hour high/low at $262.15 / $252.65, which suggests there’s some selling pressure overhead, but the bids below are still holding—not getting decisively smashed through. Even more important, the funding rate is +0.0000%. This kind of stock is ranked #15 by price gain, yet the funding hasn’t spiked. That implies there isn’t much overcrowding chasing longs yet—it hasn’t become one-sided. Open contract positions are 12,405 contracts, with a trading volume of $2.93M USDT. Interest has picked up, but not to the point that makes me want to flip my position.
I’m not going to chase a gap-up entry. A more practical move is to wait until it pulls back to around 253–254, then try a 3% position size. As long as the long thesis hasn’t broken, I’ll hold. If it drops back below 252.65, I’ll admit the mistake and get out directly. With stocks like this, you’re not making money from one big bullish candle—you’re profiting from the market gradually re-rating it from an “old software company” into a platform that can still tap into ongoing enterprise upgrade budgets.
There are variables too. If enterprise IT spending weakens, the upside elasticity of a stock like this will get compressed first. Also, it’s not a high-beta stock that relies on sentiment to push higher—getting the timing wrong can be very grinding. So in this case, I’ll only take a light position and won’t chase a breakout. $CRM #US stocks
I could also be wrong—I’m making my own judgment.
I’m fairly positive on Salesforce. The core isn’t short-term sentiment; it’s that the enterprise software space itself is still moving toward efficiency and automation. From what I understand, companies like CRM eat into enterprises’ long-term budgets, not one-off spending. When the market is hot, everyone chases the front-row AI narrative. But when it cools down, platforms that truly integrate AI, data, and customer management into enterprise workflows are more likely to be repriced upward again.
The price action also looks decent. Its perpetual current price is $256.12, with 24-hour high/low at $262.15 / $252.65, which suggests there’s some selling pressure overhead, but the bids below are still holding—not getting decisively smashed through. Even more important, the funding rate is +0.0000%. This kind of stock is ranked #15 by price gain, yet the funding hasn’t spiked. That implies there isn’t much overcrowding chasing longs yet—it hasn’t become one-sided. Open contract positions are 12,405 contracts, with a trading volume of $2.93M USDT. Interest has picked up, but not to the point that makes me want to flip my position.
I’m not going to chase a gap-up entry. A more practical move is to wait until it pulls back to around 253–254, then try a 3% position size. As long as the long thesis hasn’t broken, I’ll hold. If it drops back below 252.65, I’ll admit the mistake and get out directly. With stocks like this, you’re not making money from one big bullish candle—you’re profiting from the market gradually re-rating it from an “old software company” into a platform that can still tap into ongoing enterprise upgrade budgets.
There are variables too. If enterprise IT spending weakens, the upside elasticity of a stock like this will get compressed first. Also, it’s not a high-beta stock that relies on sentiment to push higher—getting the timing wrong can be very grinding. So in this case, I’ll only take a light position and won’t chase a breakout. $CRM #US stocks
I could also be wrong—I’m making my own judgment.
83

·
--
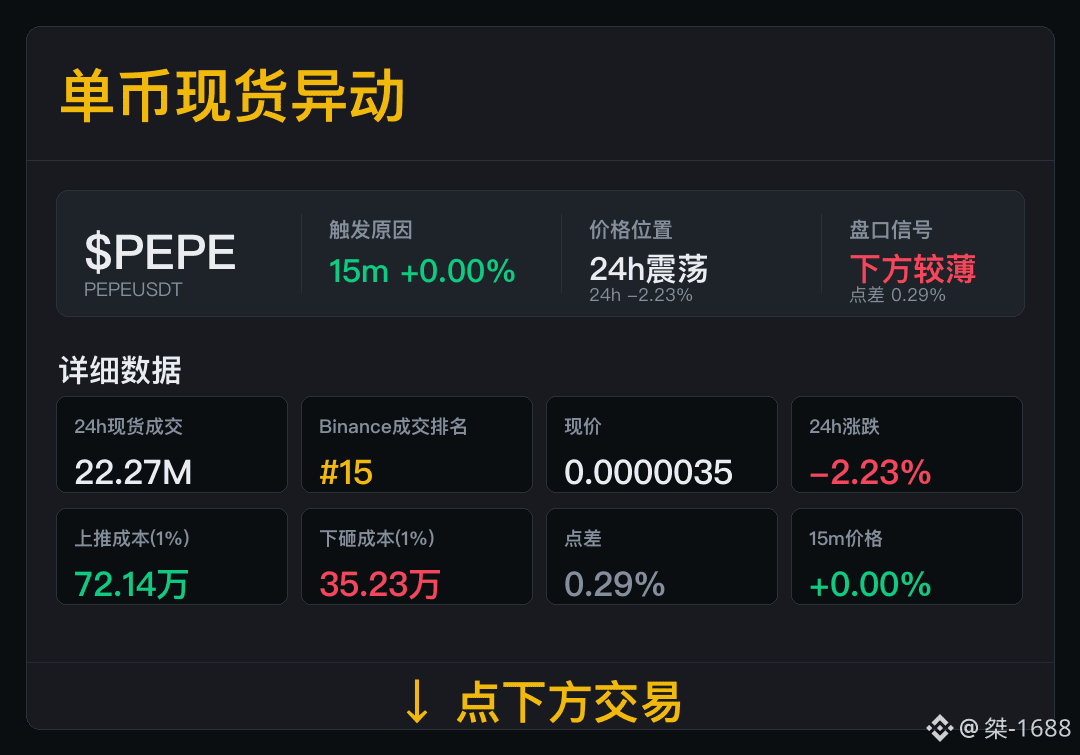
$PEPE Short-term momentum has picked up—first verify the trade ranking and order book costs.
Spot trades 22.27M, Binance trade rank #15. The spot volume provides the baseline for participation, and we still expect follow-through to depend on subsequent volume.
Now 24h change is -2.23%; spread 0.29%. The buy-side cost on the push is 721,400, and the sell-side cost on the dump is 352,300. The upper and lower costs reflect execution conditions; only with sustained trading can there be the next leg.
In the next round, focus on checking both trade volume and spread. Continue tracking only if both stabilize.
$PEPE Short-term momentum has picked up—first verify the trade ranking and order book costs.
Spot trades 22.27M, Binance trade rank #15. The spot volume provides the baseline for participation, and we still expect follow-through to depend on subsequent volume.
Now 24h change is -2.23%; spread 0.29%. The buy-side cost on the push is 721,400, and the sell-side cost on the dump is 352,300. The upper and lower costs reflect execution conditions; only with sustained trading can there be the next leg.
In the next round, focus on checking both trade volume and spread. Continue tracking only if both stabilize.
Spot trades 22.27M, Binance trade rank #15. The spot volume provides the baseline for participation, and we still expect follow-through to depend on subsequent volume.
Now 24h change is -2.23%; spread 0.29%. The buy-side cost on the push is 721,400, and the sell-side cost on the dump is 352,300. The upper and lower costs reflect execution conditions; only with sustained trading can there be the next leg.
In the next round, focus on checking both trade volume and spread. Continue tracking only if both stabilize.
1
618

·
--
Trending: Monero (XMRUSDT)Monero (XMRUSDT) is trending on CoinGecko!
Rank: #15
On September 1, 2026, the crypto market displayed a mixed but generally bullish tone, with Ethereum (ETH) posting a modest gain and several altcoins outpacing it in percentage terms. ETH traded at **,466.21**, up **1.90%** over the past 24 hours, supported by a robust trading volume of **≈592 million USDT**. This level of activity suggests sustained interest from both retail and institutional participants, even as the price remains well below its all‑time highs.
Among the top performers, **NEAR Protocol (NEARUSDT)** led the pack with a **5.14%** rise to **.943**, accompanied by a 24‑hour quote volume of **≈25.8 million USDT**. The token’s price action ranged between a low of **.807** and a high of **.956**, indicating strong buying pressure throughout the day.
Following NEAR, **Polkadot (DOTUSDT)** gained **3.77%** to **/bin/sh.854**, while **Cardano (ADAUSDT)** added **3.37%** to reach **/bin/sh.1996**. Both assets showed healthy volumes—**≈4.2 million USDT** for DOT and **≈18.0 million USDT** for ADA—reflecting broad‑based interest in layer‑1 solutions that emphasize scalability and interoperability.
Other notable movers included **Uniswap (UNIUSDT)** (+2.64%, .286), **Chainlink (LINKUSDT)** (+2.31%, 1.405), **XRP** (+2.26%, .379), and **Avalanche (AVAXUSDT)** (+2.05%, .278). Each of these tokens recorded quote volumes in the tens of millions, underscoring active trading across DeFi, oracle, and payment‑focused sectors.
Interestingly, the list of losers was empty in the provided snapshot, suggesting that downward pressure was limited across the sampled assets during this period. This could be attributed to a combination of factors: renewed optimism around Ethereum’s upcoming upgrades, positive sentiment toward interoperability projects, and a general risk‑on mood in the broader crypto market.
While today’s data highlights short‑term momentum, it’s essential to view these movements within a longer‑term context. Price fluctuations of a few percent can be driven by short‑term trader sentiment, news flow, or technical triggers, and do not necessarily indicate a sustained trend. Traders should continue to monitor on‑chain metrics, macroeconomic developments, and project‑specific updates before forming any market outlook.
#xmr #crypto #trending #CoinGecko
Trending: Monero (XMRUSDT)
Monero (XMRUSDT) is trending on CoinGecko!
Rank: #15
On September 1, 2026, the crypto market displayed a mixed but generally bullish tone, with Ethereum (ETH) posting a modest gain and several altcoins outpacing it in percentage terms. ETH traded at **,466.21**, up **1.90%** over the past 24 hours, supported by a robust trading volume of **≈592 million USDT**. This level of activity suggests sustained interest from both retail and institutional participants, even as the price remains well below its all‑time highs.
Among the top performers, **NEAR Protocol (NEARUSDT)** led the pack with a **5.14%** rise to **.943**, accompanied by a 24‑hour quote volume of **≈25.8 million USDT**. The token’s price action ranged between a low of **.807** and a high of **.956**, indicating strong buying pressure throughout the day.
Following NEAR, **Polkadot (DOTUSDT)** gained **3.77%** to **/bin/sh.854**, while **Cardano (ADAUSDT)** added **3.37%** to reach **/bin/sh.1996**. Both assets showed healthy volumes—**≈4.2 million USDT** for DOT and **≈18.0 million USDT** for ADA—reflecting broad‑based interest in layer‑1 solutions that emphasize scalability and interoperability.
Other notable movers included **Uniswap (UNIUSDT)** (+2.64%, .286), **Chainlink (LINKUSDT)** (+2.31%, 1.405), **XRP** (+2.26%, .379), and **Avalanche (AVAXUSDT)** (+2.05%, .278). Each of these tokens recorded quote volumes in the tens of millions, underscoring active trading across DeFi, oracle, and payment‑focused sectors.
Interestingly, the list of losers was empty in the provided snapshot, suggesting that downward pressure was limited across the sampled assets during this period. This could be attributed to a combination of factors: renewed optimism around Ethereum’s upcoming upgrades, positive sentiment toward interoperability projects, and a general risk‑on mood in the broader crypto market.
While today’s data highlights short‑term momentum, it’s essential to view these movements within a longer‑term context. Price fluctuations of a few percent can be driven by short‑term trader sentiment, news flow, or technical triggers, and do not necessarily indicate a sustained trend. Traders should continue to monitor on‑chain metrics, macroeconomic developments, and project‑specific updates before forming any market outlook.
#xmr #crypto #trending #CoinGecko
Rank: #15
On September 1, 2026, the crypto market displayed a mixed but generally bullish tone, with Ethereum (ETH) posting a modest gain and several altcoins outpacing it in percentage terms. ETH traded at **,466.21**, up **1.90%** over the past 24 hours, supported by a robust trading volume of **≈592 million USDT**. This level of activity suggests sustained interest from both retail and institutional participants, even as the price remains well below its all‑time highs.
Among the top performers, **NEAR Protocol (NEARUSDT)** led the pack with a **5.14%** rise to **.943**, accompanied by a 24‑hour quote volume of **≈25.8 million USDT**. The token’s price action ranged between a low of **.807** and a high of **.956**, indicating strong buying pressure throughout the day.
Following NEAR, **Polkadot (DOTUSDT)** gained **3.77%** to **/bin/sh.854**, while **Cardano (ADAUSDT)** added **3.37%** to reach **/bin/sh.1996**. Both assets showed healthy volumes—**≈4.2 million USDT** for DOT and **≈18.0 million USDT** for ADA—reflecting broad‑based interest in layer‑1 solutions that emphasize scalability and interoperability.
Other notable movers included **Uniswap (UNIUSDT)** (+2.64%, .286), **Chainlink (LINKUSDT)** (+2.31%, 1.405), **XRP** (+2.26%, .379), and **Avalanche (AVAXUSDT)** (+2.05%, .278). Each of these tokens recorded quote volumes in the tens of millions, underscoring active trading across DeFi, oracle, and payment‑focused sectors.
Interestingly, the list of losers was empty in the provided snapshot, suggesting that downward pressure was limited across the sampled assets during this period. This could be attributed to a combination of factors: renewed optimism around Ethereum’s upcoming upgrades, positive sentiment toward interoperability projects, and a general risk‑on mood in the broader crypto market.
While today’s data highlights short‑term momentum, it’s essential to view these movements within a longer‑term context. Price fluctuations of a few percent can be driven by short‑term trader sentiment, news flow, or technical triggers, and do not necessarily indicate a sustained trend. Traders should continue to monitor on‑chain metrics, macroeconomic developments, and project‑specific updates before forming any market outlook.
#xmr #crypto #trending #CoinGecko
1
·
--
Trending: Monero (XMRUSDT)Monero (XMRUSDT) is trending on CoinGecko!
Rank: #15
On August 31, 2026, the two largest cryptocurrencies by market capitalization showed modest declines over the past 24 hours, according to CoinGecko data. Bitcoin (BTC) traded at **7,816**, down **1.28 %** with a 24‑hour trading volume of roughly **7.98 billion**. Ethereum (ETH) was priced at **,438.88**, slipping **1.37 %** while recording a volume of about **4.75 billion**.
These movements come after a period of relatively tight trading ranges for both assets. Bitcoin has been oscillating between the 5k–0k band for several weeks, a zone that aligns with the 200‑day moving average and serves as a key psychological barrier. Ethereum’s price action mirrors this consolidation, hovering around the .4k level, which coincides with the 50‑day exponential moving average (EMA) and the upper boundary of a descending channel that has been in place since early July.
Several macro‑level factors may be contributing to the slight bearish tilt:
1. **U.S. Dollar Strength** – The Dollar Index (DXY) edged higher early in the session, often exerting inverse pressure on dollar‑denominated assets like Bitcoin and Ethereum.
2. **Regulatory Clarity Efforts** – Ongoing discussions in major jurisdictions about stablecoin oversight and crypto‑asset taxation have kept market participants cautious, prompting some traders to reduce exposure ahead of potential policy announcements.
3. **On‑Chain Activity** – Bitcoin’s hash rate remains near all‑time highs, indicating robust miner confidence, while Ethereum’s staking ratio has risen to roughly **22 %**, reflecting continued long‑term commitment from holders despite short‑term price fluctuations.
From a technical perspective, both BTC and ETH are testing short‑term support levels. For Bitcoin, the 6.5k–7k area aligns with the 38.2 % Fibonacci retracement of the recent rally from 0k to 2k. Ethereum’s .40–.45 zone corresponds to the 61.8 % retracement of its move from .1k to .8k earlier this month. A decisive break below these levels could open the door to deeper corrections, whereas a rebound would likely see the assets retest their respective resistance bands (9k–1k for BTC and .5k–.6k for ETH).
Market participants should keep an eye on upcoming events that could sway sentiment: the release of the U.S. Consumer Price Index (CPI) later this week, the Ethereum Shanghai upgrade’s post‑upgrade performance review, and any statements from major central banks regarding digital currency pilots.
While the current 24‑hour dip reflects short‑term profit‑taking and macro‑headwinds, the underlying fundamentals—strong network security, growing institutional interest, and expanding use cases—remain intact. Traders and enthusiasts are advised to stay informed, monitor key support/resistance zones, and consider how broader economic indicators interact with crypto market dynamics.
#xmr #crypto #trending #CoinGecko
Trending: Monero (XMRUSDT)
Monero (XMRUSDT) is trending on CoinGecko!
Rank: #15
On August 31, 2026, the two largest cryptocurrencies by market capitalization showed modest declines over the past 24 hours, according to CoinGecko data. Bitcoin (BTC) traded at **7,816**, down **1.28 %** with a 24‑hour trading volume of roughly **7.98 billion**. Ethereum (ETH) was priced at **,438.88**, slipping **1.37 %** while recording a volume of about **4.75 billion**.
These movements come after a period of relatively tight trading ranges for both assets. Bitcoin has been oscillating between the 5k–0k band for several weeks, a zone that aligns with the 200‑day moving average and serves as a key psychological barrier. Ethereum’s price action mirrors this consolidation, hovering around the .4k level, which coincides with the 50‑day exponential moving average (EMA) and the upper boundary of a descending channel that has been in place since early July.
Several macro‑level factors may be contributing to the slight bearish tilt:
1. **U.S. Dollar Strength** – The Dollar Index (DXY) edged higher early in the session, often exerting inverse pressure on dollar‑denominated assets like Bitcoin and Ethereum.
2. **Regulatory Clarity Efforts** – Ongoing discussions in major jurisdictions about stablecoin oversight and crypto‑asset taxation have kept market participants cautious, prompting some traders to reduce exposure ahead of potential policy announcements.
3. **On‑Chain Activity** – Bitcoin’s hash rate remains near all‑time highs, indicating robust miner confidence, while Ethereum’s staking ratio has risen to roughly **22 %**, reflecting continued long‑term commitment from holders despite short‑term price fluctuations.
From a technical perspective, both BTC and ETH are testing short‑term support levels. For Bitcoin, the 6.5k–7k area aligns with the 38.2 % Fibonacci retracement of the recent rally from 0k to 2k. Ethereum’s .40–.45 zone corresponds to the 61.8 % retracement of its move from .1k to .8k earlier this month. A decisive break below these levels could open the door to deeper corrections, whereas a rebound would likely see the assets retest their respective resistance bands (9k–1k for BTC and .5k–.6k for ETH).
Market participants should keep an eye on upcoming events that could sway sentiment: the release of the U.S. Consumer Price Index (CPI) later this week, the Ethereum Shanghai upgrade’s post‑upgrade performance review, and any statements from major central banks regarding digital currency pilots.
While the current 24‑hour dip reflects short‑term profit‑taking and macro‑headwinds, the underlying fundamentals—strong network security, growing institutional interest, and expanding use cases—remain intact. Traders and enthusiasts are advised to stay informed, monitor key support/resistance zones, and consider how broader economic indicators interact with crypto market dynamics.
#xmr #crypto #trending #CoinGecko
Rank: #15
On August 31, 2026, the two largest cryptocurrencies by market capitalization showed modest declines over the past 24 hours, according to CoinGecko data. Bitcoin (BTC) traded at **7,816**, down **1.28 %** with a 24‑hour trading volume of roughly **7.98 billion**. Ethereum (ETH) was priced at **,438.88**, slipping **1.37 %** while recording a volume of about **4.75 billion**.
These movements come after a period of relatively tight trading ranges for both assets. Bitcoin has been oscillating between the 5k–0k band for several weeks, a zone that aligns with the 200‑day moving average and serves as a key psychological barrier. Ethereum’s price action mirrors this consolidation, hovering around the .4k level, which coincides with the 50‑day exponential moving average (EMA) and the upper boundary of a descending channel that has been in place since early July.
Several macro‑level factors may be contributing to the slight bearish tilt:
1. **U.S. Dollar Strength** – The Dollar Index (DXY) edged higher early in the session, often exerting inverse pressure on dollar‑denominated assets like Bitcoin and Ethereum.
2. **Regulatory Clarity Efforts** – Ongoing discussions in major jurisdictions about stablecoin oversight and crypto‑asset taxation have kept market participants cautious, prompting some traders to reduce exposure ahead of potential policy announcements.
3. **On‑Chain Activity** – Bitcoin’s hash rate remains near all‑time highs, indicating robust miner confidence, while Ethereum’s staking ratio has risen to roughly **22 %**, reflecting continued long‑term commitment from holders despite short‑term price fluctuations.
From a technical perspective, both BTC and ETH are testing short‑term support levels. For Bitcoin, the 6.5k–7k area aligns with the 38.2 % Fibonacci retracement of the recent rally from 0k to 2k. Ethereum’s .40–.45 zone corresponds to the 61.8 % retracement of its move from .1k to .8k earlier this month. A decisive break below these levels could open the door to deeper corrections, whereas a rebound would likely see the assets retest their respective resistance bands (9k–1k for BTC and .5k–.6k for ETH).
Market participants should keep an eye on upcoming events that could sway sentiment: the release of the U.S. Consumer Price Index (CPI) later this week, the Ethereum Shanghai upgrade’s post‑upgrade performance review, and any statements from major central banks regarding digital currency pilots.
While the current 24‑hour dip reflects short‑term profit‑taking and macro‑headwinds, the underlying fundamentals—strong network security, growing institutional interest, and expanding use cases—remain intact. Traders and enthusiasts are advised to stay informed, monitor key support/resistance zones, and consider how broader economic indicators interact with crypto market dynamics.
#xmr #crypto #trending #CoinGecko
66
·
--
$LIGHT Now this trend has got something going on 🚨
In 15 minutes it surged 1.85%, and the volume picked up to more than 2.5x. The volatility Z-score is almost at 4—this isn’t the kind of move retail traders with their small amounts can knock out.
Most importantly, the OI is rising in sync. In the 15-minute window, the notional change is +84K; in the 1-hour window, it’s also +97K. This combination of “price up + open interest increasing” is basically new leveraged longs putting real money in—this isn’t the kind of pseudo-rally caused by short covering. And notice the active trade imbalance: the difference is 22.6%, and the buy/sell ratio is 1.58. Direction is extremely clear.
Price has already broken above the upper boundary of the range formed by the last ~20 five-minute candlesticks, plus the whole-pool abnormal ranking is #15 and notional change ranking is #40. This move really does have the flavor of abnormal capital.
But then again, with LIGHT’s liquidity level, the total float over 24 hours is only 9.68M. If it’s pushed up, it can also be dropped quickly. Right now, what’s being tested isn’t nerve, it’s discipline. Keep an eye on OI—once it turns, the story is over.
$LIGHT Now this trend has got something going on 🚨
In 15 minutes it surged 1.85%, and the volume picked up to more than 2.5x. The volatility Z-score is almost at 4—this isn’t the kind of move retail traders with their small amounts can knock out.
Most importantly, the OI is rising in sync. In the 15-minute window, the notional change is +84K; in the 1-hour window, it’s also +97K. This combination of “price up + open interest increasing” is basically new leveraged longs putting real money in—this isn’t the kind of pseudo-rally caused by short covering. And notice the active trade imbalance: the difference is 22.6%, and the buy/sell ratio is 1.58. Direction is extremely clear.
Price has already broken above the upper boundary of the range formed by the last ~20 five-minute candlesticks, plus the whole-pool abnormal ranking is #15 and notional change ranking is #40. This move really does have the flavor of abnormal capital.
But then again, with LIGHT’s liquidity level, the total float over 24 hours is only 9.68M. If it’s pushed up, it can also be dropped quickly. Right now, what’s being tested isn’t nerve, it’s discipline. Keep an eye on OI—once it turns, the story is over.
In 15 minutes it surged 1.85%, and the volume picked up to more than 2.5x. The volatility Z-score is almost at 4—this isn’t the kind of move retail traders with their small amounts can knock out.
Most importantly, the OI is rising in sync. In the 15-minute window, the notional change is +84K; in the 1-hour window, it’s also +97K. This combination of “price up + open interest increasing” is basically new leveraged longs putting real money in—this isn’t the kind of pseudo-rally caused by short covering. And notice the active trade imbalance: the difference is 22.6%, and the buy/sell ratio is 1.58. Direction is extremely clear.
Price has already broken above the upper boundary of the range formed by the last ~20 five-minute candlesticks, plus the whole-pool abnormal ranking is #15 and notional change ranking is #40. This move really does have the flavor of abnormal capital.
But then again, with LIGHT’s liquidity level, the total float over 24 hours is only 9.68M. If it’s pushed up, it can also be dropped quickly. Right now, what’s being tested isn’t nerve, it’s discipline. Keep an eye on OI—once it turns, the story is over.
196
·
--
Lately, I’ve felt like the market’s bullish momentum around “upstream computing power” hasn’t completely cooled off yet.
It’s not the kind of stock that’s always the most lively—actually, it’s precisely that sort of quieter one that makes me look twice.
Take something like $MU : in 24 hours it’s only up 0.35%, and the price has been basically hovering in a tight range of $932.09 to $939.45, looking pretty flat on the surface.
But on the Binance US stocks perpetual side, its trading volume reaches $27.40M, ranking #15 on the gainers list and #5 on the volume list—clearly not something nobody’s watching.
I’m somewhat bullish on it, and it’s not complicated why.
First, the sector is still being traded back and forth.
As long as the market is still willing to orbit around AI, data centers, and computing infrastructure, the chain involving storage and chips is hard to fully “cool off.” From what I understand, Micron is roughly one of the old names in that direction—its recognition and presence are not low. You could say companies like this are volatile, but precisely because they’re not purely pitching concepts, capital keeps coming back repeatedly.
Second, today’s tape for this stock looks like “someone’s watching, but not getting emotional.”
The funding rate is still +0.0000%, with no vibe of a crowd rushing in the same direction. With 128,947 shares on hand, attention isn’t low—but it hasn’t gotten overheated to the point that makes me want to step back two paces. For someone like me who’s been educated plenty of times by contracts, this kind of slow-burn stability feels fine. The thing to truly fear is when it rises a chunk and then everybody starts shouting—the kind of move I usually only dare to watch, not touch.
Third, the way it feels to me right now isn’t “the peak,” more like a point in the sector that’s still being repriced gradually.
This kind of stock may not be wildly aggressive right away, but once the sector sentiment warms up again, it’s usually pulled back into the spotlight. Especially with the condition that, in Binance’s TradFi sector, you can buy it directly and also open USDT-margined perpetuals—convenience at the trading layer also adds a bit of lift to the overall heat.
I also have to admit: hard tech has an old problem—expectations tend to run too fast, with the stock price running first. If later the industry sentiment cools down, the pullback won’t be polite to you.
But looking only at today’s situation, I don’t want to stand on the opposite side of it.
If it were me, I’d rather put $MU into a “stronger observation” watchlist. If the pullback stays stable, I’d lean toward gradually going long, not betting that it suddenly goes out.
Those are my thoughts—your money, you decide. $MU #US stocks
Lately, I’ve felt like the market’s bullish momentum around “upstream computing power” hasn’t completely cooled off yet.
It’s not the kind of stock that’s always the most lively—actually, it’s precisely that sort of quieter one that makes me look twice.
Take something like $MU : in 24 hours it’s only up 0.35%, and the price has been basically hovering in a tight range of $932.09 to $939.45, looking pretty flat on the surface.
But on the Binance US stocks perpetual side, its trading volume reaches $27.40M, ranking #15 on the gainers list and #5 on the volume list—clearly not something nobody’s watching.
I’m somewhat bullish on it, and it’s not complicated why.
First, the sector is still being traded back and forth.
As long as the market is still willing to orbit around AI, data centers, and computing infrastructure, the chain involving storage and chips is hard to fully “cool off.” From what I understand, Micron is roughly one of the old names in that direction—its recognition and presence are not low. You could say companies like this are volatile, but precisely because they’re not purely pitching concepts, capital keeps coming back repeatedly.
Second, today’s tape for this stock looks like “someone’s watching, but not getting emotional.”
The funding rate is still +0.0000%, with no vibe of a crowd rushing in the same direction. With 128,947 shares on hand, attention isn’t low—but it hasn’t gotten overheated to the point that makes me want to step back two paces. For someone like me who’s been educated plenty of times by contracts, this kind of slow-burn stability feels fine. The thing to truly fear is when it rises a chunk and then everybody starts shouting—the kind of move I usually only dare to watch, not touch.
Third, the way it feels to me right now isn’t “the peak,” more like a point in the sector that’s still being repriced gradually.
This kind of stock may not be wildly aggressive right away, but once the sector sentiment warms up again, it’s usually pulled back into the spotlight. Especially with the condition that, in Binance’s TradFi sector, you can buy it directly and also open USDT-margined perpetuals—convenience at the trading layer also adds a bit of lift to the overall heat.
I also have to admit: hard tech has an old problem—expectations tend to run too fast, with the stock price running first. If later the industry sentiment cools down, the pullback won’t be polite to you.
But looking only at today’s situation, I don’t want to stand on the opposite side of it.
If it were me, I’d rather put $MU into a “stronger observation” watchlist. If the pullback stays stable, I’d lean toward gradually going long, not betting that it suddenly goes out.
Those are my thoughts—your money, you decide. $MU #US stocks
It’s not the kind of stock that’s always the most lively—actually, it’s precisely that sort of quieter one that makes me look twice.
Take something like $MU : in 24 hours it’s only up 0.35%, and the price has been basically hovering in a tight range of $932.09 to $939.45, looking pretty flat on the surface.
But on the Binance US stocks perpetual side, its trading volume reaches $27.40M, ranking #15 on the gainers list and #5 on the volume list—clearly not something nobody’s watching.
I’m somewhat bullish on it, and it’s not complicated why.
First, the sector is still being traded back and forth.
As long as the market is still willing to orbit around AI, data centers, and computing infrastructure, the chain involving storage and chips is hard to fully “cool off.” From what I understand, Micron is roughly one of the old names in that direction—its recognition and presence are not low. You could say companies like this are volatile, but precisely because they’re not purely pitching concepts, capital keeps coming back repeatedly.
Second, today’s tape for this stock looks like “someone’s watching, but not getting emotional.”
The funding rate is still +0.0000%, with no vibe of a crowd rushing in the same direction. With 128,947 shares on hand, attention isn’t low—but it hasn’t gotten overheated to the point that makes me want to step back two paces. For someone like me who’s been educated plenty of times by contracts, this kind of slow-burn stability feels fine. The thing to truly fear is when it rises a chunk and then everybody starts shouting—the kind of move I usually only dare to watch, not touch.
Third, the way it feels to me right now isn’t “the peak,” more like a point in the sector that’s still being repriced gradually.
This kind of stock may not be wildly aggressive right away, but once the sector sentiment warms up again, it’s usually pulled back into the spotlight. Especially with the condition that, in Binance’s TradFi sector, you can buy it directly and also open USDT-margined perpetuals—convenience at the trading layer also adds a bit of lift to the overall heat.
I also have to admit: hard tech has an old problem—expectations tend to run too fast, with the stock price running first. If later the industry sentiment cools down, the pullback won’t be polite to you.
But looking only at today’s situation, I don’t want to stand on the opposite side of it.
If it were me, I’d rather put $MU into a “stronger observation” watchlist. If the pullback stays stable, I’d lean toward gradually going long, not betting that it suddenly goes out.
Those are my thoughts—your money, you decide. $MU #US stocks
48
·
--
$TAO Just glanced at the order book—on the 15-minute timeframe it directly broke through the lower edge of nearly 20 consecutive 5-minute K-bars.
The trading volume is at 4.46 times the normal level, and aggressive sell orders have a clear upper hand (buy/sell ratio 0.55). This drop isn’t a soft, drifting decline—it’s funds actively smashing the price.
What’s interesting is that OI is contracting at the same time. The 15-minute contract’s nominal position fell by -460k U, and the 1-hour timeframe also reduced by -790k. **Price down + positions down**—a typical liquidation-cleaning of long positions and a de-leveraging structure, rather than a situation where large new short positions are aggressively entering with heavy volume to drive the move.
The funding rate is still in the high percentile range recently, indicating that the previously crowded leveraged longs are now nearing the end of the passive stop-loss cascade.
At present, the whole pool of unusual activity ranks #22, nominal change is #15, and the definition of the event seems fine. Next, just watch whether the market can stop falling on reduced volume; don’t easily chase shorts at this level—wait for a clearer structure to decide.
$TAO Just glanced at the order book—on the 15-minute timeframe it directly broke through the lower edge of nearly 20 consecutive 5-minute K-bars.
The trading volume is at 4.46 times the normal level, and aggressive sell orders have a clear upper hand (buy/sell ratio 0.55). This drop isn’t a soft, drifting decline—it’s funds actively smashing the price.
What’s interesting is that OI is contracting at the same time. The 15-minute contract’s nominal position fell by -460k U, and the 1-hour timeframe also reduced by -790k. **Price down + positions down**—a typical liquidation-cleaning of long positions and a de-leveraging structure, rather than a situation where large new short positions are aggressively entering with heavy volume to drive the move.
The funding rate is still in the high percentile range recently, indicating that the previously crowded leveraged longs are now nearing the end of the passive stop-loss cascade.
At present, the whole pool of unusual activity ranks #22, nominal change is #15, and the definition of the event seems fine. Next, just watch whether the market can stop falling on reduced volume; don’t easily chase shorts at this level—wait for a clearer structure to decide.
The trading volume is at 4.46 times the normal level, and aggressive sell orders have a clear upper hand (buy/sell ratio 0.55). This drop isn’t a soft, drifting decline—it’s funds actively smashing the price.
What’s interesting is that OI is contracting at the same time. The 15-minute contract’s nominal position fell by -460k U, and the 1-hour timeframe also reduced by -790k. **Price down + positions down**—a typical liquidation-cleaning of long positions and a de-leveraging structure, rather than a situation where large new short positions are aggressively entering with heavy volume to drive the move.
The funding rate is still in the high percentile range recently, indicating that the previously crowded leveraged longs are now nearing the end of the passive stop-loss cascade.
At present, the whole pool of unusual activity ranks #22, nominal change is #15, and the definition of the event seems fine. Next, just watch whether the market can stop falling on reduced volume; don’t easily chase shorts at this level—wait for a clearer structure to decide.
9
·
--
AKE Abnormal Movement AnalysisThis alert is kind of interesting. The 24h increase is marked as +15%, but the actual market action has already gone wild. In just one hour, it dropped 22.5%, and volume expanded to 2.8x the average—this isn’t a pullback; it’s someone hitting the gas and driving it down. The float is only 22.8%, so the book is light. The dealer can draw the lines however they want.
First, let’s talk about the location. AKE has risen 48%–89% within 24h. The funding rate has had 8 straight periods of longs paying—suggesting leveraged longs have been extremely enthusiastic. But pay attention: on the hotness leaderboard, BSQ ranks #15; on X there are zero KOLs discussing it—it's all retail traders self-entertaining. This kind of structure is most likely to get harvested. Now down 22.5% in the past hour—this is a classic long stampede scene.
AKE Abnormal Movement Analysis
This alert is kind of interesting. The 24h increase is marked as +15%, but the actual market action has already gone wild. In just one hour, it dropped 22.5%, and volume expanded to 2.8x the average—this isn’t a pullback; it’s someone hitting the gas and driving it down. The float is only 22.8%, so the book is light. The dealer can draw the lines however they want.
First, let’s talk about the location. AKE has risen 48%–89% within 24h. The funding rate has had 8 straight periods of longs paying—suggesting leveraged longs have been extremely enthusiastic. But pay attention: on the hotness leaderboard, BSQ ranks #15; on X there are zero KOLs discussing it—it's all retail traders self-entertaining. This kind of structure is most likely to get harvested. Now down 22.5% in the past hour—this is a classic long stampede scene.
First, let’s talk about the location. AKE has risen 48%–89% within 24h. The funding rate has had 8 straight periods of longs paying—suggesting leveraged longs have been extremely enthusiastic. But pay attention: on the hotness leaderboard, BSQ ranks #15; on X there are zero KOLs discussing it—it's all retail traders self-entertaining. This kind of structure is most likely to get harvested. Now down 22.5% in the past hour—this is a classic long stampede scene.
207
·
--
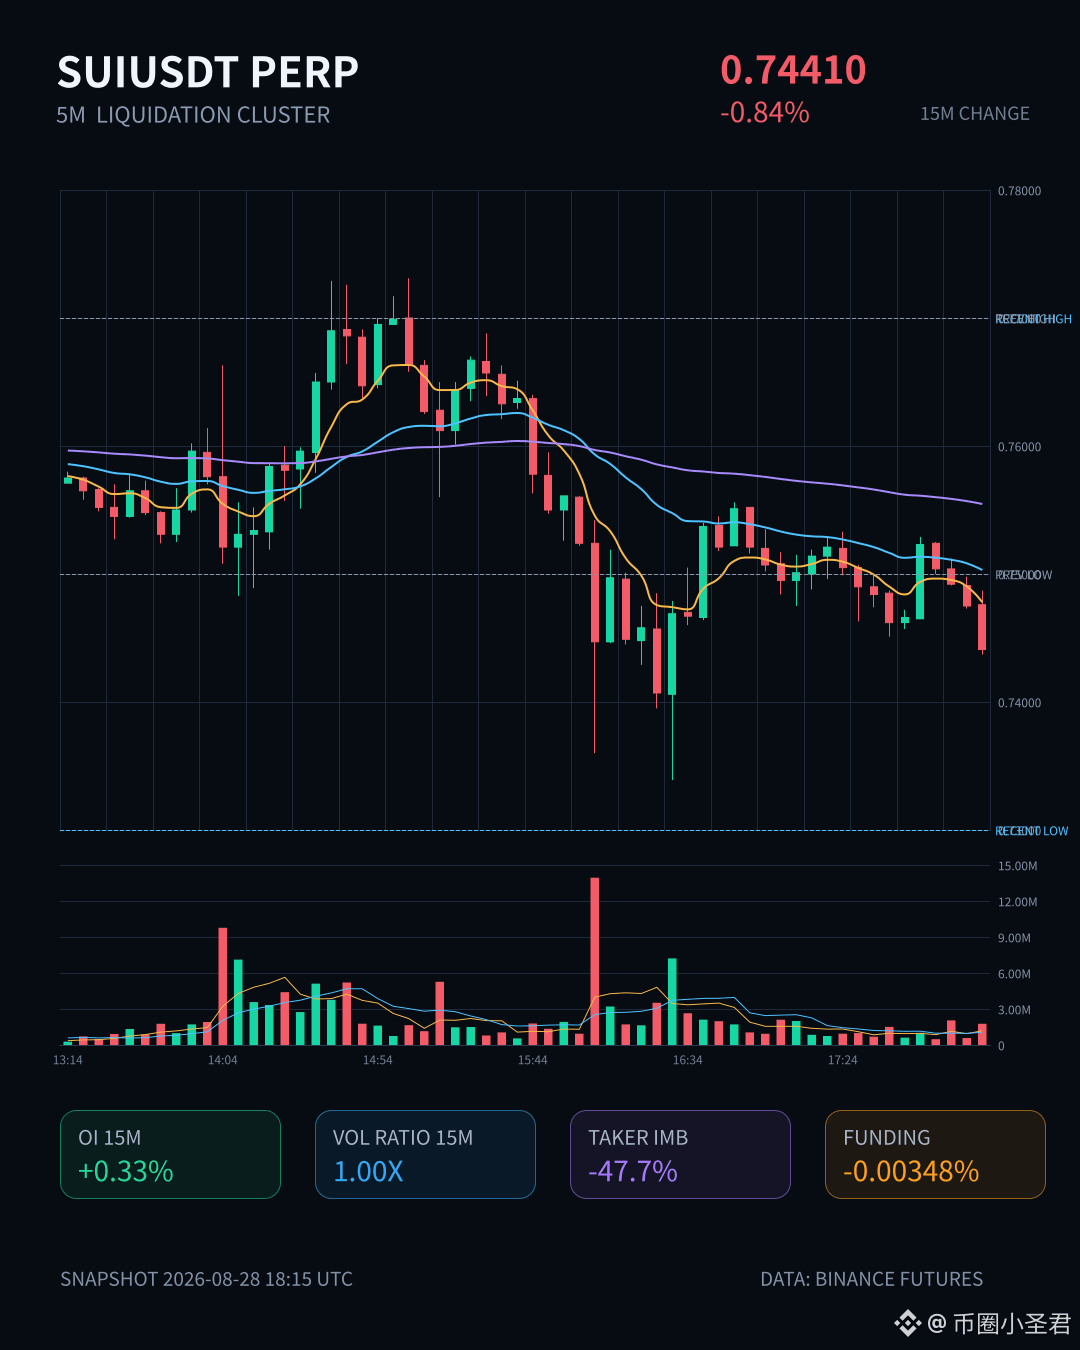
SUI is dropping in a rather interesting way—within 15 minutes it’s down -0.84%. But what’s really worth noting is that the futures open interest is quietly increasing.
The price is falling while OI is rising. This isn’t a normal pullback—someone is actively adding shorts. The executed deal slippage is -47.7%, and the buy/sell ratio has dropped to just 0.35. Large orders are basically one-sided, being hit down into sell pressure. On top of that, Binance Futures’ liquidation signals are concentrated toward the short side, suggesting this round isn’t just people getting trapped—it looks more like newly added leveraged funds are pushing it.
I checked the full-pool rankings: SUI’s notional change ranks #15, and the abnormality level ranks #35 in the whole pool. It’s not at the extreme end, but combined with the fact that the 5-minute liquidation agent has already seen $196K worth of sell-side release, short-term liquidity is shrinking quickly.
So, this selloff isn’t because nobody’s buying—it’s because someone is deliberately smashing it. OI is still climbing; if the price doesn’t get back up later, the short-side chips will keep stacking up. The next key is whether there will be a high-volume bullish candle for a rebound—if not, the probability of further downside is higher.
Don’t rush—wait for the direction.
SUI is dropping in a rather interesting way—within 15 minutes it’s down -0.84%. But what’s really worth noting is that the futures open interest is quietly increasing.
The price is falling while OI is rising. This isn’t a normal pullback—someone is actively adding shorts. The executed deal slippage is -47.7%, and the buy/sell ratio has dropped to just 0.35. Large orders are basically one-sided, being hit down into sell pressure. On top of that, Binance Futures’ liquidation signals are concentrated toward the short side, suggesting this round isn’t just people getting trapped—it looks more like newly added leveraged funds are pushing it.
I checked the full-pool rankings: SUI’s notional change ranks #15, and the abnormality level ranks #35 in the whole pool. It’s not at the extreme end, but combined with the fact that the 5-minute liquidation agent has already seen $196K worth of sell-side release, short-term liquidity is shrinking quickly.
So, this selloff isn’t because nobody’s buying—it’s because someone is deliberately smashing it. OI is still climbing; if the price doesn’t get back up later, the short-side chips will keep stacking up. The next key is whether there will be a high-volume bullish candle for a rebound—if not, the probability of further downside is higher.
Don’t rush—wait for the direction.
The price is falling while OI is rising. This isn’t a normal pullback—someone is actively adding shorts. The executed deal slippage is -47.7%, and the buy/sell ratio has dropped to just 0.35. Large orders are basically one-sided, being hit down into sell pressure. On top of that, Binance Futures’ liquidation signals are concentrated toward the short side, suggesting this round isn’t just people getting trapped—it looks more like newly added leveraged funds are pushing it.
I checked the full-pool rankings: SUI’s notional change ranks #15, and the abnormality level ranks #35 in the whole pool. It’s not at the extreme end, but combined with the fact that the 5-minute liquidation agent has already seen $196K worth of sell-side release, short-term liquidity is shrinking quickly.
So, this selloff isn’t because nobody’s buying—it’s because someone is deliberately smashing it. OI is still climbing; if the price doesn’t get back up later, the short-side chips will keep stacking up. The next key is whether there will be a high-volume bullish candle for a rebound—if not, the probability of further downside is higher.
Don’t rush—wait for the direction.
20
·
--
$ETC This 15-minute surge in volume is pretty decisive—the price directly broke above the upper bound of the past nearly 20 five-minute candlesticks. But there’s a detail worth thinking about: open interest (OI) is falling. OI for the last 15 minutes is down 0.04%, and over the past hour it dropped 0.27%.
This combination—price up while OI down—looks more like shorts are covering rather than fresh long positions being aggressively added.
Active trading dominance is stronger: active buy/sell is up 75.7%, and the buy-to-sell ratio has jumped to 7.24. This suggests the actively placed buys truly have an absolute edge, and the passive orders used to dump have been absorbed very cleanly.
Trade volume is at 1.42x, and the volatility Z-score is 1.61. Market sentiment has clearly been ignited. However, although the anomaly ranking within the whole pool is relatively high (#15), the nominal change is only about 98K USDT, which isn’t that large—more like a short-cycle positioning contest than a trend-level wave of capital migrating.
In the short term, watch the validity of the breakout. If it doesn’t break down on the retest of the upper edge, there’s still room. But if it puts volume back and pushes back into the range, then this move would be acting badly. Keep an eye on it.
$ETC This 15-minute surge in volume is pretty decisive—the price directly broke above the upper bound of the past nearly 20 five-minute candlesticks. But there’s a detail worth thinking about: open interest (OI) is falling. OI for the last 15 minutes is down 0.04%, and over the past hour it dropped 0.27%.
This combination—price up while OI down—looks more like shorts are covering rather than fresh long positions being aggressively added.
Active trading dominance is stronger: active buy/sell is up 75.7%, and the buy-to-sell ratio has jumped to 7.24. This suggests the actively placed buys truly have an absolute edge, and the passive orders used to dump have been absorbed very cleanly.
Trade volume is at 1.42x, and the volatility Z-score is 1.61. Market sentiment has clearly been ignited. However, although the anomaly ranking within the whole pool is relatively high (#15), the nominal change is only about 98K USDT, which isn’t that large—more like a short-cycle positioning contest than a trend-level wave of capital migrating.
In the short term, watch the validity of the breakout. If it doesn’t break down on the retest of the upper edge, there’s still room. But if it puts volume back and pushes back into the range, then this move would be acting badly. Keep an eye on it.
This combination—price up while OI down—looks more like shorts are covering rather than fresh long positions being aggressively added.
Active trading dominance is stronger: active buy/sell is up 75.7%, and the buy-to-sell ratio has jumped to 7.24. This suggests the actively placed buys truly have an absolute edge, and the passive orders used to dump have been absorbed very cleanly.
Trade volume is at 1.42x, and the volatility Z-score is 1.61. Market sentiment has clearly been ignited. However, although the anomaly ranking within the whole pool is relatively high (#15), the nominal change is only about 98K USDT, which isn’t that large—more like a short-cycle positioning contest than a trend-level wave of capital migrating.
In the short term, watch the validity of the breakout. If it doesn’t break down on the retest of the upper edge, there’s still room. But if it puts volume back and pushes back into the range, then this move would be acting badly. Keep an eye on it.
8
Log in to explore more content
Join global crypto users on Binance Square
⚡️ Get latest and useful information about crypto.
💬 Trusted by the world’s largest crypto exchange.
👍 Discover real insights from verified creators.
Email / Phone number
Trending Topics
1
#AppleDebutsFoldablePhone
20,314 views
401 Discussing
2
#IranSaysReadyToEscalateWarWithUS
679 views
33 Discussing
3
#EUExtendsCentralContactPointToCASPs
4,413 views
132 Discussing
4
#US10YTreasuryYieldHitsHighestSinceNov2023
21,410 views
352 Discussing
5
#USTreasuryToBuyBackUpTo$6BLongDatedDebt
15,270 views
159 Discussing
6
#BitcoinSurpasses$79K
64,860 views
275 Discussing
7
#BrentCrudeTops$100
121,317 views
399 Discussing
8
#USADPWeeklyEmploymentRises12000
104,792 views
1,262 Discussing
9
#BankOfAmericaGroupPilotsUSBDCStablecoin
76,831 views
1,015 Discussing
10
#RippleLobbiesToAdvanceCLARITYActVote
112,462 views
1,291 Discussing