
暗流追踪
3.4k Posts

暗流追踪
HFD.FUND 用数据,掌控趋势
73 Following
590 Followers
907 Liked
Posts
All
Quotes
Videos
Summary:
Continuing from the previous text, after the price stabilized and consolidated with a dip, it began to recover.
Price projection:
The price rebounds to fill back 79314 and 79524.
Review of the previous text:
Support formed around 77790. The deepest possible needle-like wick could be in the 76800-76300 area. After the wick, the price slowly rebounds toward 79500; once it enters 79500, it is likely to break through 80421.
Actual price movement:
After fluctuating around 77000, the price is now starting to rise; it has already reached around 79100.
Outlook for the next price movement:
Chip/positioning vacuum.
In the short term, the bears attack, but the strength is small; it has already been filled back, so expect consolidation.
In the medium term, the bulls attack—watch for an upward trend.
In the long term, the bears attack in the 78361-79000 range, but it is about to be filled back; for now, expect consolidation.
Based on this indicator: short-term consolidation and medium-term upward movement; long-term consolidation, with the trend temporarily turning upward.
Price channels:
Equal-quantity short-term average 77460; upper limit 94690; lower limit 67640.
Equal-quantity medium-term average 72960; upper limit 80703; lower limit 65600.
Equal-quantity long-term average 81240; upper limit 93143; lower limit 72450.
As the price falls, the short-term average declines in sync and provides support. For now, expect an upward trend, with resistance around 81000.
Equal base short-term average 66820; upper limit 80980; lower limit 62310.
Equal base medium-term average 67380; upper limit 80700; lower limit 62500.
Equal base long-term average 66920; upper limit 80450; lower limit 62500.
Based on this indicator: there is basically no change from the previous text. After reaching a top, expect a small pullback. Overhead resistance is around 81000.
From the two indicators, overhead resistance is consistent around 81000. For now, expect the price to return to the average and then rebound toward the upper limit.
Limit-price absorption:
Short term: After touching historical long support at 77440-76900, it rebounds; the target is for the bearish attack zone 78281-79314.
Medium term: Fill back the bearish attack zone 78281-79524.
Long term: The historical resistance area is 81300-83000. Support is at 76300-74500. Expect wide-range consolidation from 81300 down to 76300.
Based on this indicator: the price will rebound and fill back 79314 and 79524.
Volume-price order blocks:
Short term: The latest distributed order block top at 78364 has already been broken through; the trend is consolidating and rising.
Medium term: Accumulation order blocks step upward; the bottoming formation is basically successful.
Long term: Return to the historical distribution order blocks—based on what we said above, it may fill back the 79272-80421 area.
Based on this indicator: first, the bottoming is basically successful; the rebound has already absorbed the short-term distribution. The price has returned to the long-term distribution range and is heading toward 79272-80421.
Continuing from the previous text, after the price stabilized and consolidated with a dip, it began to recover.
Price projection:
The price rebounds to fill back 79314 and 79524.
Review of the previous text:
Support formed around 77790. The deepest possible needle-like wick could be in the 76800-76300 area. After the wick, the price slowly rebounds toward 79500; once it enters 79500, it is likely to break through 80421.
Actual price movement:
After fluctuating around 77000, the price is now starting to rise; it has already reached around 79100.
Outlook for the next price movement:
Chip/positioning vacuum.
In the short term, the bears attack, but the strength is small; it has already been filled back, so expect consolidation.
In the medium term, the bulls attack—watch for an upward trend.
In the long term, the bears attack in the 78361-79000 range, but it is about to be filled back; for now, expect consolidation.
Based on this indicator: short-term consolidation and medium-term upward movement; long-term consolidation, with the trend temporarily turning upward.
Price channels:
Equal-quantity short-term average 77460; upper limit 94690; lower limit 67640.
Equal-quantity medium-term average 72960; upper limit 80703; lower limit 65600.
Equal-quantity long-term average 81240; upper limit 93143; lower limit 72450.
As the price falls, the short-term average declines in sync and provides support. For now, expect an upward trend, with resistance around 81000.
Equal base short-term average 66820; upper limit 80980; lower limit 62310.
Equal base medium-term average 67380; upper limit 80700; lower limit 62500.
Equal base long-term average 66920; upper limit 80450; lower limit 62500.
Based on this indicator: there is basically no change from the previous text. After reaching a top, expect a small pullback. Overhead resistance is around 81000.
From the two indicators, overhead resistance is consistent around 81000. For now, expect the price to return to the average and then rebound toward the upper limit.
Limit-price absorption:
Short term: After touching historical long support at 77440-76900, it rebounds; the target is for the bearish attack zone 78281-79314.
Medium term: Fill back the bearish attack zone 78281-79524.
Long term: The historical resistance area is 81300-83000. Support is at 76300-74500. Expect wide-range consolidation from 81300 down to 76300.
Based on this indicator: the price will rebound and fill back 79314 and 79524.
Volume-price order blocks:
Short term: The latest distributed order block top at 78364 has already been broken through; the trend is consolidating and rising.
Medium term: Accumulation order blocks step upward; the bottoming formation is basically successful.
Long term: Return to the historical distribution order blocks—based on what we said above, it may fill back the 79272-80421 area.
Based on this indicator: first, the bottoming is basically successful; the rebound has already absorbed the short-term distribution. The price has returned to the long-term distribution range and is heading toward 79272-80421.
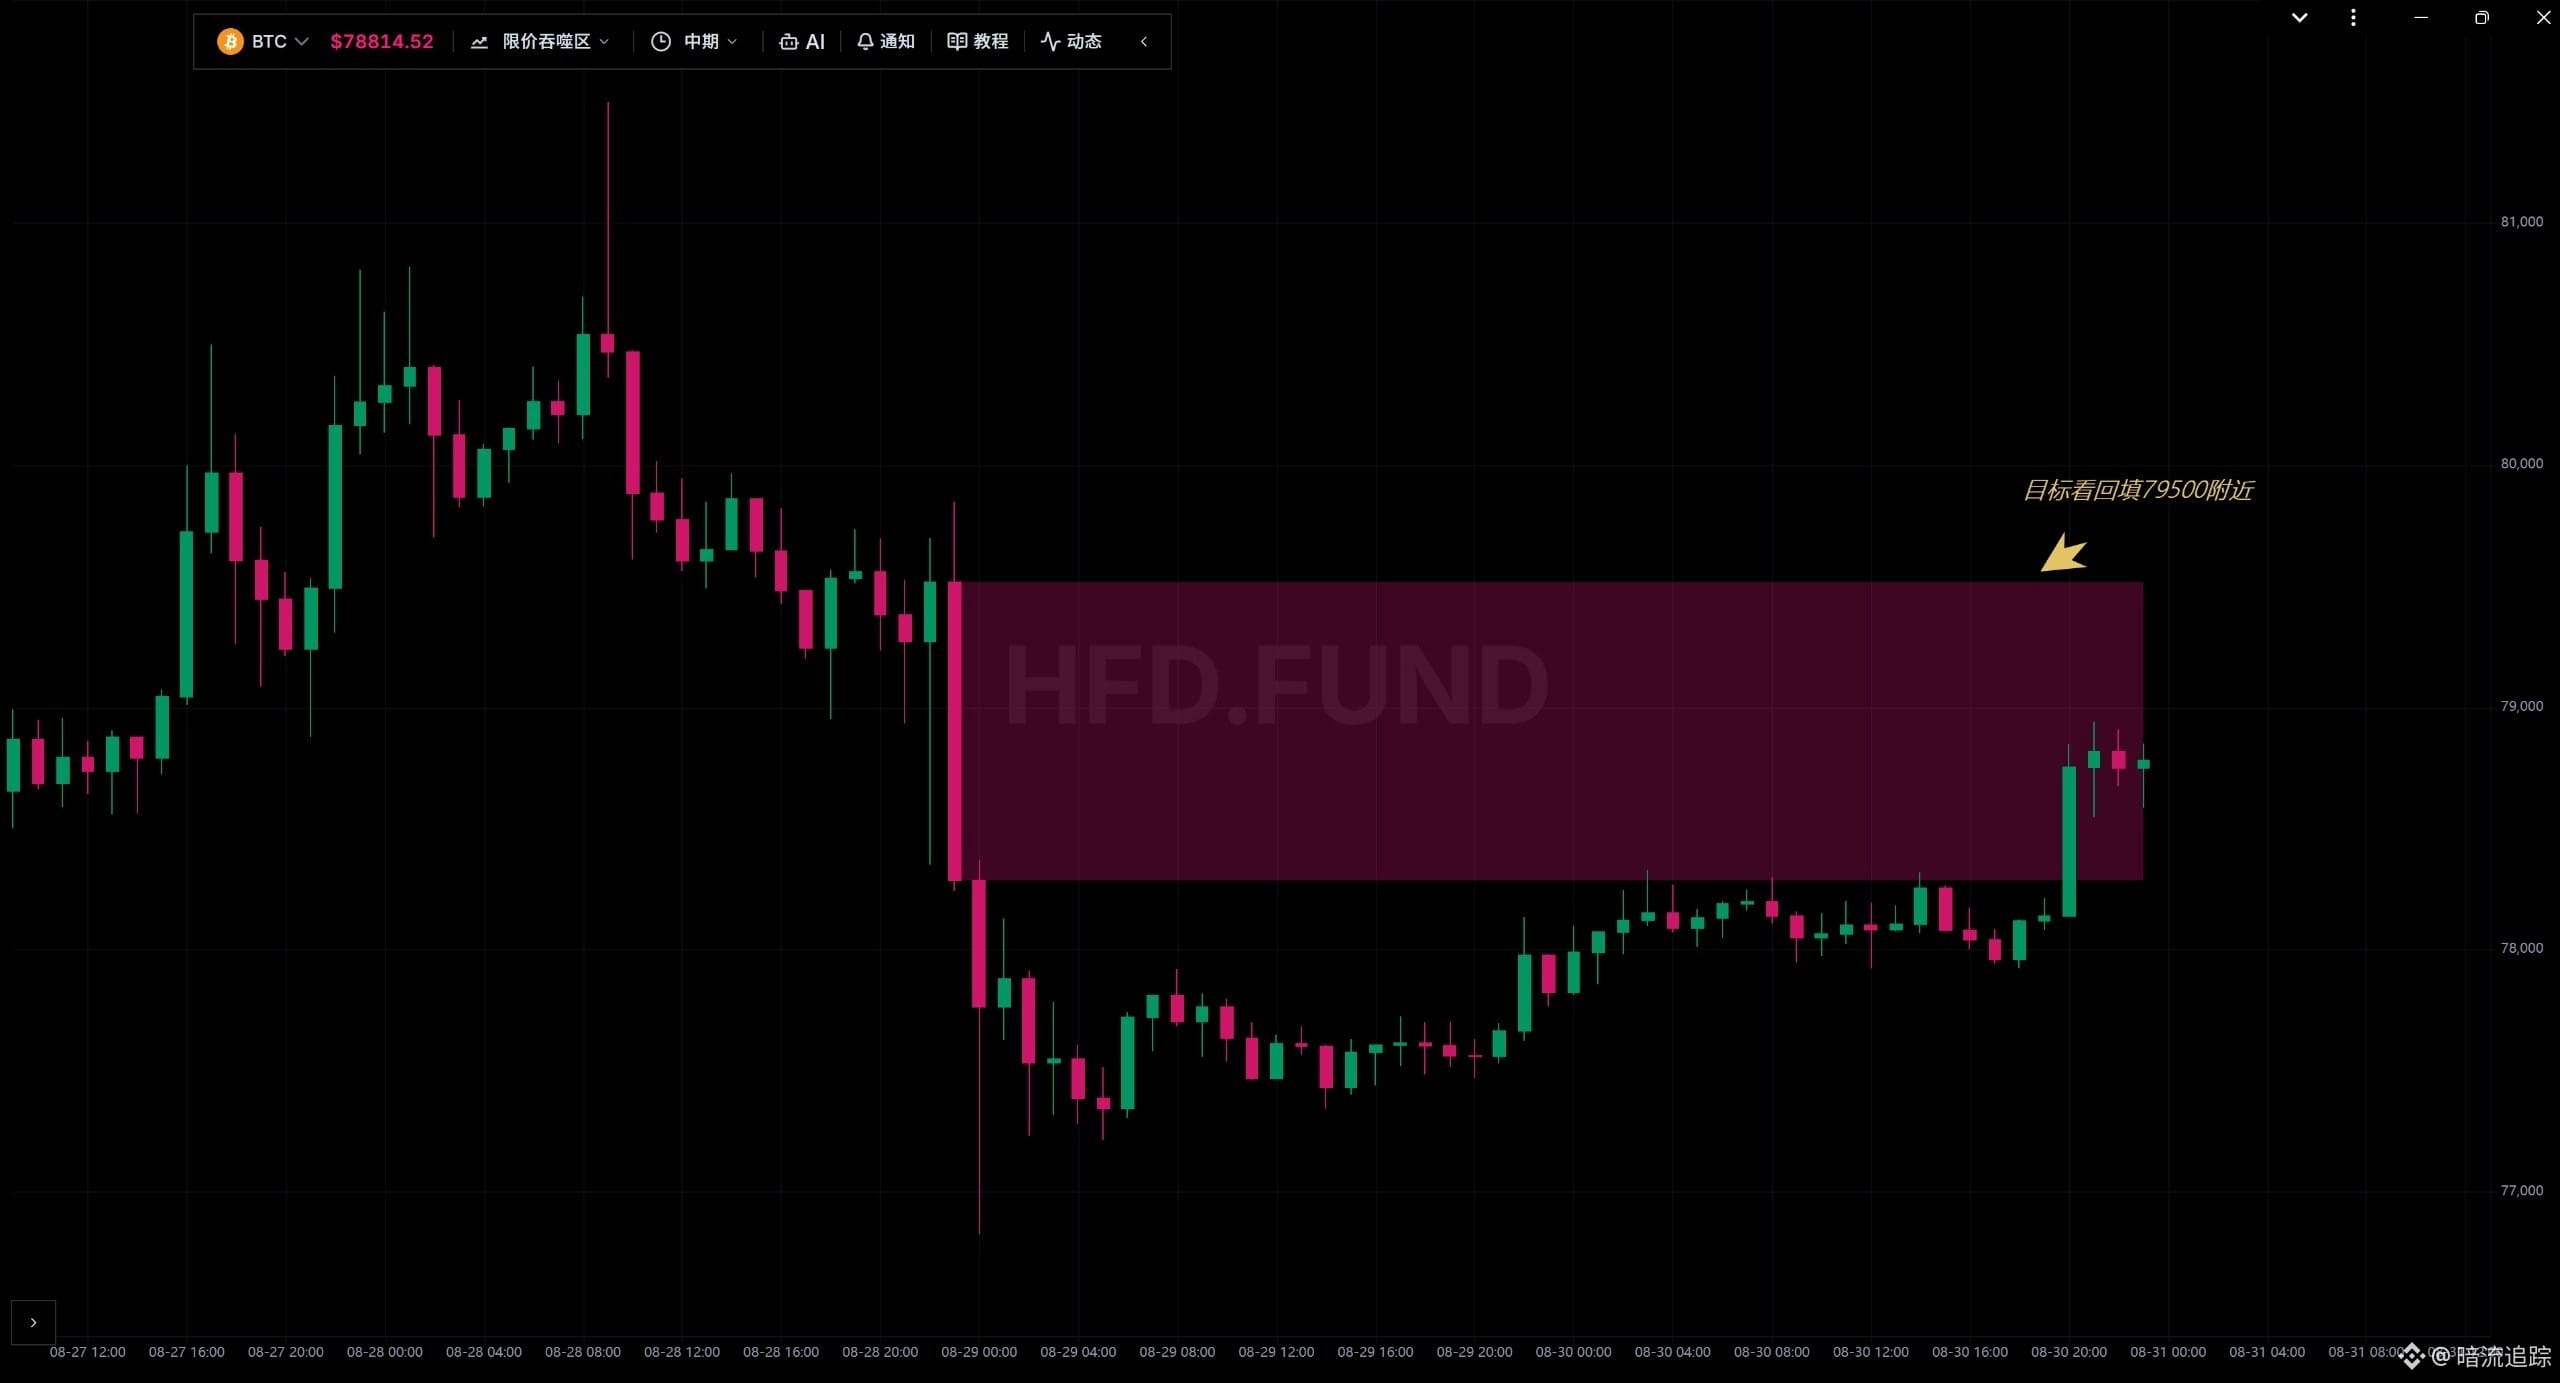
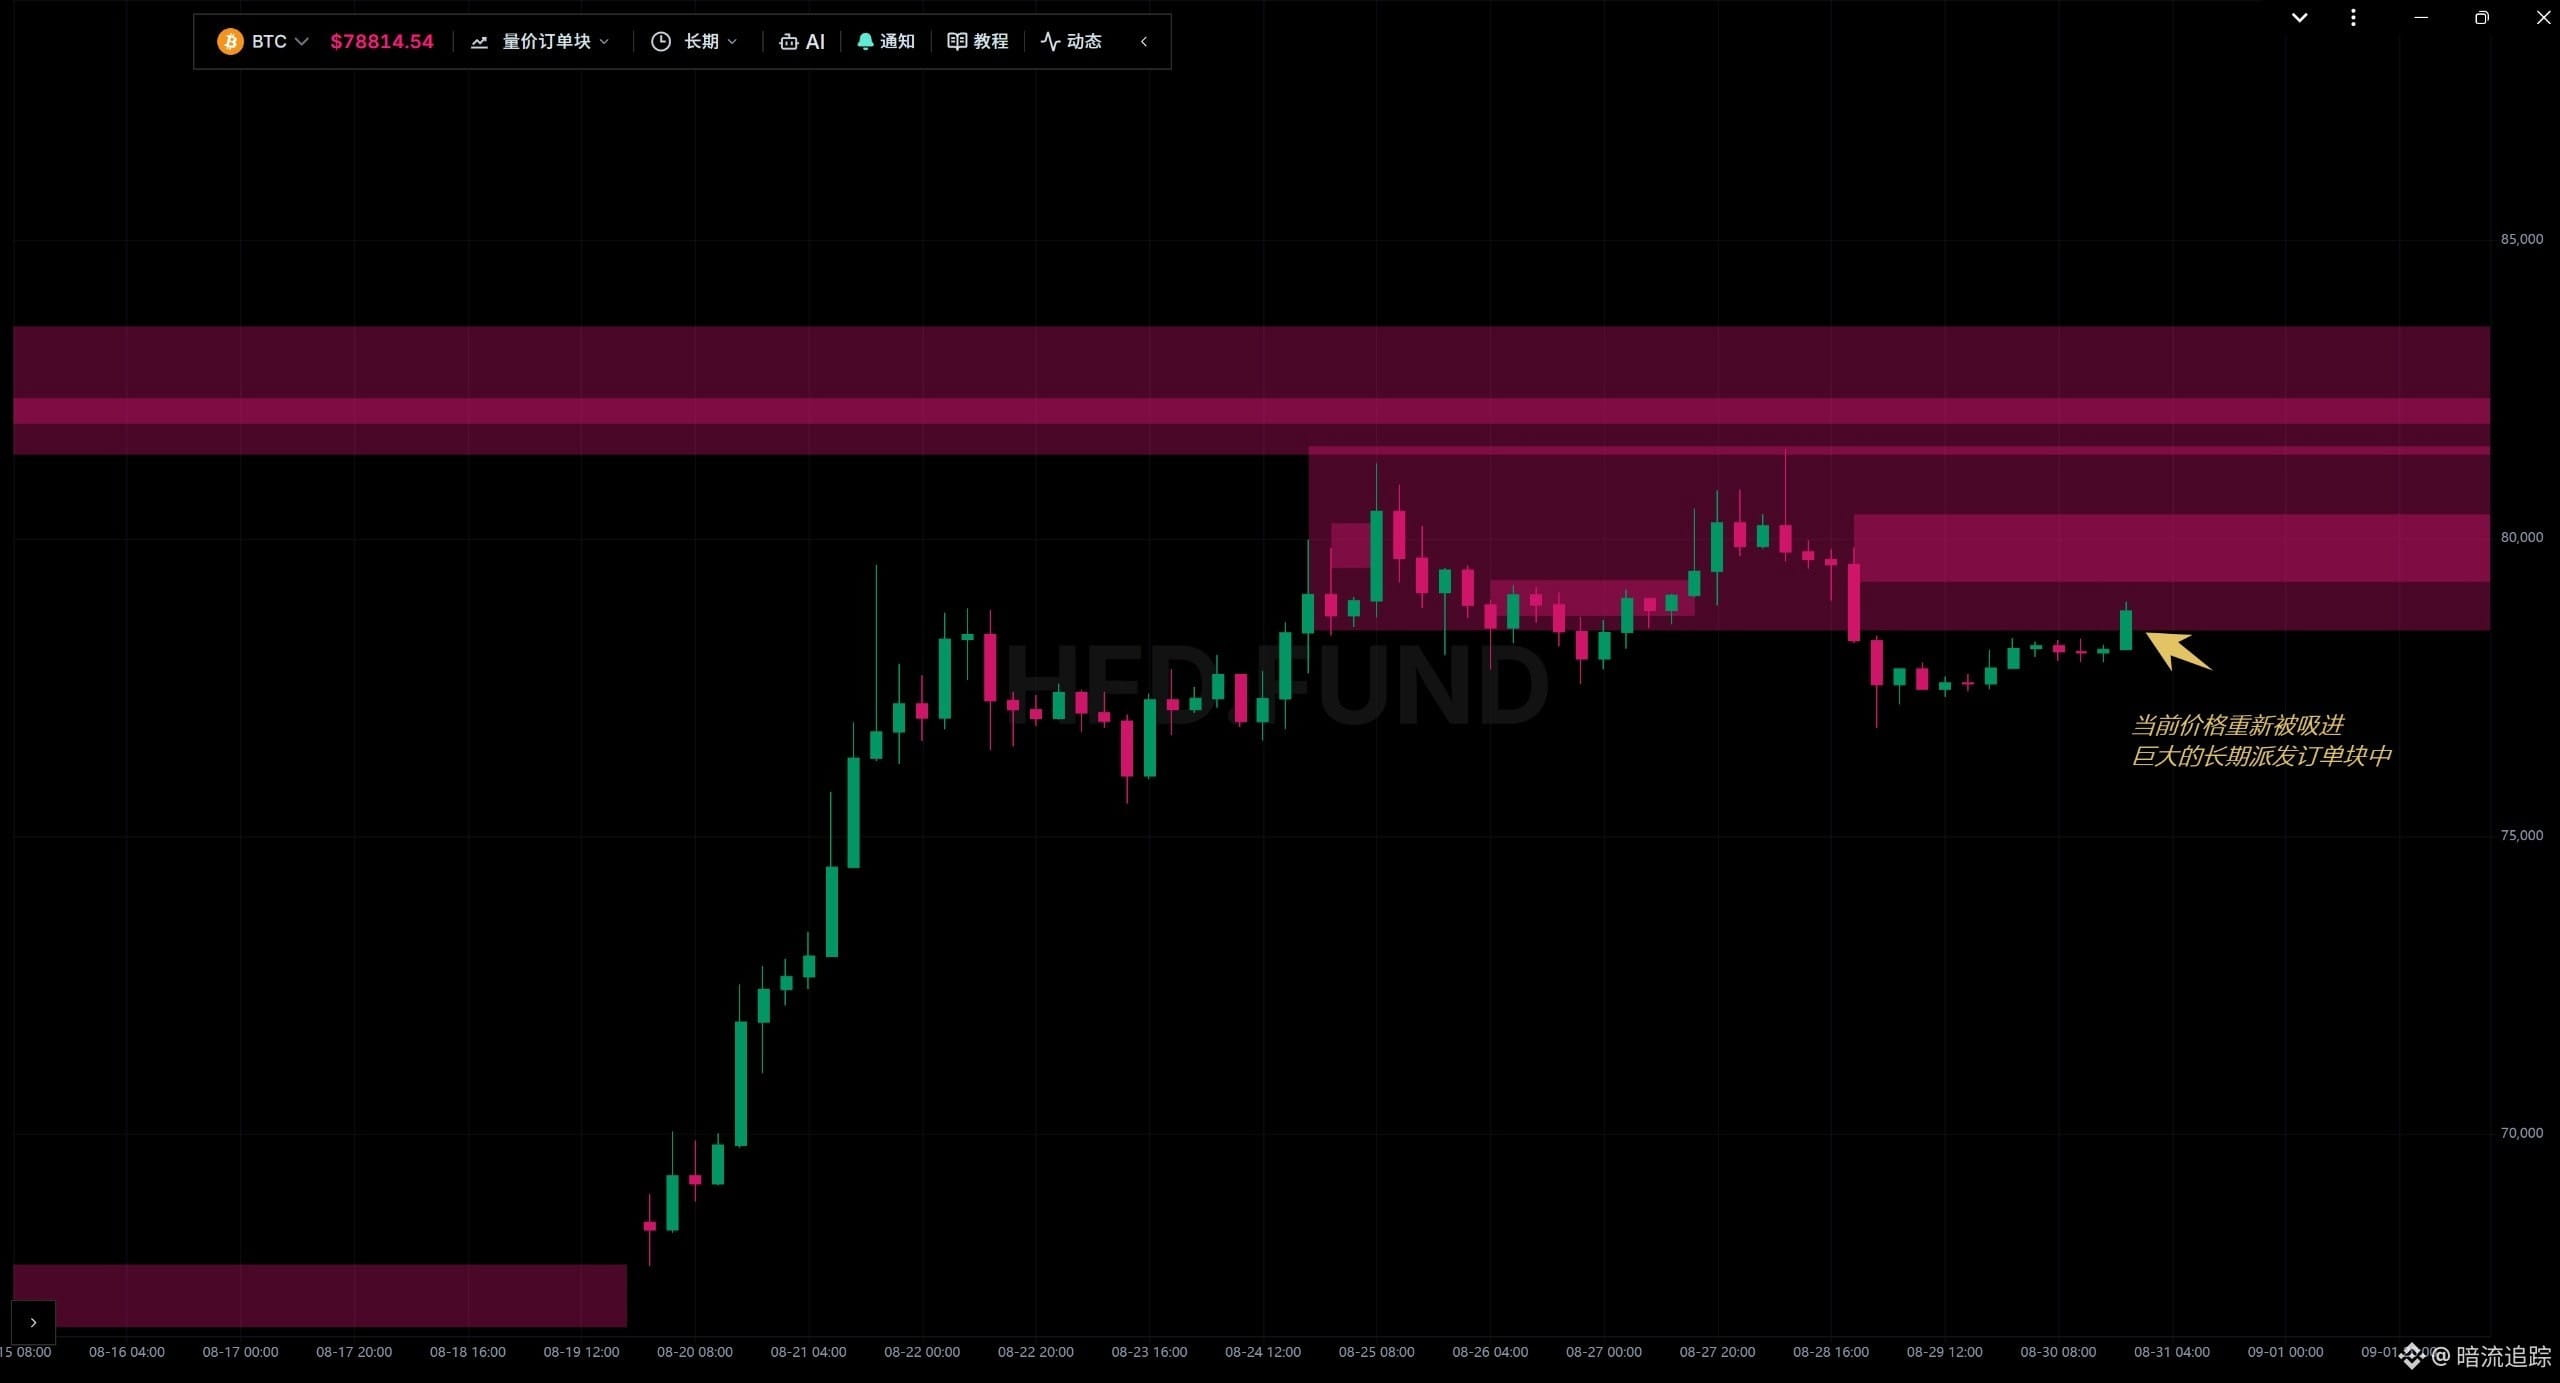
Summary:
Continuing from the previous text, the current trend is a dip-buying, range-bound consolidation.
Price projection:
Support forms around 77790. The deepest possible wick could pierce into the 76800–76300 zone. After that wick, the price slowly rebounds toward 79500. Once the price enters 79500, it is likely to break through 80421.
Previous projection:
The price is drawn into the region above 80450 by an order block, targeting a break through around 81500.
Actual price movement:
After reaching as high as around 81500, it started falling all the way, and is currently around 78000.
Future outlook:
Chip vacuum.
In the short term, bearish attacks have been filled; for now, expect a downward-leaning range-bound trend.
In the medium term, bearish attacks look like they are trending downward.
In the long term, bearish attacks are in the 78361–79000 area; looking at the trend, expect it to move downward.
For this indicator, all three time cycles show bearish attacks, suggesting a downward trend.
Price channel:
Equal-volume short-term average: 77790; upper limit 94690; lower limit 67640.
Equal-volume medium-term average: 73650; upper limit 80703; lower limit 65600.
Equal-volume long-term average: 81240; upper limit 93143; lower limit 72450.
Not much change from the previous text. The price has touched the medium-term upper limit; it is now near the short-term average. Expect the price to consolidate around here.
Equal-volume short-term average by this metric: 66610; upper limit 80980; lower limit 62310.
Equal-volume medium-term average by this metric: 66600; upper limit 80700; lower limit 62500.
Equal-volume long-term average by this metric: 66920; upper limit 80450; lower limit 62500.
Based on this indicator, compared with the previous text there is basically no change. After topping, the price needs to pull back to find support.
From both indicators: since the price topped, it needs to pull back to find support, and it is already near the medium-term average. The price is likely to consolidate around the average of 77790.
Limit-price absorption:
In the short term, bearish attacks may pierce through the historical long defensive line around 76800.
In the medium term, bearish attacks are 78290–79520—this is the latest attack line. Below that, no clear target is visible; it is possible that 79520 will be refilled.
There is a historical overhead resistance zone of 81300–83000. Support lies at 76300–74500. The day’s high was pressed into 81300, creating relatively heavy selling pressure, pushing the price down all the way; it may very well test support around 76300.
Based on this indicator, the decline is precisely because the wick was caused by the relatively heavy selling pressure from the historical area 81300–83000. The swing low could fall to 76800–76300. After the downward move completes, it may move upward again to refill 78290–79520.
Continuing from the previous text, the current trend is a dip-buying, range-bound consolidation.
Price projection:
Support forms around 77790. The deepest possible wick could pierce into the 76800–76300 zone. After that wick, the price slowly rebounds toward 79500. Once the price enters 79500, it is likely to break through 80421.
Previous projection:
The price is drawn into the region above 80450 by an order block, targeting a break through around 81500.
Actual price movement:
After reaching as high as around 81500, it started falling all the way, and is currently around 78000.
Future outlook:
Chip vacuum.
In the short term, bearish attacks have been filled; for now, expect a downward-leaning range-bound trend.
In the medium term, bearish attacks look like they are trending downward.
In the long term, bearish attacks are in the 78361–79000 area; looking at the trend, expect it to move downward.
For this indicator, all three time cycles show bearish attacks, suggesting a downward trend.
Price channel:
Equal-volume short-term average: 77790; upper limit 94690; lower limit 67640.
Equal-volume medium-term average: 73650; upper limit 80703; lower limit 65600.
Equal-volume long-term average: 81240; upper limit 93143; lower limit 72450.
Not much change from the previous text. The price has touched the medium-term upper limit; it is now near the short-term average. Expect the price to consolidate around here.
Equal-volume short-term average by this metric: 66610; upper limit 80980; lower limit 62310.
Equal-volume medium-term average by this metric: 66600; upper limit 80700; lower limit 62500.
Equal-volume long-term average by this metric: 66920; upper limit 80450; lower limit 62500.
Based on this indicator, compared with the previous text there is basically no change. After topping, the price needs to pull back to find support.
From both indicators: since the price topped, it needs to pull back to find support, and it is already near the medium-term average. The price is likely to consolidate around the average of 77790.
Limit-price absorption:
In the short term, bearish attacks may pierce through the historical long defensive line around 76800.
In the medium term, bearish attacks are 78290–79520—this is the latest attack line. Below that, no clear target is visible; it is possible that 79520 will be refilled.
There is a historical overhead resistance zone of 81300–83000. Support lies at 76300–74500. The day’s high was pressed into 81300, creating relatively heavy selling pressure, pushing the price down all the way; it may very well test support around 76300.
Based on this indicator, the decline is precisely because the wick was caused by the relatively heavy selling pressure from the historical area 81300–83000. The swing low could fall to 76800–76300. After the downward move completes, it may move upward again to refill 78290–79520.
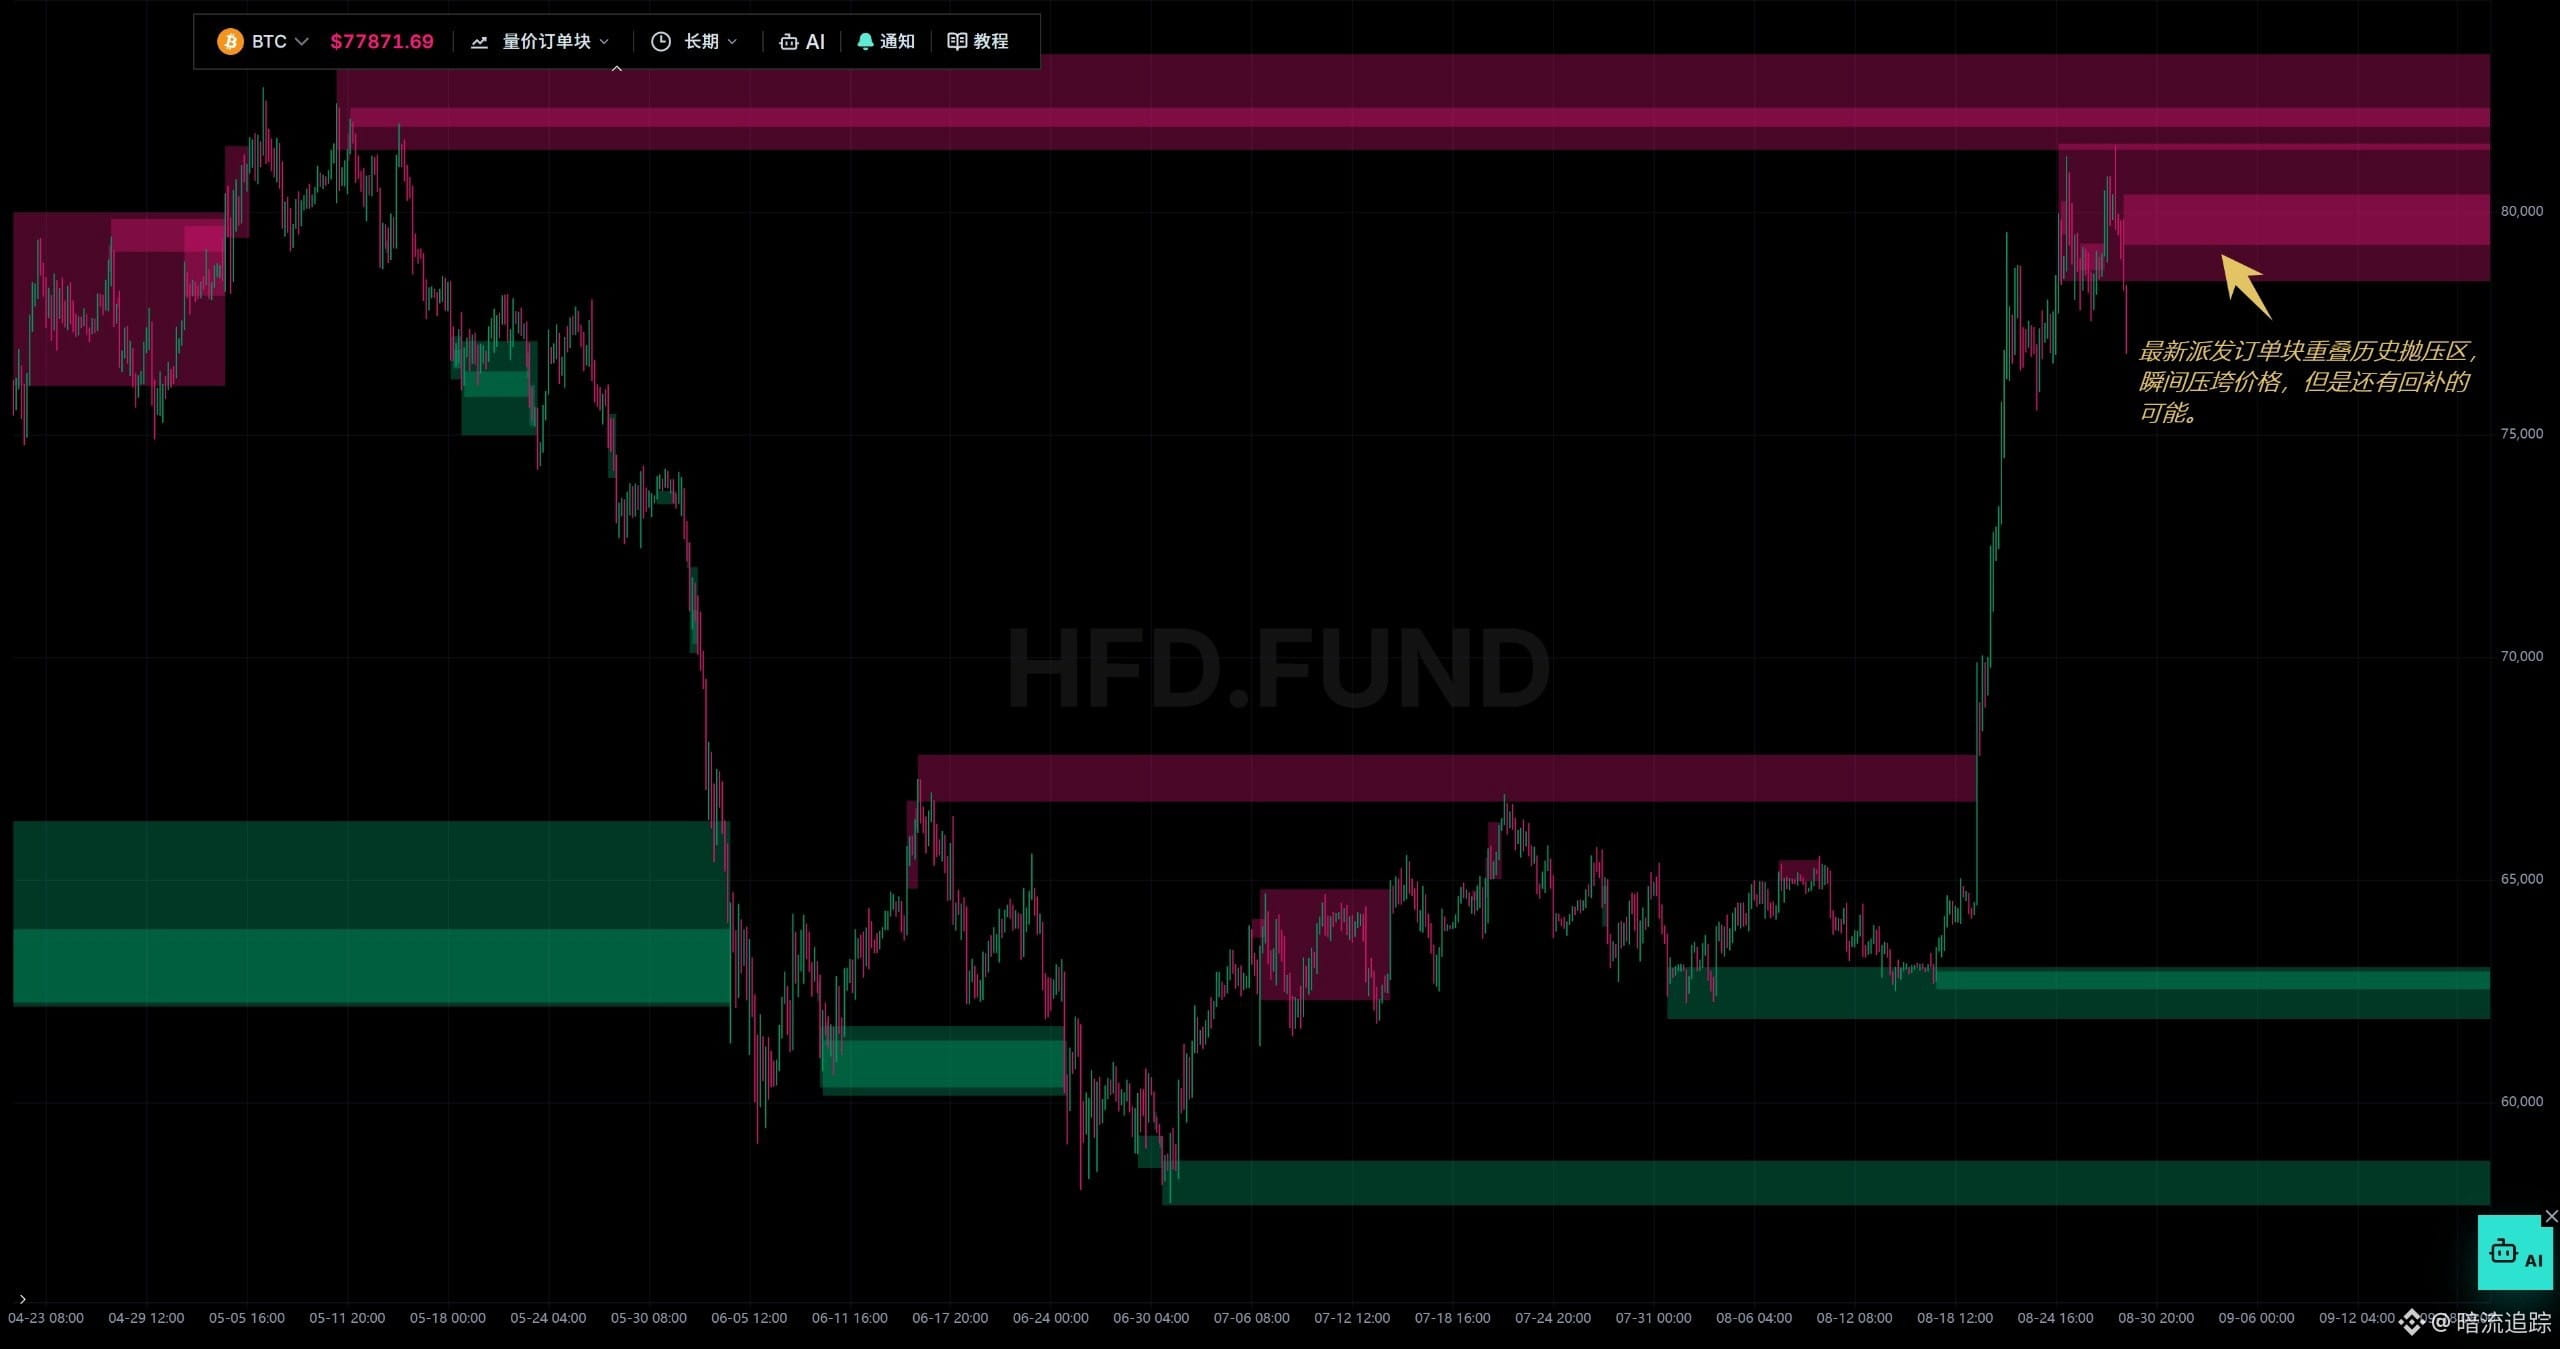
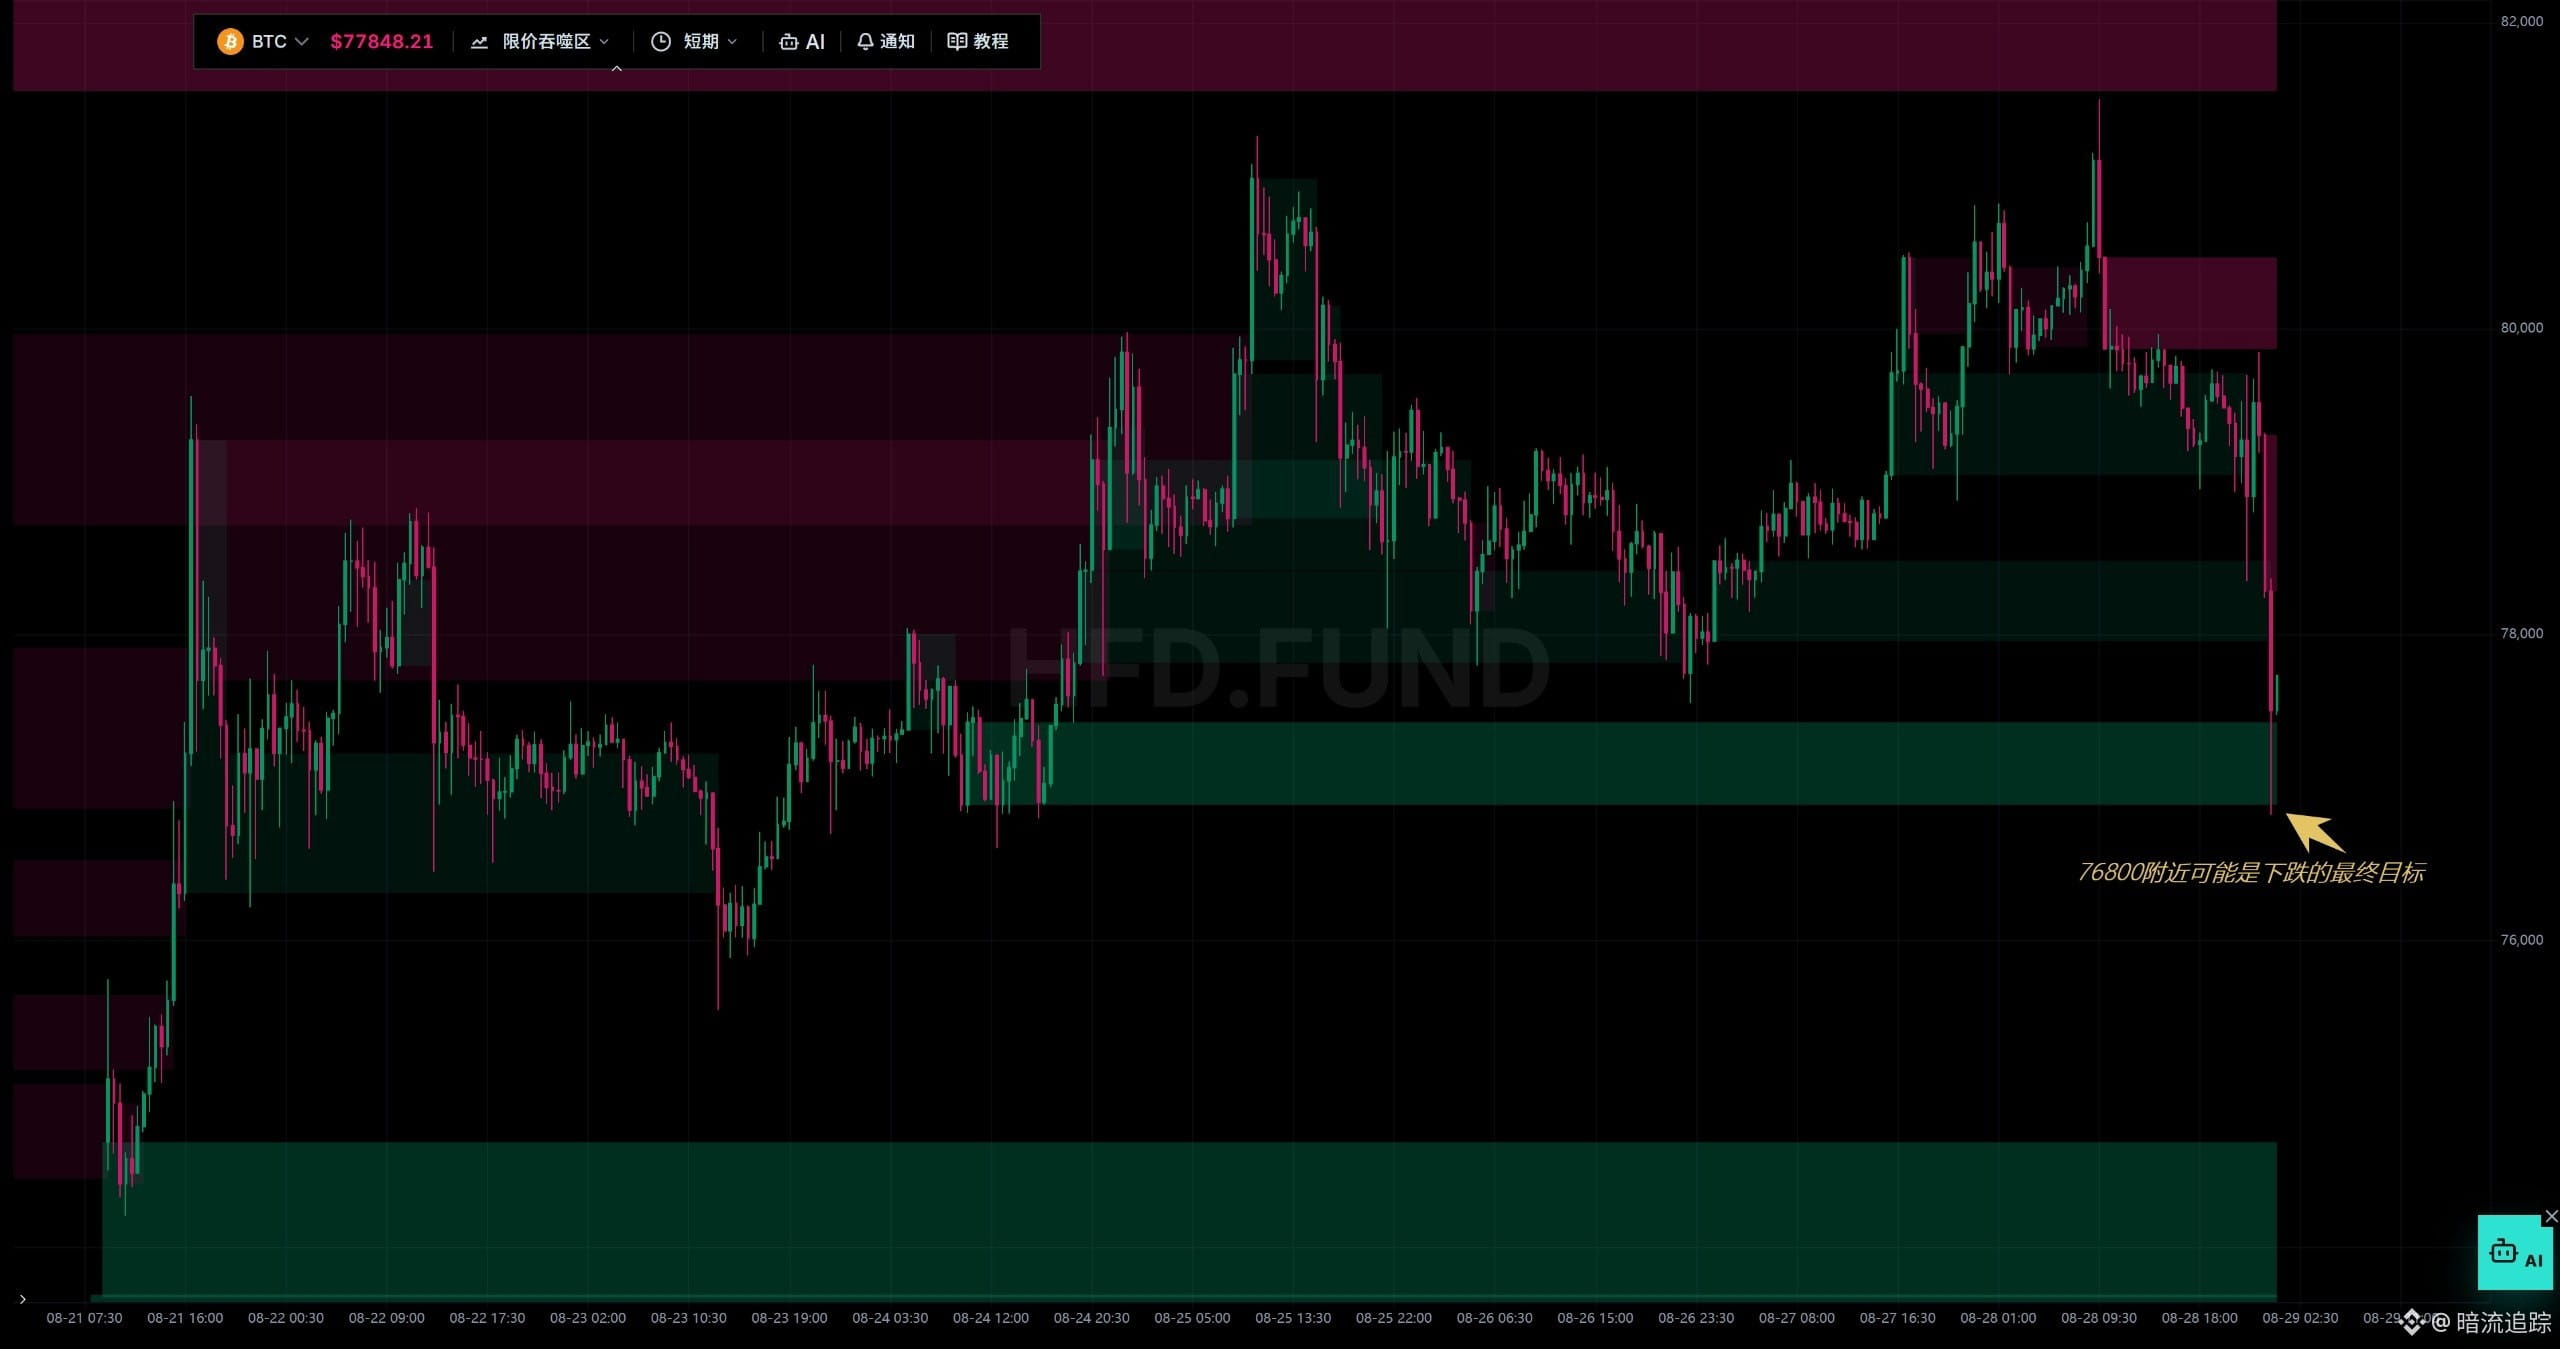
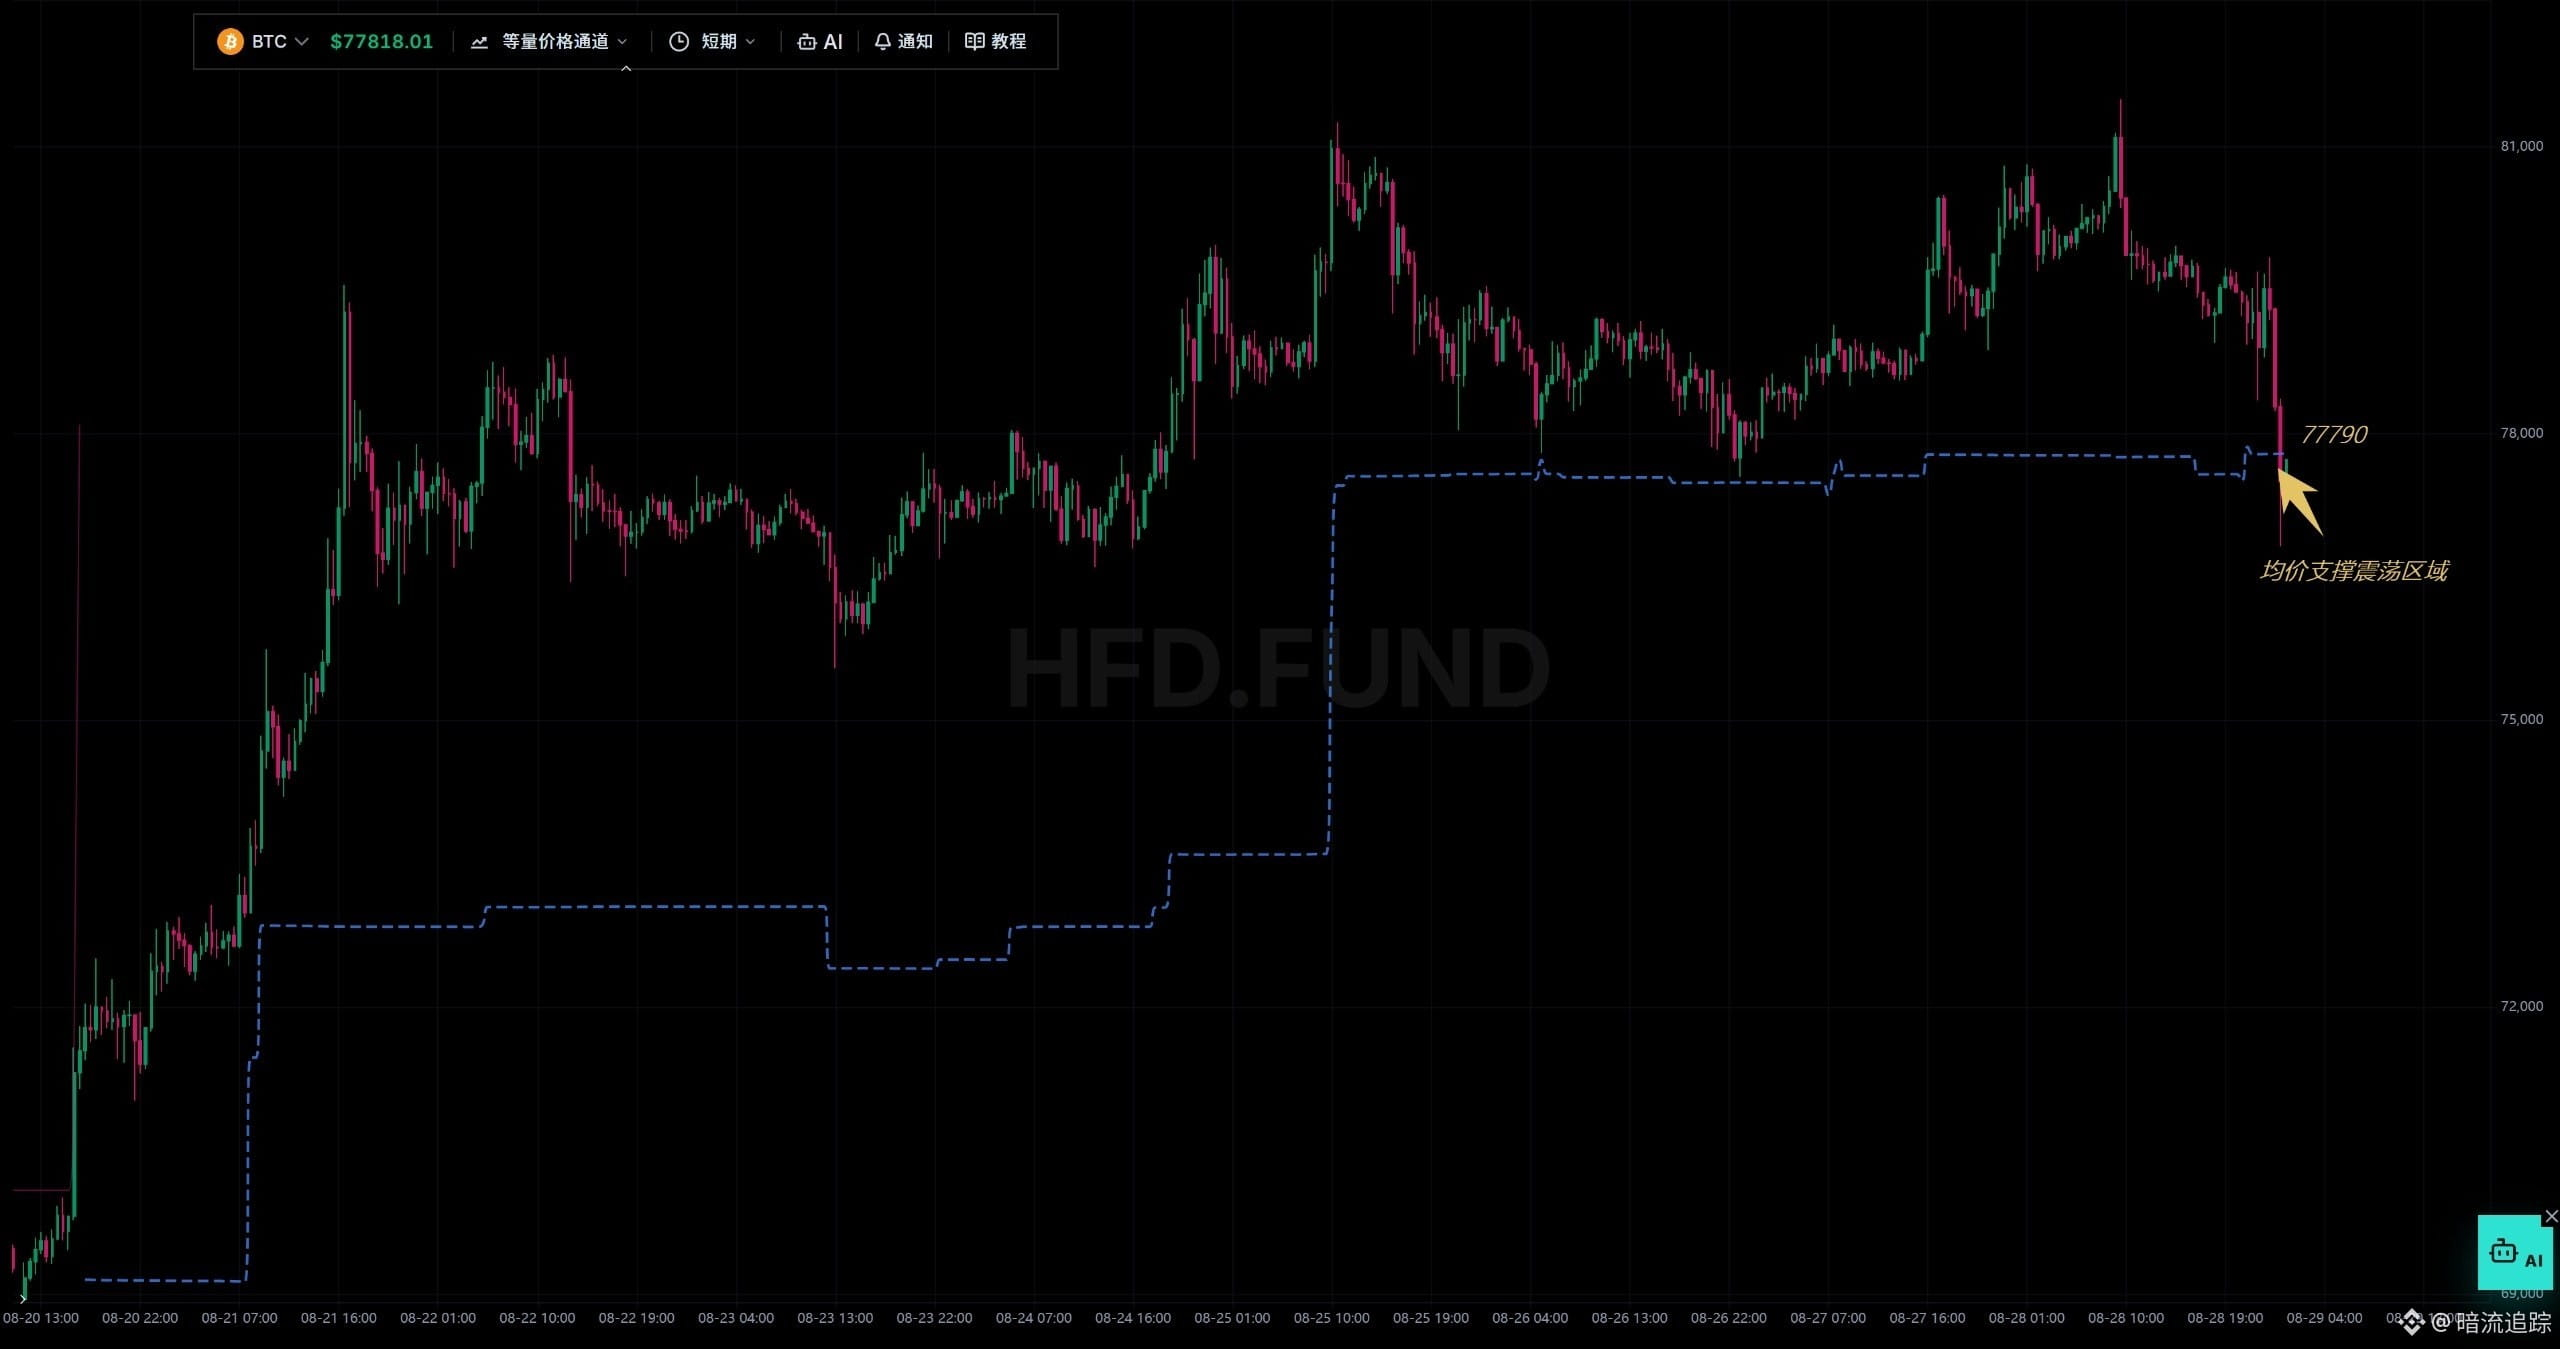
Summary:
Building on the prior text, the market is oscillating upward.
Price Projection:
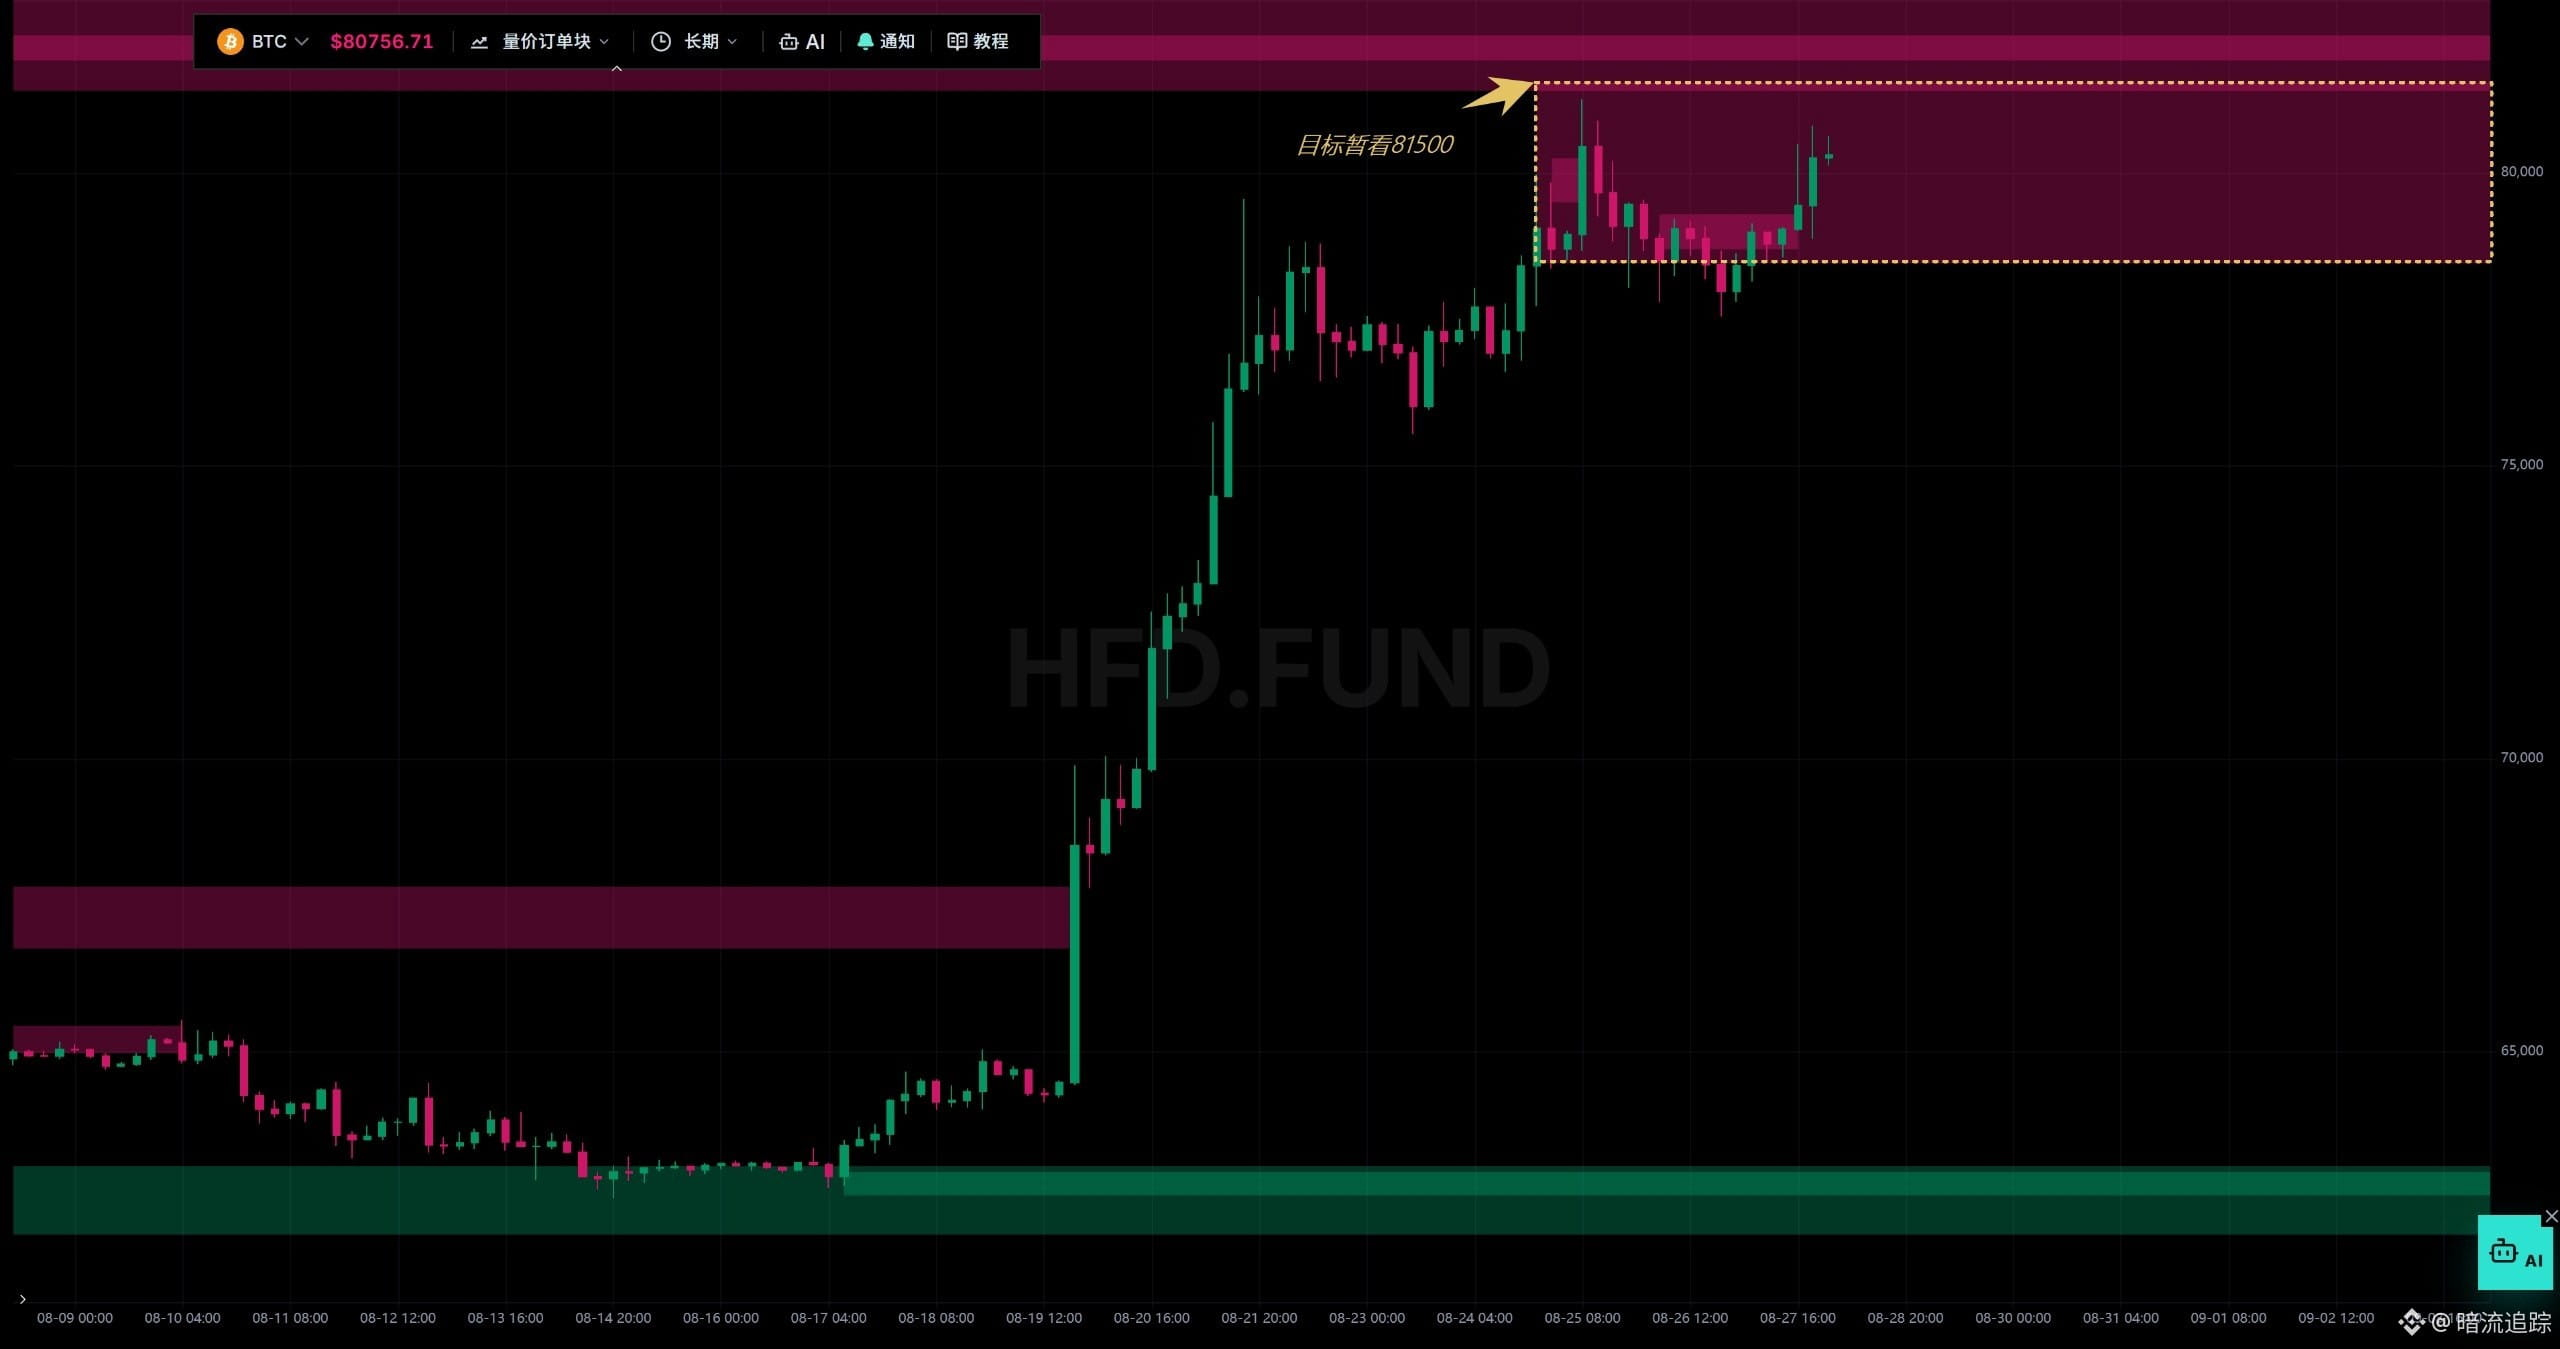
Price is being drawn by an order block into the area above 80450, with the goal of breaking through the 81500 area.
Prior Projection:
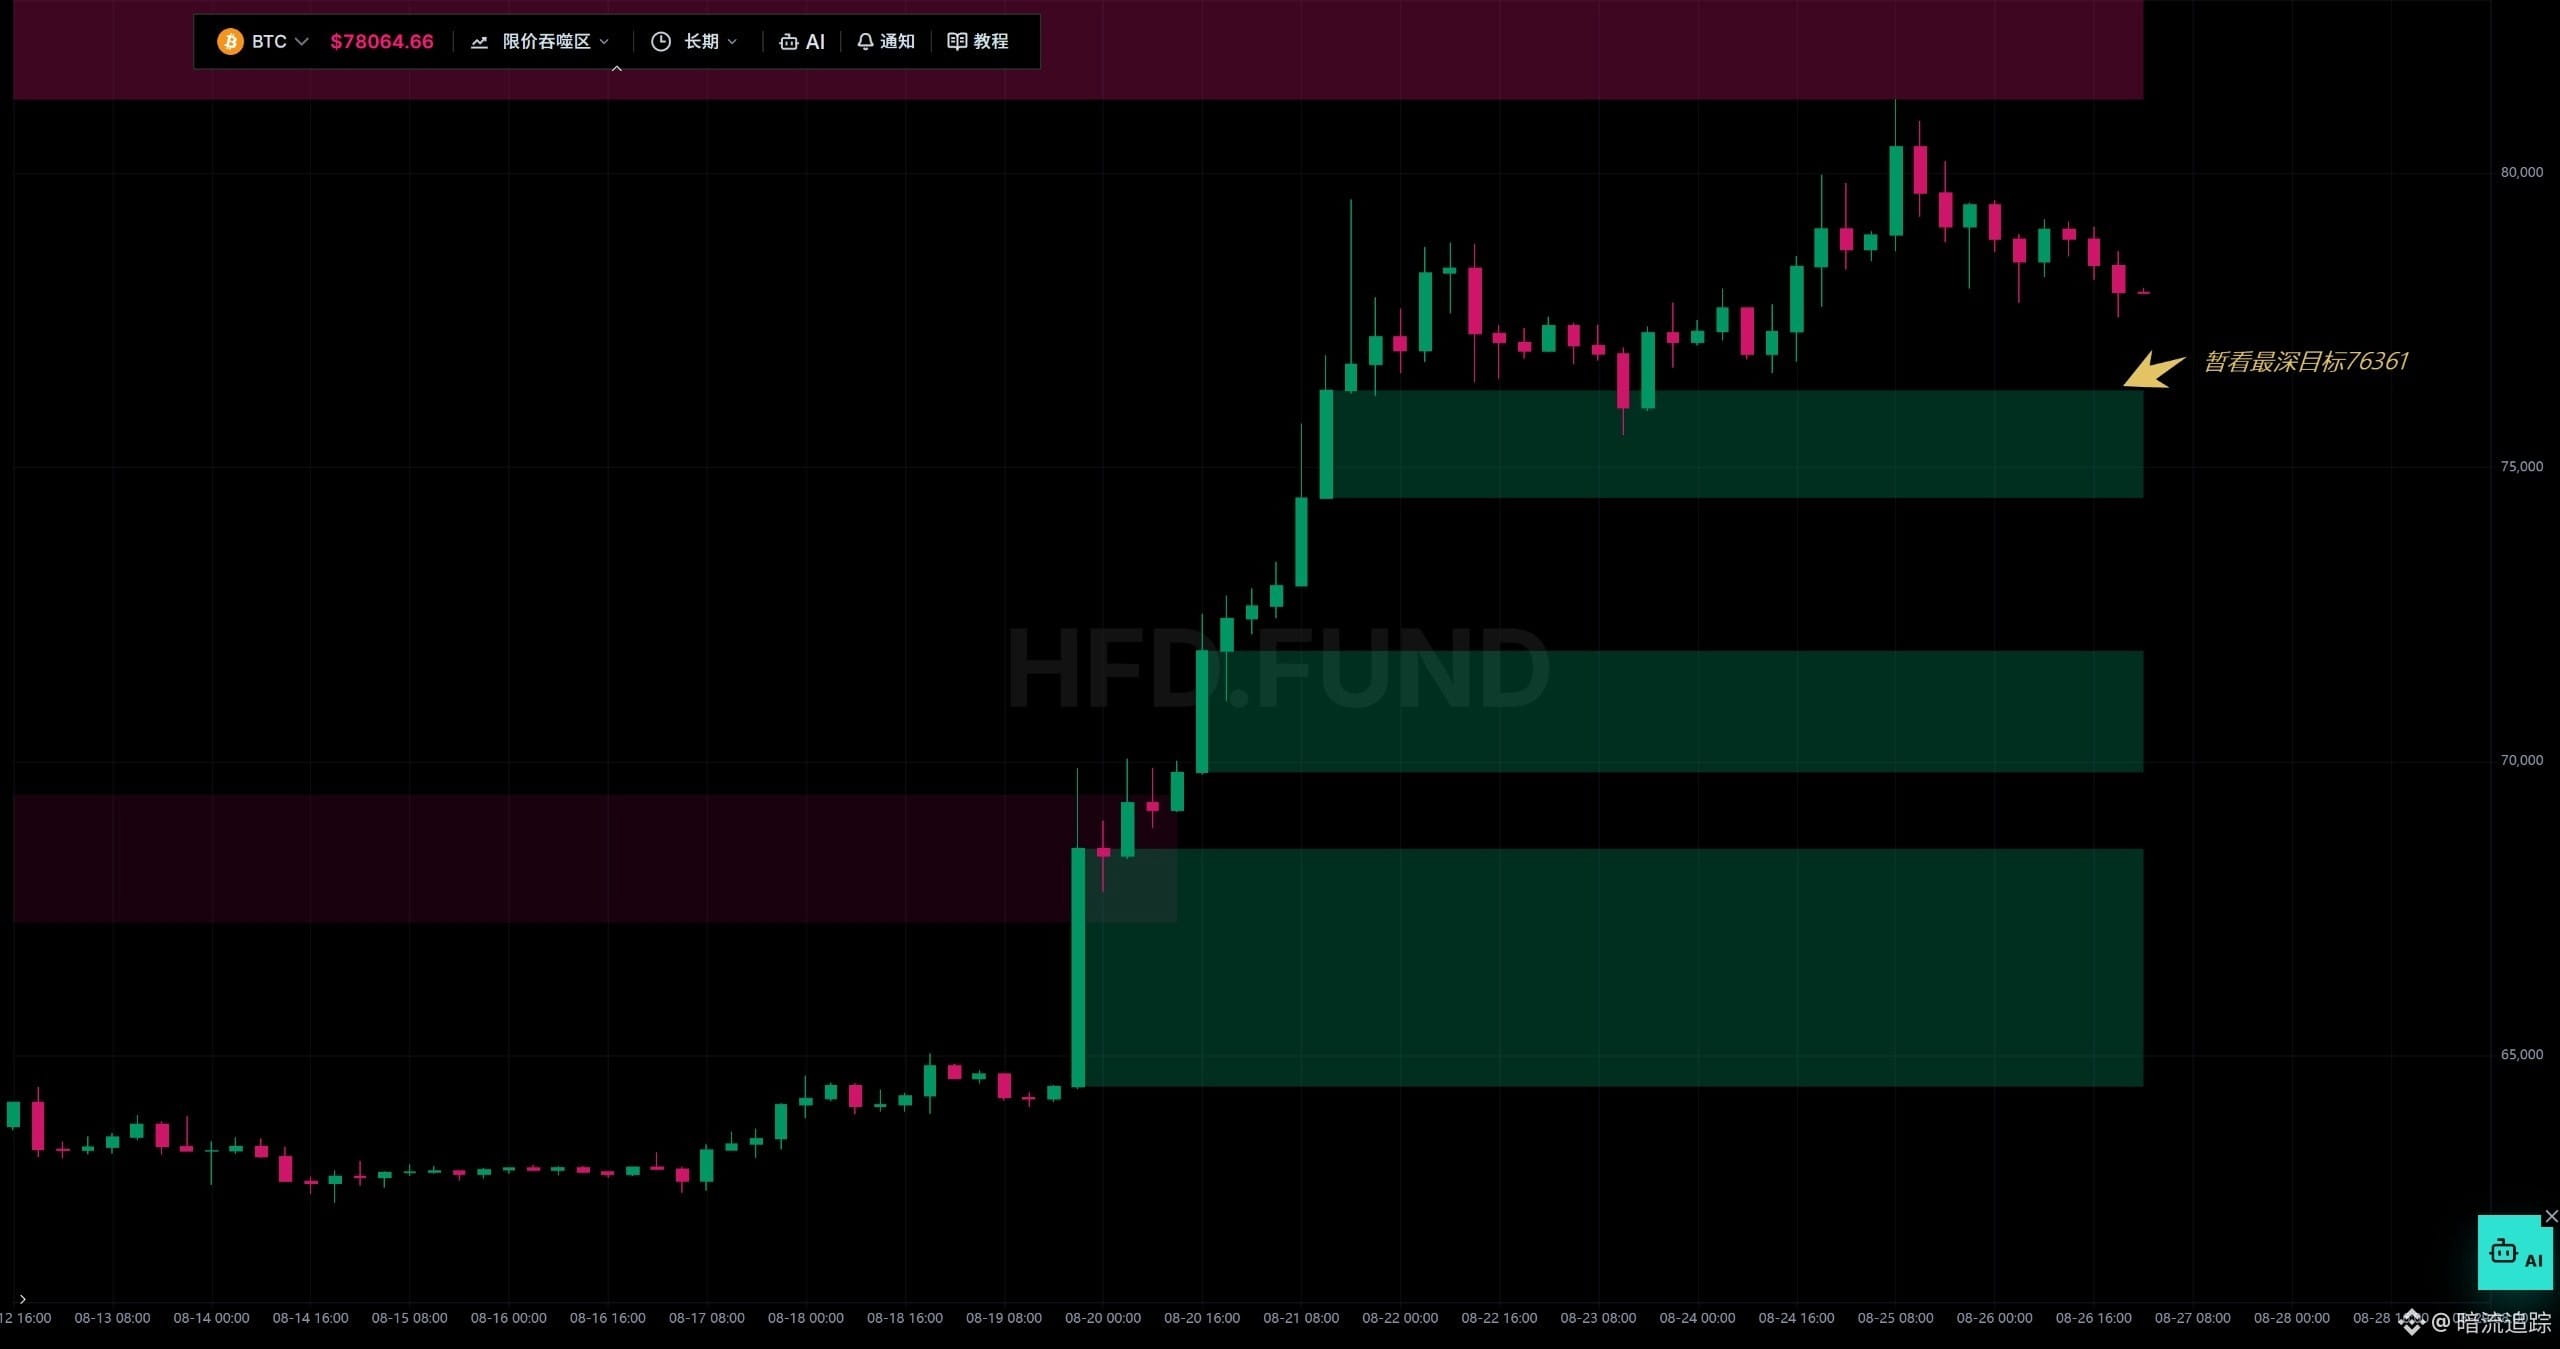
Around 78000, price oscillates. It rises to break above 78400 at the highest, then falls below 77527 and 77432, potentially even touching 76361, before returning to oscillate around 77400.
Actual Price Action:
After oscillating around 78000, price strengthened immediately, reaching as high as about 80807. It is currently oscillating around 80000, with no pullback yet.
Next Outlook:
Chip/volume vacuum
The latest short-term bullish attack has been filled, but the momentum is still bullish—expect oscillation within the bullish push.
In the mid-term, since the last time it hit a recent high and then fell, there has been no new attacking force. The outlook remains bullish, but with the latest attack filled, expect an oscillating trend following the bullish push.
Long-term bullish attack.
Based on this indicator, both the short- and mid-term are oscillations within a bullish-attack trend, while the long term is a bullish attack.
Price Channel
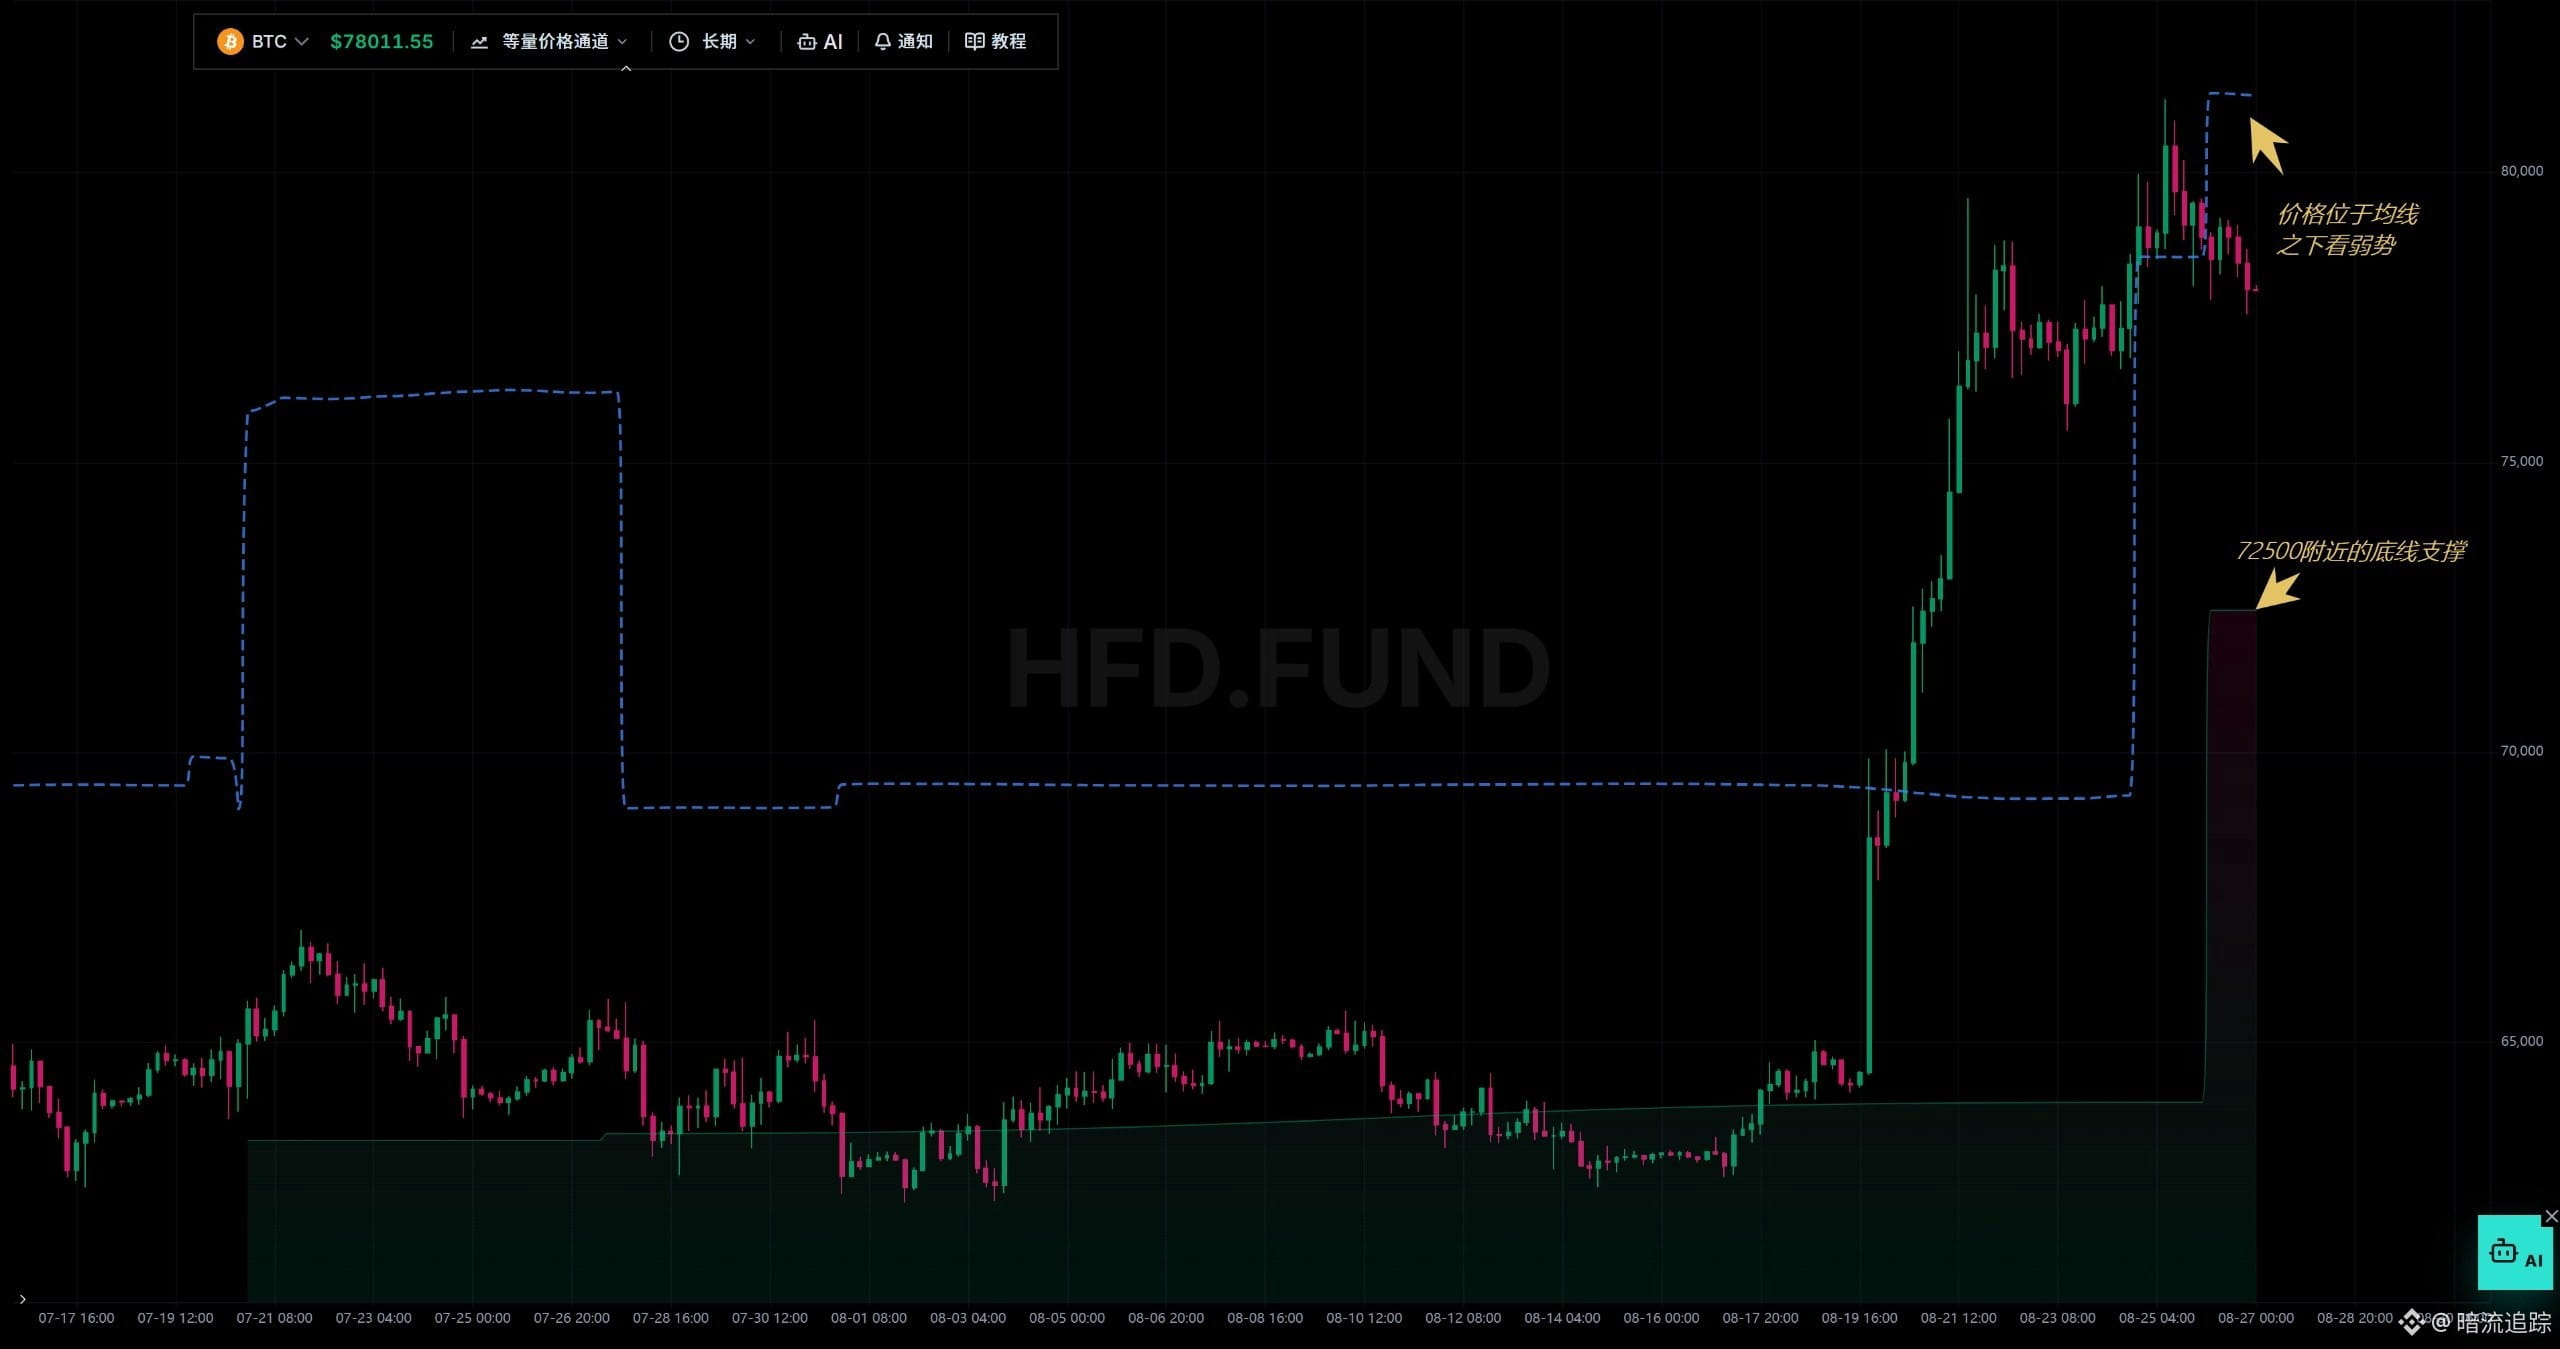
Equal-quantity short-term average: 77710; upper limit: 94690; lower limit: 67640.
Equal-quantity mid-term average: 73490; upper limit: 80703; lower limit: 65600.
Equal-quantity long-term average: 81240; upper limit: 93143; lower limit: 72450.
Not much change from the prior text. Price has touched the mid-term upper limit. It likely needs to be pushed back to find support. Support is currently at 77710 and 73490. The first resistance is the mid-term upper limit at 80703. The long-term average is 81240. At this level, the price is unlikely to break through easily.
Equal-quantity short-term (this measure) average: 66610; upper limit: 80980; lower limit: 62310.
Equal-quantity mid-term average: 66600; upper limit: 80700; lower limit: 62500.
Equal-quantity long-term average: 66920; upper limit: 80450; lower limit: 62500.
According to this indicator, price is touching the top on all these measures, and the suppression is relatively strong. After touching the top, expect price to pull back to find support.
Two summaries:
Price is above the moving average. From the trend, it is upward. However, when it reaches the 80700 area near the upper limit, it gets suppressed. That requires a pullback to find support.
Comprehensive Analysis:
Chip/volume vacuum: short- and mid-term both show oscillation within a bullish-attack trend; long term remains bullish.
Price channel: price is above the moving average; trend-wise it is upward, but near the 80700 upper limit it is suppressed and needs to pull back to find support.
Limit-price absorption: long-term bullish attack; in the short term, bullish-versus-bullish competition favors the bulls; mid-term oscillation; overall leans toward a bullish attack.
Order block by volume and price: the current target is to enter the region above 80450. First, look to break through 81700 and 81900, with an extreme target of 83608.
Building on the prior text, the market is oscillating upward.
Price Projection:
Price is being drawn by an order block into the area above 80450, with the goal of breaking through the 81500 area.
Prior Projection:
Around 78000, price oscillates. It rises to break above 78400 at the highest, then falls below 77527 and 77432, potentially even touching 76361, before returning to oscillate around 77400.
Actual Price Action:
After oscillating around 78000, price strengthened immediately, reaching as high as about 80807. It is currently oscillating around 80000, with no pullback yet.
Next Outlook:
Chip/volume vacuum
The latest short-term bullish attack has been filled, but the momentum is still bullish—expect oscillation within the bullish push.
In the mid-term, since the last time it hit a recent high and then fell, there has been no new attacking force. The outlook remains bullish, but with the latest attack filled, expect an oscillating trend following the bullish push.
Long-term bullish attack.
Based on this indicator, both the short- and mid-term are oscillations within a bullish-attack trend, while the long term is a bullish attack.
Price Channel
Equal-quantity short-term average: 77710; upper limit: 94690; lower limit: 67640.
Equal-quantity mid-term average: 73490; upper limit: 80703; lower limit: 65600.
Equal-quantity long-term average: 81240; upper limit: 93143; lower limit: 72450.
Not much change from the prior text. Price has touched the mid-term upper limit. It likely needs to be pushed back to find support. Support is currently at 77710 and 73490. The first resistance is the mid-term upper limit at 80703. The long-term average is 81240. At this level, the price is unlikely to break through easily.
Equal-quantity short-term (this measure) average: 66610; upper limit: 80980; lower limit: 62310.
Equal-quantity mid-term average: 66600; upper limit: 80700; lower limit: 62500.
Equal-quantity long-term average: 66920; upper limit: 80450; lower limit: 62500.
According to this indicator, price is touching the top on all these measures, and the suppression is relatively strong. After touching the top, expect price to pull back to find support.
Two summaries:
Price is above the moving average. From the trend, it is upward. However, when it reaches the 80700 area near the upper limit, it gets suppressed. That requires a pullback to find support.
Comprehensive Analysis:
Chip/volume vacuum: short- and mid-term both show oscillation within a bullish-attack trend; long term remains bullish.
Price channel: price is above the moving average; trend-wise it is upward, but near the 80700 upper limit it is suppressed and needs to pull back to find support.
Limit-price absorption: long-term bullish attack; in the short term, bullish-versus-bullish competition favors the bulls; mid-term oscillation; overall leans toward a bullish attack.
Order block by volume and price: the current target is to enter the region above 80450. First, look to break through 81700 and 81900, with an extreme target of 83608.
Summary:
Building on the previous section, it continues to fluctuate and pull back.
Price projection:
Around 78,000 it will range. It may rise and break above 78,400 at most, then fall below 77,527 and 77,432, and may even touch 76,361, before pulling back and ranging again around 77,400.
Previous projection:
Around 79,000 it will range, then slowly decline. The body may drop below 78,563 and 78,421, with the deepest point possibly breaking below 77,816, then rebound back toward around 78,500, continuing the upside breakout.
Actual price action:
After ranging around 79,000, the price fell, bottomed near 77,800, then rebounded. It is currently ranging around 78,000.
Next price action:
Chip vacuum
In the short term, it is still the prior scenario of longs being filled; the trend looks like it will continue to move downward in a range.
In the medium term and short term, they are consistent: the longs’ advance has been filled, suggesting a downward-ranging market.
In the long term, for now it looks like the consolidation after the longs’ advance.
According to this indicator, in the short and medium term there is still a downward trend, while in the long term it is still a longs’ advance, but the support is farther away.
Price channel
Equal-volume short-term average: 77,390; upper limit: 93,090; lower limit: 66,736.
Equal-volume medium-term average: 72,470; upper limit: 80,703; lower limit: 65,600.
Equal-volume long-term average: 81,340; upper limit: 93,143; lower limit: 72,450.
First, the long term shows the biggest change from the text above: the average price rises to 81,340, but since the current price is below the average it is difficult to reclaim it. The trend is downward, with support at 72,450. Medium-term support is also at 72,470. This could be relatively strong support, or possibly the lowest point of the pullback. Currently, the price is ranging around the short-term average of about 77,370, indicating the price is already close to the market average in the short term.
Equal-volume short-term (by contract/unit) average: 66,300; upper limit: 80,980; lower limit: 62,310.
Equal-volume medium-term average: 66,130; upper limit: 80,700; lower limit: 62,500.
Equal-volume long-term average: 66,520; upper limit: 80,450; lower limit: 62,500.
Based on this indicator, after topping, the price is still in the process of mean reversion, but the trend remains strong.
Overall:
Long term has shifted from strong to weak, with the possibility of developing toward 72,450. However, in the short term it has already reverted to market value 77,390, which will provide support.
Comprehensive analysis:
Chip vacuum: With support far below, it continues to fluctuate and fall.
Price channel: In the short term it has already reverted to around the mean 77,390, which will provide support. In the long term it has shifted from strong to weak, with a possibility of developing toward 72,450.
Limit-price engulfing: The price may first rise and break above 78,400, then fall and break below 77,432, with the deepest spike reaching 76,338.
Volume-price order blocks: 77,527 is a target that needs to be broken through.
Building on the previous section, it continues to fluctuate and pull back.
Price projection:
Around 78,000 it will range. It may rise and break above 78,400 at most, then fall below 77,527 and 77,432, and may even touch 76,361, before pulling back and ranging again around 77,400.
Previous projection:
Around 79,000 it will range, then slowly decline. The body may drop below 78,563 and 78,421, with the deepest point possibly breaking below 77,816, then rebound back toward around 78,500, continuing the upside breakout.
Actual price action:
After ranging around 79,000, the price fell, bottomed near 77,800, then rebounded. It is currently ranging around 78,000.
Next price action:
Chip vacuum
In the short term, it is still the prior scenario of longs being filled; the trend looks like it will continue to move downward in a range.
In the medium term and short term, they are consistent: the longs’ advance has been filled, suggesting a downward-ranging market.
In the long term, for now it looks like the consolidation after the longs’ advance.
According to this indicator, in the short and medium term there is still a downward trend, while in the long term it is still a longs’ advance, but the support is farther away.
Price channel
Equal-volume short-term average: 77,390; upper limit: 93,090; lower limit: 66,736.
Equal-volume medium-term average: 72,470; upper limit: 80,703; lower limit: 65,600.
Equal-volume long-term average: 81,340; upper limit: 93,143; lower limit: 72,450.
First, the long term shows the biggest change from the text above: the average price rises to 81,340, but since the current price is below the average it is difficult to reclaim it. The trend is downward, with support at 72,450. Medium-term support is also at 72,470. This could be relatively strong support, or possibly the lowest point of the pullback. Currently, the price is ranging around the short-term average of about 77,370, indicating the price is already close to the market average in the short term.
Equal-volume short-term (by contract/unit) average: 66,300; upper limit: 80,980; lower limit: 62,310.
Equal-volume medium-term average: 66,130; upper limit: 80,700; lower limit: 62,500.
Equal-volume long-term average: 66,520; upper limit: 80,450; lower limit: 62,500.
Based on this indicator, after topping, the price is still in the process of mean reversion, but the trend remains strong.
Overall:
Long term has shifted from strong to weak, with the possibility of developing toward 72,450. However, in the short term it has already reverted to market value 77,390, which will provide support.
Comprehensive analysis:
Chip vacuum: With support far below, it continues to fluctuate and fall.
Price channel: In the short term it has already reverted to around the mean 77,390, which will provide support. In the long term it has shifted from strong to weak, with a possibility of developing toward 72,450.
Limit-price engulfing: The price may first rise and break above 78,400, then fall and break below 77,432, with the deepest spike reaching 76,338.
Volume-price order blocks: 77,527 is a target that needs to be broken through.
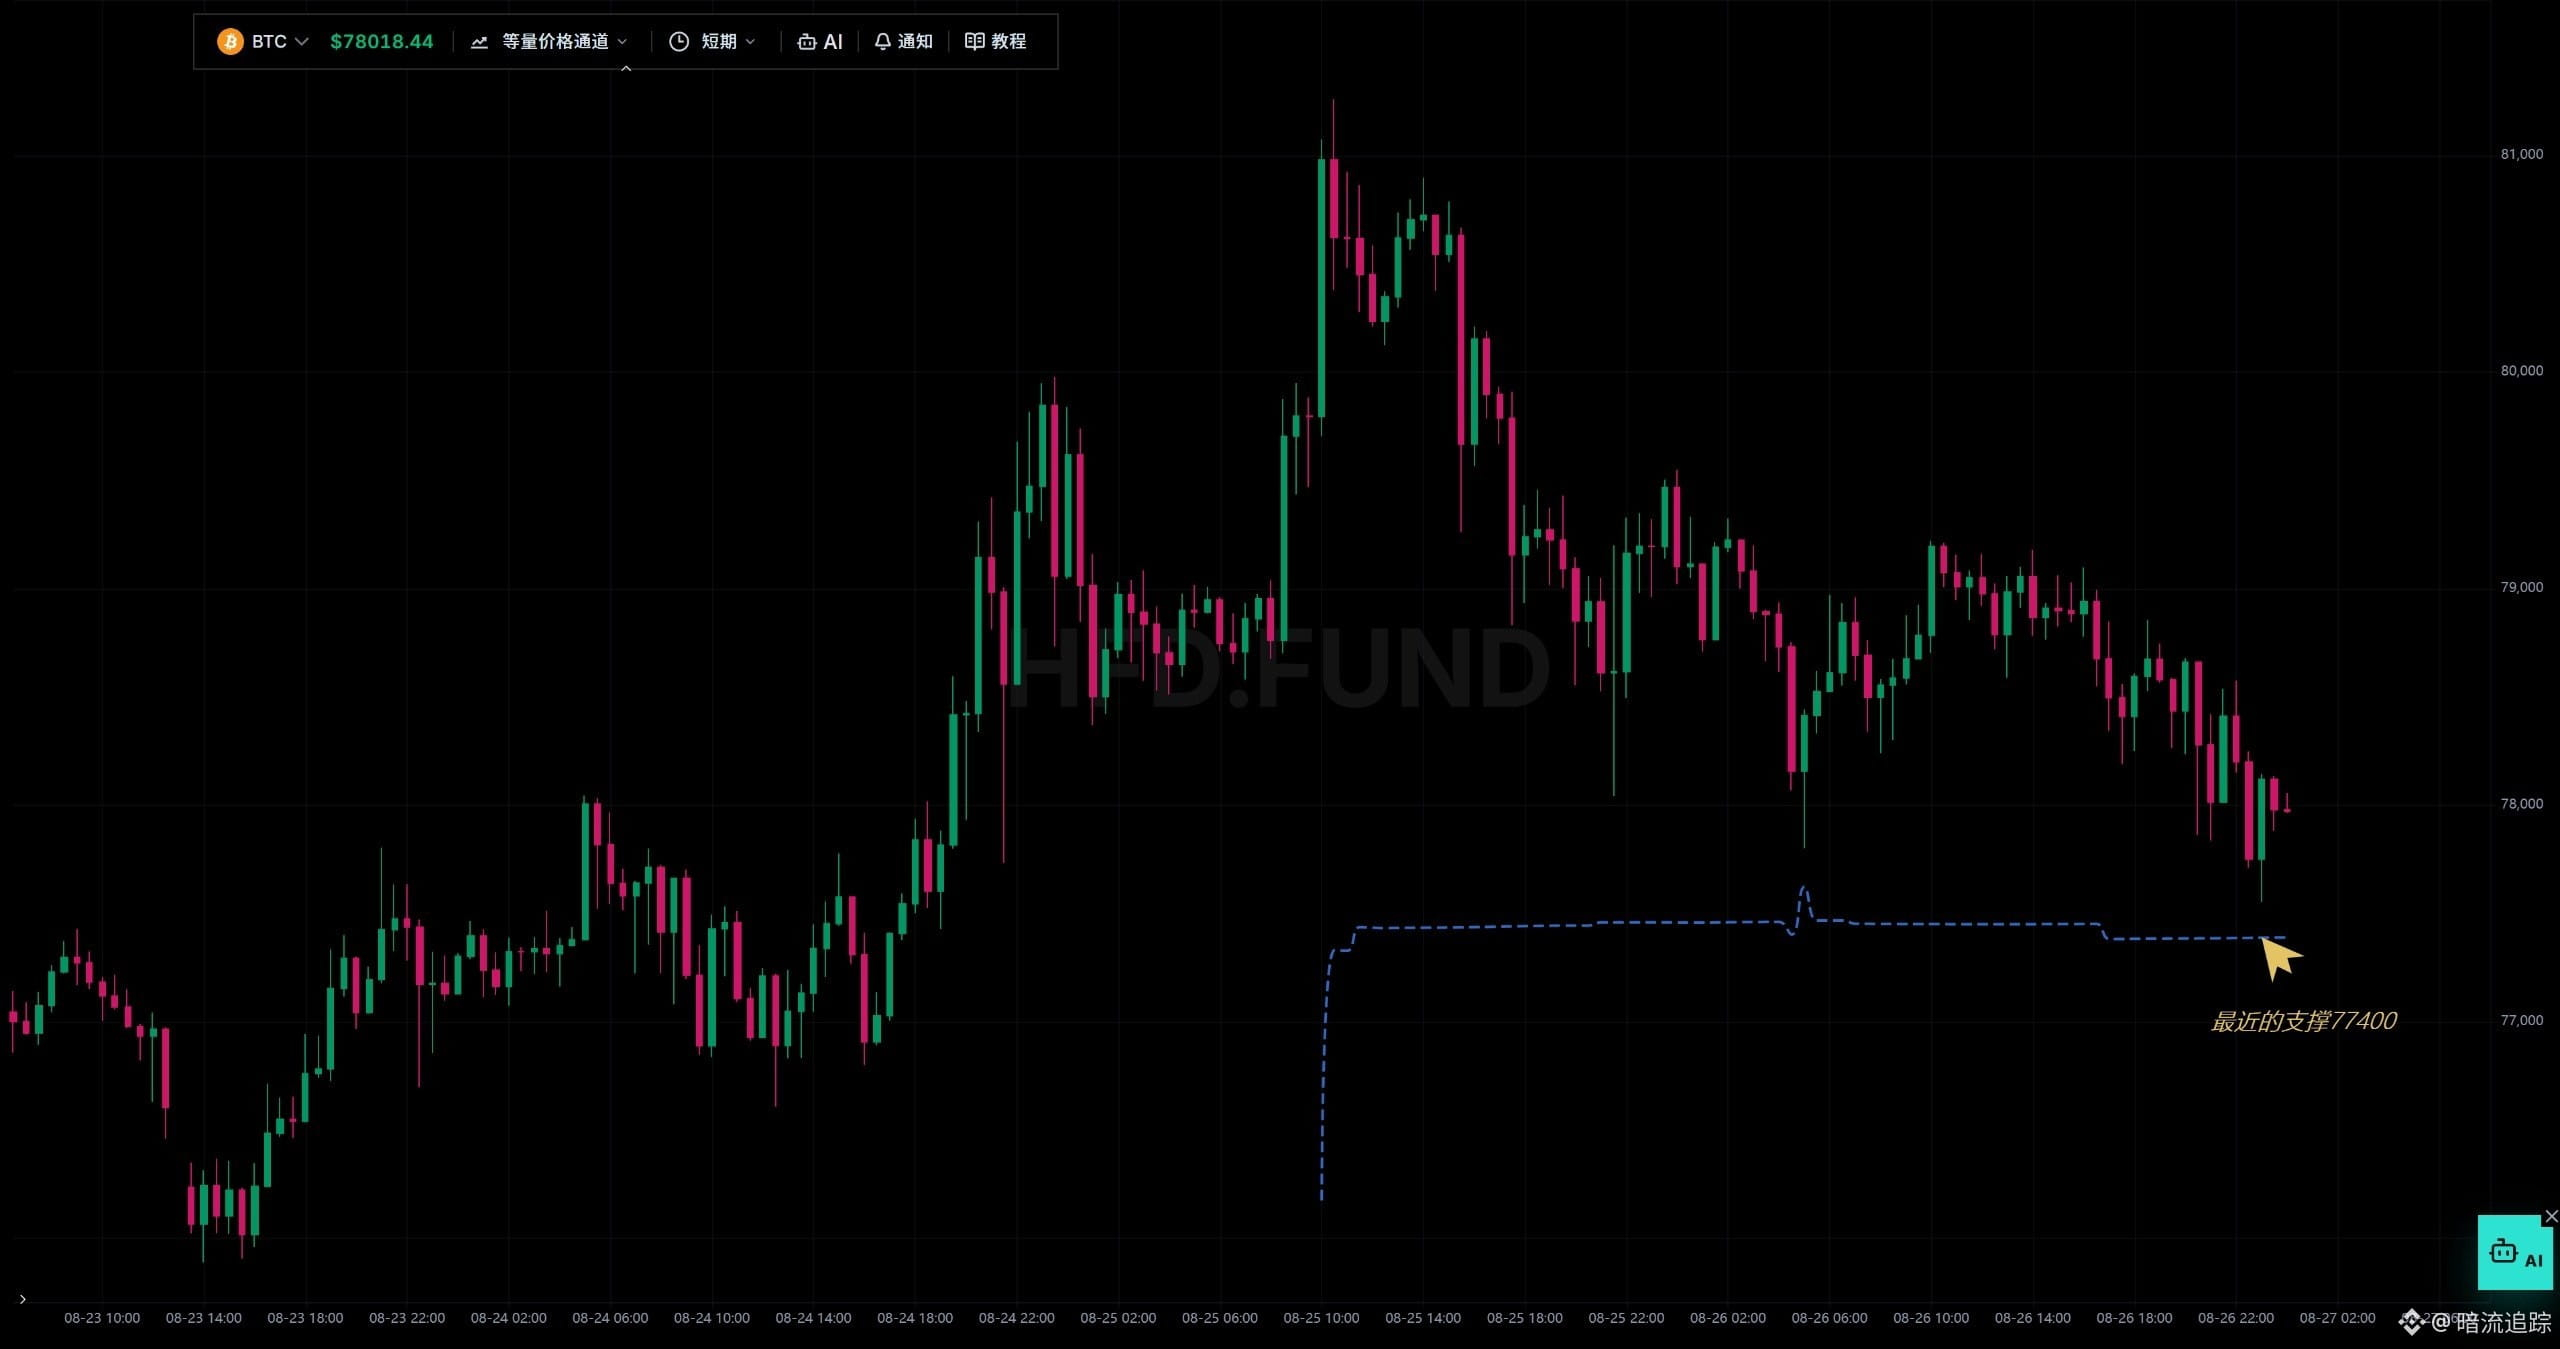
Summary:
Continuing from the previous discussion, the trend is temporarily consolidating, then falling back, and breaking upward again.
Price projection:
Around 79,000 the price oscillates, then gradually pulls back. Candles break through 78,563 and 78,421. The deepest move could break below 77,816, then rebound back to around 78,500 and continue breaking upward.
Previous projection:
First, it breaks below the 78,560 area, meets support around 78,540, then rebounds. The price then trades between 78,540 and 79,270. After that, it breaks above 80,370 and 81,300, with the highest possible wick around 81,593, followed by a pullback.
Actual price action:
After dropping to around 78,500, it rebounded to the 79,000 area, then the peak reached around 81,200 before falling back toward 79,000.
Outlook:
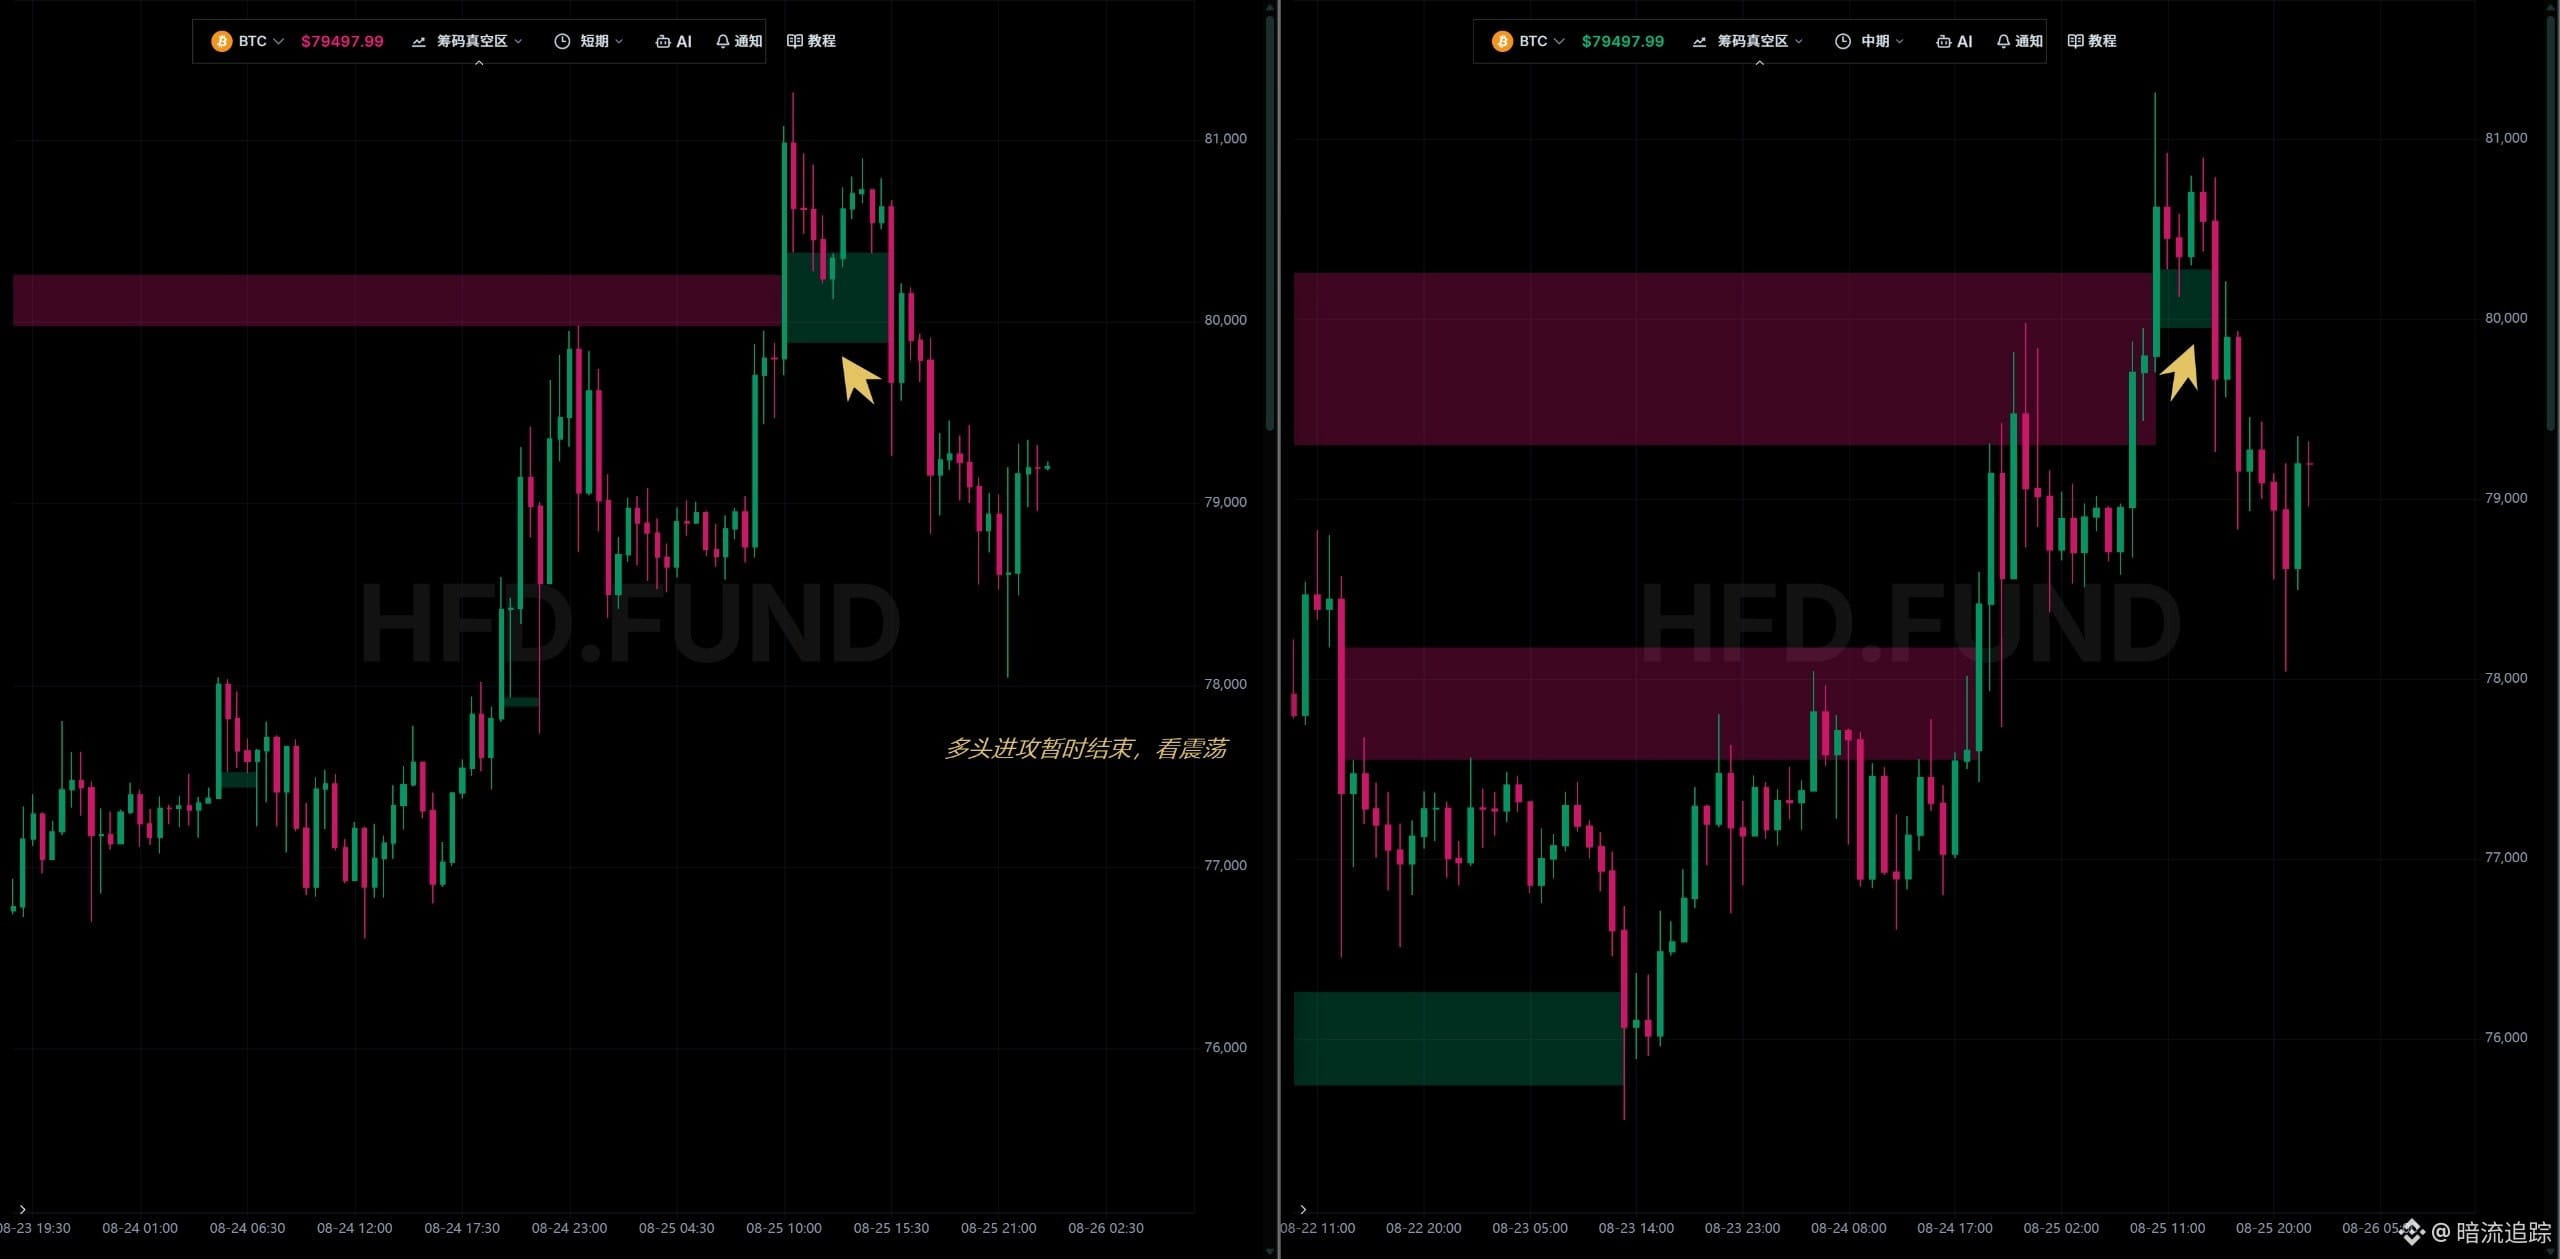
Chip vacuum
The short-term bulls’ offensive has been refilled, so we’ll watch the consolidation. In the medium term, after the bulls’ offensive consumed the historical short positions from 80,294–79,349, that offensive has been refilled as well, so we’ll watch consolidation. In the long term, the upward outlook remains.
Based on this indicator, the short- and mid-term bulls have been broken through, and the trend has started to oscillate. In the long term, the outlook is still for the bulls to continue their push.
Price channel
Equal volume short-term moving average: 77,249; upper limit: 94,686; lower limit: 66,736.
Equal volume medium-term moving average: 74,135; upper limit: 80,703; lower limit: 66,456.
Equal volume long-term moving average: 78,494; upper limit: 93,143; lower limit: 63,967.
Not much change from the previous text: the first support is 78,494, and the pressure point is 80,703. The medium-term upper limit hasn’t increased, so even if we look at potential height, it likely won’t rise too much.
Equal volume short-term (this time): 66,140; upper limit: 80,980; lower limit: 62,310.
Equal volume medium-term (this time): 66,130; upper limit: 80,700; lower limit: 62,500.
Equal volume long-term (this time): 65,993; upper limit: 79,057; lower limit: 62,500.
The biggest change from the previous text is that the upper limit has increased, but the price is still pushing upward while pressing against the upper limit. The trend is still seen as upward, but the upper limit continues to cap the price, making it difficult to have a large breakout all at once. Support remains around 78,494, and the upper limit is around 81,000.
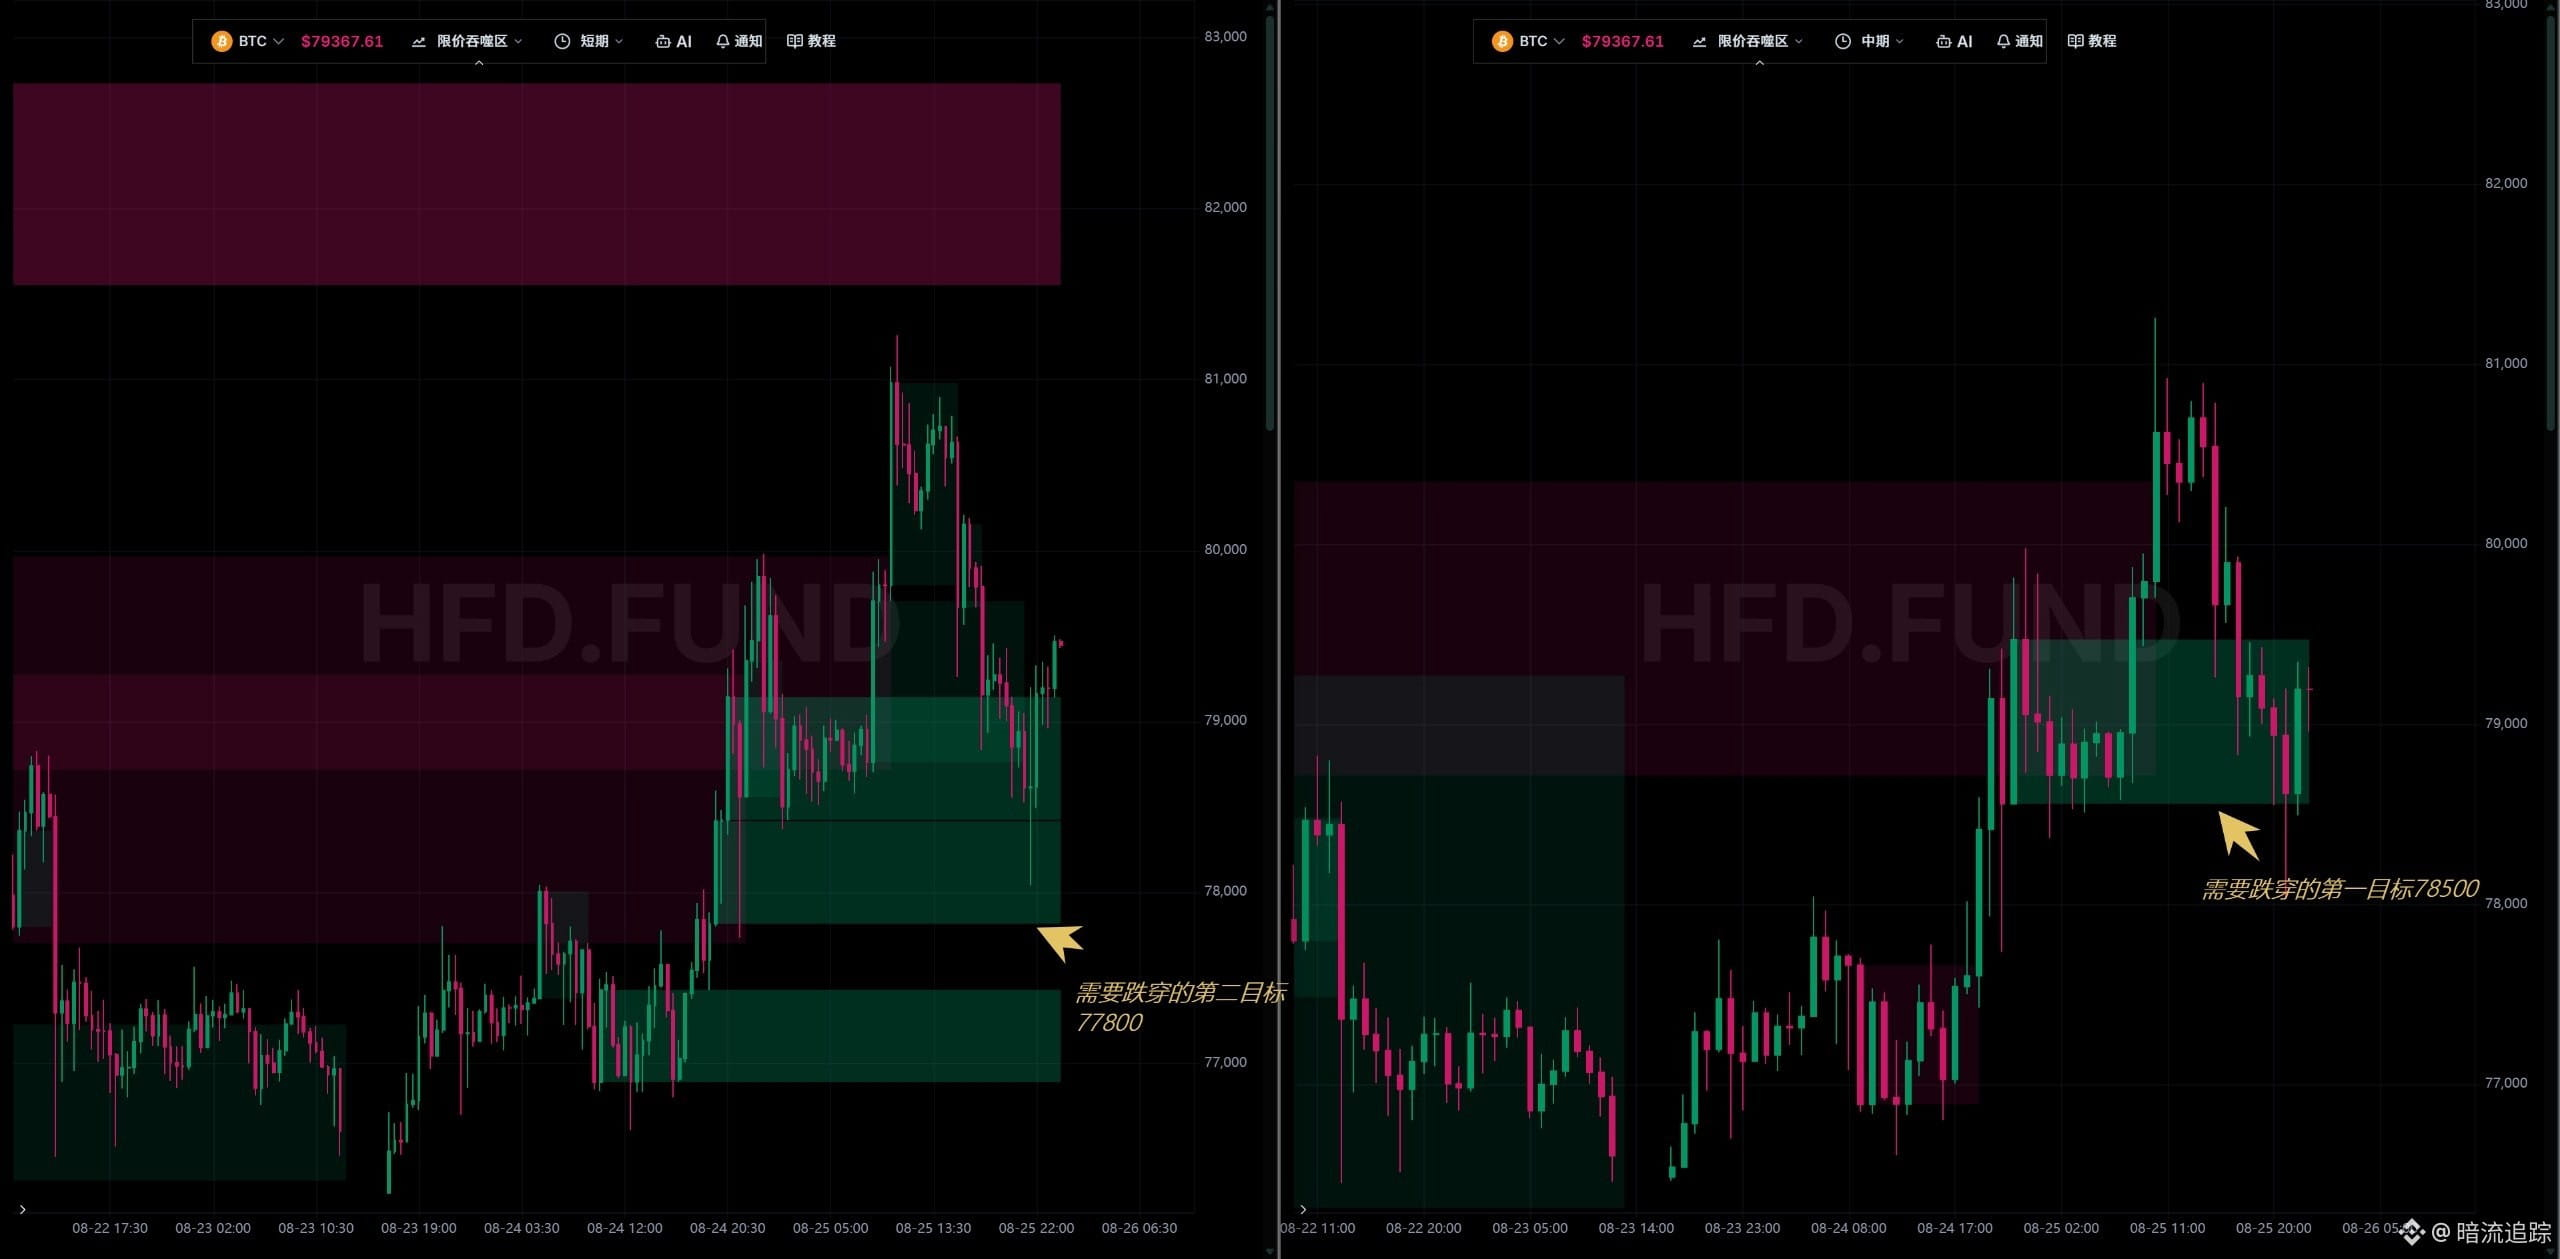
Limit-price absorption
The massive short offensive from 77,694–79,947 has been completely broken through. However, after breaking through, the long offensive from 78,816–81,000 is now starting to be gradually refilled. The bulls’ trend is temporarily over. The first target is a candle close breaking below 78,421, and the second target is 77,816.
Medium-term historical shorts at 78,729–80,371 have also been broken through. Below, the long offensive at 78,563–79,488 has been tested with several wick probes. Although it hasn’t been broken yet, it now looks like the mission is already accomplished and a fill-back is needed, so the candle may break below 78,563.
Continuing from the previous discussion, the trend is temporarily consolidating, then falling back, and breaking upward again.
Price projection:
Around 79,000 the price oscillates, then gradually pulls back. Candles break through 78,563 and 78,421. The deepest move could break below 77,816, then rebound back to around 78,500 and continue breaking upward.
Previous projection:
First, it breaks below the 78,560 area, meets support around 78,540, then rebounds. The price then trades between 78,540 and 79,270. After that, it breaks above 80,370 and 81,300, with the highest possible wick around 81,593, followed by a pullback.
Actual price action:
After dropping to around 78,500, it rebounded to the 79,000 area, then the peak reached around 81,200 before falling back toward 79,000.
Outlook:
Chip vacuum
The short-term bulls’ offensive has been refilled, so we’ll watch the consolidation. In the medium term, after the bulls’ offensive consumed the historical short positions from 80,294–79,349, that offensive has been refilled as well, so we’ll watch consolidation. In the long term, the upward outlook remains.
Based on this indicator, the short- and mid-term bulls have been broken through, and the trend has started to oscillate. In the long term, the outlook is still for the bulls to continue their push.
Price channel
Equal volume short-term moving average: 77,249; upper limit: 94,686; lower limit: 66,736.
Equal volume medium-term moving average: 74,135; upper limit: 80,703; lower limit: 66,456.
Equal volume long-term moving average: 78,494; upper limit: 93,143; lower limit: 63,967.
Not much change from the previous text: the first support is 78,494, and the pressure point is 80,703. The medium-term upper limit hasn’t increased, so even if we look at potential height, it likely won’t rise too much.
Equal volume short-term (this time): 66,140; upper limit: 80,980; lower limit: 62,310.
Equal volume medium-term (this time): 66,130; upper limit: 80,700; lower limit: 62,500.
Equal volume long-term (this time): 65,993; upper limit: 79,057; lower limit: 62,500.
The biggest change from the previous text is that the upper limit has increased, but the price is still pushing upward while pressing against the upper limit. The trend is still seen as upward, but the upper limit continues to cap the price, making it difficult to have a large breakout all at once. Support remains around 78,494, and the upper limit is around 81,000.
Limit-price absorption
The massive short offensive from 77,694–79,947 has been completely broken through. However, after breaking through, the long offensive from 78,816–81,000 is now starting to be gradually refilled. The bulls’ trend is temporarily over. The first target is a candle close breaking below 78,421, and the second target is 77,816.
Medium-term historical shorts at 78,729–80,371 have also been broken through. Below, the long offensive at 78,563–79,488 has been tested with several wick probes. Although it hasn’t been broken yet, it now looks like the mission is already accomplished and a fill-back is needed, so the candle may break below 78,563.
Summary:
Building on the previous section, after the shakeout, continue by inserting a new high.
Price projection:
First, fall below the area around 78560. After encountering support at 78540, rebound. Then fluctuate between 78540 and 79270. Afterwards, break above 80370 and 81300. The highest possible outcome is a quick spike (pin) up to 81593, followed by a pullback.
Previous projection:
Consolidate between 76327 and 78729. After a small-range rise breaks through 77290, the high could reach 77688.
Note: If 77688 holds, the target is 79659, even up to 80371.
Actual price movement:
After 77688 held, it immediately broke through 79659, and the high reached 80000.
Overall analysis:
There is a gap in positioning, with near-term consolidation. Consolidation may fall below 78596, and then break upward through 80337.
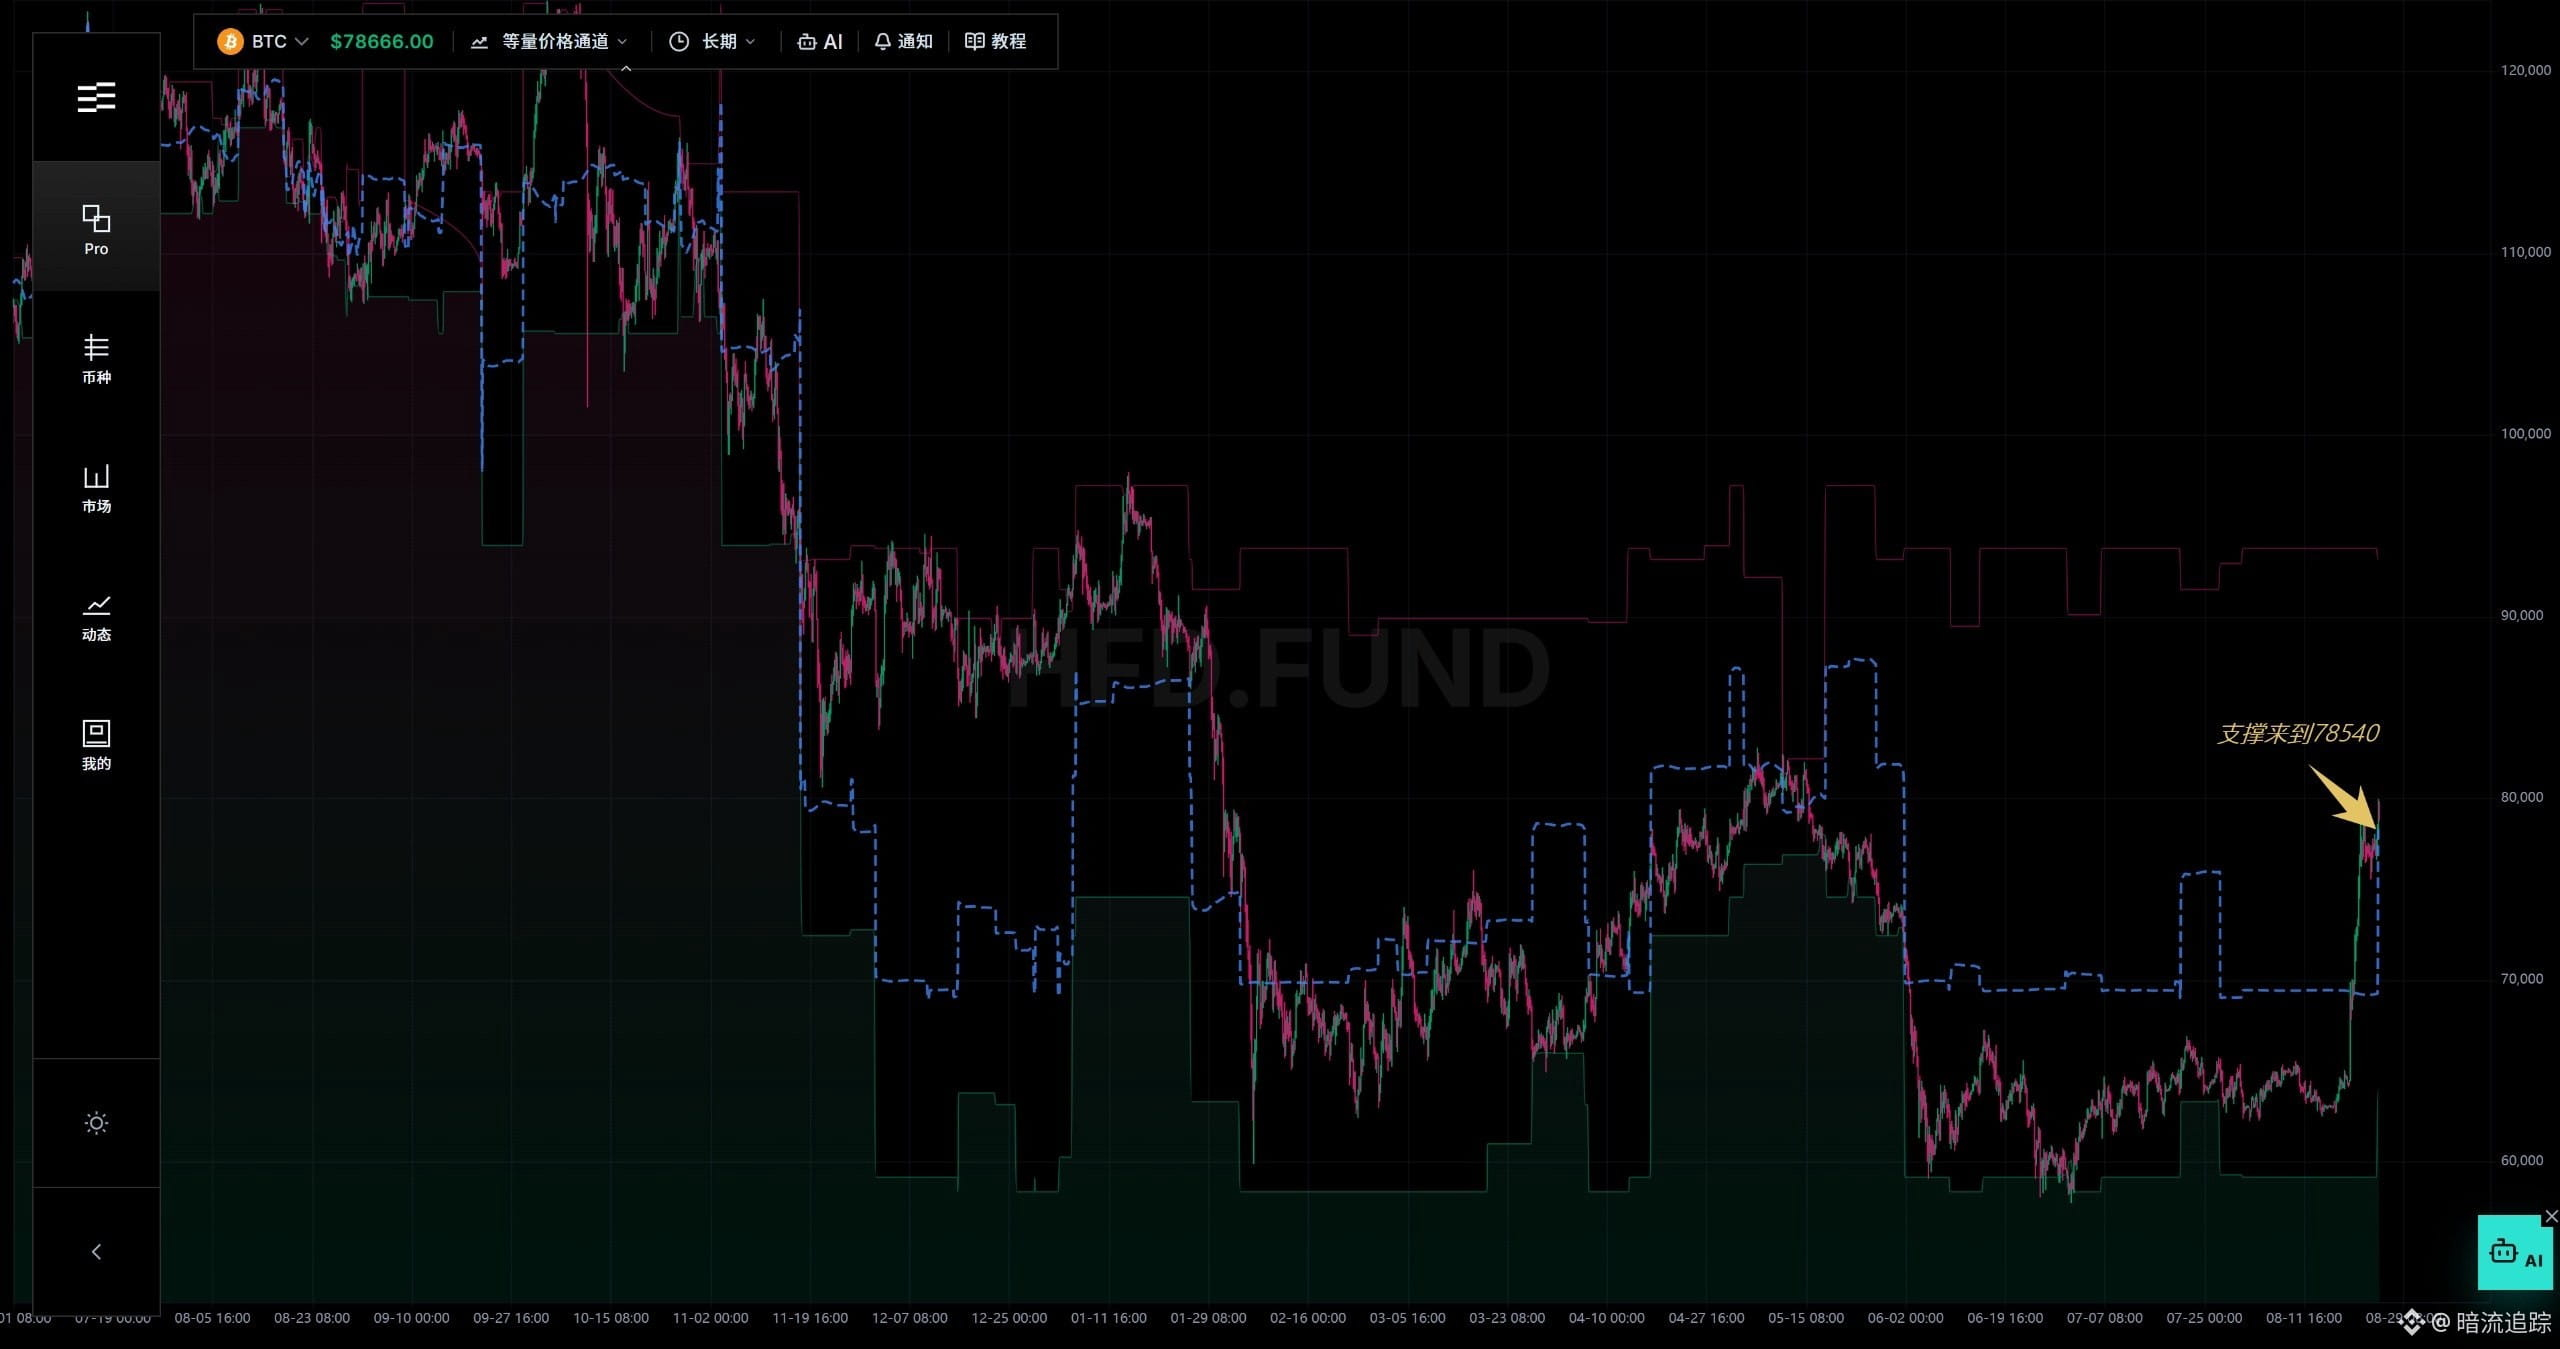
Price channel & long-term moving averages:
The long-term moving averages rise to 78540, acting as support. Price fluctuates between 78540 and 79270 and is still in a strong phase.
Limit-order absorption:
After breaking down around 78560, price will rebound. It may eventually break through 80371, with the pin reaching the 81300–83000 zone.
Volume/Price order blocks:
The appeal of the latest resting orders may attract price toward the 81593 area.
Building on the previous section, after the shakeout, continue by inserting a new high.
Price projection:
First, fall below the area around 78560. After encountering support at 78540, rebound. Then fluctuate between 78540 and 79270. Afterwards, break above 80370 and 81300. The highest possible outcome is a quick spike (pin) up to 81593, followed by a pullback.
Previous projection:
Consolidate between 76327 and 78729. After a small-range rise breaks through 77290, the high could reach 77688.
Note: If 77688 holds, the target is 79659, even up to 80371.
Actual price movement:
After 77688 held, it immediately broke through 79659, and the high reached 80000.
Overall analysis:
There is a gap in positioning, with near-term consolidation. Consolidation may fall below 78596, and then break upward through 80337.
Price channel & long-term moving averages:
The long-term moving averages rise to 78540, acting as support. Price fluctuates between 78540 and 79270 and is still in a strong phase.
Limit-order absorption:
After breaking down around 78560, price will rebound. It may eventually break through 80371, with the pin reaching the 81300–83000 zone.
Volume/Price order blocks:
The appeal of the latest resting orders may attract price toward the 81593 area.
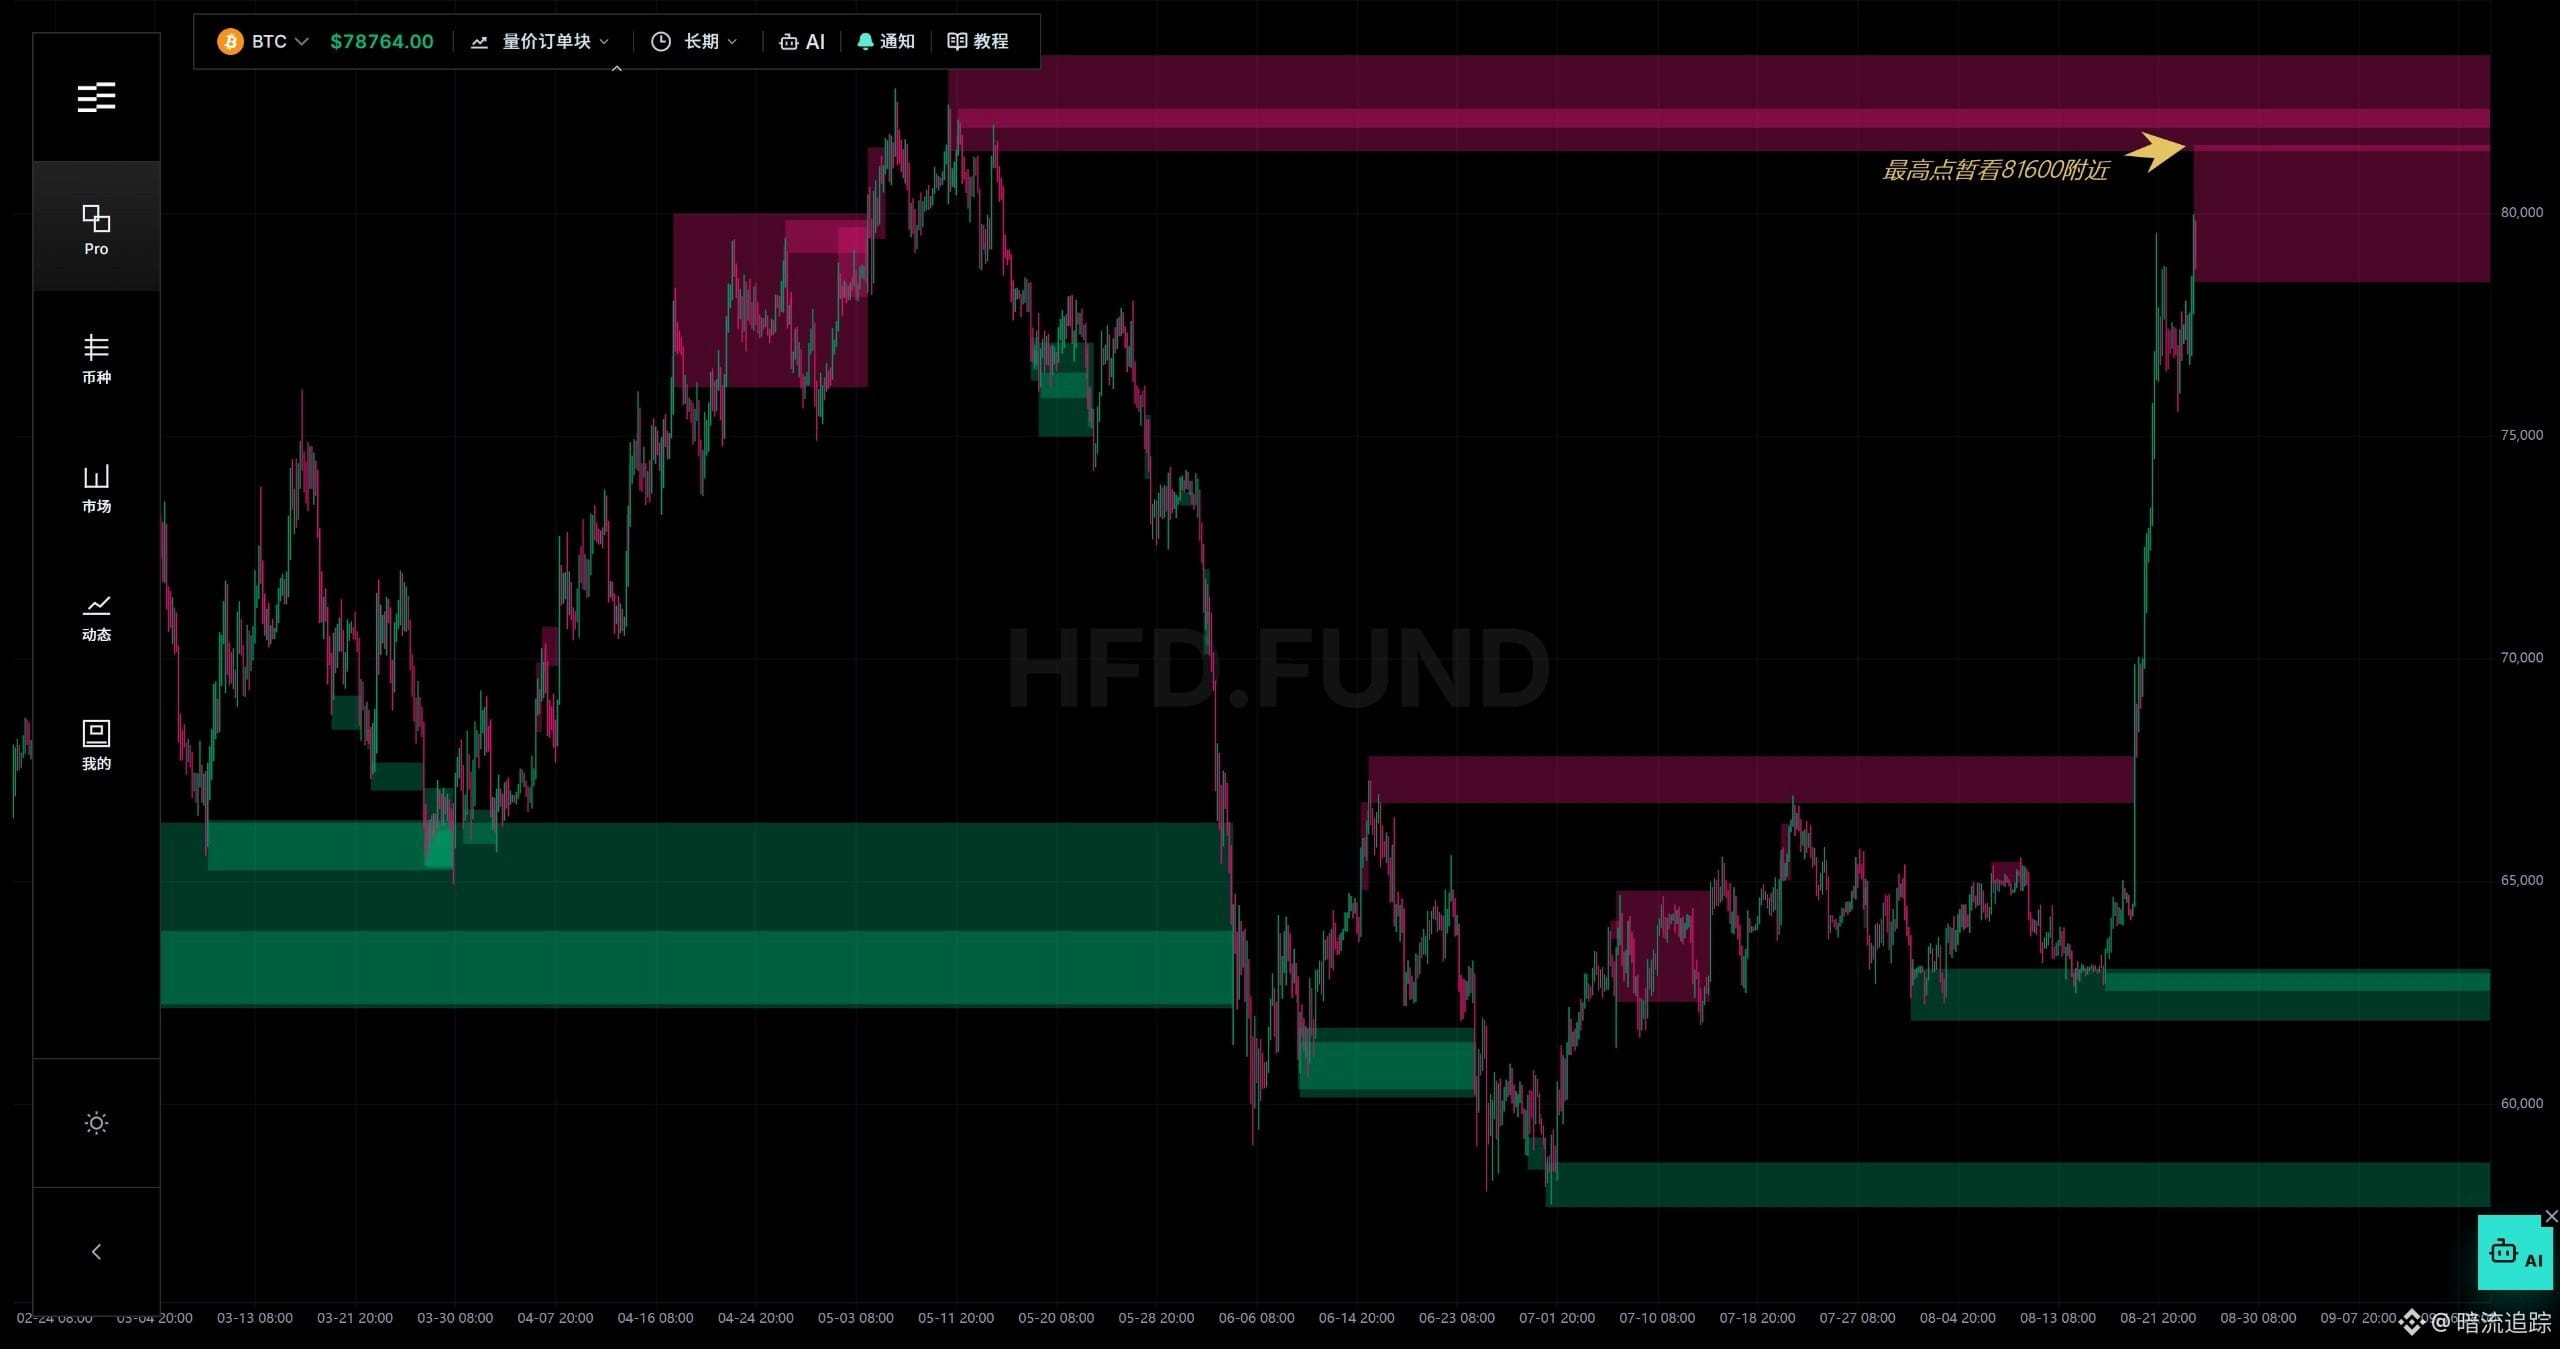
Summary:
Continuing from the previous section, after falling to the target it rebounded and began a broad-range consolidation.
Future price projection:
Price is likely to oscillate within the wide range 76327-78729. In the smaller range, it may rise and break through 77290; the high could reach 77688.
Note: if it holds above 77688, the target is 79659, and even 80371.
Previous projection:
The downside 76300 will likely be broken. After breaking, it may briefly spike down to 75761, then rebound.
Actual price action:
After dipping to 75550, the price started to rebound.
Next price action:
Chip vacuum.
In the short term, the trend during the rise is still a sideways consolidation. In the medium term, the bearish assault remains at 77542-78197—this is the historical bearish assault line and it continues to suppress price. In the long term, it’s still consolidation. Based on this indicator, it remains a consolidation trend under medium-term bearish pressure. If 78197 is broken, the bearish trend is considered to be over.
Price channel:
Equal-quantity short-term average 72360, upper bound 8943, lower bound 63180.
Equal-quantity medium-term average 72280, upper bound 79270, lower bound 65896.
Equal-quantity long-term average 69220, upper bound 93760, lower bound 59160.
There is not much change from the previous text. It’s still a relatively strong trend above the moving averages, but after topping out it needs to pull back and consolidate.
Equal-quantity by itself (average):
Equal-quantity short-term average 65430, upper bound 79270, lower bound 62310.
Equal-quantity medium-term average 65350, upper bound 79270, lower bound 62500.
Equal-quantity long-term average 65200, upper bound 78390, lower bound 62500.
Not much change from the previous text. The moving averages are slightly higher; the trend is still strong. After dropping from the upper bound, it will look for support.
Volume-Price Order Blocks:
In the short term, the latest upper edge of distribution 77290-77688 is the target for what comes next.
In the medium term, the historical distribution order block is 77583-79659, with a very large volume.
Based on this indicator, the short- and medium-term period forms a very large distribution zone between 77290-79659. It would require substantial liquidity to absorb it. If there is not enough force to absorb it, price will gradually decline.
Limit-price absorption (price engulfing):
In the short term, a huge bearish assault at 77694-79947. In the medium term, the bullish phase at 76310-79316 was broken through; it looks like consolidation, but above, the historical bearish zone 78729-80371 is the main force behind this drop. In the long term, it just touched the long bullish line mentioned above at 76327-74462, and that’s when the rebound started. If so, price would be squeezed into oscillation between 76327-78729. Pay attention to any new forces that emerge afterward.
Comprehensive analysis:
Chip vacuum, consolidation trend. Breaking 78197 would signal the end of the bearish trend.
Price channel:
After topping out, the pullback-and-consolidation is not much different from the previous text; it will look for support.
Limit-price absorption:
Price will be squeezed into oscillation between 76327-78729.
Continuing from the previous section, after falling to the target it rebounded and began a broad-range consolidation.
Future price projection:
Price is likely to oscillate within the wide range 76327-78729. In the smaller range, it may rise and break through 77290; the high could reach 77688.
Note: if it holds above 77688, the target is 79659, and even 80371.
Previous projection:
The downside 76300 will likely be broken. After breaking, it may briefly spike down to 75761, then rebound.
Actual price action:
After dipping to 75550, the price started to rebound.
Next price action:
Chip vacuum.
In the short term, the trend during the rise is still a sideways consolidation. In the medium term, the bearish assault remains at 77542-78197—this is the historical bearish assault line and it continues to suppress price. In the long term, it’s still consolidation. Based on this indicator, it remains a consolidation trend under medium-term bearish pressure. If 78197 is broken, the bearish trend is considered to be over.
Price channel:
Equal-quantity short-term average 72360, upper bound 8943, lower bound 63180.
Equal-quantity medium-term average 72280, upper bound 79270, lower bound 65896.
Equal-quantity long-term average 69220, upper bound 93760, lower bound 59160.
There is not much change from the previous text. It’s still a relatively strong trend above the moving averages, but after topping out it needs to pull back and consolidate.
Equal-quantity by itself (average):
Equal-quantity short-term average 65430, upper bound 79270, lower bound 62310.
Equal-quantity medium-term average 65350, upper bound 79270, lower bound 62500.
Equal-quantity long-term average 65200, upper bound 78390, lower bound 62500.
Not much change from the previous text. The moving averages are slightly higher; the trend is still strong. After dropping from the upper bound, it will look for support.
Volume-Price Order Blocks:
In the short term, the latest upper edge of distribution 77290-77688 is the target for what comes next.
In the medium term, the historical distribution order block is 77583-79659, with a very large volume.
Based on this indicator, the short- and medium-term period forms a very large distribution zone between 77290-79659. It would require substantial liquidity to absorb it. If there is not enough force to absorb it, price will gradually decline.
Limit-price absorption (price engulfing):
In the short term, a huge bearish assault at 77694-79947. In the medium term, the bullish phase at 76310-79316 was broken through; it looks like consolidation, but above, the historical bearish zone 78729-80371 is the main force behind this drop. In the long term, it just touched the long bullish line mentioned above at 76327-74462, and that’s when the rebound started. If so, price would be squeezed into oscillation between 76327-78729. Pay attention to any new forces that emerge afterward.
Comprehensive analysis:
Chip vacuum, consolidation trend. Breaking 78197 would signal the end of the bearish trend.
Price channel:
After topping out, the pullback-and-consolidation is not much different from the previous text; it will look for support.
Limit-price absorption:
Price will be squeezed into oscillation between 76327-78729.
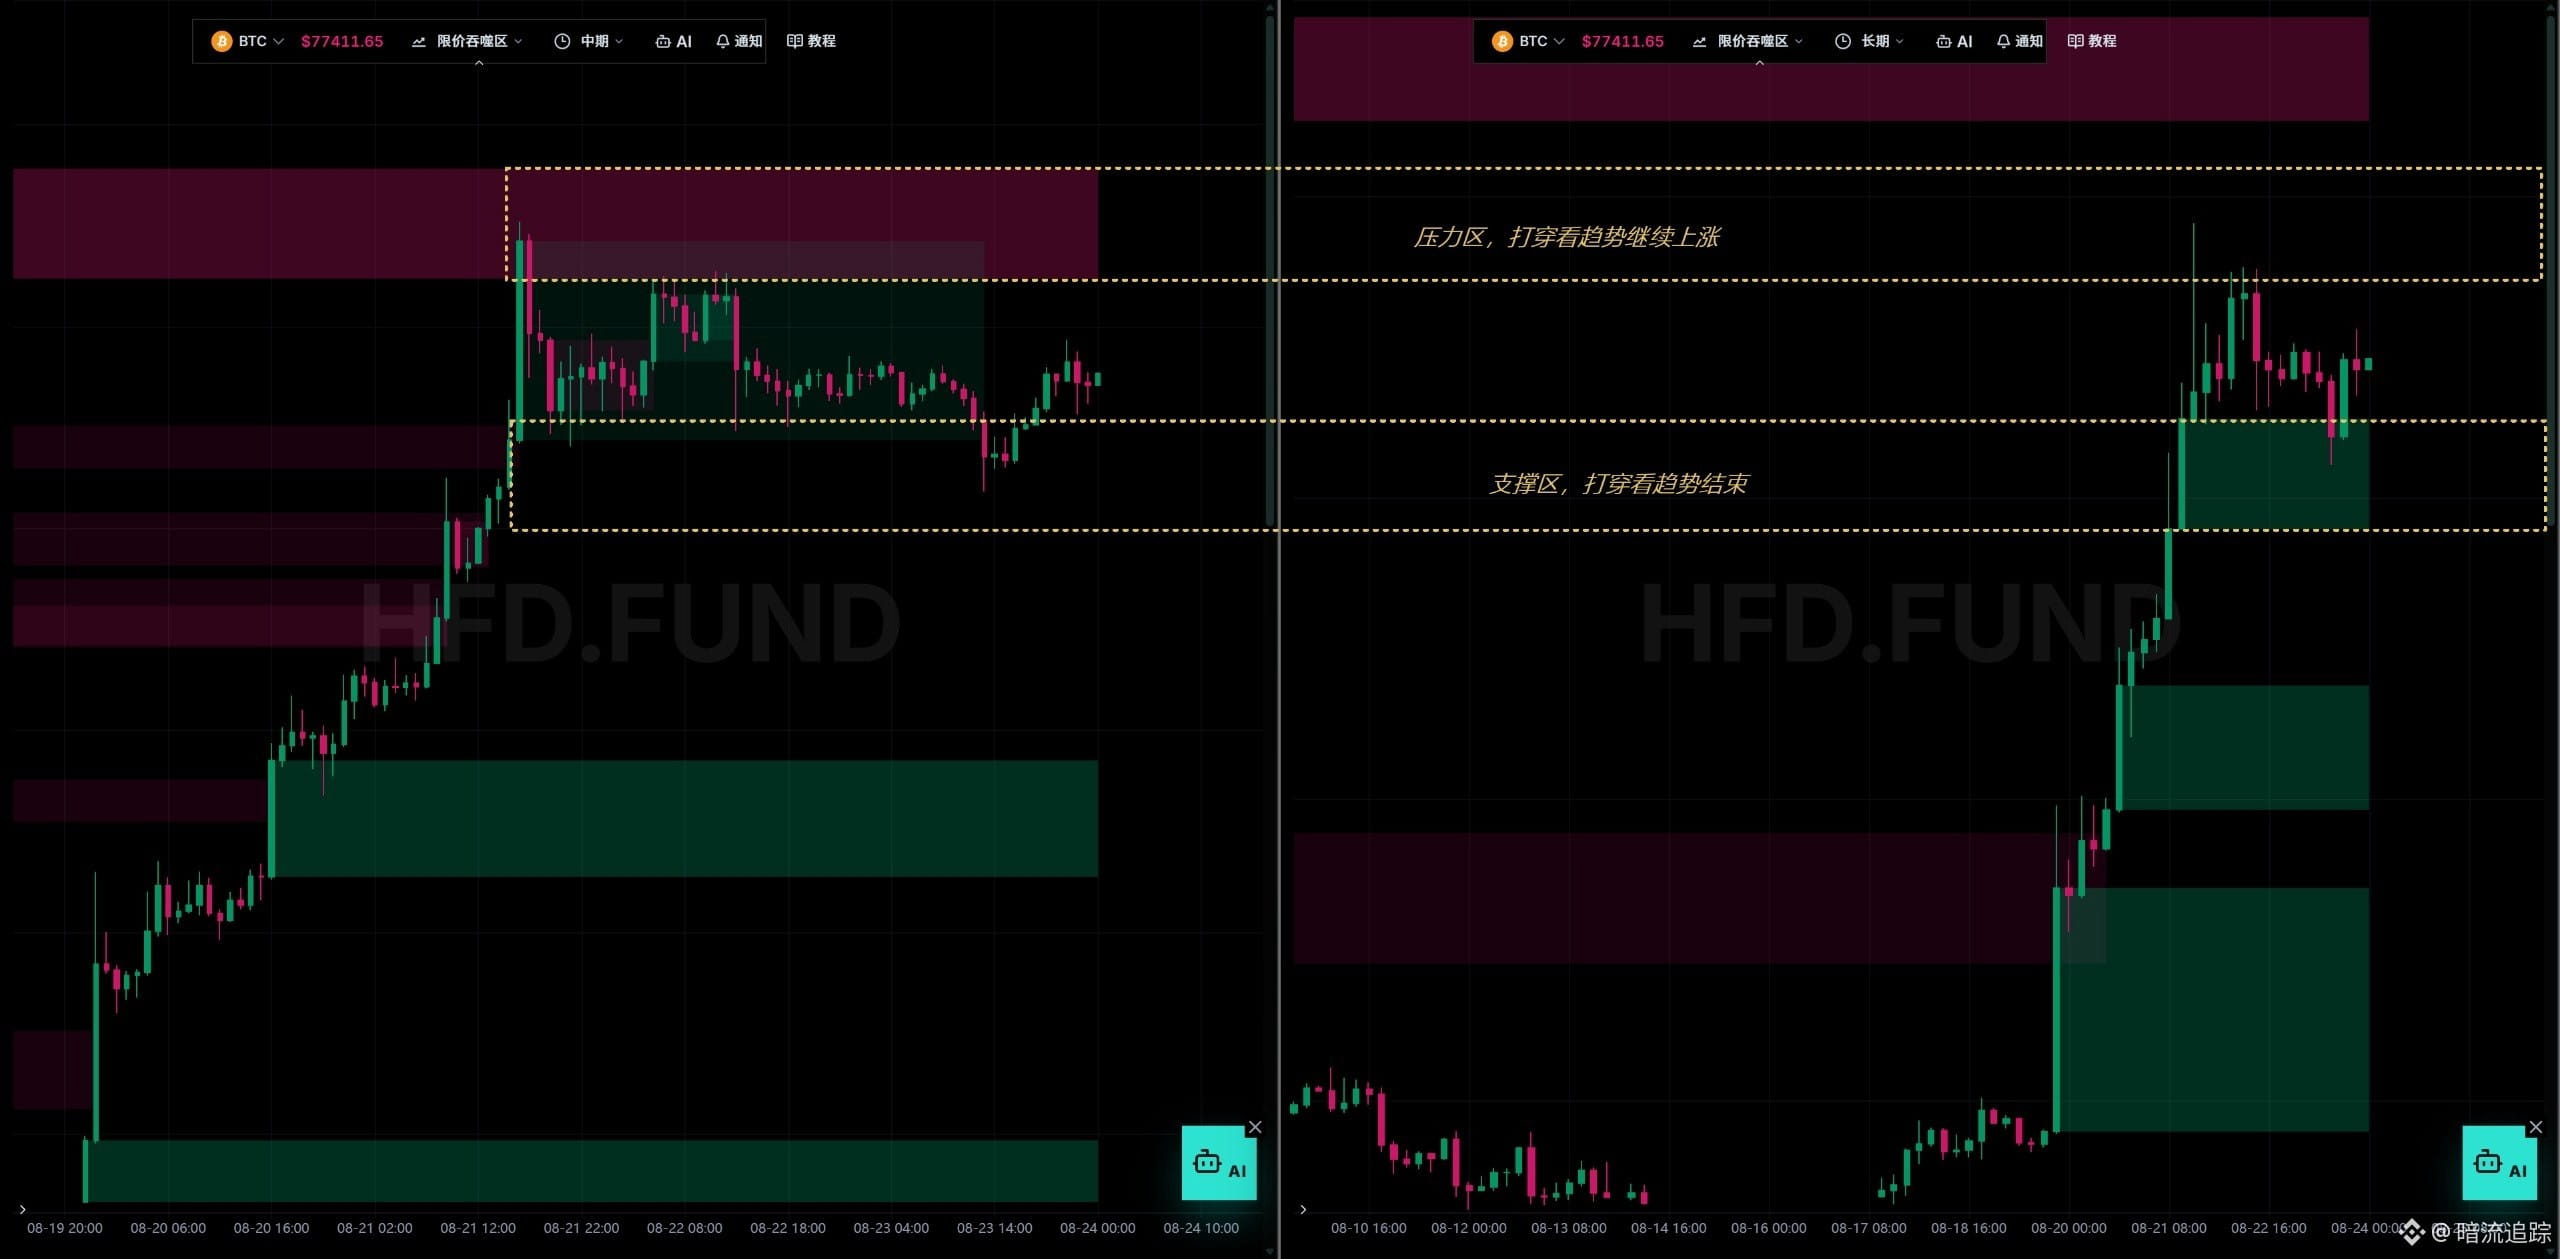
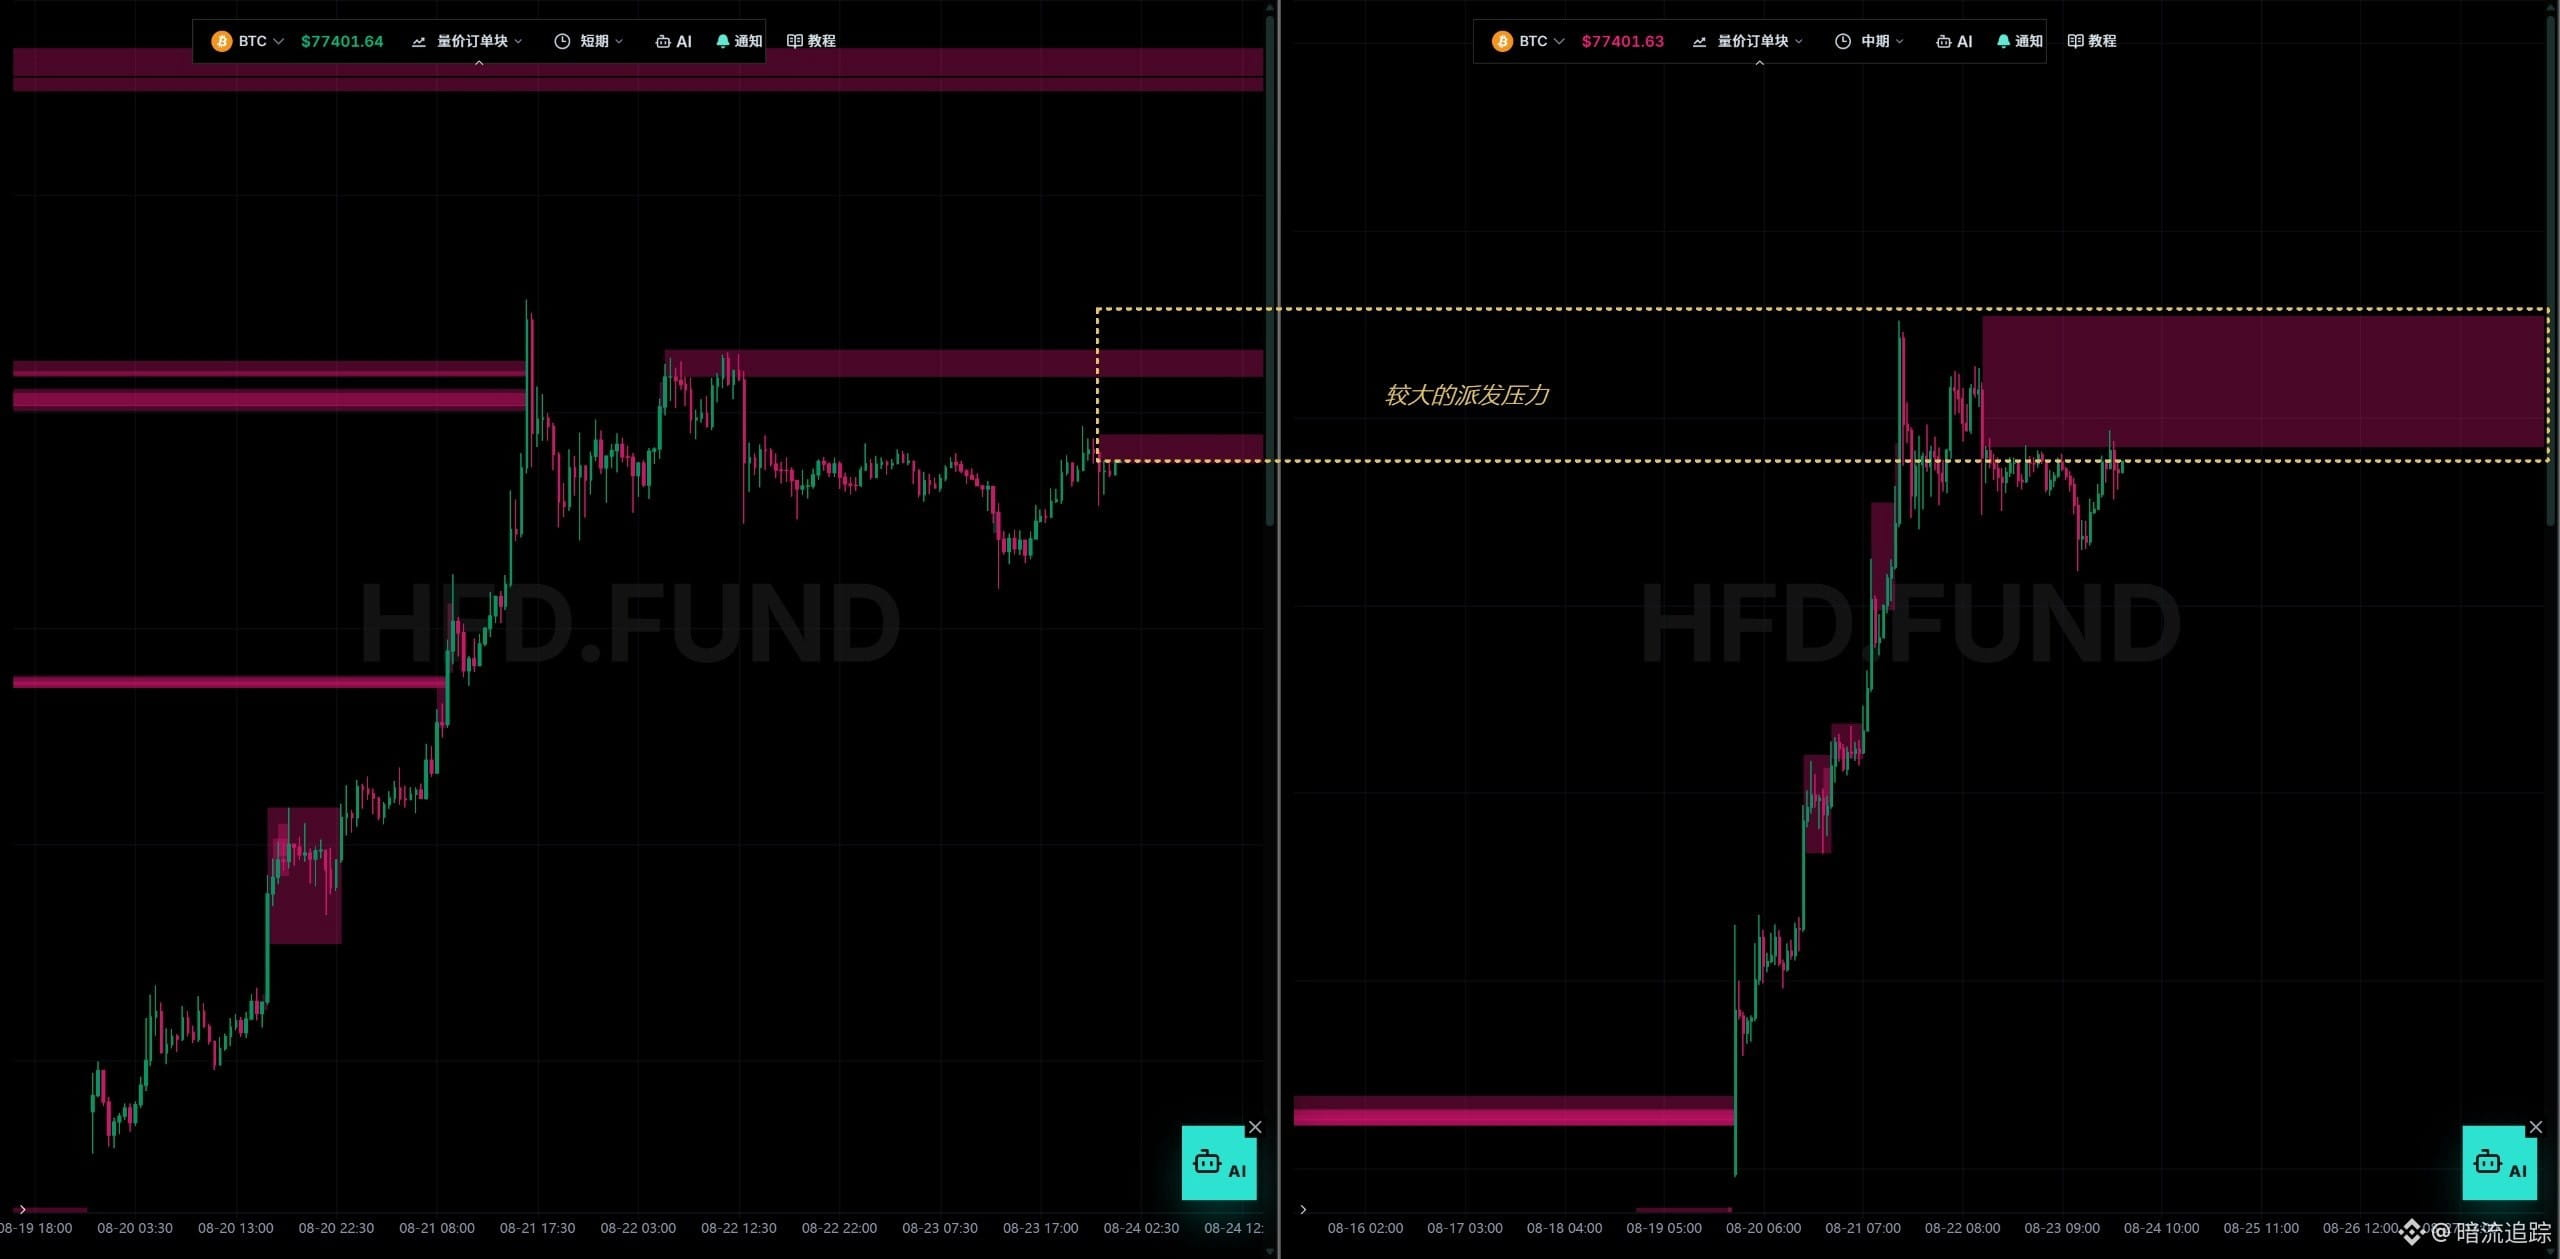
Summary:
Continuing from the previous section, the oscillation trend was forcefully pulled up, turning into an upward trend. The upward trend has not ended.
Future price projection:
After moving through 72182-72477, the price will continue rising. The first position is 73110. Once the previous high is broken, the price will reach the resistance area around 75000.
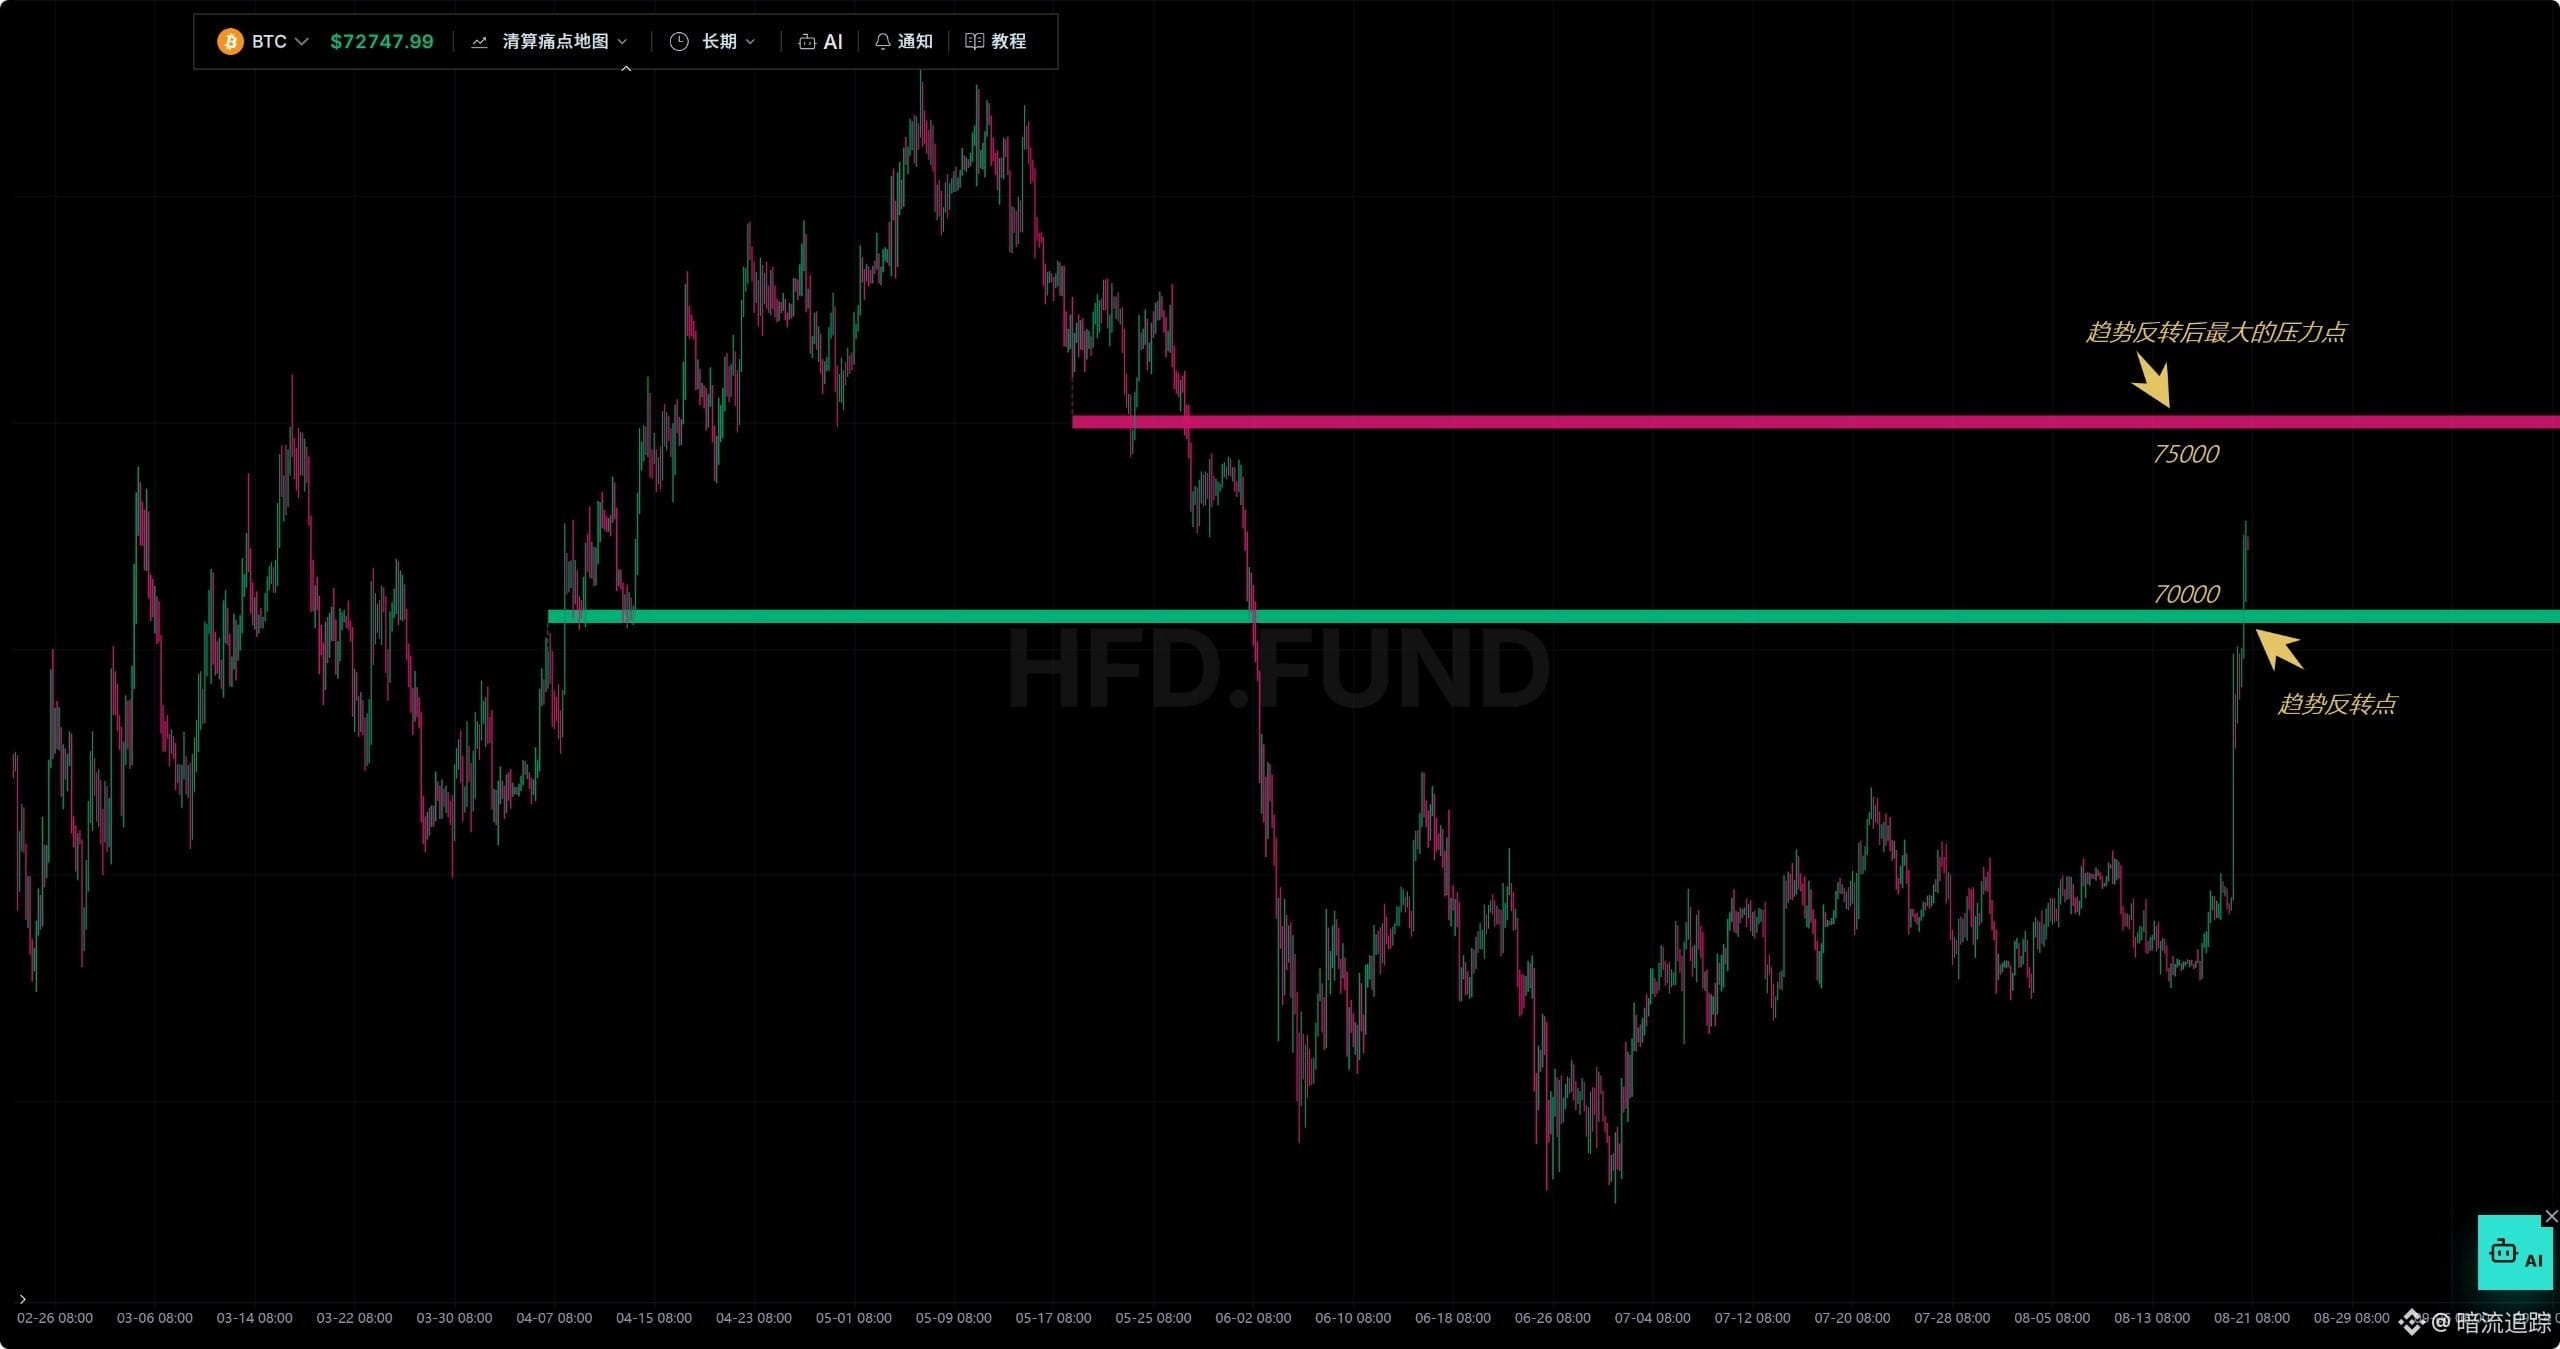
The long-term target of 70000 has also been achieved, but the upward trend has not ended. The turning point is in the 69000-70000 range. As long as this area is not broken, we will continue to look for a bullish move.
Previous projection:
The price would consolidate around 64565-64000.
Actual price action:
It surged upward instantly, and is now already around 72000.
Future price action:
First, let’s determine whether this unexpected rise is a trend reversal or just a rebound.
The long-term moving average at 69000 can be regarded as the line between bull and bear. When the price crosses from below to above, the trend shifts into an uptrend, with the target set at the upper limit.
The long-standing pain point in the 70594-70831 range was decisively broken through and firmly held. This level becomes strong support, which can be seen as a trend reversal. The next target is around 75000, and it is also considered a trend reversal.
The conclusions from the two indicators are consistent: the trend has shifted from bottom-finding >> base-building into an uptrend. The key turning point and support area are in the 69000-70000 range.
Second, where are the targets above? Where is the resistance?
The first consolidation zone is 72182-72477. If 72477 holds, the price will continue higher. The first target is the highest point of the sell limit order at 73110. After it breaks through, the price can be expected to move toward 75000.
But the 75000 area will also face real challenges. Both the cleared pain points and the absence of liquidity/capital in the chart point to this level.
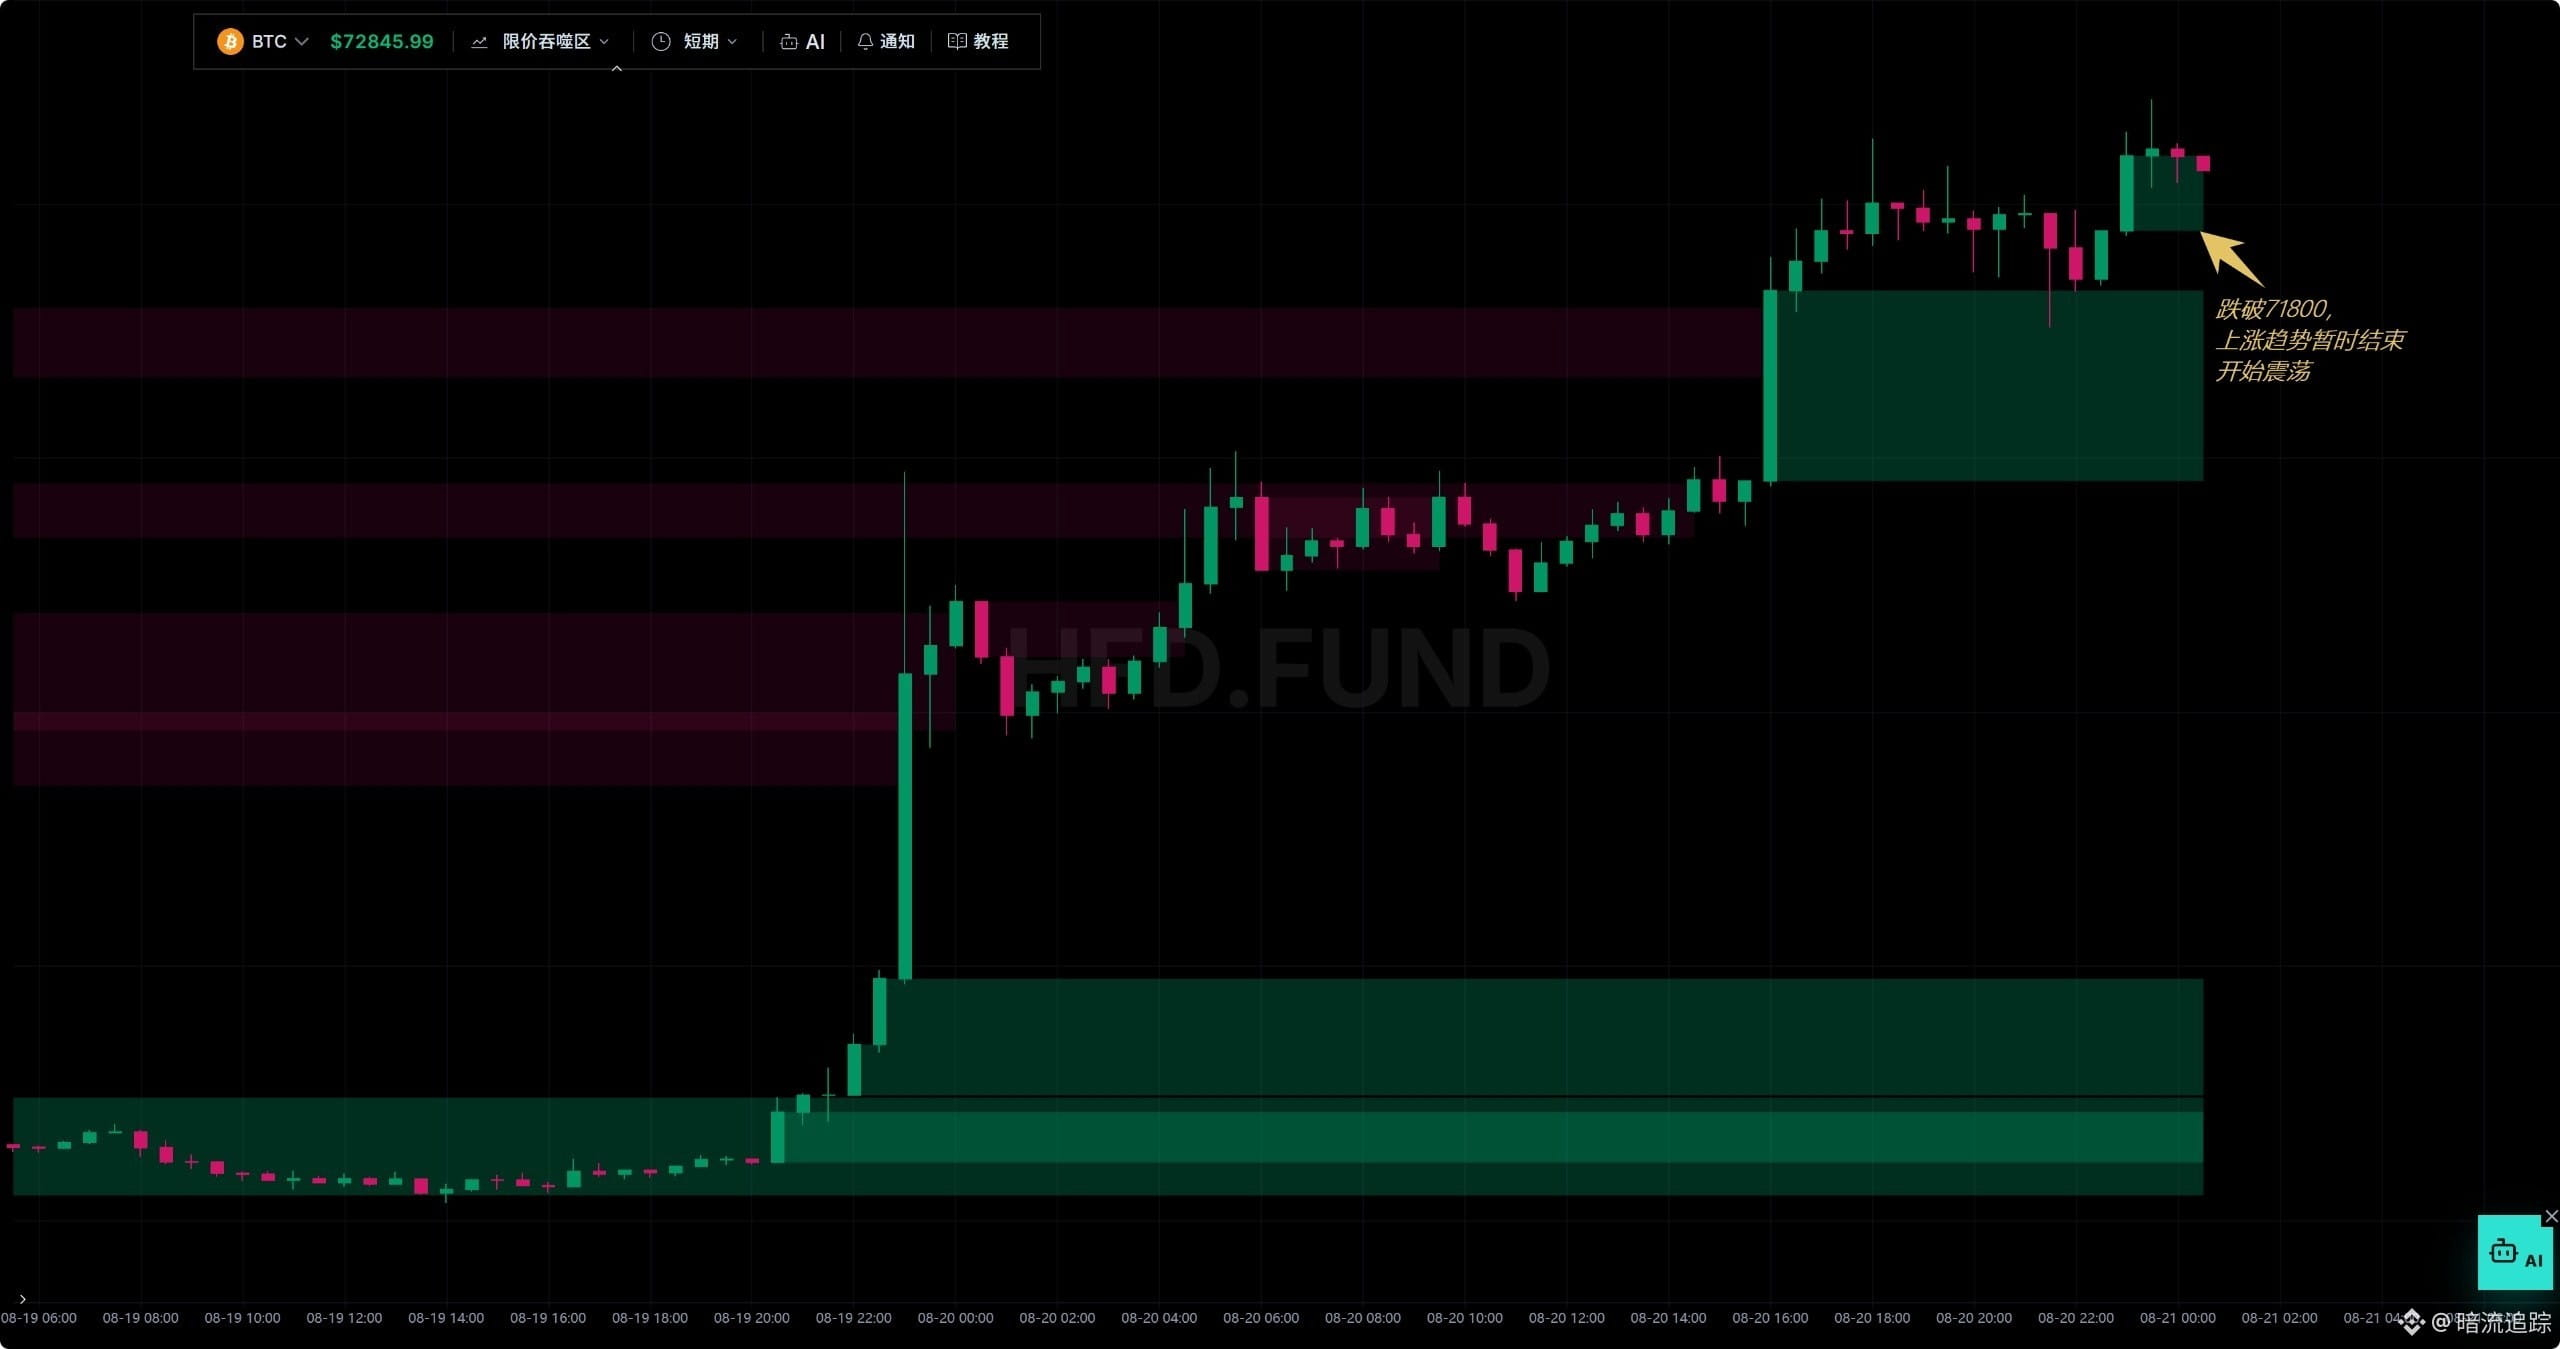
At the same time, pay attention to 71800 in the short term. If it fills back there, we will expect the short-term uptrend to temporarily end and transition into consolidation. Most importantly, the 70000-69000 zone: once that range breaks down, it would indicate the entire trend turning into a pullback.
Continuing from the previous section, the oscillation trend was forcefully pulled up, turning into an upward trend. The upward trend has not ended.
Future price projection:
After moving through 72182-72477, the price will continue rising. The first position is 73110. Once the previous high is broken, the price will reach the resistance area around 75000.
The long-term target of 70000 has also been achieved, but the upward trend has not ended. The turning point is in the 69000-70000 range. As long as this area is not broken, we will continue to look for a bullish move.
Previous projection:
The price would consolidate around 64565-64000.
Actual price action:
It surged upward instantly, and is now already around 72000.
Future price action:
First, let’s determine whether this unexpected rise is a trend reversal or just a rebound.
The long-term moving average at 69000 can be regarded as the line between bull and bear. When the price crosses from below to above, the trend shifts into an uptrend, with the target set at the upper limit.
The long-standing pain point in the 70594-70831 range was decisively broken through and firmly held. This level becomes strong support, which can be seen as a trend reversal. The next target is around 75000, and it is also considered a trend reversal.
The conclusions from the two indicators are consistent: the trend has shifted from bottom-finding >> base-building into an uptrend. The key turning point and support area are in the 69000-70000 range.
Second, where are the targets above? Where is the resistance?
The first consolidation zone is 72182-72477. If 72477 holds, the price will continue higher. The first target is the highest point of the sell limit order at 73110. After it breaks through, the price can be expected to move toward 75000.
But the 75000 area will also face real challenges. Both the cleared pain points and the absence of liquidity/capital in the chart point to this level.
At the same time, pay attention to 71800 in the short term. If it fills back there, we will expect the short-term uptrend to temporarily end and transition into consolidation. Most importantly, the 70000-69000 zone: once that range breaks down, it would indicate the entire trend turning into a pullback.
Summary:
Following the previous discussion, the high point near 65100 has already been completed, and now the market is starting to consolidate.
Future price projection:
Price will fluctuate around 64565–64000.
Pay attention: once it breaks below 64000, the price may slowly drift down toward 63400, 63177, and 62552.
Previous projection:
Fluctuations around 63880–64000. After holding above 64250, the final target is near 65100.
Actual price action:
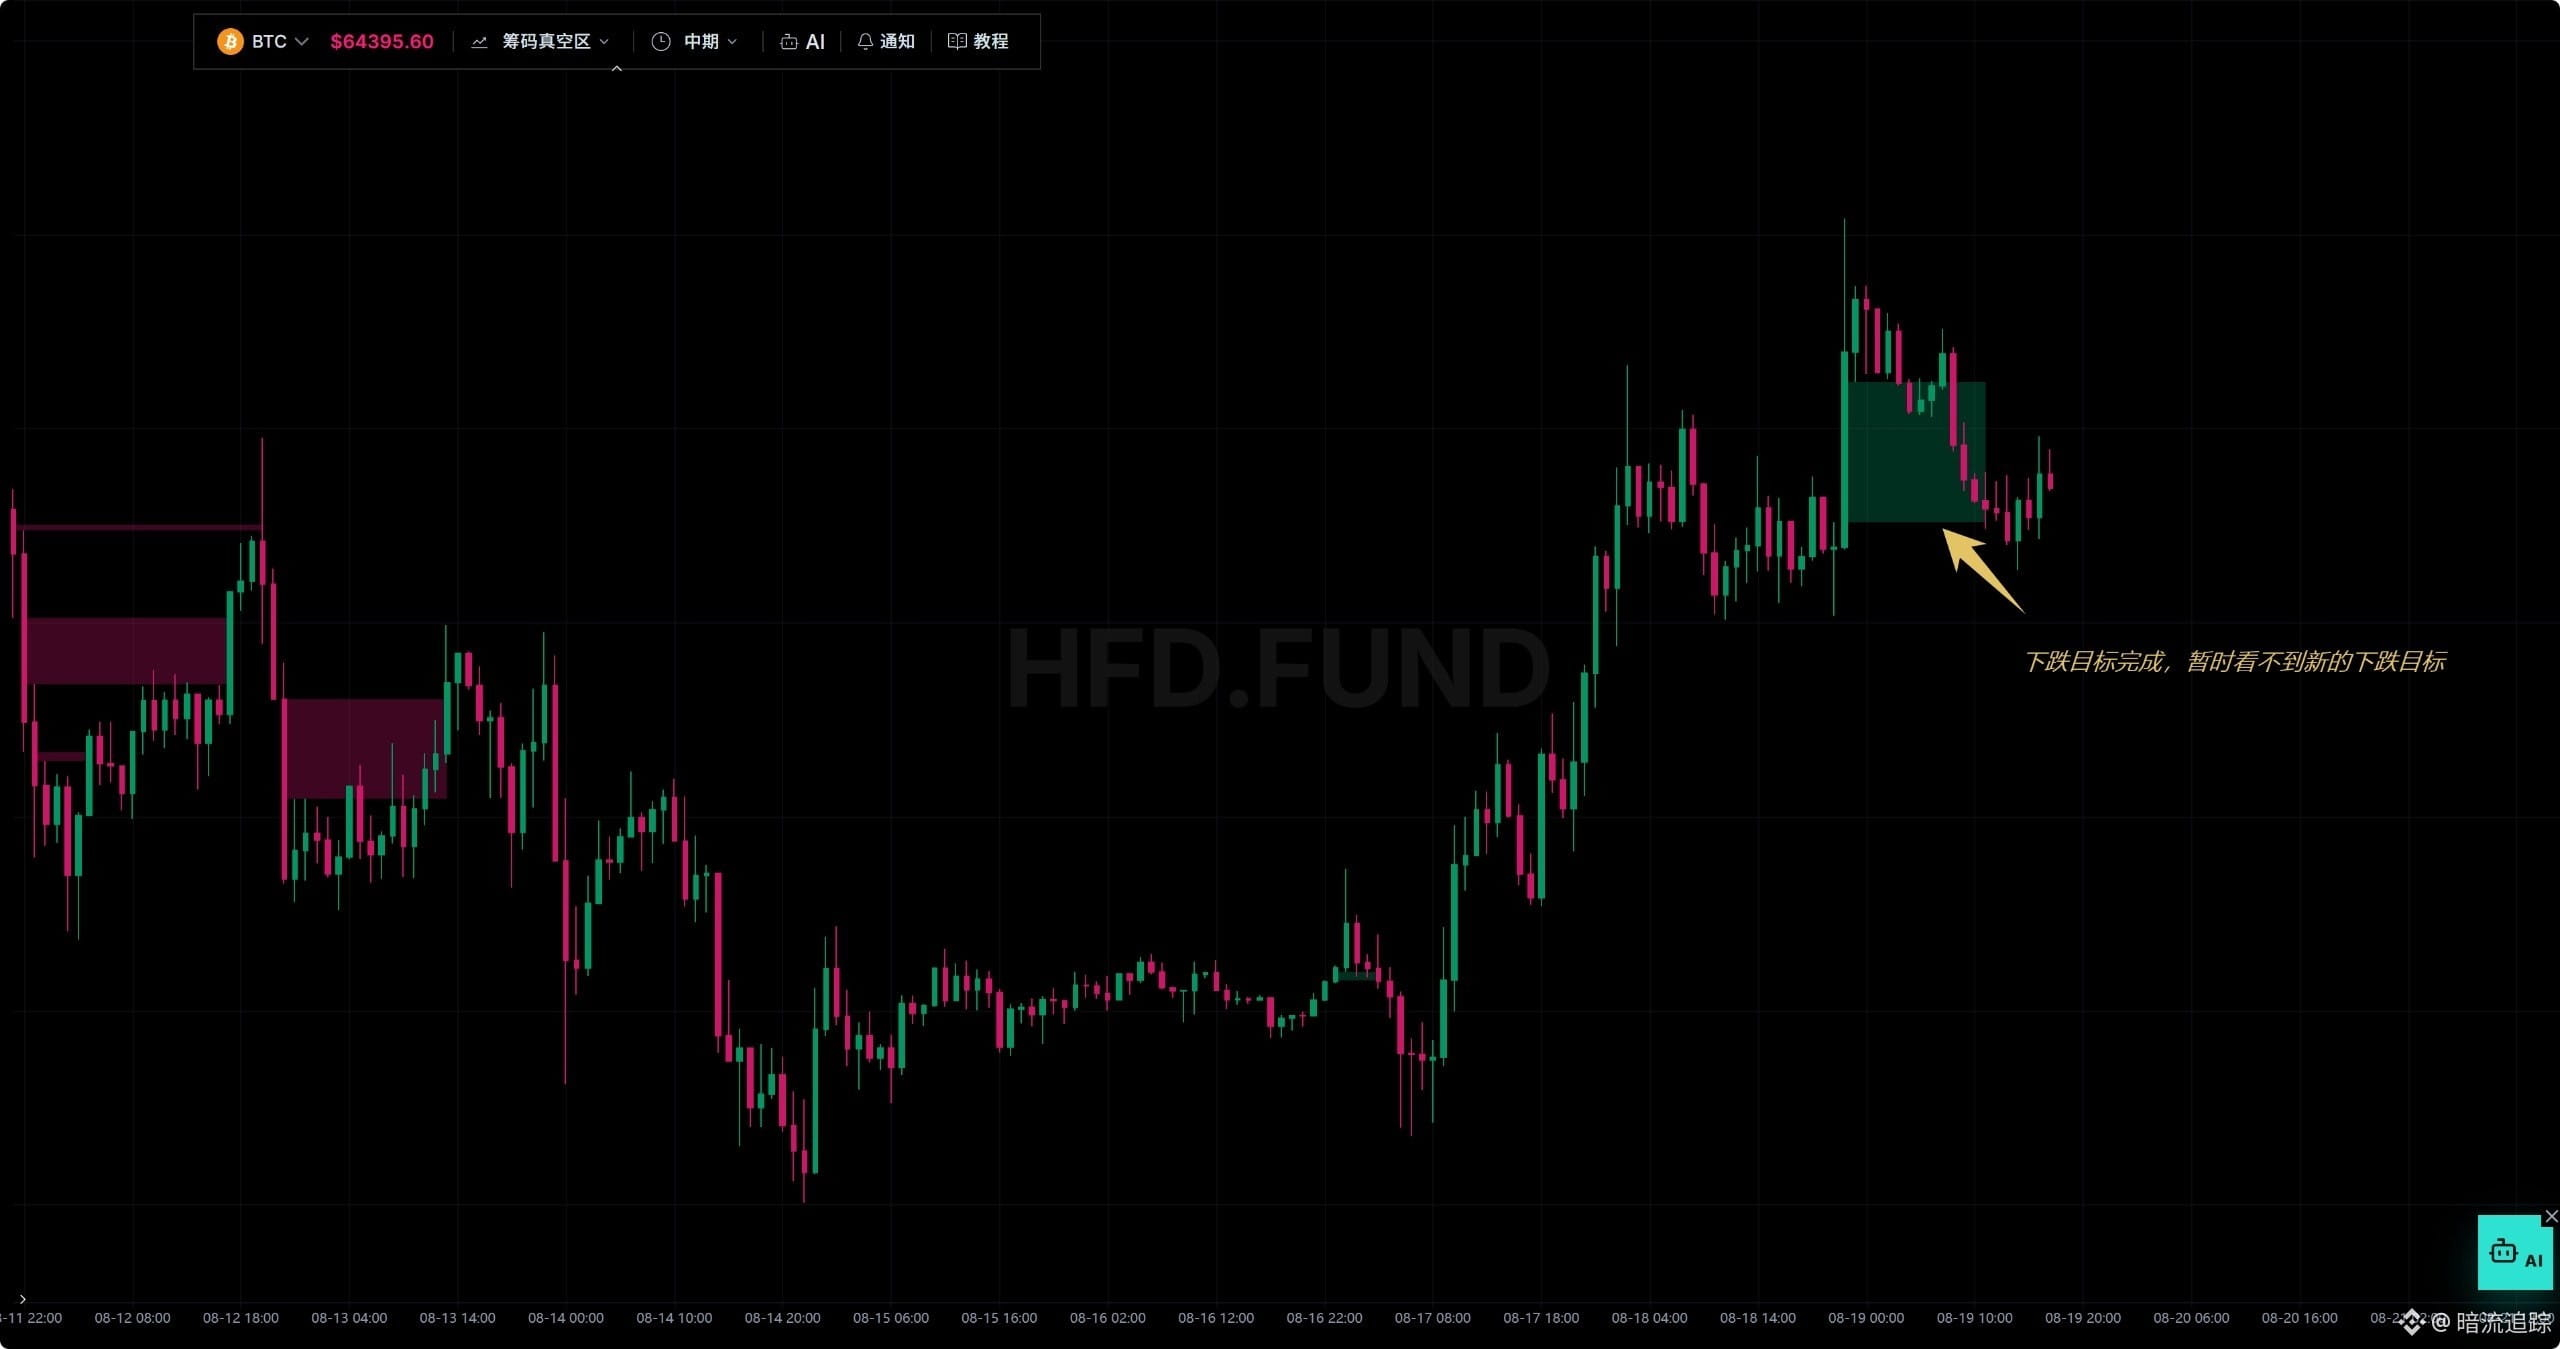
The highest price reached around 65050 before pulling back.
Next price action:
A “chip vacuum.”
In the short term, the newest direction is a long (bullish) attack, but it has already been filled. The remaining historical short lines nearby are still around 65800. After breaking above that upper historical short line, it began to pull back, and the trend is consolidating and declining.
In the medium term, the newest direction is a long (bullish) attack at 64623–64260, which has already been filled; going forward it should consolidate following the trend.
In the long term, the long (bullish) attack is 63400–63117. This zone is very attractive, and given that prices are likely to consolidate with a wide range, it is possible that 63117 gets broken through.
Price channel
Equal-volume short-term average: 63490; upper limit: 70090; lower limit: 58260.
Equal-volume medium-term average: 63590; upper limit: 66810; lower limit: 59040.
Equal-volume long-term average: 69100; upper limit: 93760; lower limit: 59160.
Currently, the price is above the moving averages, so the trend can still be seen as upward.
Equal-volume (by “Ben” indicators)
Short-term equal Ben average: 64020; upper limit: 65620; lower limit: 62310.
Medium-term equal Ben average: 64000; upper limit: 65470; lower limit: 62500.
Long-term equal Ben average: 63880; upper limit: 65200; lower limit: 62500.
After a surge to around 65000, it pulled back without touching the upper limit. It is currently fluctuating near the moving average—watch for consolidation.
Based on the above two indicators, the price is still fluctuating above the moving average. The trend still appears to be an uptrend; however, after touching a high point it pulled back. Going forward, watch for price to fluctuate around 64000.
Volume–price order block
Short-term latest accumulation order block: 64271 has already been penetrated.
Medium-term distribution order block: 64748–65374 has not been penetrated yet.
Long-term accumulation order: the lower edge around 62552 has not been penetrated yet.
At present, it looks like there has been a slight pullback where accumulation limit orders were eaten up, and the price is starting to rebound. The target could then be 64748–65374 above. Still, be mindful of the pull/influence of 62552 on the downside.
Limit-price engulfing
Short-term bullish attack: 64193–64965, but it has already been filled. For now, expect the bullish push to end and then enter consolidation.
Following the previous discussion, the high point near 65100 has already been completed, and now the market is starting to consolidate.
Future price projection:
Price will fluctuate around 64565–64000.
Pay attention: once it breaks below 64000, the price may slowly drift down toward 63400, 63177, and 62552.
Previous projection:
Fluctuations around 63880–64000. After holding above 64250, the final target is near 65100.
Actual price action:
The highest price reached around 65050 before pulling back.
Next price action:
A “chip vacuum.”
In the short term, the newest direction is a long (bullish) attack, but it has already been filled. The remaining historical short lines nearby are still around 65800. After breaking above that upper historical short line, it began to pull back, and the trend is consolidating and declining.
In the medium term, the newest direction is a long (bullish) attack at 64623–64260, which has already been filled; going forward it should consolidate following the trend.
In the long term, the long (bullish) attack is 63400–63117. This zone is very attractive, and given that prices are likely to consolidate with a wide range, it is possible that 63117 gets broken through.
Price channel
Equal-volume short-term average: 63490; upper limit: 70090; lower limit: 58260.
Equal-volume medium-term average: 63590; upper limit: 66810; lower limit: 59040.
Equal-volume long-term average: 69100; upper limit: 93760; lower limit: 59160.
Currently, the price is above the moving averages, so the trend can still be seen as upward.
Equal-volume (by “Ben” indicators)
Short-term equal Ben average: 64020; upper limit: 65620; lower limit: 62310.
Medium-term equal Ben average: 64000; upper limit: 65470; lower limit: 62500.
Long-term equal Ben average: 63880; upper limit: 65200; lower limit: 62500.
After a surge to around 65000, it pulled back without touching the upper limit. It is currently fluctuating near the moving average—watch for consolidation.
Based on the above two indicators, the price is still fluctuating above the moving average. The trend still appears to be an uptrend; however, after touching a high point it pulled back. Going forward, watch for price to fluctuate around 64000.
Volume–price order block
Short-term latest accumulation order block: 64271 has already been penetrated.
Medium-term distribution order block: 64748–65374 has not been penetrated yet.
Long-term accumulation order: the lower edge around 62552 has not been penetrated yet.
At present, it looks like there has been a slight pullback where accumulation limit orders were eaten up, and the price is starting to rebound. The target could then be 64748–65374 above. Still, be mindful of the pull/influence of 62552 on the downside.
Limit-price engulfing
Short-term bullish attack: 64193–64965, but it has already been filled. For now, expect the bullish push to end and then enter consolidation.
Summary:
Continuing from the previous discussion, the current price has fallen into a downward ranging consolidation, and then rebounded toward the mean.
Future price projection:
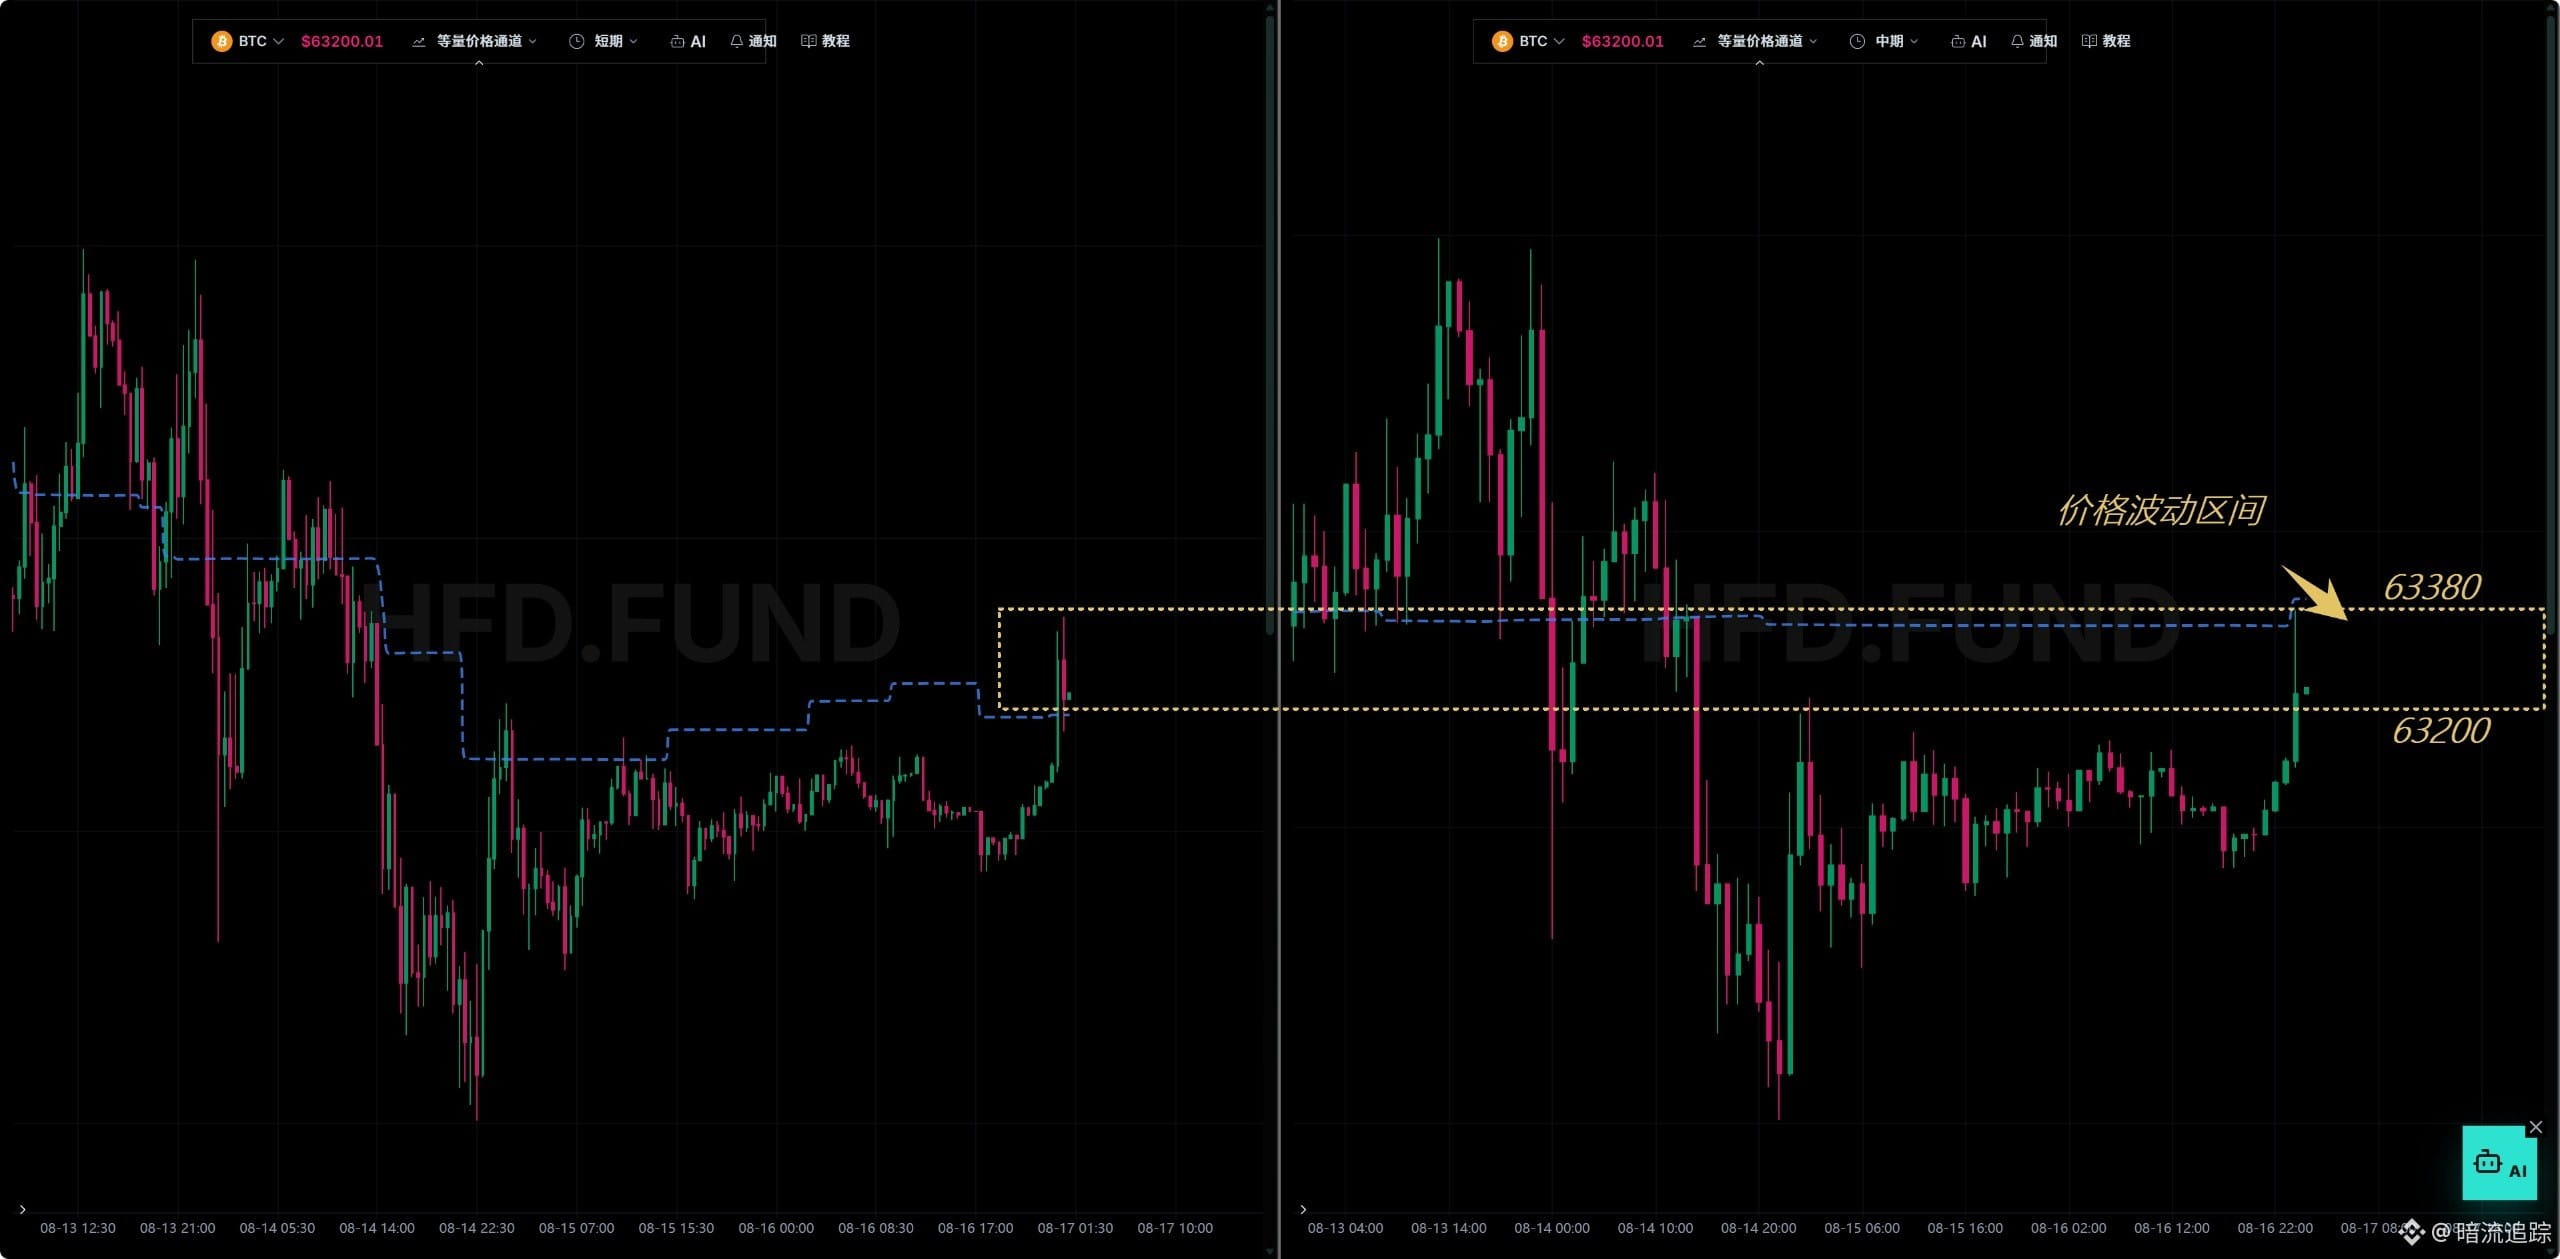
The price will fluctuate between the two moving averages 63200 and 63380. It will pull back toward around 63000, then rebound and break through 63466. After breaking through, it will return to fluctuating within the range of the moving averages.
Previous projection:
Due to historical buy-limit orders providing support, the price rebounded to around 63000.
At 63000, after encountering resistance, it will gradually decline—first down to around 62467, then recover back to around 62500.
Actual price movement:
The price peaked at 63218, then began a slow pullback, reaching a low around 62761.
Future price movement:
Chip vacuum:
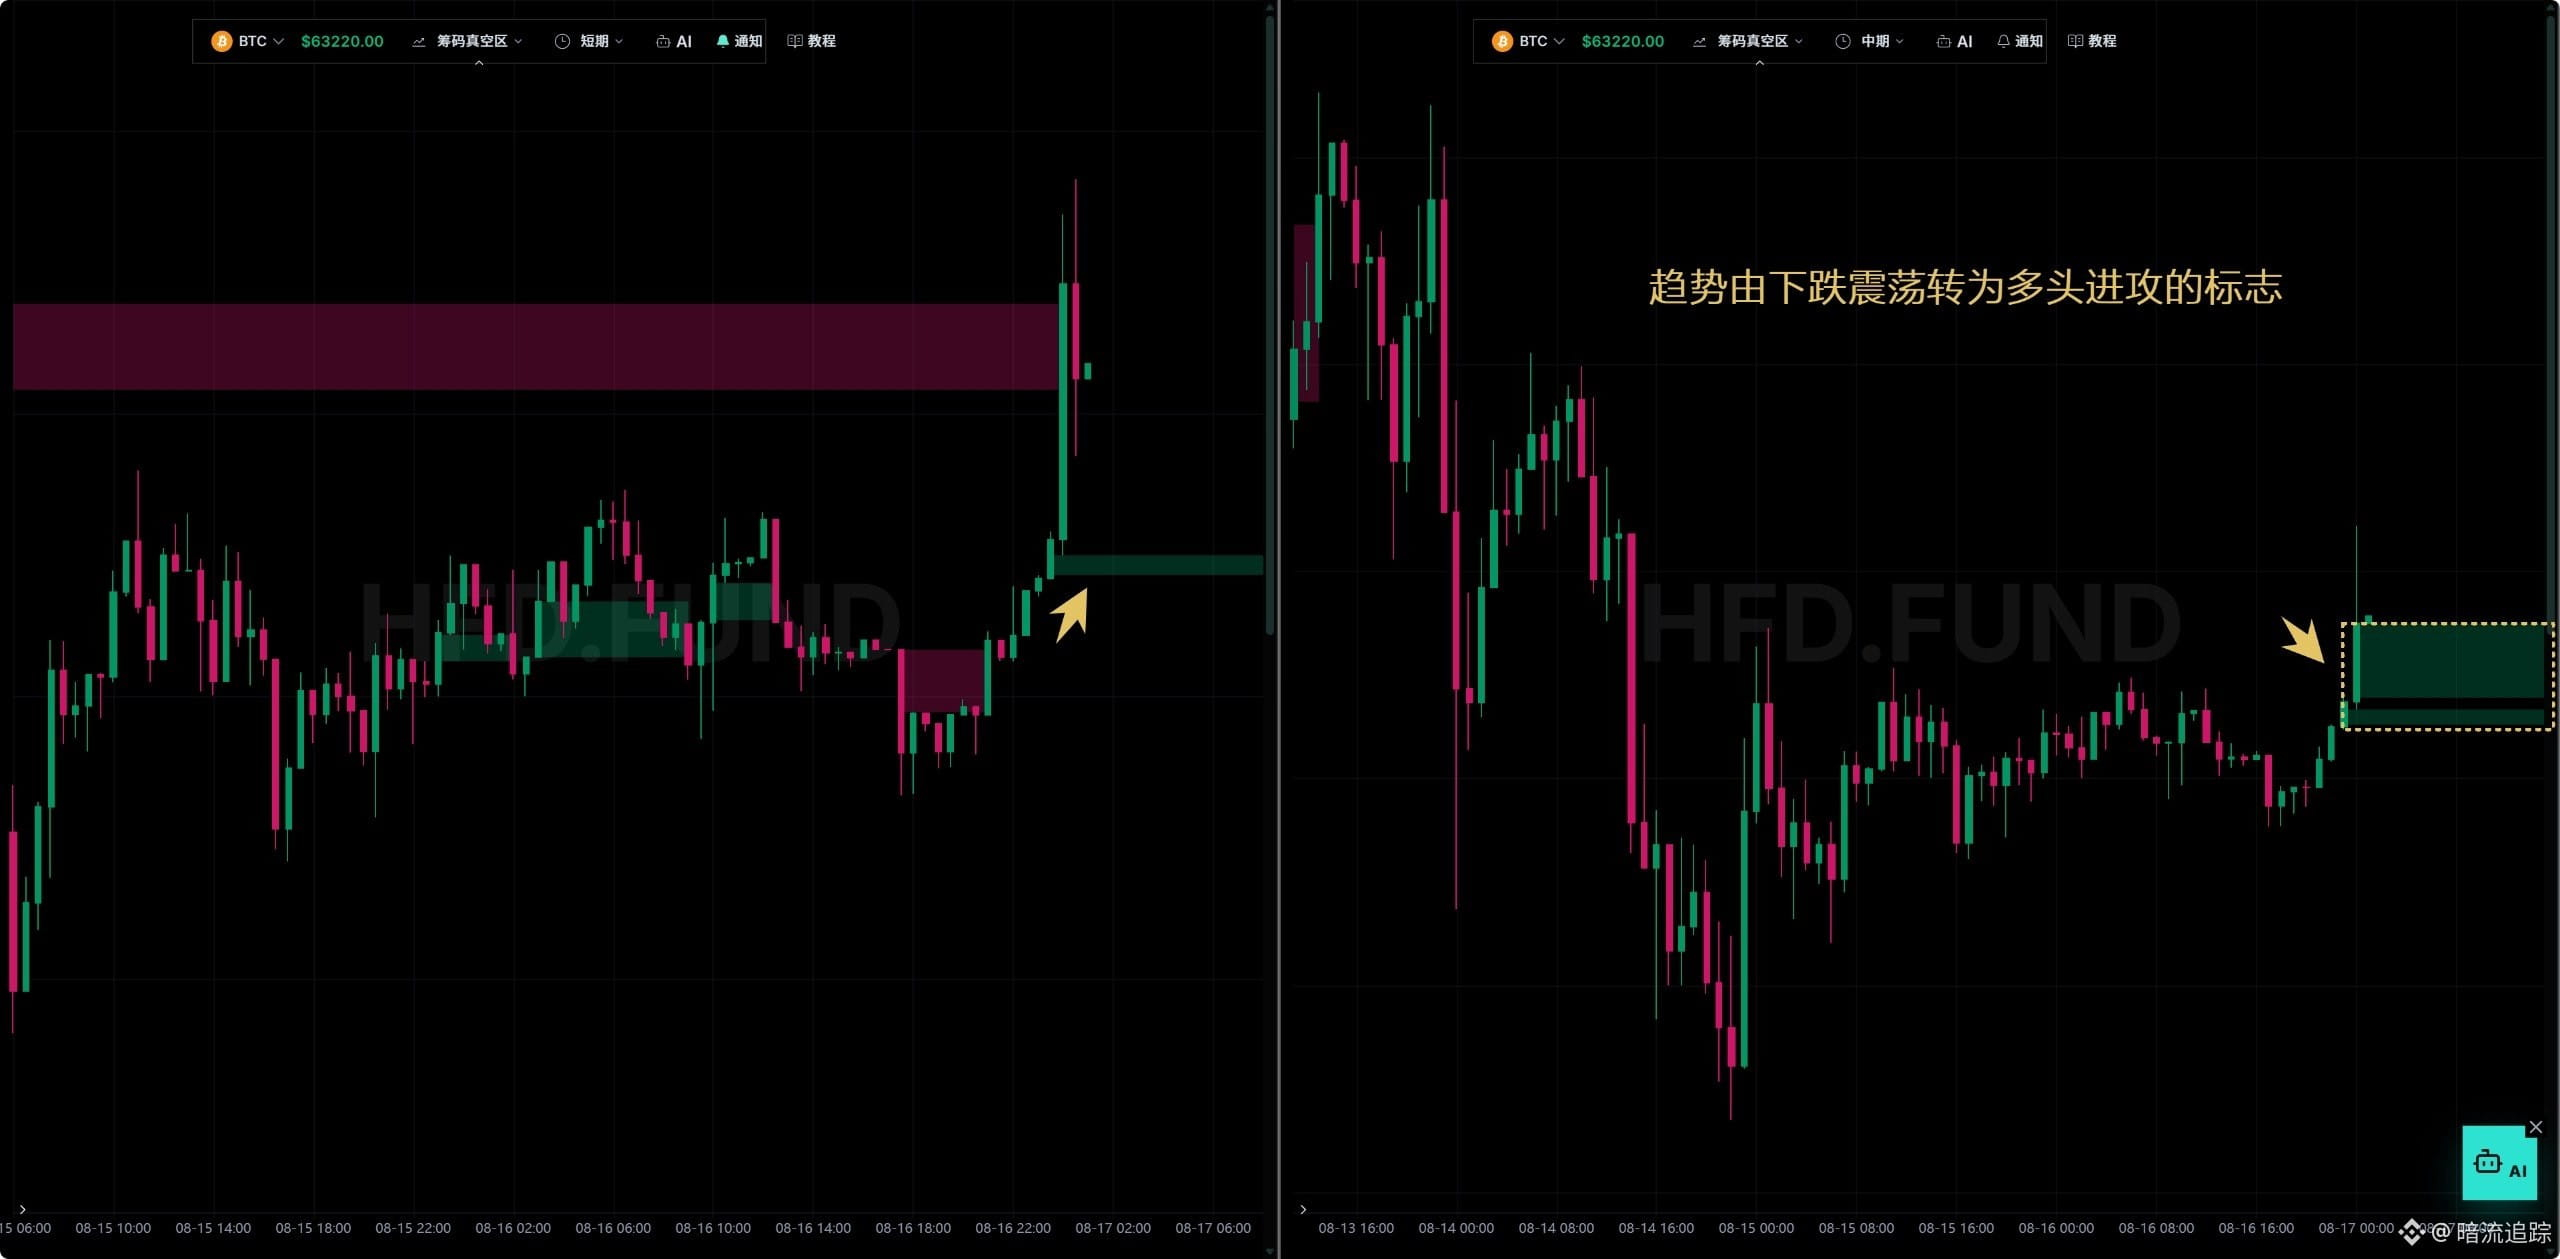
The latest short-term trend is a bullish push. The trend has switched several times—from a bearish push to consolidation, and now to a bullish push—but currently the support along the attack line 63086–63101 is relatively weak. The trend can still be viewed as bullish for now, but it is easy to be broken through.
The mid-term bearish push has shifted into a bullish push; the defense lines are 63078–63226, indicating a bullish trend.
Price channel:
For the equal short-term average: 63200; upper limit 66530; lower limit 58260.
For the equal mid-term average: 63380; upper limit 66810; lower limit 58260.
For the equal long-term average: 70020; upper limit 93760; lower limit 59160.
Currently, the price is ranging around 63200. It has just stabilized above the short-term average. The short-term outlook is upward, but it is still below the mid-term average. With 63380 acting as resistance, the price may range between 63200 and 63380. Influenced by the bullish trend, it is possible to break through 63380.
Equal by current (short-term) average: 64030; upper limit 65620; lower limit 62310.
Equal by current (mid-term) average: 64030; upper limit 65470; lower limit 62500.
Equal by current (long-term) average: 63920; upper limit 65200; lower limit 62500.
Currently, the price is below the moving average and in a downward trend, but this is a rebound after the price touched the lower limit and entered consolidation. It can be seen as a move back toward the midline. However, the midline is also pressure—once it establishes, a trend shift will occur. The trend is reverting upward toward the moving average, but the strength is weak, constrained by resistance in the 63900–64000 area.
Currently, after the decline, the trend is in a weaker recovery back toward the mean. The trend has not fully reversed; it can only be regarded as a rebound. The price is likely to remain between 63200 and 63380 and will likely face resistance from 63900–64000.
Volume-price order blocks:
The upper edge (around 63189) of the short-term distribution sell orders has already been broken through. The upper edge of the latest mid-term distribution sell orders (around 63466) is the next target.
Continuing from the previous discussion, the current price has fallen into a downward ranging consolidation, and then rebounded toward the mean.
Future price projection:
The price will fluctuate between the two moving averages 63200 and 63380. It will pull back toward around 63000, then rebound and break through 63466. After breaking through, it will return to fluctuating within the range of the moving averages.
Previous projection:
Due to historical buy-limit orders providing support, the price rebounded to around 63000.
At 63000, after encountering resistance, it will gradually decline—first down to around 62467, then recover back to around 62500.
Actual price movement:
The price peaked at 63218, then began a slow pullback, reaching a low around 62761.
Future price movement:
Chip vacuum:
The latest short-term trend is a bullish push. The trend has switched several times—from a bearish push to consolidation, and now to a bullish push—but currently the support along the attack line 63086–63101 is relatively weak. The trend can still be viewed as bullish for now, but it is easy to be broken through.
The mid-term bearish push has shifted into a bullish push; the defense lines are 63078–63226, indicating a bullish trend.
Price channel:
For the equal short-term average: 63200; upper limit 66530; lower limit 58260.
For the equal mid-term average: 63380; upper limit 66810; lower limit 58260.
For the equal long-term average: 70020; upper limit 93760; lower limit 59160.
Currently, the price is ranging around 63200. It has just stabilized above the short-term average. The short-term outlook is upward, but it is still below the mid-term average. With 63380 acting as resistance, the price may range between 63200 and 63380. Influenced by the bullish trend, it is possible to break through 63380.
Equal by current (short-term) average: 64030; upper limit 65620; lower limit 62310.
Equal by current (mid-term) average: 64030; upper limit 65470; lower limit 62500.
Equal by current (long-term) average: 63920; upper limit 65200; lower limit 62500.
Currently, the price is below the moving average and in a downward trend, but this is a rebound after the price touched the lower limit and entered consolidation. It can be seen as a move back toward the midline. However, the midline is also pressure—once it establishes, a trend shift will occur. The trend is reverting upward toward the moving average, but the strength is weak, constrained by resistance in the 63900–64000 area.
Currently, after the decline, the trend is in a weaker recovery back toward the mean. The trend has not fully reversed; it can only be regarded as a rebound. The price is likely to remain between 63200 and 63380 and will likely face resistance from 63900–64000.
Volume-price order blocks:
The upper edge (around 63189) of the short-term distribution sell orders has already been broken through. The upper edge of the latest mid-term distribution sell orders (around 63466) is the next target.
Summary:
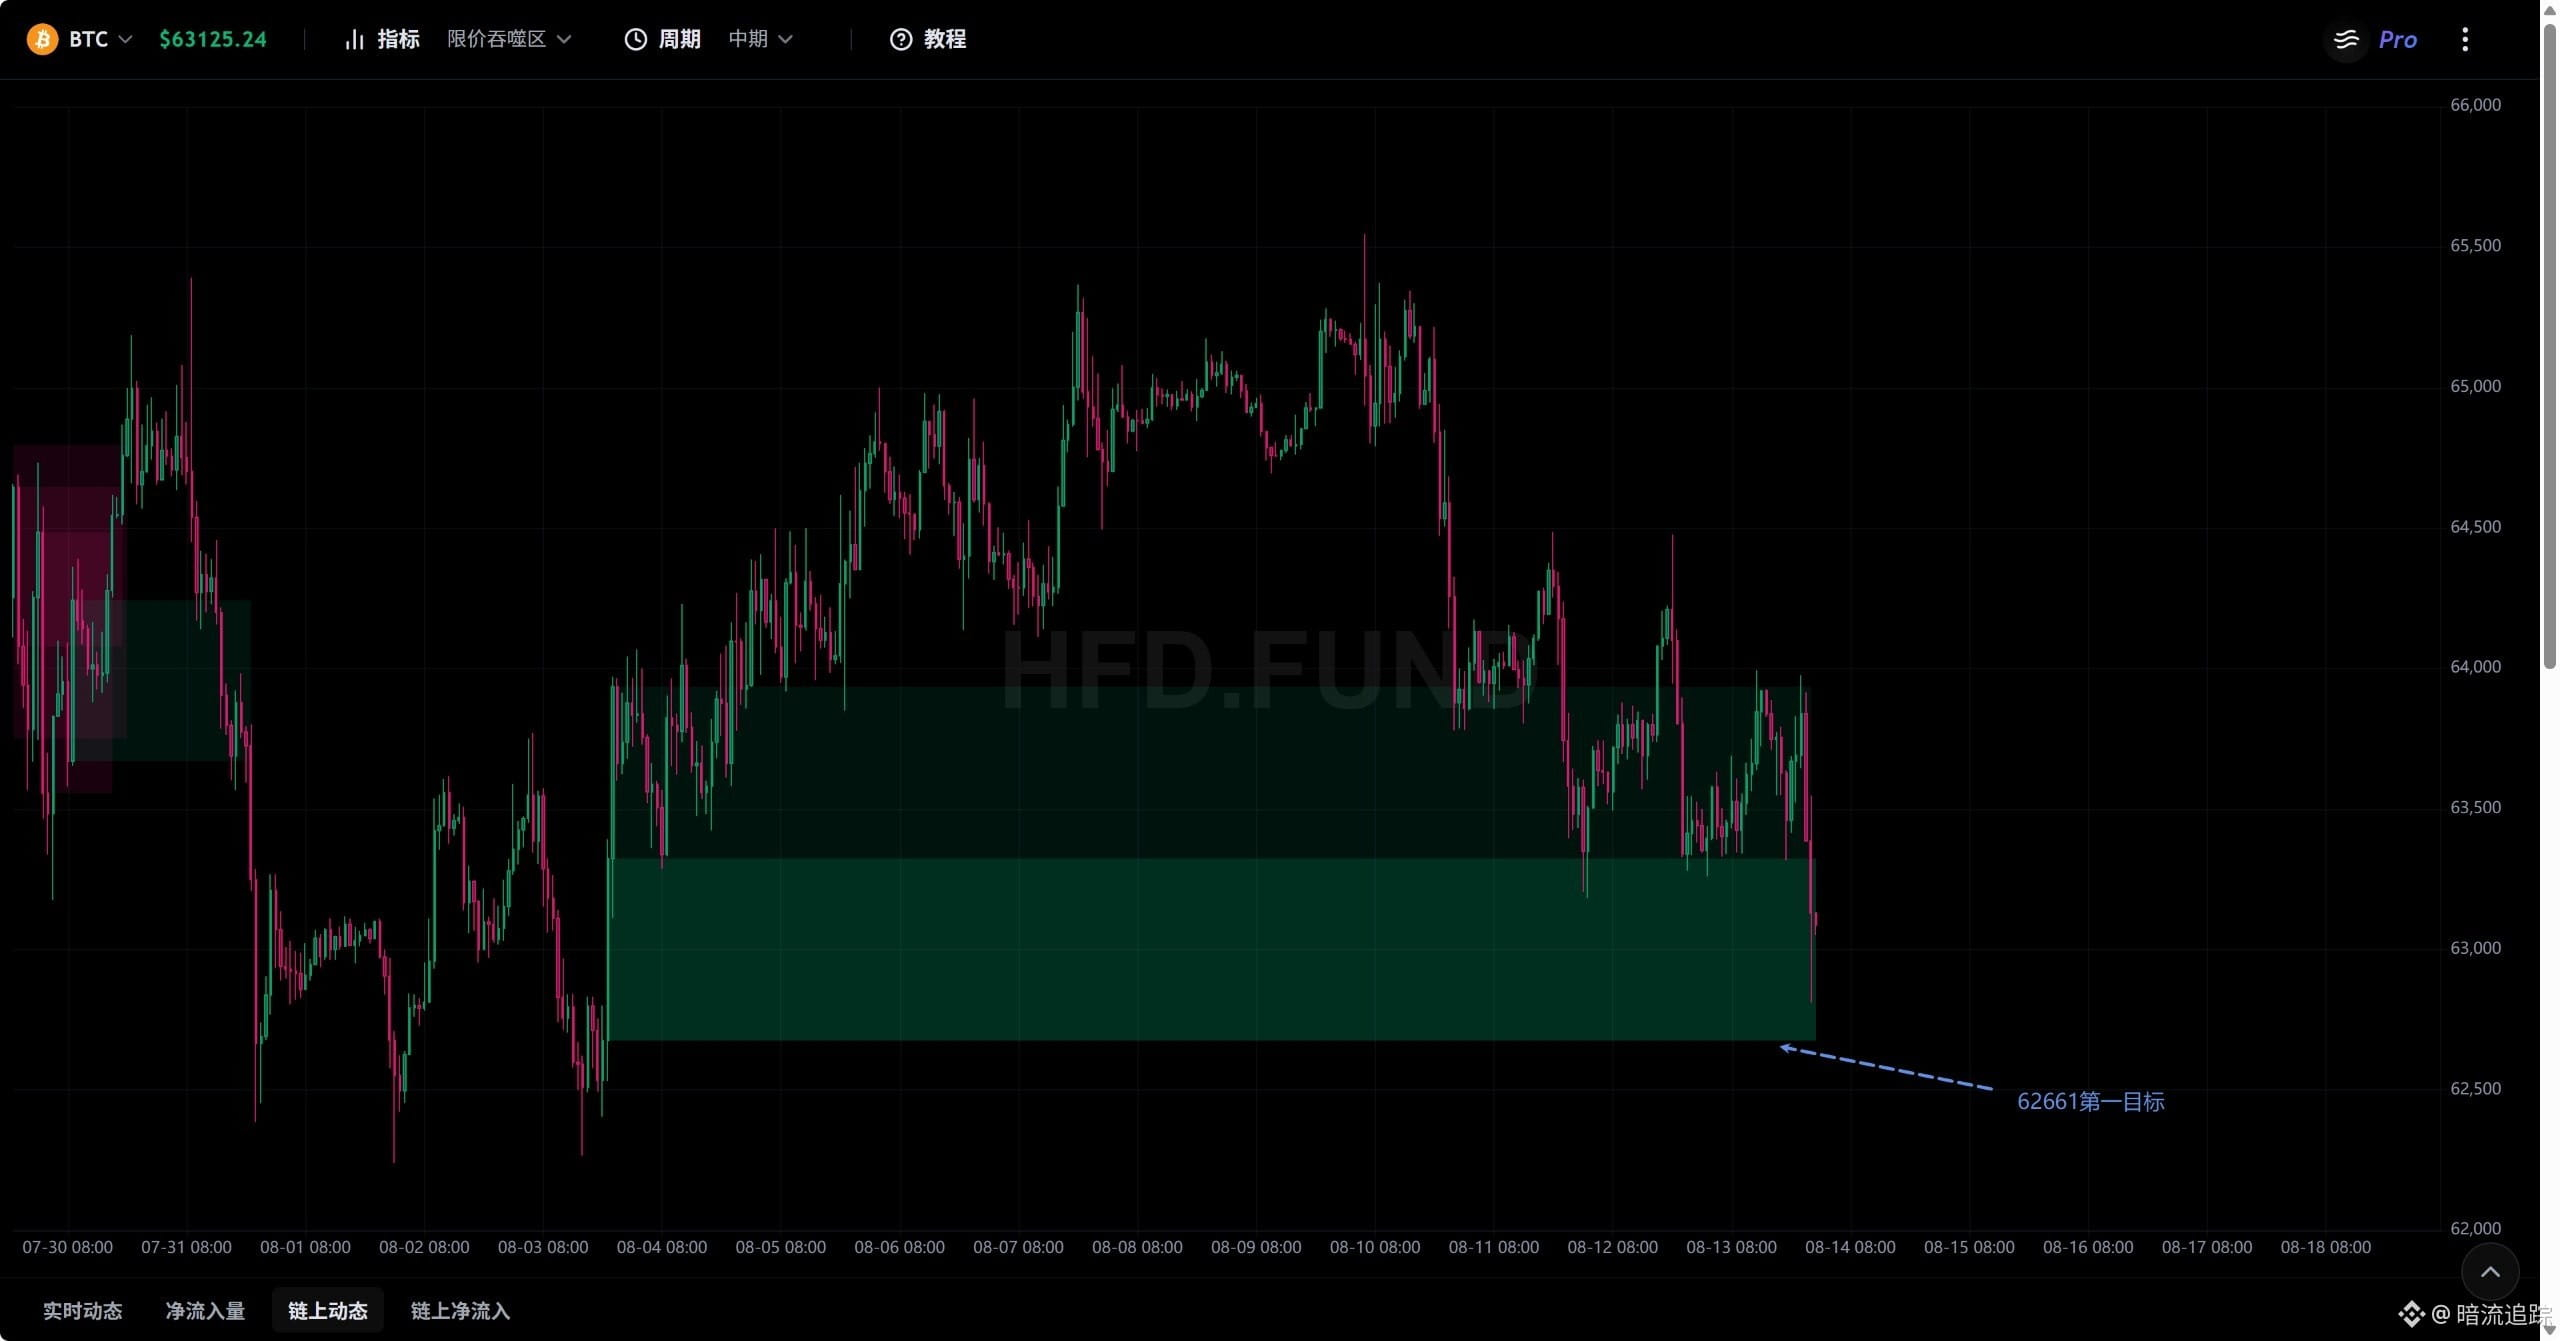
Continuing from the previous section: the earlier-mentioned range has already been breached. As a result, the current downtrend is likely to continue with further selling.
Next price projection:
After a period of consolidation, the price will keep falling. The first target is to break through the area around 62661, and then move to 62500 to find support.
Previous projection:
Because of the influence of the short-term bulls, the price may rebound as high as around 64430. When it meets resistance, it will drop again and then consolidate in the range of 63700–64000.
Actual price movement:
The price reached a high of 64486, then kept falling. It is currently consolidating between 63300 and 64000.
Next price movement:
Positioning vacuum
All the latest short-term bullish advances have been filled. Above in history, there were bearish advances; for now, we expect the ongoing bearish advance trend within consolidation.
The medium-term bearish advance trend is still present, but the entire attack defense line has been filled. The outlook is bearish, but we will first see consolidation.
The long-term historical bullish advance has been filled. The bullish trend appears to be over, and there is no latest bearish advance trend. So we expect consolidation.
Overall, the price is fluctuating up and down significantly. Once there is a clear attacking side, it will likely be filled. But overall, the trend remains down while consolidating.
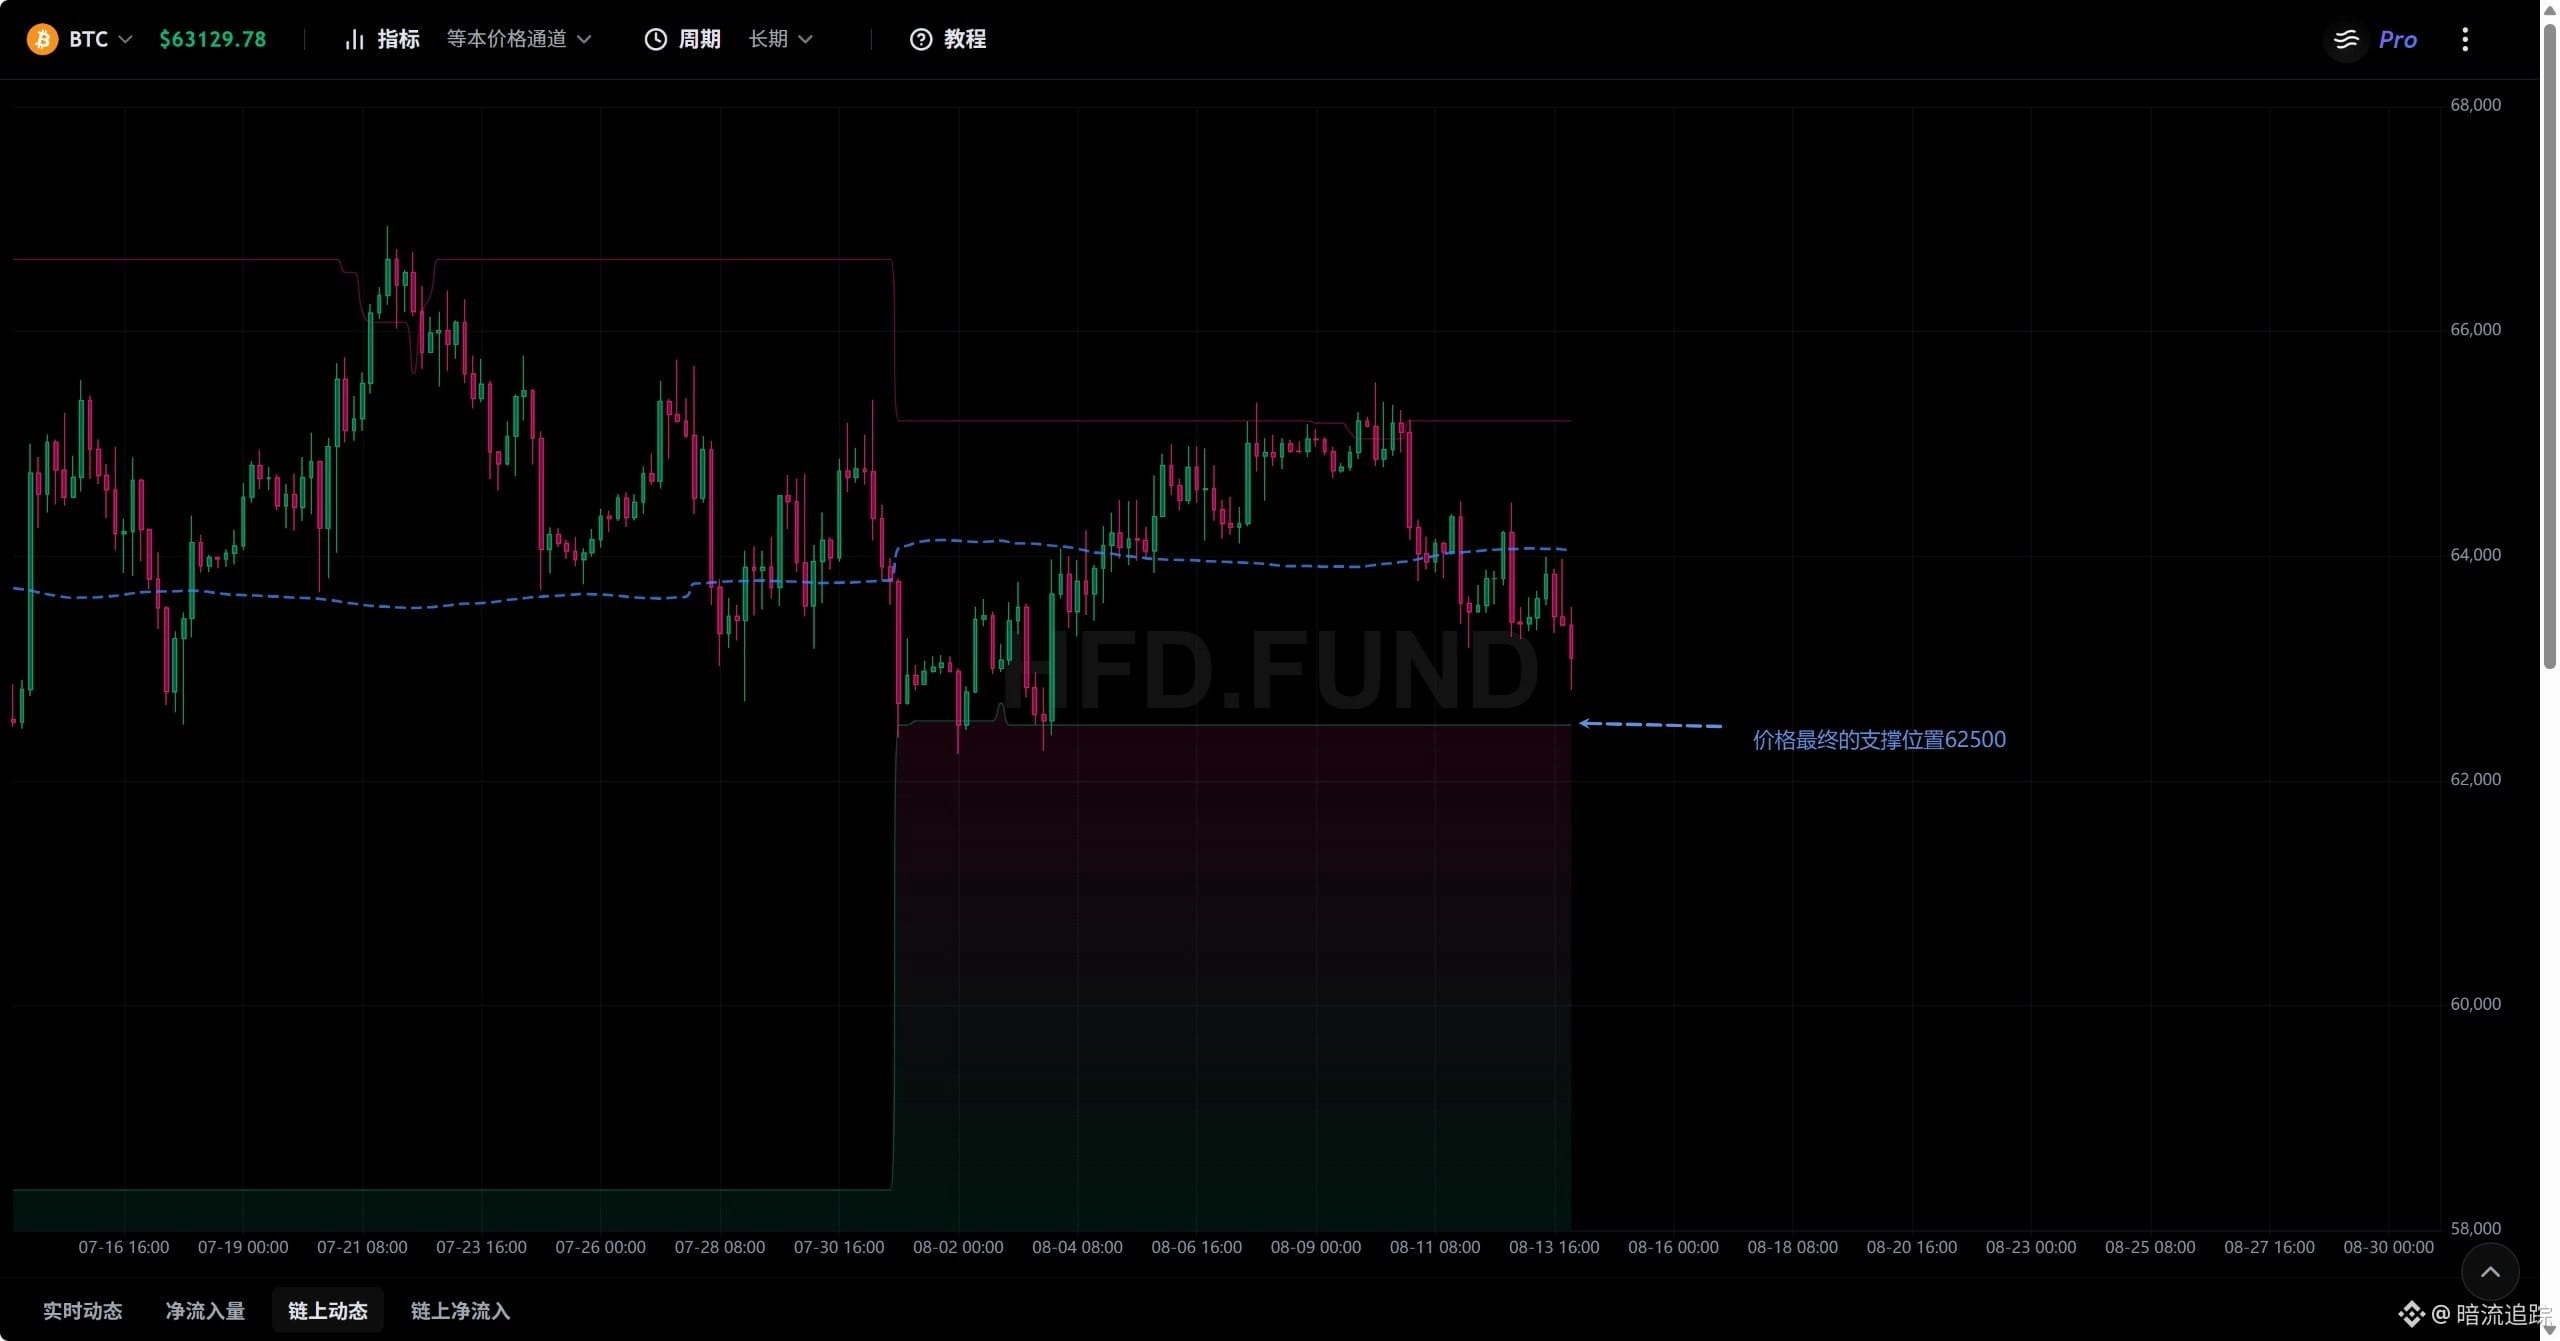
Price channel
For the same amount of short-term average: 63490; upper limit 69370; lower limit 58260.
For the same amount of medium-term average: 63370; upper limit 66810; lower limit 58260.
For the same amount of long-term average: 70020; upper limit 93760; lower limit 59160.
The most direct way to interpret this indicator is that the average price continues to decline. The current price is still hovering near the average, which suggests the price is currently at a market’s natural fluctuation level and matches the institutions’ expected value.
Support is provided by 63370–63490. As that support keeps moving down, it also indicates a downward trend. However, the institution’s average price can still hold the price, meaning there is no obvious deviation in the market.
For the same-time short-term average: 64370; upper limit 66810; lower limit 62310.
For the same-time medium-term average: 64200; upper limit 66810; lower limit 61750.
For the same-time long-term average: 64050; upper limit 65200; lower limit 62500.
Based on this indicator, the current price is below the average price—so it is in a downward trend. But the lower limit is very close, because the moving averages have lost their support. Therefore, with the downtrend, it will seek support around 62500.
Based on these two indicators, the price is already below the “same-time average.” The outlook is that it may drop toward around 62000 to find support. But since the same-quantity average line keeps moving down, it provides support to the price—so the decline may not be smooth.
Continuing from the previous section: the earlier-mentioned range has already been breached. As a result, the current downtrend is likely to continue with further selling.
Next price projection:
After a period of consolidation, the price will keep falling. The first target is to break through the area around 62661, and then move to 62500 to find support.
Previous projection:
Because of the influence of the short-term bulls, the price may rebound as high as around 64430. When it meets resistance, it will drop again and then consolidate in the range of 63700–64000.
Actual price movement:
The price reached a high of 64486, then kept falling. It is currently consolidating between 63300 and 64000.
Next price movement:
Positioning vacuum
All the latest short-term bullish advances have been filled. Above in history, there were bearish advances; for now, we expect the ongoing bearish advance trend within consolidation.
The medium-term bearish advance trend is still present, but the entire attack defense line has been filled. The outlook is bearish, but we will first see consolidation.
The long-term historical bullish advance has been filled. The bullish trend appears to be over, and there is no latest bearish advance trend. So we expect consolidation.
Overall, the price is fluctuating up and down significantly. Once there is a clear attacking side, it will likely be filled. But overall, the trend remains down while consolidating.
Price channel
For the same amount of short-term average: 63490; upper limit 69370; lower limit 58260.
For the same amount of medium-term average: 63370; upper limit 66810; lower limit 58260.
For the same amount of long-term average: 70020; upper limit 93760; lower limit 59160.
The most direct way to interpret this indicator is that the average price continues to decline. The current price is still hovering near the average, which suggests the price is currently at a market’s natural fluctuation level and matches the institutions’ expected value.
Support is provided by 63370–63490. As that support keeps moving down, it also indicates a downward trend. However, the institution’s average price can still hold the price, meaning there is no obvious deviation in the market.
For the same-time short-term average: 64370; upper limit 66810; lower limit 62310.
For the same-time medium-term average: 64200; upper limit 66810; lower limit 61750.
For the same-time long-term average: 64050; upper limit 65200; lower limit 62500.
Based on this indicator, the current price is below the average price—so it is in a downward trend. But the lower limit is very close, because the moving averages have lost their support. Therefore, with the downtrend, it will seek support around 62500.
Based on these two indicators, the price is already below the “same-time average.” The outlook is that it may drop toward around 62000 to find support. But since the same-quantity average line keeps moving down, it provides support to the price—so the decline may not be smooth.
Summary:
Following the previous discussion, the earlier decline is temporarily over; we will first look for a bottoming out, with a modest rebound.
Future price scenarios:
Due to the impact of a short-term bullish push, the price may rebound as high as around 64,430. When it meets resistance, it will likely fall back again and then range-trade in the 63,700–64,000 zone.
Previous scenario:
The trend is downward. We expect it may drop toward the 64,300 average price area, and then fluctuate around this level to find direction.
Since mid-term accumulation (buying) is about to begin, take note: if 64,300 is broken and the price cannot quickly reclaim it, the bearish outlook could target the 64,000–63,700 area.
Actual price action:
The lowest point dropped to 63,779, then it began to move upward in consolidation, and it is now around 64,100.
Future price action:
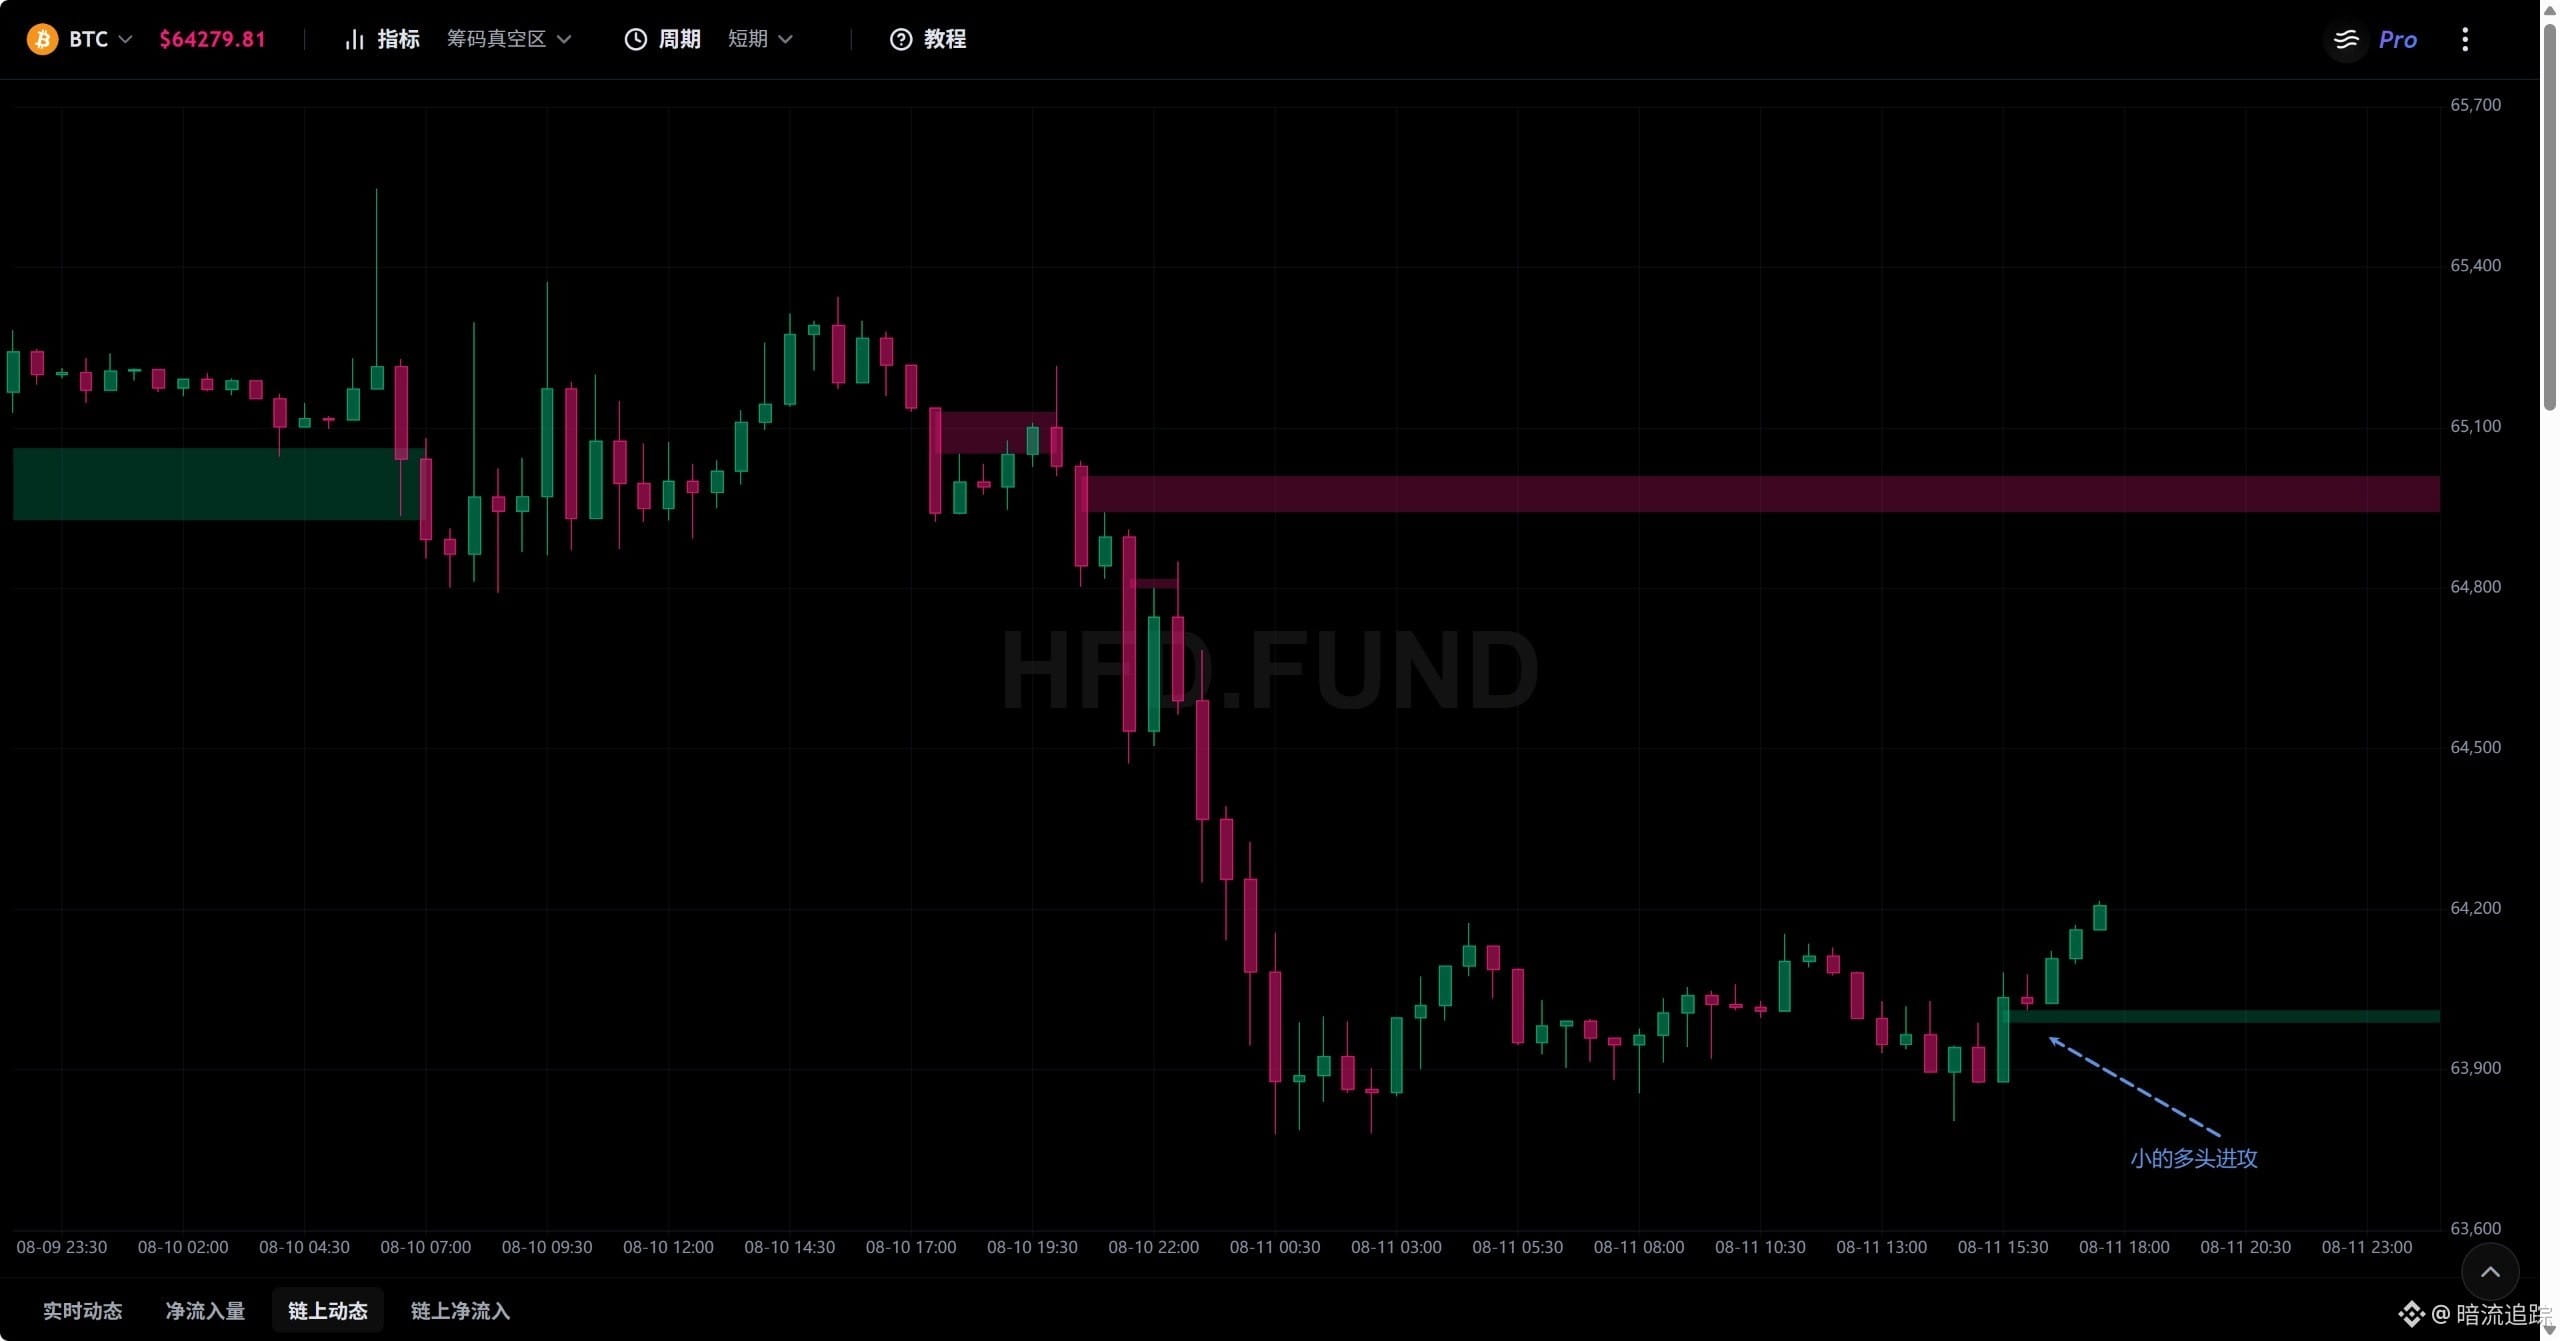
Trading volume vacuum
With a short-term bullish offensive, the defense line is 64,012–63,980. In the short term, the trend is shifting from bearish pressure to bullish pressure, which also indicates that the decline has paused and consolidation has begun.
For the mid-term and long-term, we still expect consolidation, with no new actions.
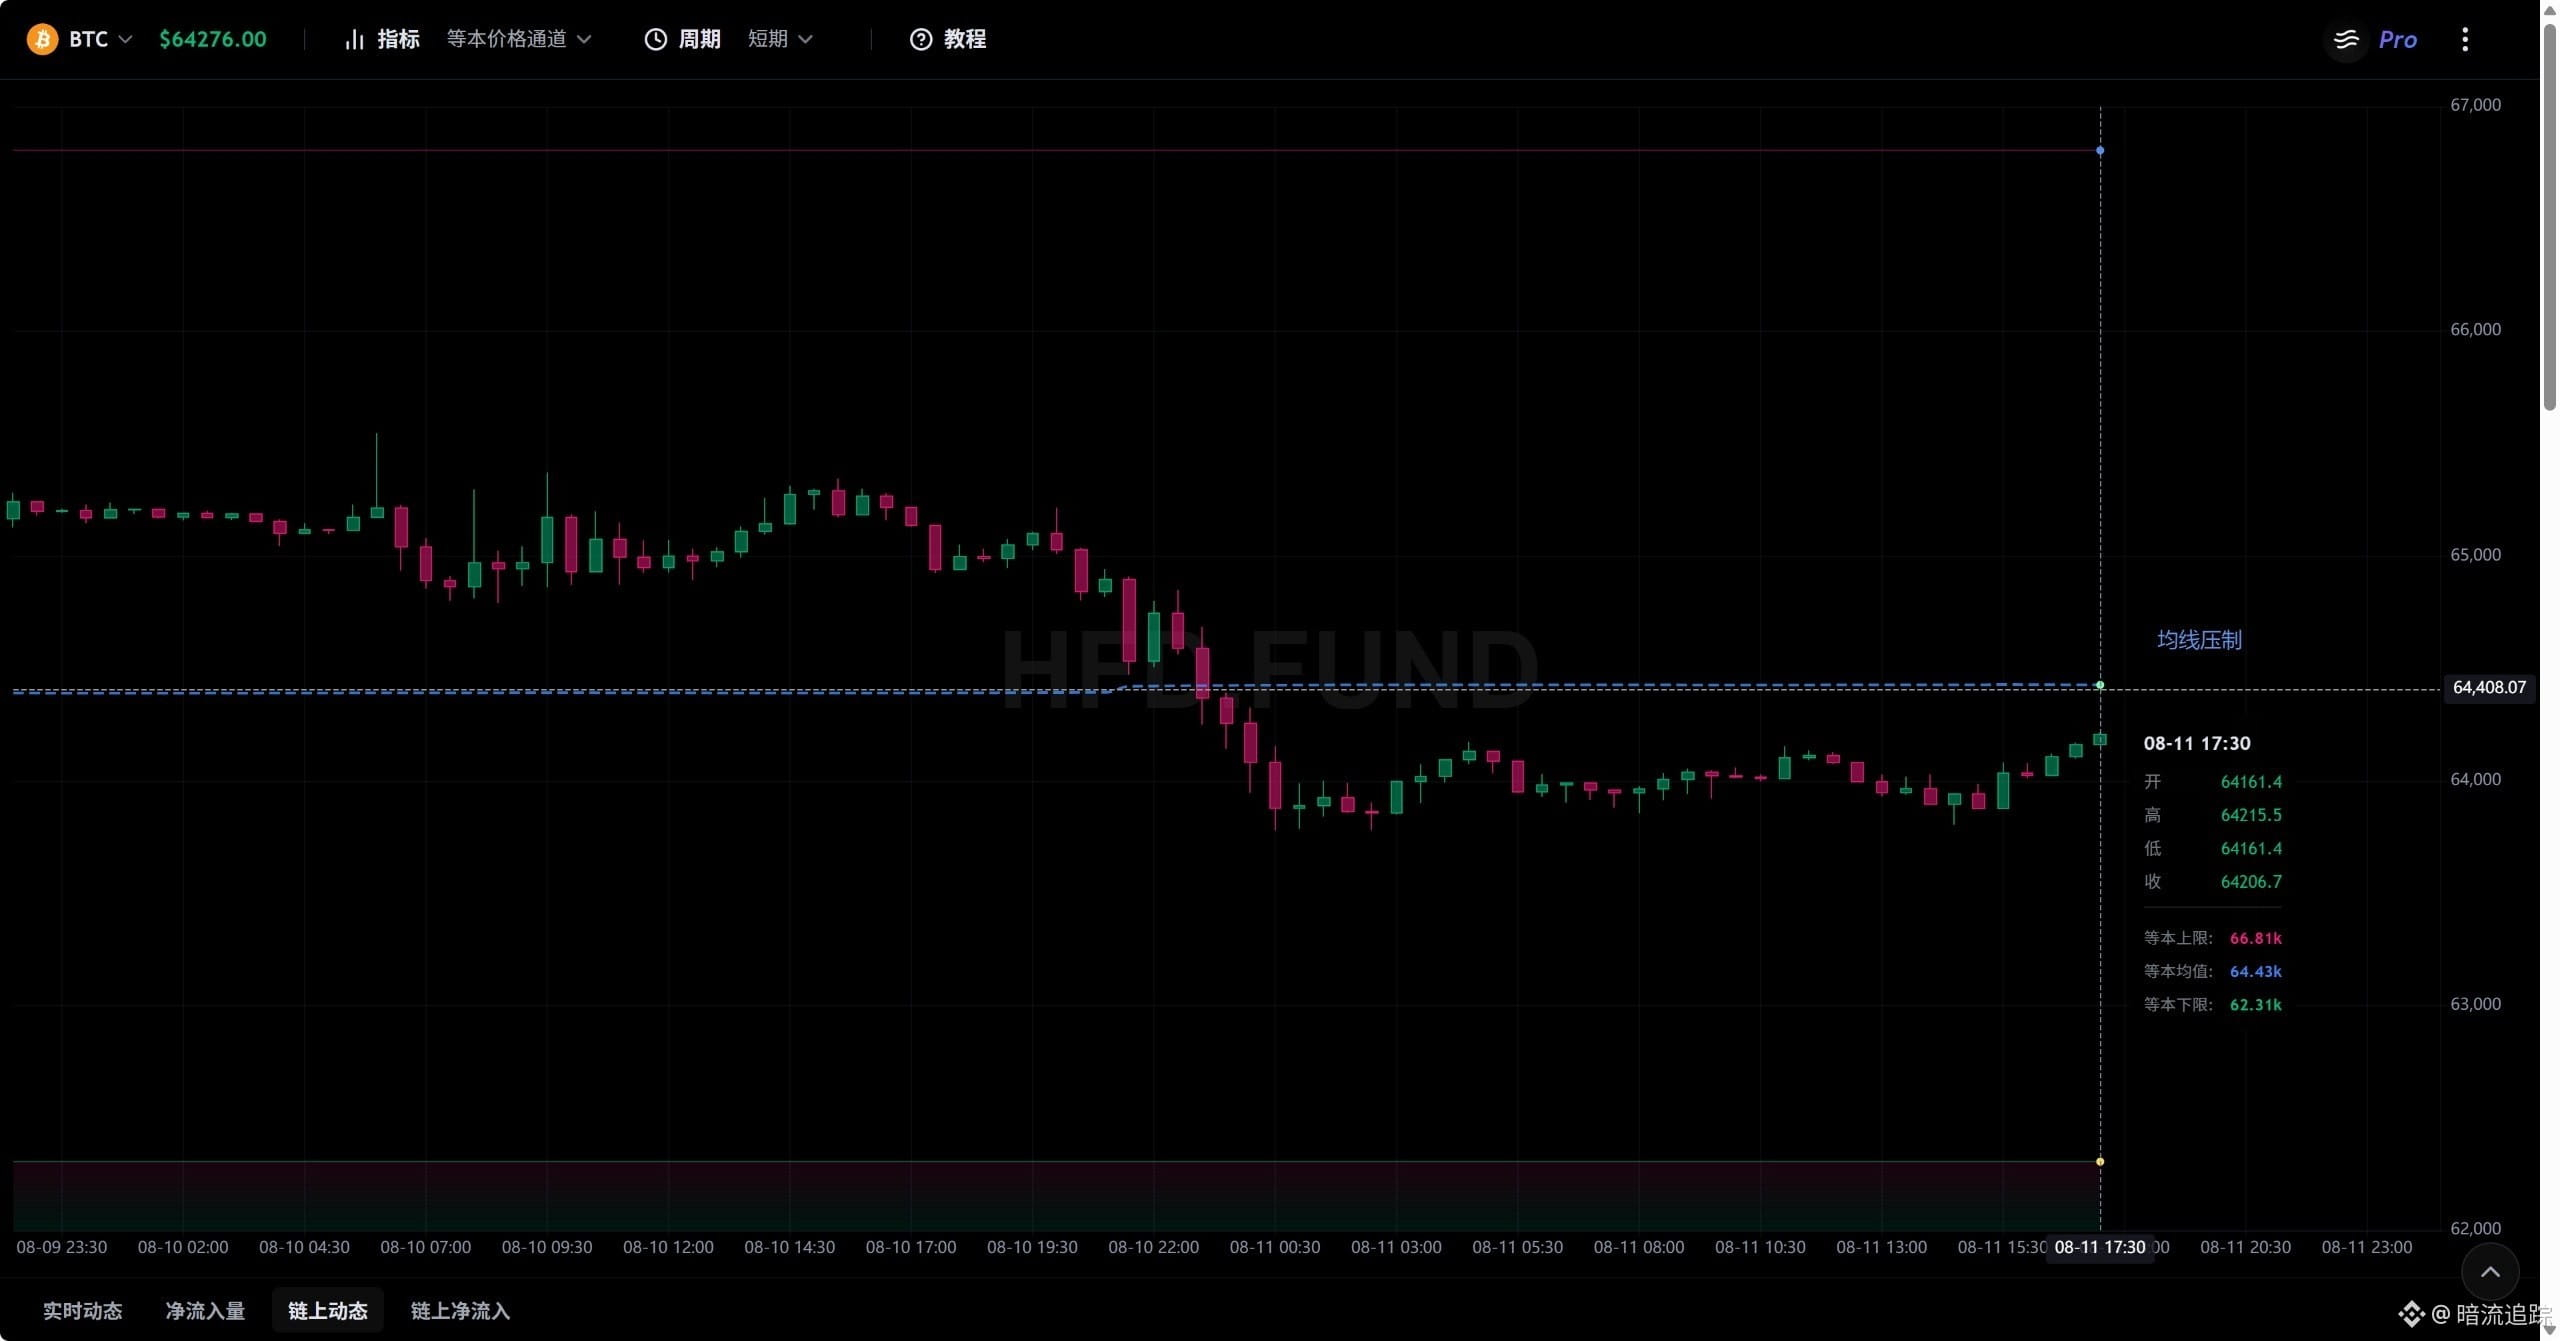
Price channel
Equal short-term average price: 63,660; upper bound: 70,090; lower bound: 58,260.
Equal mid-term average price: 63,900; upper bound: 67,260; lower bound: 59,360.
Equal long-term average price: 69,590; upper bound: 93,760; lower bound: 59,160.
Based on this indicator, the current price has fallen to near the average price. The average price has started to provide support to the price. This also suggests that the market has returned to a price level recognized as a standard by institutions. As institutions move their average price downward, that average continues to support the price. Therefore, we can judge that the current price is still standing above the average price due to average-based support. The upward trend has not been broken; we expect consolidation above 63,900, and after it stabilizes, look for the target level at 67,260.
Equal last/this-term short-term average: 64,430; upper bound: 66,810; lower bound: 62,310.
Equal last/this-term mid-term average: 63,790; upper bound: 66,810; lower bound: 58,360.
Equal last/this-term long-term average: 64,080; upper bound: 65,200; lower bound: 62,500.
Based on this indicator, the current price has also fallen to around the average price. The mid- and long-term averages form support, while the short-term average acts as resistance. So we should watch for consolidation between 63,790–64,430.
Taking the two indicators together, the price is still being supported by the moving averages across different timeframes that are relatively aligned. For now, it is consolidating in the 64,000–64,400 range.
Volume-Price Order Block
Short-term accumulation is continuing to place buy orders higher, from 36,810–64,140, with buy orders placed progressively upward. This suggests that the trend is stabilizing from the bottom and beginning to consolidate upward.
Mid-term accumulation buy orders at 63,963–63,856 are temporarily becoming support and have not been broken through yet.
Based on this indicator, the short-term trend is upward. However, due to the draw/influence of mid-term accumulation buy orders…
Following the previous discussion, the earlier decline is temporarily over; we will first look for a bottoming out, with a modest rebound.
Future price scenarios:
Due to the impact of a short-term bullish push, the price may rebound as high as around 64,430. When it meets resistance, it will likely fall back again and then range-trade in the 63,700–64,000 zone.
Previous scenario:
The trend is downward. We expect it may drop toward the 64,300 average price area, and then fluctuate around this level to find direction.
Since mid-term accumulation (buying) is about to begin, take note: if 64,300 is broken and the price cannot quickly reclaim it, the bearish outlook could target the 64,000–63,700 area.
Actual price action:
The lowest point dropped to 63,779, then it began to move upward in consolidation, and it is now around 64,100.
Future price action:
Trading volume vacuum
With a short-term bullish offensive, the defense line is 64,012–63,980. In the short term, the trend is shifting from bearish pressure to bullish pressure, which also indicates that the decline has paused and consolidation has begun.
For the mid-term and long-term, we still expect consolidation, with no new actions.
Price channel
Equal short-term average price: 63,660; upper bound: 70,090; lower bound: 58,260.
Equal mid-term average price: 63,900; upper bound: 67,260; lower bound: 59,360.
Equal long-term average price: 69,590; upper bound: 93,760; lower bound: 59,160.
Based on this indicator, the current price has fallen to near the average price. The average price has started to provide support to the price. This also suggests that the market has returned to a price level recognized as a standard by institutions. As institutions move their average price downward, that average continues to support the price. Therefore, we can judge that the current price is still standing above the average price due to average-based support. The upward trend has not been broken; we expect consolidation above 63,900, and after it stabilizes, look for the target level at 67,260.
Equal last/this-term short-term average: 64,430; upper bound: 66,810; lower bound: 62,310.
Equal last/this-term mid-term average: 63,790; upper bound: 66,810; lower bound: 58,360.
Equal last/this-term long-term average: 64,080; upper bound: 65,200; lower bound: 62,500.
Based on this indicator, the current price has also fallen to around the average price. The mid- and long-term averages form support, while the short-term average acts as resistance. So we should watch for consolidation between 63,790–64,430.
Taking the two indicators together, the price is still being supported by the moving averages across different timeframes that are relatively aligned. For now, it is consolidating in the 64,000–64,400 range.
Volume-Price Order Block
Short-term accumulation is continuing to place buy orders higher, from 36,810–64,140, with buy orders placed progressively upward. This suggests that the trend is stabilizing from the bottom and beginning to consolidate upward.
Mid-term accumulation buy orders at 63,963–63,856 are temporarily becoming support and have not been broken through yet.
Based on this indicator, the short-term trend is upward. However, due to the draw/influence of mid-term accumulation buy orders…
Summary:
Building on the previous section: what was said before is that the pullback has ended and there will be a period of upward movement.
Subsequent price projection:
Due to the order block being distributed, the price may consolidate between 65640 and 64979, with the possibility of piercing above 65640.
After breaking through, because of heavier selling pressure, the price may fall below 64979 again, with the deepest pullback temporarily seen around 64752.
Previous projection:
Because the price is constrained by 64950, and also due to heavier historical sell pressure and distributed sell orders, it will pull back to around 64300 to look for support.
Actual price movement:
The low reached between 64600 and 64400, then it started to rebound.
Precisely because of this rebound, the pullback trend we saw earlier has ended.
Next outlook:
Chip (position) vacuum
In the short term, the market shifts from a bearish attack to a bullish attack. The defensive zone is 65062–64982. In addition, the short-term bearish attack mentioned in the previous section has been refilled, and the bearish trend has ended.
In the mid-term, the bearish attack has been refilled as well. At the moment, no bullish attack is clearly seen, so expect consolidation for now.
In the long term, it is still the bullish attack mentioned above. The defensive zone is 64752–64437. The price is consistently supported/held up by this zone, and pullbacks are not large. Continue to look for an uptrend.
Short- and long-term: bullish trend. Mid-term: bearish trend has ended and consolidation begins. The latest defensive zones are 65062–64982 and 64752–64437.
Price channel
Equal short-term average: 64010. Upper limit: 71700. Lower limit: 58260.
Equal mid-term average: 63830. Upper limit: 67260. Lower limit: 59360.
Equal long-term average: 69800. Lower limit: 59160.
Based on this indicator, the current price is above the moving average. 63830 and 64010 provide support. For now, expect the trend to move upward.
The price is slightly higher than the institution’s average, but it has not topped out. You can look for the price to continue rising.
Equal short-term average on another measure: 64340. Upper limit: 66810. Lower limit: 62310.
Equal mid-term average: 63750. Upper limit: 66810. Lower limit: 58360.
Equal long-term average: 63960. Upper limit: 65200. Lower limit: 62500.
Based on this indicator, the current price is above the moving averages and the trend is upward. However, it has touched the long-term upper limit, so the price may be pressured back and could consolidate between 64340 and 65200.
综合两个指标来看:First, the price stands firm above each moving average, and the trend points upward.
The upper limit—specifically the equal mid-term upper limit that has been suppressing price increases—has been raised to 67260. Also, the original equal long-term upper limit has been forced upward to 65200, forming a new suppression point.
Therefore, it is quite possible that the price continues upward to seek the 67260 suppression level.
Building on the previous section: what was said before is that the pullback has ended and there will be a period of upward movement.
Subsequent price projection:
Due to the order block being distributed, the price may consolidate between 65640 and 64979, with the possibility of piercing above 65640.
After breaking through, because of heavier selling pressure, the price may fall below 64979 again, with the deepest pullback temporarily seen around 64752.
Previous projection:
Because the price is constrained by 64950, and also due to heavier historical sell pressure and distributed sell orders, it will pull back to around 64300 to look for support.
Actual price movement:
The low reached between 64600 and 64400, then it started to rebound.
Precisely because of this rebound, the pullback trend we saw earlier has ended.
Next outlook:
Chip (position) vacuum
In the short term, the market shifts from a bearish attack to a bullish attack. The defensive zone is 65062–64982. In addition, the short-term bearish attack mentioned in the previous section has been refilled, and the bearish trend has ended.
In the mid-term, the bearish attack has been refilled as well. At the moment, no bullish attack is clearly seen, so expect consolidation for now.
In the long term, it is still the bullish attack mentioned above. The defensive zone is 64752–64437. The price is consistently supported/held up by this zone, and pullbacks are not large. Continue to look for an uptrend.
Short- and long-term: bullish trend. Mid-term: bearish trend has ended and consolidation begins. The latest defensive zones are 65062–64982 and 64752–64437.
Price channel
Equal short-term average: 64010. Upper limit: 71700. Lower limit: 58260.
Equal mid-term average: 63830. Upper limit: 67260. Lower limit: 59360.
Equal long-term average: 69800. Lower limit: 59160.
Based on this indicator, the current price is above the moving average. 63830 and 64010 provide support. For now, expect the trend to move upward.
The price is slightly higher than the institution’s average, but it has not topped out. You can look for the price to continue rising.
Equal short-term average on another measure: 64340. Upper limit: 66810. Lower limit: 62310.
Equal mid-term average: 63750. Upper limit: 66810. Lower limit: 58360.
Equal long-term average: 63960. Upper limit: 65200. Lower limit: 62500.
Based on this indicator, the current price is above the moving averages and the trend is upward. However, it has touched the long-term upper limit, so the price may be pressured back and could consolidate between 64340 and 65200.
综合两个指标来看:First, the price stands firm above each moving average, and the trend points upward.
The upper limit—specifically the equal mid-term upper limit that has been suppressing price increases—has been raised to 67260. Also, the original equal long-term upper limit has been forced upward to 65200, forming a new suppression point.
Therefore, it is quite possible that the price continues upward to seek the 67260 suppression level.
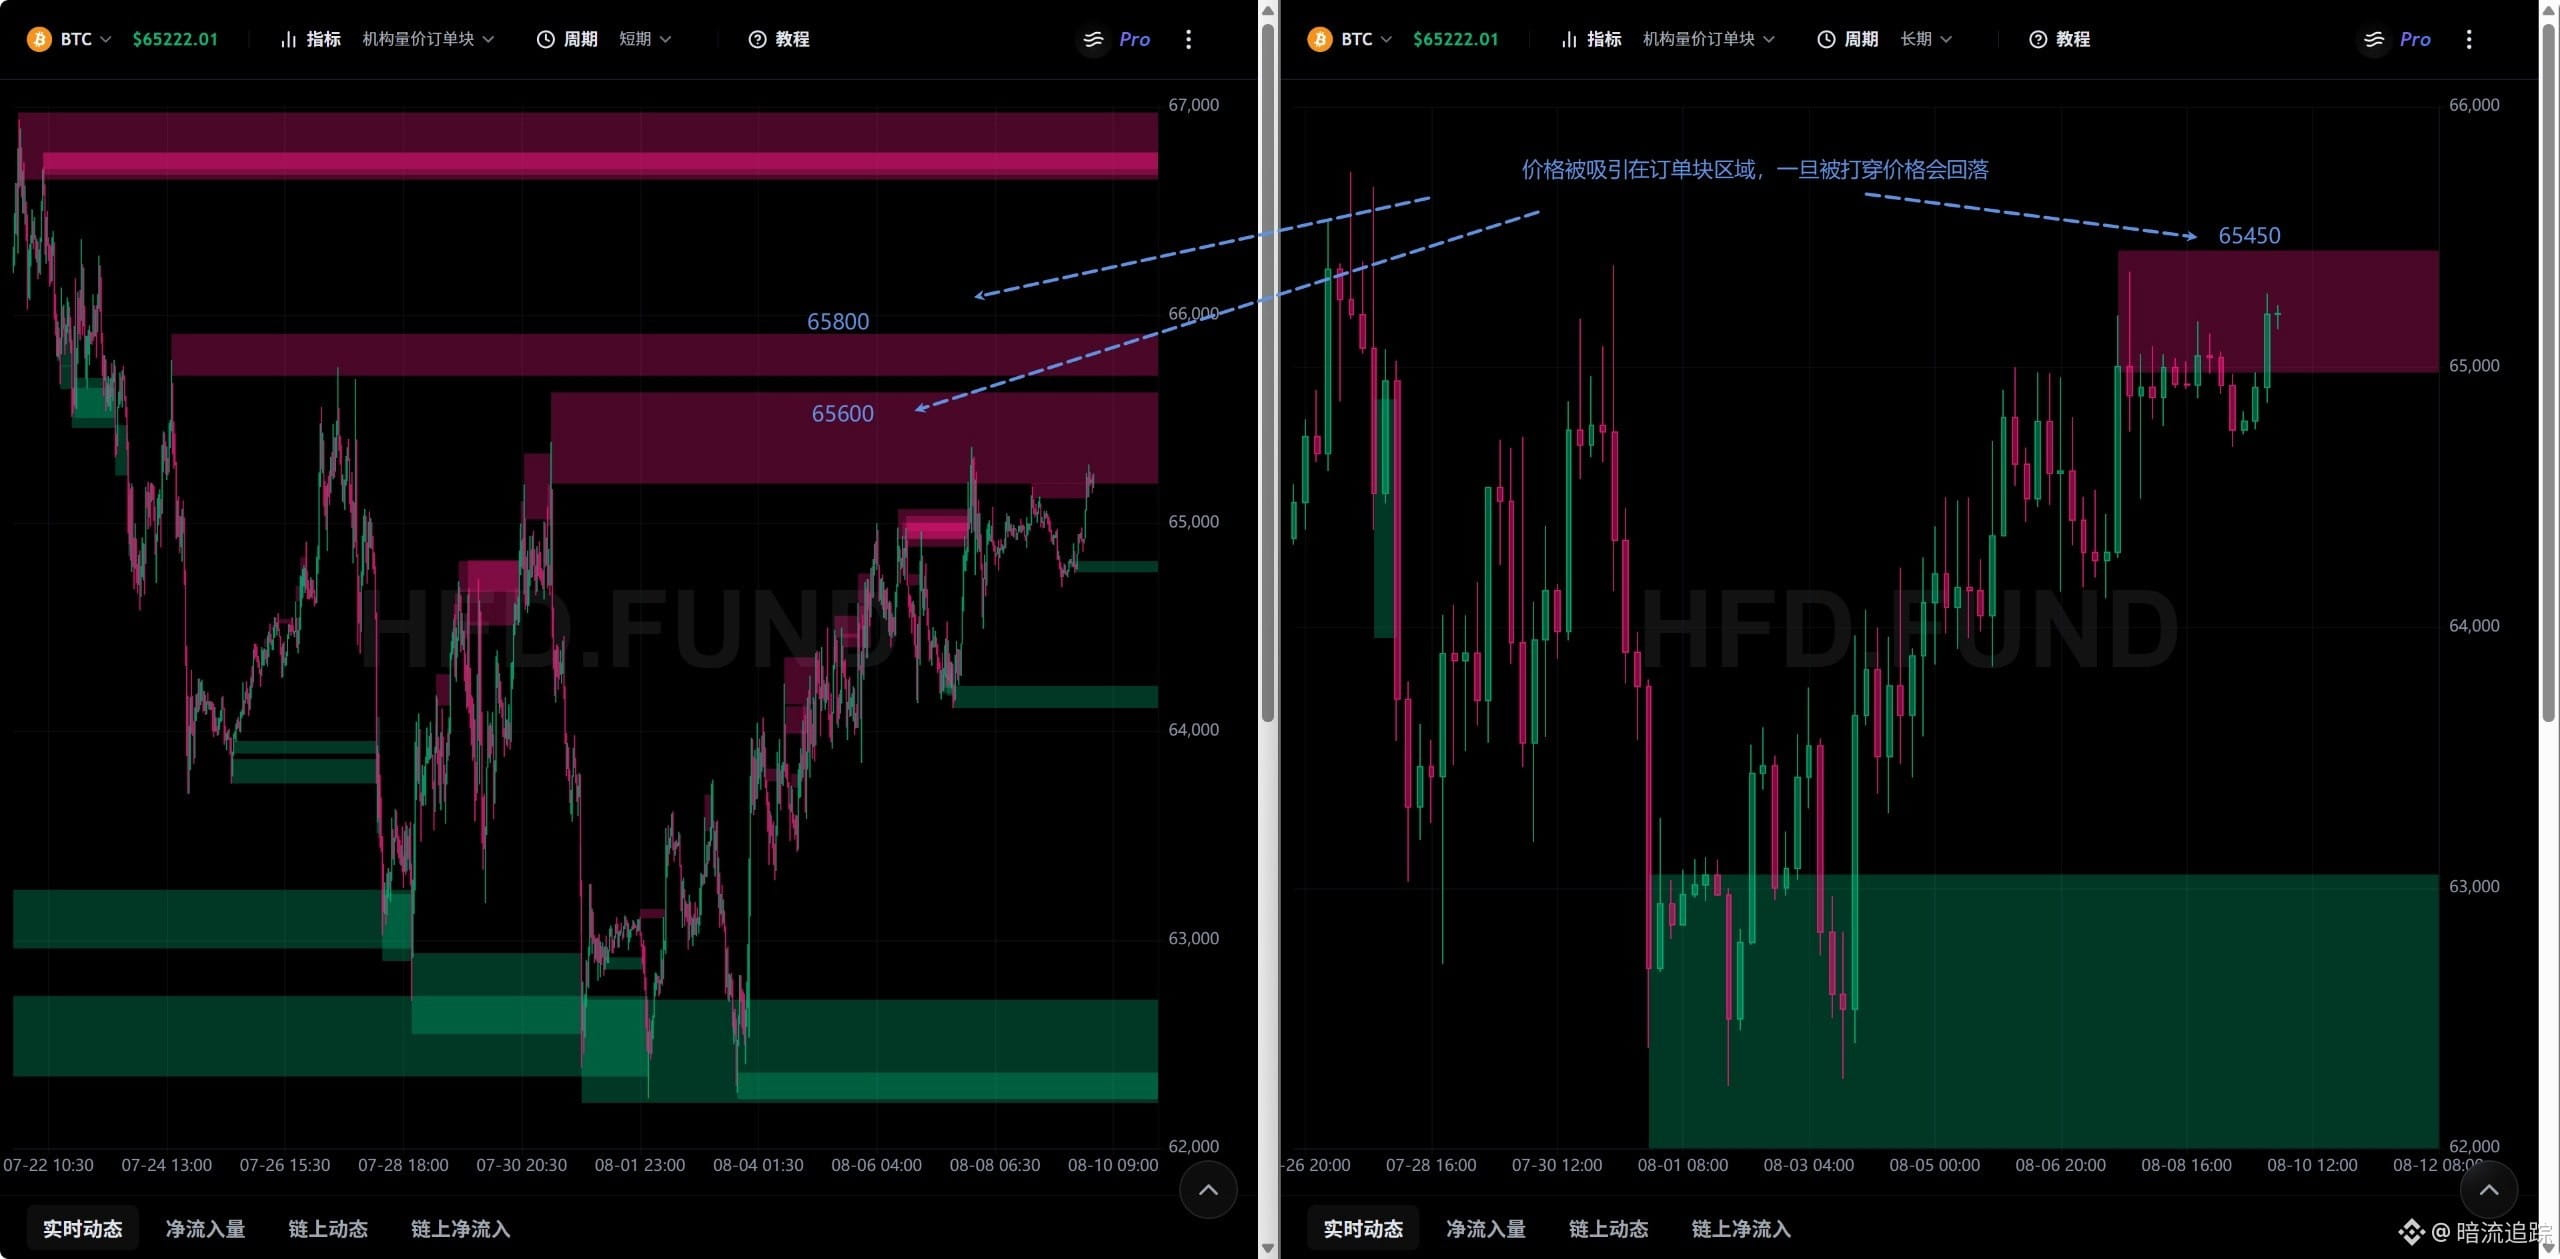
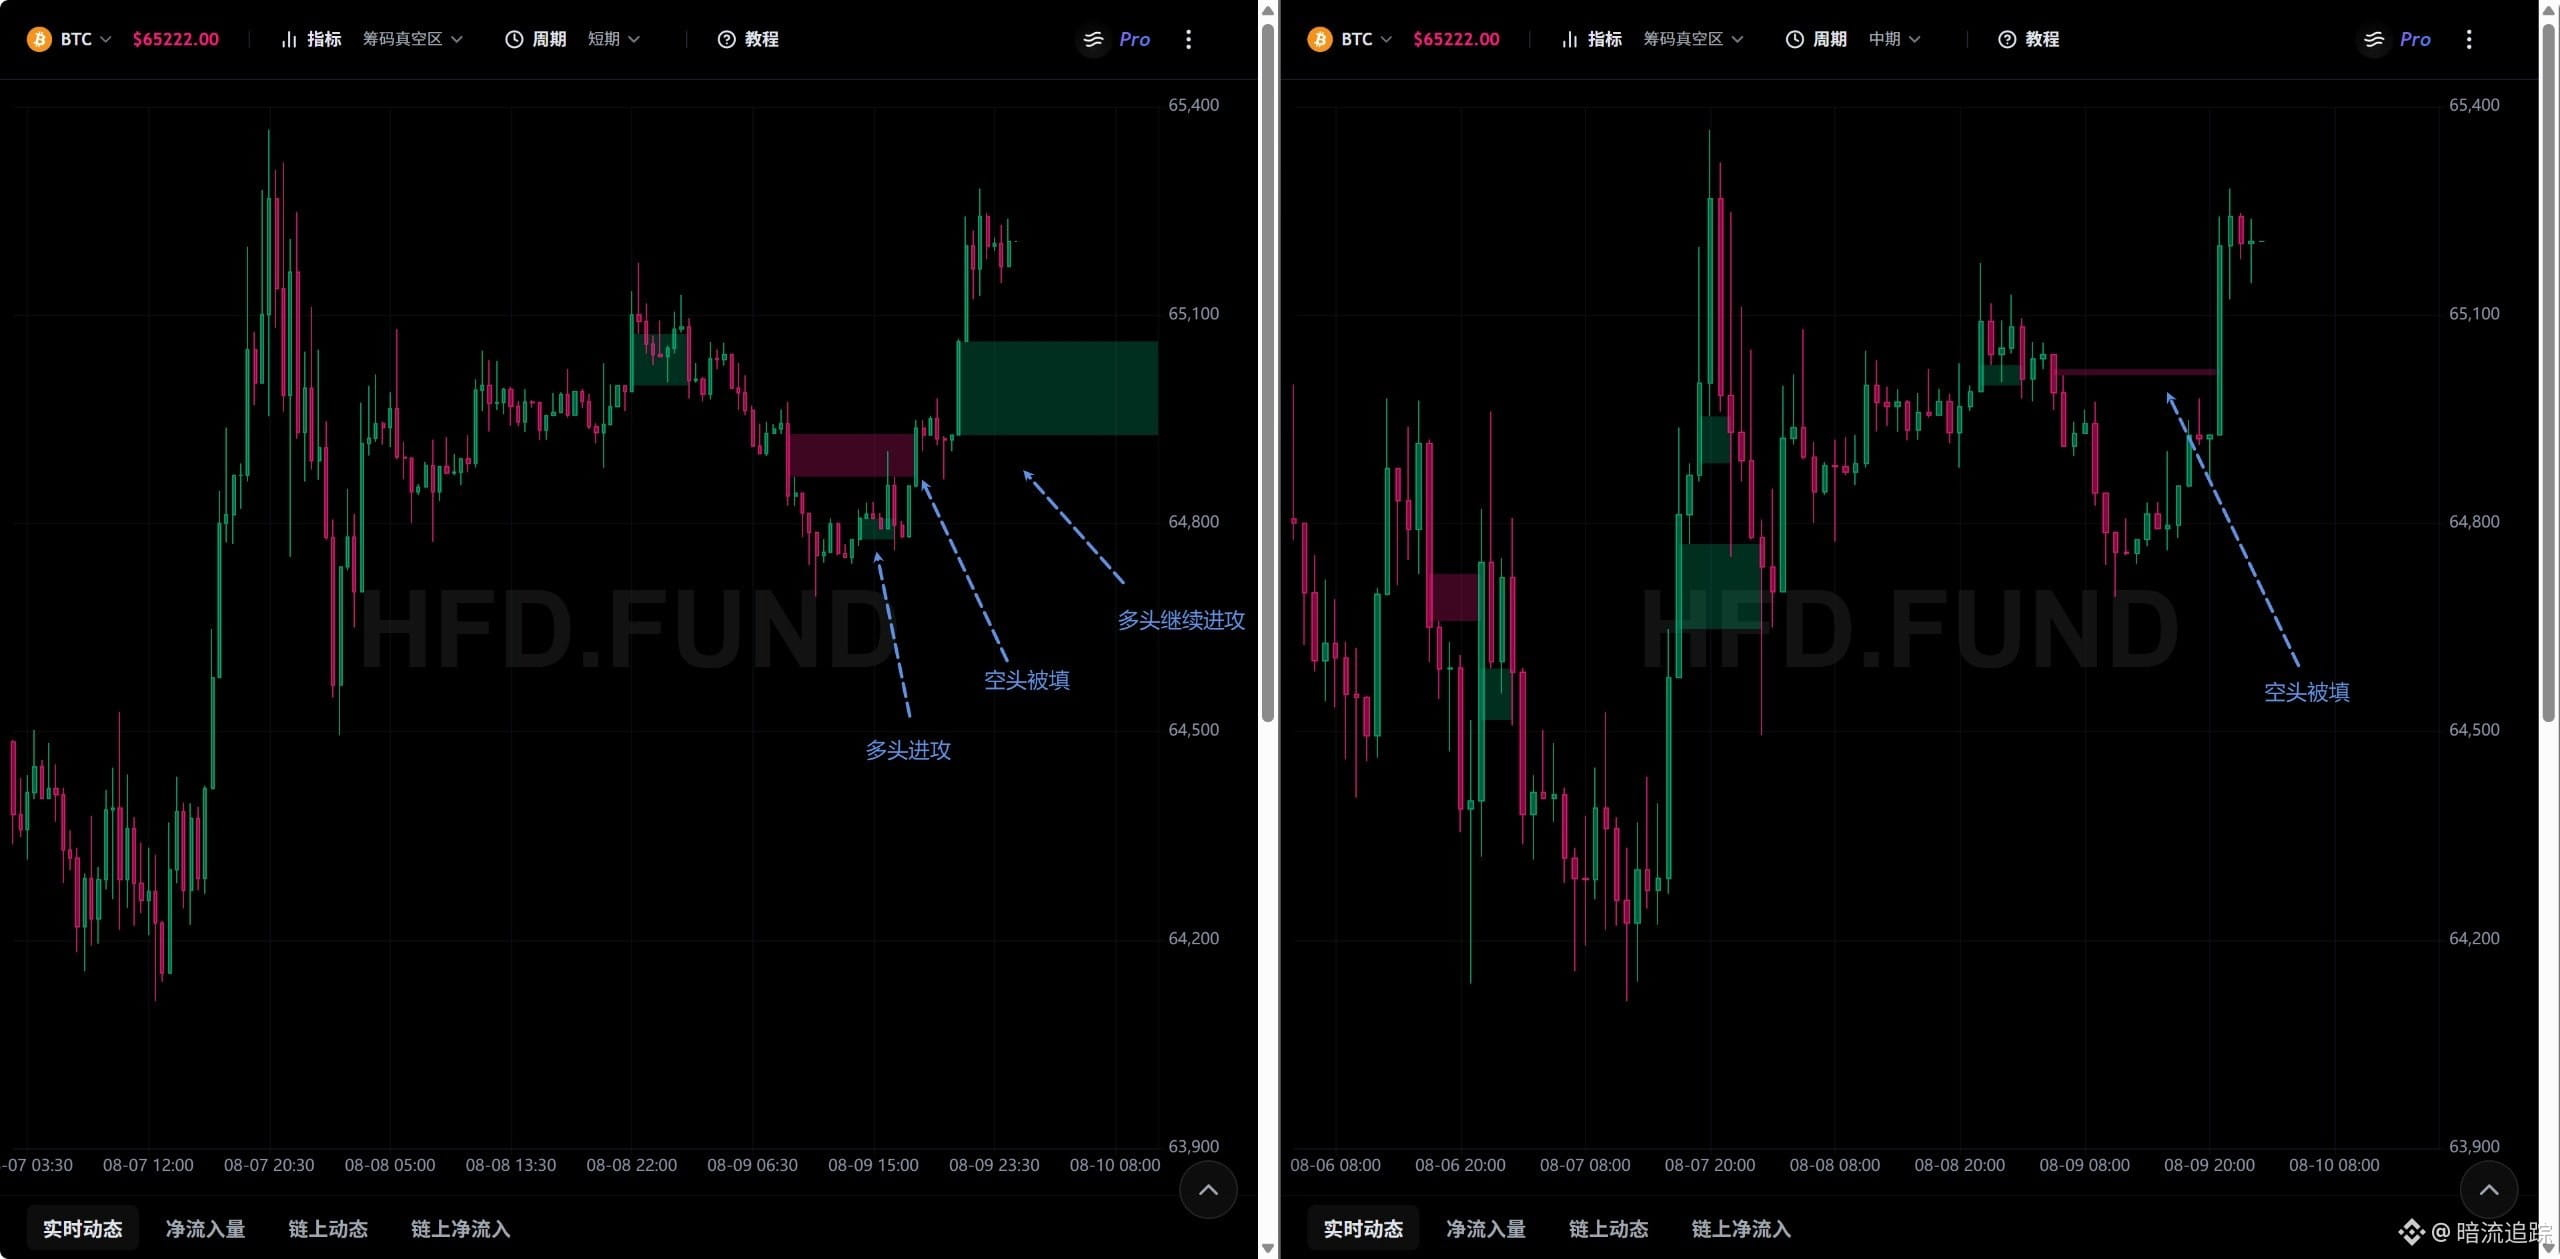
Summary:
Building on the previous discussion, the current trend is in a phase of consolidation and pullback after an upward move, with a slight retracement likely.
Future price projection:
Price is being capped by 64,950. Combined with heavier historical sell pressure and dispatched sell orders, it is expected to pull back to around 64,300 to look for support.
Previous price projection:
Price would test support near 64,500. If it breaks, it would move down to 64,300, with the deepest needle potentially dipping into the 63,900–64,000 area.
Actual price action:
Starting around 64,970, price fell steadily to around 64,100, where the decline halted, followed by a rebound.
Outlook:
Chip/order vacuum
In the short term, expect consolidation; in the medium term, a bullish push.
However, the first line of defense at 64,951–64,885 has been filled. It is now testing the second line of defense at 64,769–64,653.
The long-term bullish push defense lines are at 64,752–64,437.
Overall, the trend in both the short-to-long term remains a bullish push. Effective support/resistance lies at 64,437–64,752, though there may be some backfilling.
Price channel
Equal-quantity short-term average: 64,130; upper limit 71,700; lower limit 58,260.
Equal-quantity medium-term average: 63,830; upper limit 67,260; lower limit 59,360.
Equal-quantity long-term average: 69,800; lower limit 59,160.
According to these indicators, the current average price is slightly lifted. Price is still above the averages; 63,830 and 64,130 provide support. For now, the trend is expected to turn upward.
Equal-quantity short-term average: 64,330; upper limit 66,810; lower limit 62,310.
Equal-quantity medium-term average: 63,690; upper limit 66,810; lower limit 58,360.
Equal-quantity long-term average: 63,800; upper limit 64,950; lower limit 62,500.
These indicators suggest price is above the moving averages, implying an upward trend. However, it has touched the long-term upper limit; likely it will be pushed back to consolidate around the nearby support at 64,330.
Combined view of the two indicators:
Overall, the trend still leans upward. But due to the cap from the long-term upper limit at 64,950, price has not been able to break through. Since it has already touched 64,950, it may pull back and consolidate around 64,300.
Institutional volume-price order blocks
For the short term, the most recent sell orders have all been penetrated. Price has now reached the historical sell orders between 65,634–65,185.
For the medium term, the latest sell orders are 65,540–65,256.
For the long term, the latest sell orders are 65,459–65,000.
Currently, because price has hit a relatively large sell order area, it is being pushed back from the highs. Meanwhile, there are temporarily no notable sell orders below. Overall, it still looks favorable that price will gradually be pulled back into the 65,000–65,600 zone and ultimately break through 65,600.
Building on the previous discussion, the current trend is in a phase of consolidation and pullback after an upward move, with a slight retracement likely.
Future price projection:
Price is being capped by 64,950. Combined with heavier historical sell pressure and dispatched sell orders, it is expected to pull back to around 64,300 to look for support.
Previous price projection:
Price would test support near 64,500. If it breaks, it would move down to 64,300, with the deepest needle potentially dipping into the 63,900–64,000 area.
Actual price action:
Starting around 64,970, price fell steadily to around 64,100, where the decline halted, followed by a rebound.
Outlook:
Chip/order vacuum
In the short term, expect consolidation; in the medium term, a bullish push.
However, the first line of defense at 64,951–64,885 has been filled. It is now testing the second line of defense at 64,769–64,653.
The long-term bullish push defense lines are at 64,752–64,437.
Overall, the trend in both the short-to-long term remains a bullish push. Effective support/resistance lies at 64,437–64,752, though there may be some backfilling.
Price channel
Equal-quantity short-term average: 64,130; upper limit 71,700; lower limit 58,260.
Equal-quantity medium-term average: 63,830; upper limit 67,260; lower limit 59,360.
Equal-quantity long-term average: 69,800; lower limit 59,160.
According to these indicators, the current average price is slightly lifted. Price is still above the averages; 63,830 and 64,130 provide support. For now, the trend is expected to turn upward.
Equal-quantity short-term average: 64,330; upper limit 66,810; lower limit 62,310.
Equal-quantity medium-term average: 63,690; upper limit 66,810; lower limit 58,360.
Equal-quantity long-term average: 63,800; upper limit 64,950; lower limit 62,500.
These indicators suggest price is above the moving averages, implying an upward trend. However, it has touched the long-term upper limit; likely it will be pushed back to consolidate around the nearby support at 64,330.
Combined view of the two indicators:
Overall, the trend still leans upward. But due to the cap from the long-term upper limit at 64,950, price has not been able to break through. Since it has already touched 64,950, it may pull back and consolidate around 64,300.
Institutional volume-price order blocks
For the short term, the most recent sell orders have all been penetrated. Price has now reached the historical sell orders between 65,634–65,185.
For the medium term, the latest sell orders are 65,540–65,256.
For the long term, the latest sell orders are 65,459–65,000.
Currently, because price has hit a relatively large sell order area, it is being pushed back from the highs. Meanwhile, there are temporarily no notable sell orders below. Overall, it still looks favorable that price will gradually be pulled back into the 65,000–65,600 zone and ultimately break through 65,600.
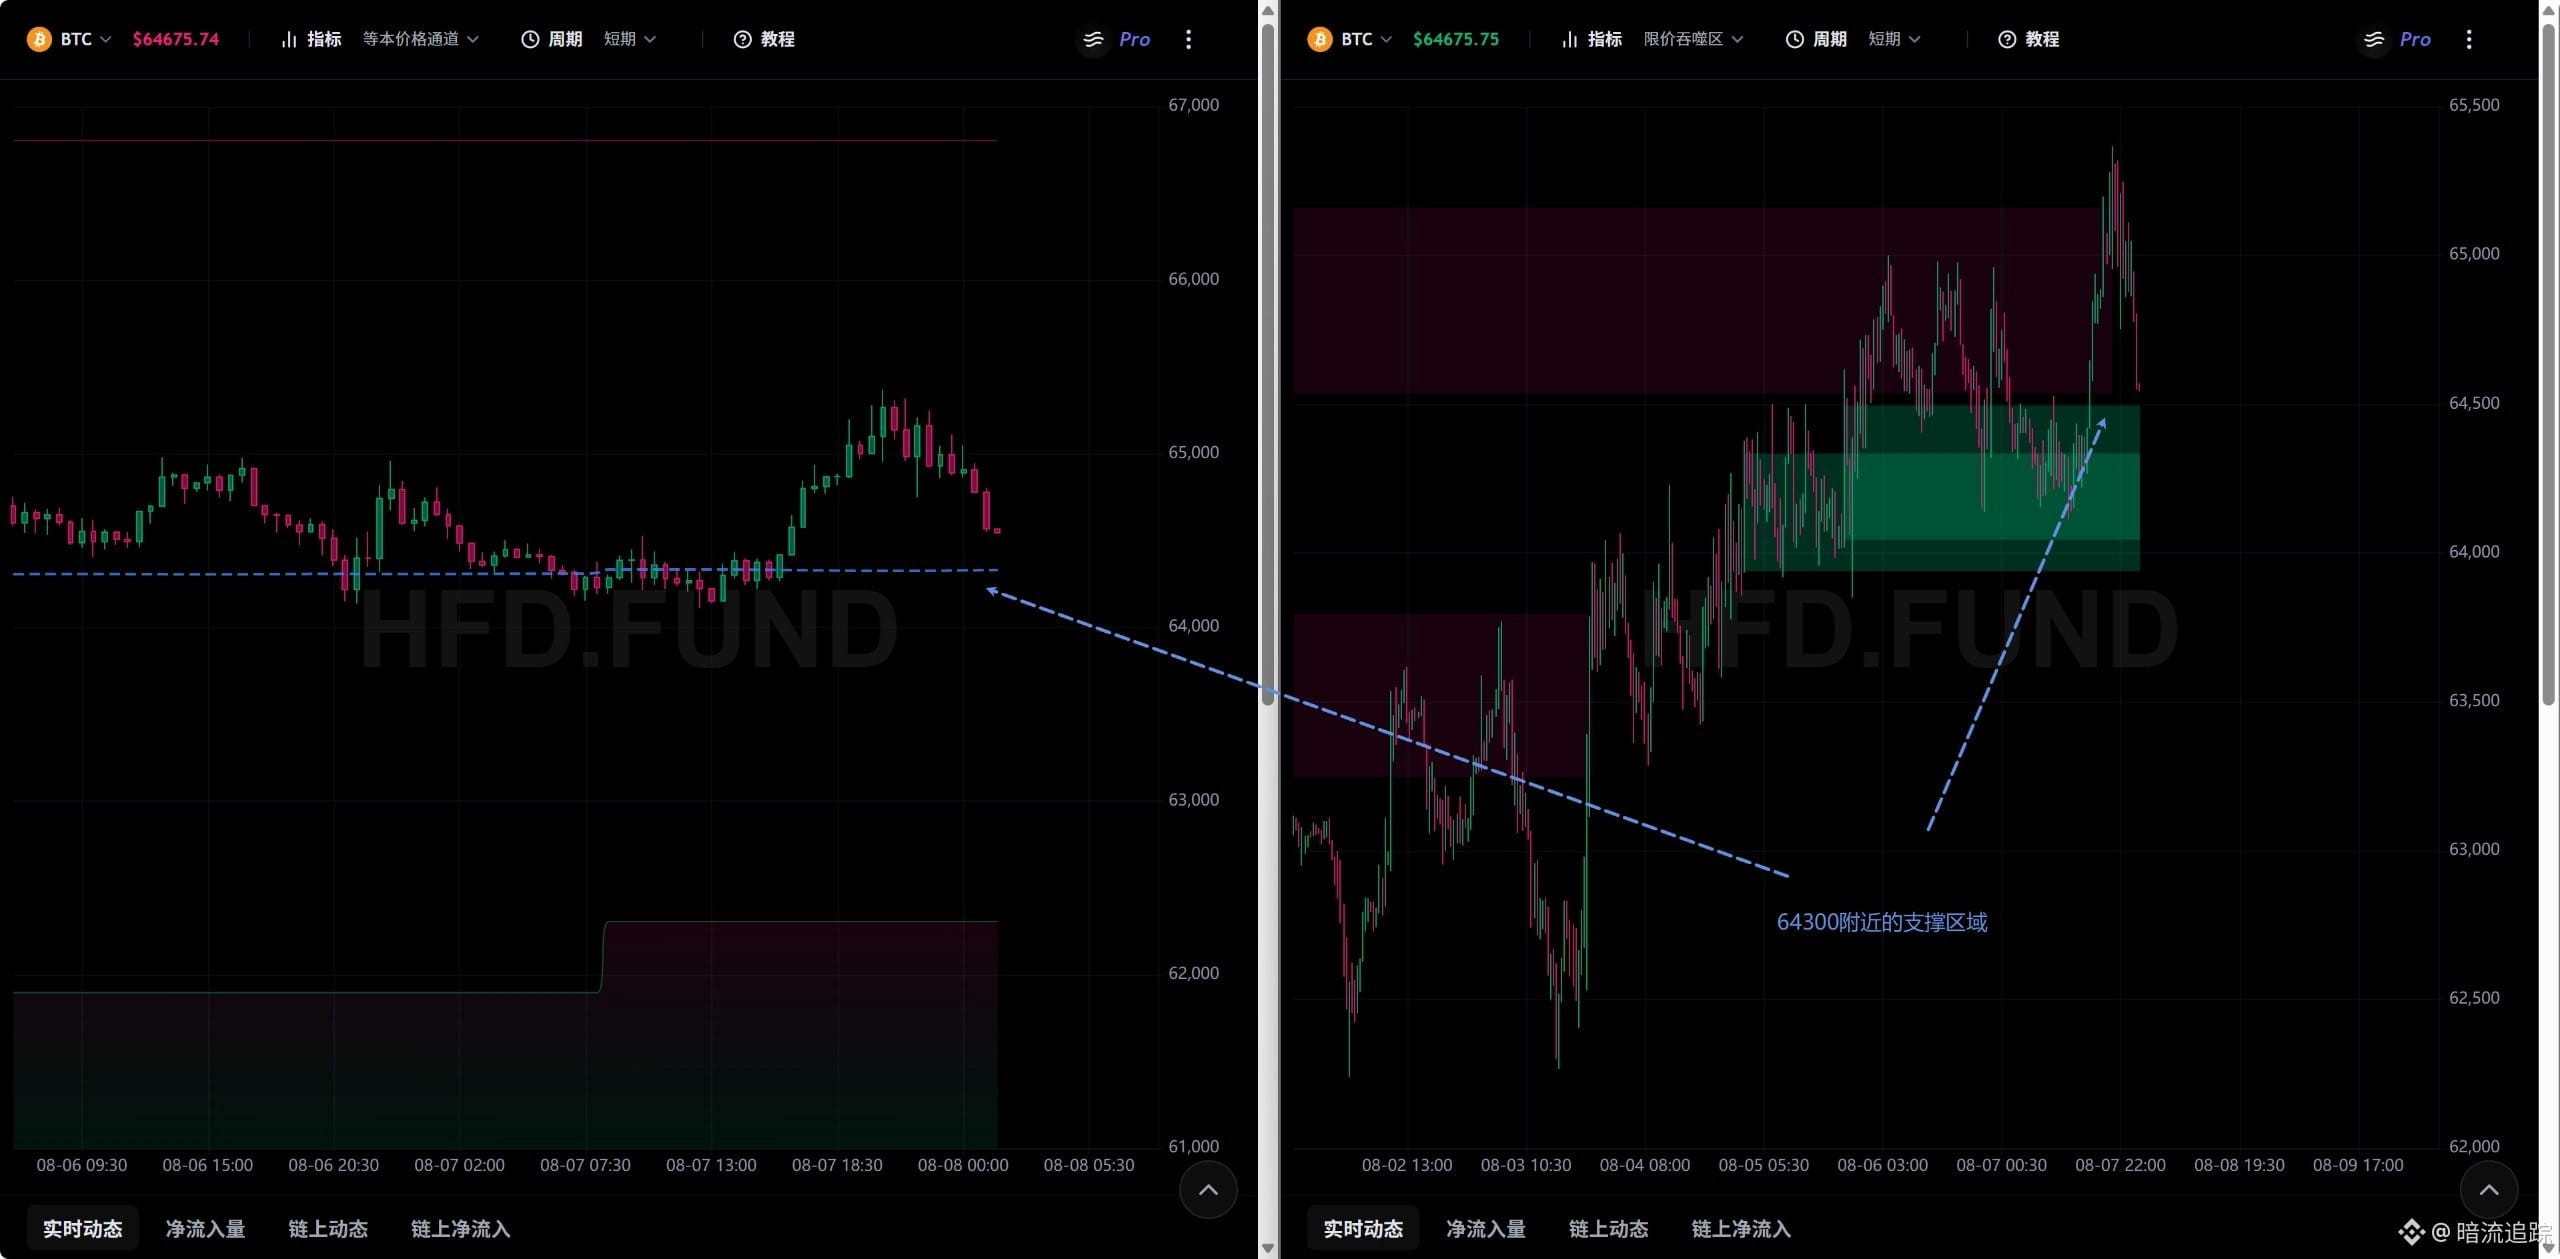
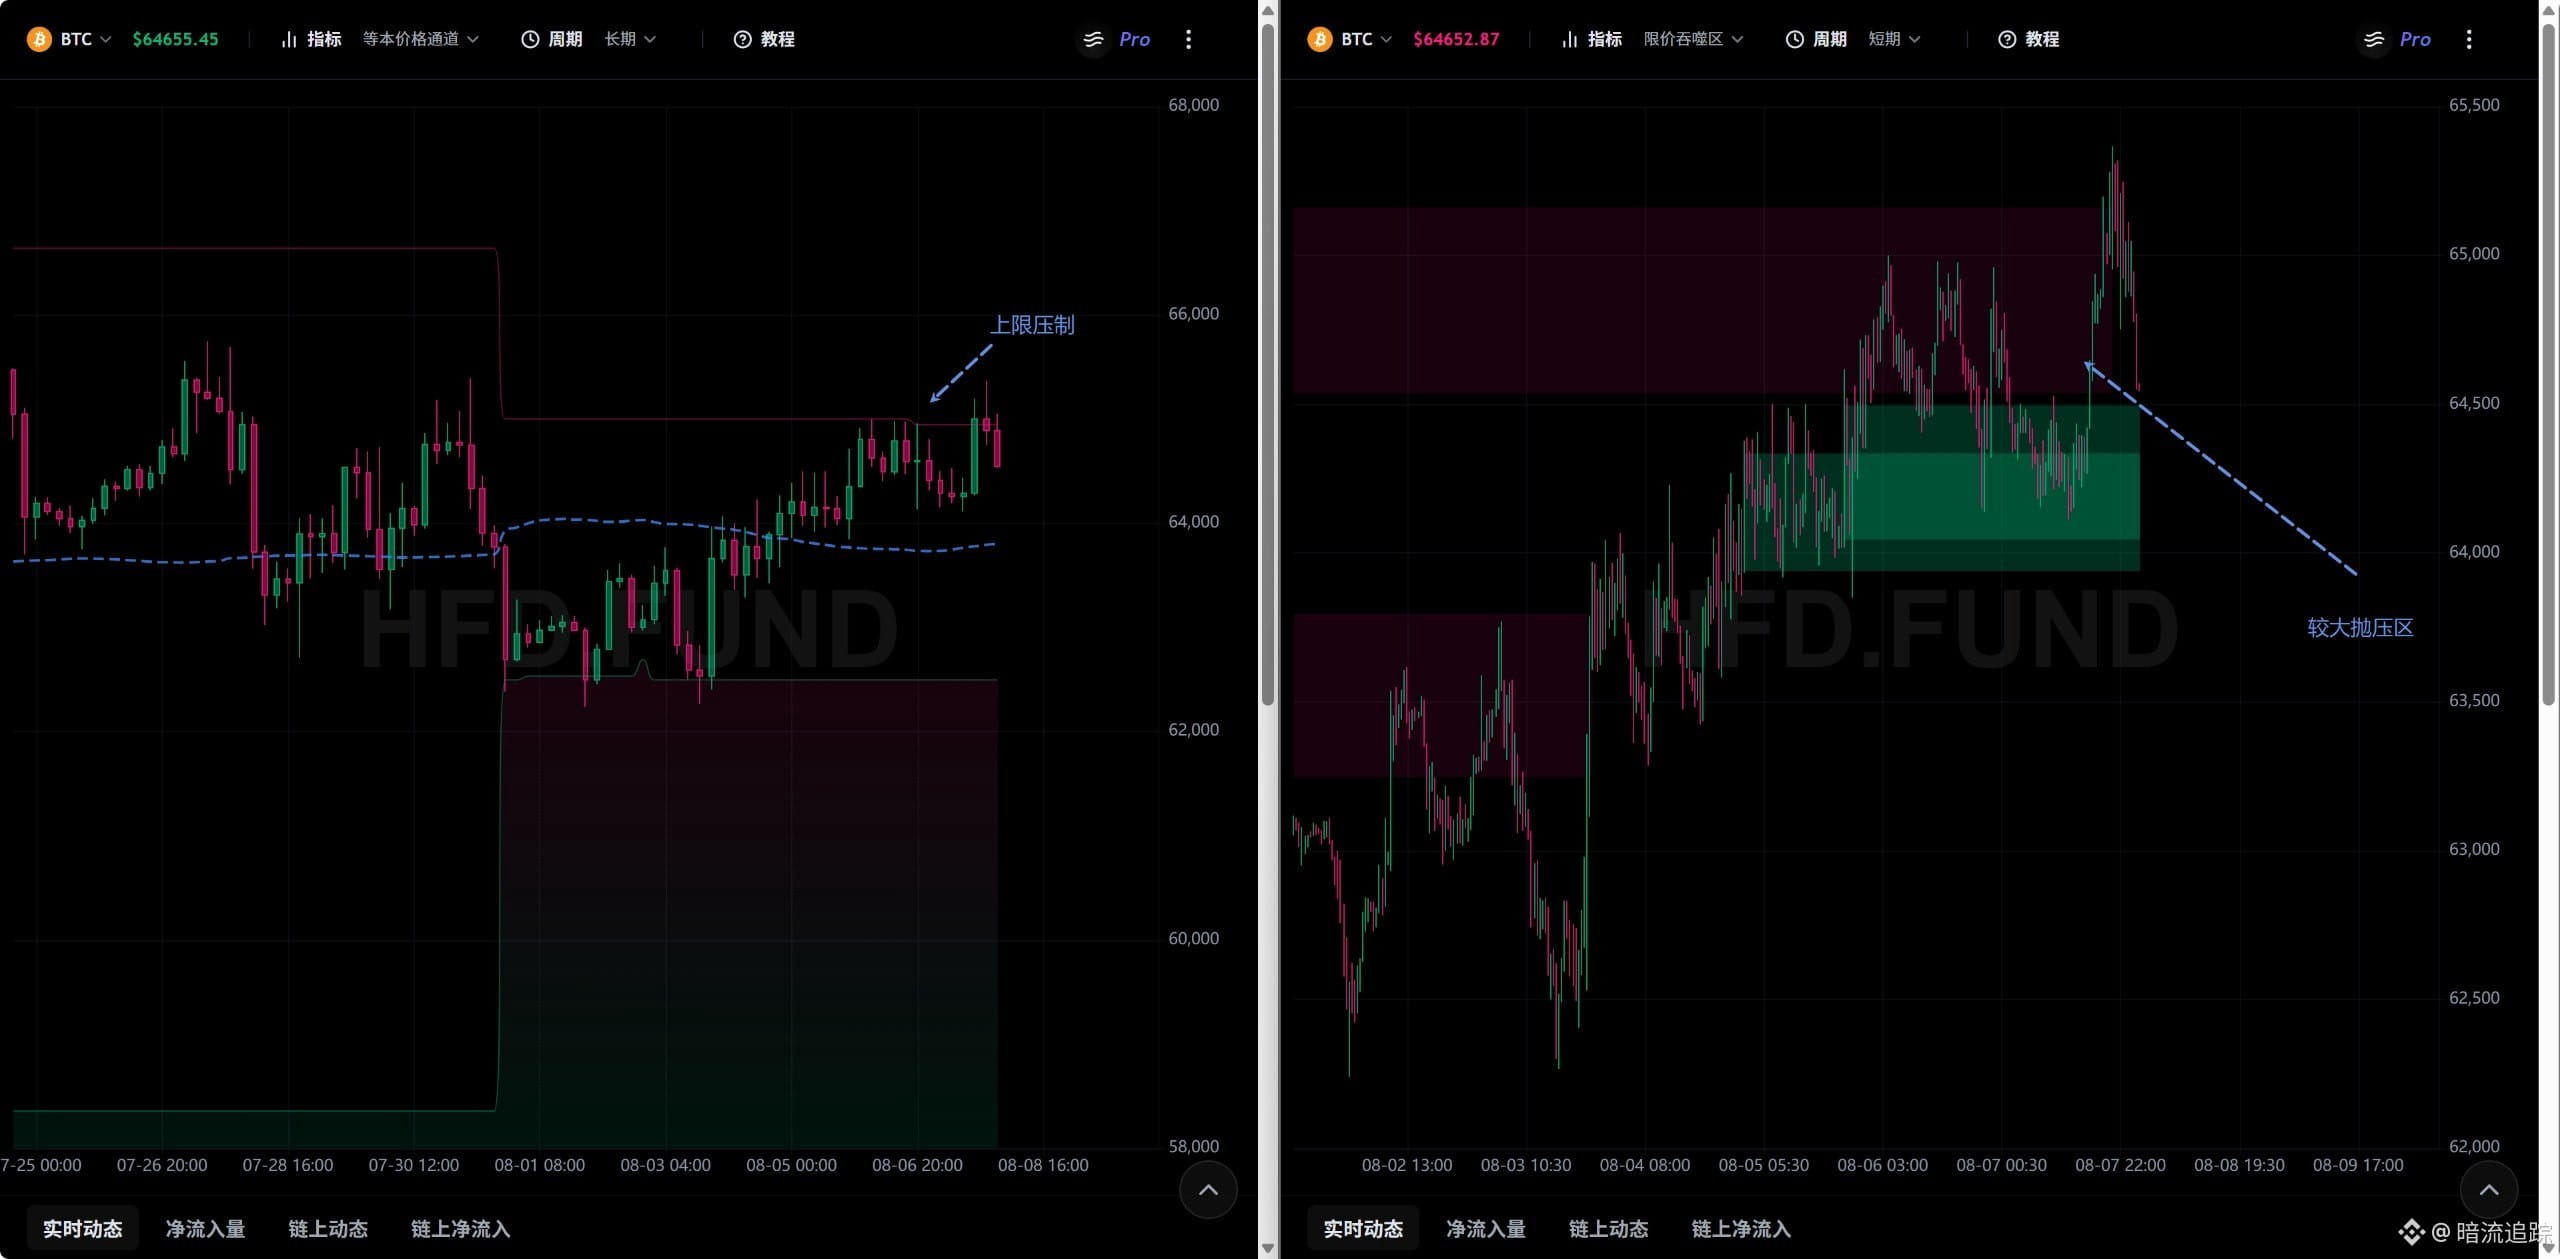
Summary:
Continuing from the previous section, the trend has shifted from rising to consolidating with a downward drift.
Next price projection:
Price will test support around 64,500. If it breaks, it will move to 64,300. The deepest wick could probe around 63,900–64,000.
Previous price projection:
Price was expected to move upward. The first target was to break through 64,761, followed by breaking through 64,843. The selling pressure encountered at those levels would likely bring price back to 64,300 to find support, and then it would rise again. The extreme target could reach 65,167.
Actual price action:
Price hit and broke through the target on the first attempt, with the highest wick around 65,000.
Next price action:
Order-book “vacuum”
The short side has started an offensive in the near term, with the defensive zone at 64,660–64,700. Although this has been partially filled so far, the trend has changed: it has shifted from the previous upward move to sideways-to-downward consolidation.
In the medium term, the shorts are attacking 64,657–64,731, but they are subsequently filled by the longs, forming a long offensive. The defensive zone is 64,594–64,516. The trend rapidly flips from bearish to bullish. At present, the outlook favors a bullish offensive, but there is a very high probability of a pullback to 64,516. If this level is lost, we may see consolidation turning further downward.
Price channel
Equal near-term average: 64,090; upper limit: 71,700; lower limit: 58,260.
Equal medium-term average: 63,680; upper limit: 66,810; lower limit: 59,360.
Equal long-term average: 70,210; lower limit: 59,300.
Based on these indicators, the average has slightly risen. Price is currently above the averages. 63,680 and 64,090 provide support, and the near-term trend is still seen as upward.
Equal near-term average on “this basis”: 64,300; upper limit: 66,810; lower limit: 61,900.
Equal medium-term average on “this basis”: 63,670; upper limit: 66,810; lower limit: 58,310.
Equal long-term average on “this basis”: 63,700; upper limit: 64,950; lower limit: 62,690.
Based on this indicator set, price is currently above the moving averages, suggesting an upward trend. However, it has touched the long-term upper band; it may be pushed back to consolidate around 64,300. If 64,300 cannot hold, it may move toward the 63,600 area.
Combined view of the two indicators suggests price will pull back and consolidate around 64,300, potentially probing 64,090 and even 63,700.
Institutional volume-price order blocks
For the short and medium term, sell limit orders are stacked lower and with large volume, indicating that the bullish momentum is being pushed back.
Limit engulfing
This indicator shows no obvious change from the above, but the trend is completely opposite. In the prior section, the bullish offensive was not fully able to break through 64,545–65,167; instead, it was pushed back by the shorts and needs to be tested.
Near-term bullish offensive: 63,943–64,337 and 64,051–64,495.
Medium-term bullish offensive: 63,938–62,680.
Look for price to first test around 64,500 to find support. Most likely, this support will not hold, and price will test near 64,000.
Continuing from the previous section, the trend has shifted from rising to consolidating with a downward drift.
Next price projection:
Price will test support around 64,500. If it breaks, it will move to 64,300. The deepest wick could probe around 63,900–64,000.
Previous price projection:
Price was expected to move upward. The first target was to break through 64,761, followed by breaking through 64,843. The selling pressure encountered at those levels would likely bring price back to 64,300 to find support, and then it would rise again. The extreme target could reach 65,167.
Actual price action:
Price hit and broke through the target on the first attempt, with the highest wick around 65,000.
Next price action:
Order-book “vacuum”
The short side has started an offensive in the near term, with the defensive zone at 64,660–64,700. Although this has been partially filled so far, the trend has changed: it has shifted from the previous upward move to sideways-to-downward consolidation.
In the medium term, the shorts are attacking 64,657–64,731, but they are subsequently filled by the longs, forming a long offensive. The defensive zone is 64,594–64,516. The trend rapidly flips from bearish to bullish. At present, the outlook favors a bullish offensive, but there is a very high probability of a pullback to 64,516. If this level is lost, we may see consolidation turning further downward.
Price channel
Equal near-term average: 64,090; upper limit: 71,700; lower limit: 58,260.
Equal medium-term average: 63,680; upper limit: 66,810; lower limit: 59,360.
Equal long-term average: 70,210; lower limit: 59,300.
Based on these indicators, the average has slightly risen. Price is currently above the averages. 63,680 and 64,090 provide support, and the near-term trend is still seen as upward.
Equal near-term average on “this basis”: 64,300; upper limit: 66,810; lower limit: 61,900.
Equal medium-term average on “this basis”: 63,670; upper limit: 66,810; lower limit: 58,310.
Equal long-term average on “this basis”: 63,700; upper limit: 64,950; lower limit: 62,690.
Based on this indicator set, price is currently above the moving averages, suggesting an upward trend. However, it has touched the long-term upper band; it may be pushed back to consolidate around 64,300. If 64,300 cannot hold, it may move toward the 63,600 area.
Combined view of the two indicators suggests price will pull back and consolidate around 64,300, potentially probing 64,090 and even 63,700.
Institutional volume-price order blocks
For the short and medium term, sell limit orders are stacked lower and with large volume, indicating that the bullish momentum is being pushed back.
Limit engulfing
This indicator shows no obvious change from the above, but the trend is completely opposite. In the prior section, the bullish offensive was not fully able to break through 64,545–65,167; instead, it was pushed back by the shorts and needs to be tested.
Near-term bullish offensive: 63,943–64,337 and 64,051–64,495.
Medium-term bullish offensive: 63,938–62,680.
Look for price to first test around 64,500 to find support. Most likely, this support will not hold, and price will test near 64,000.
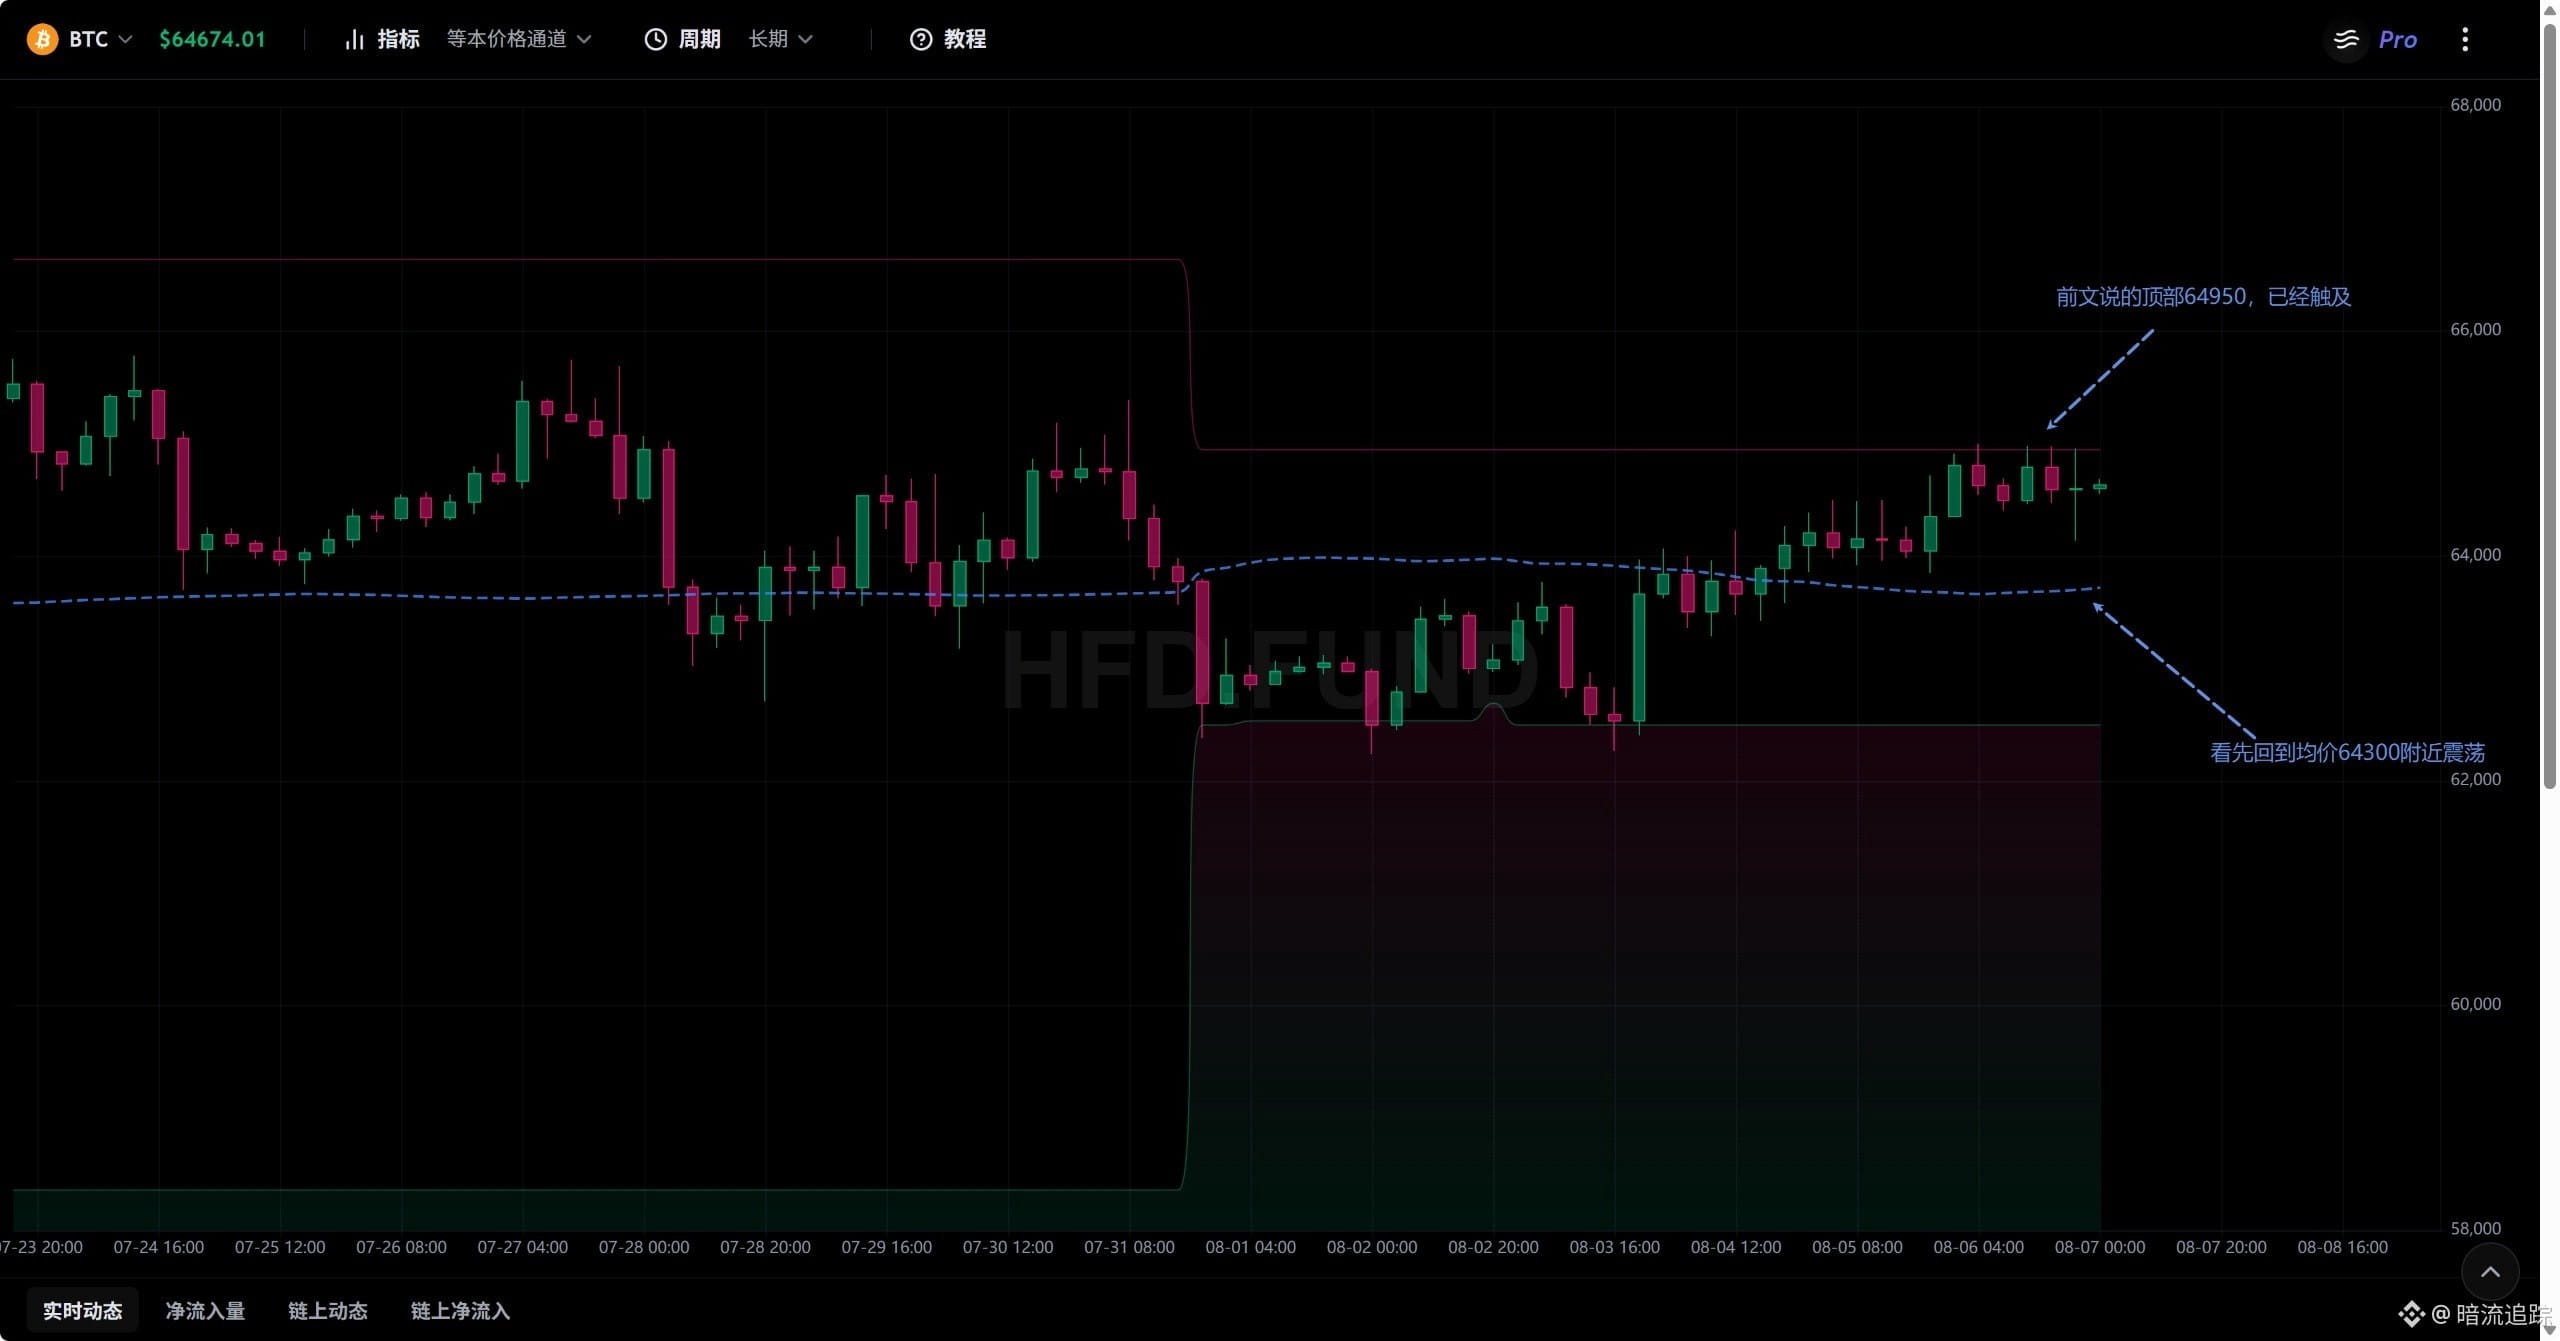
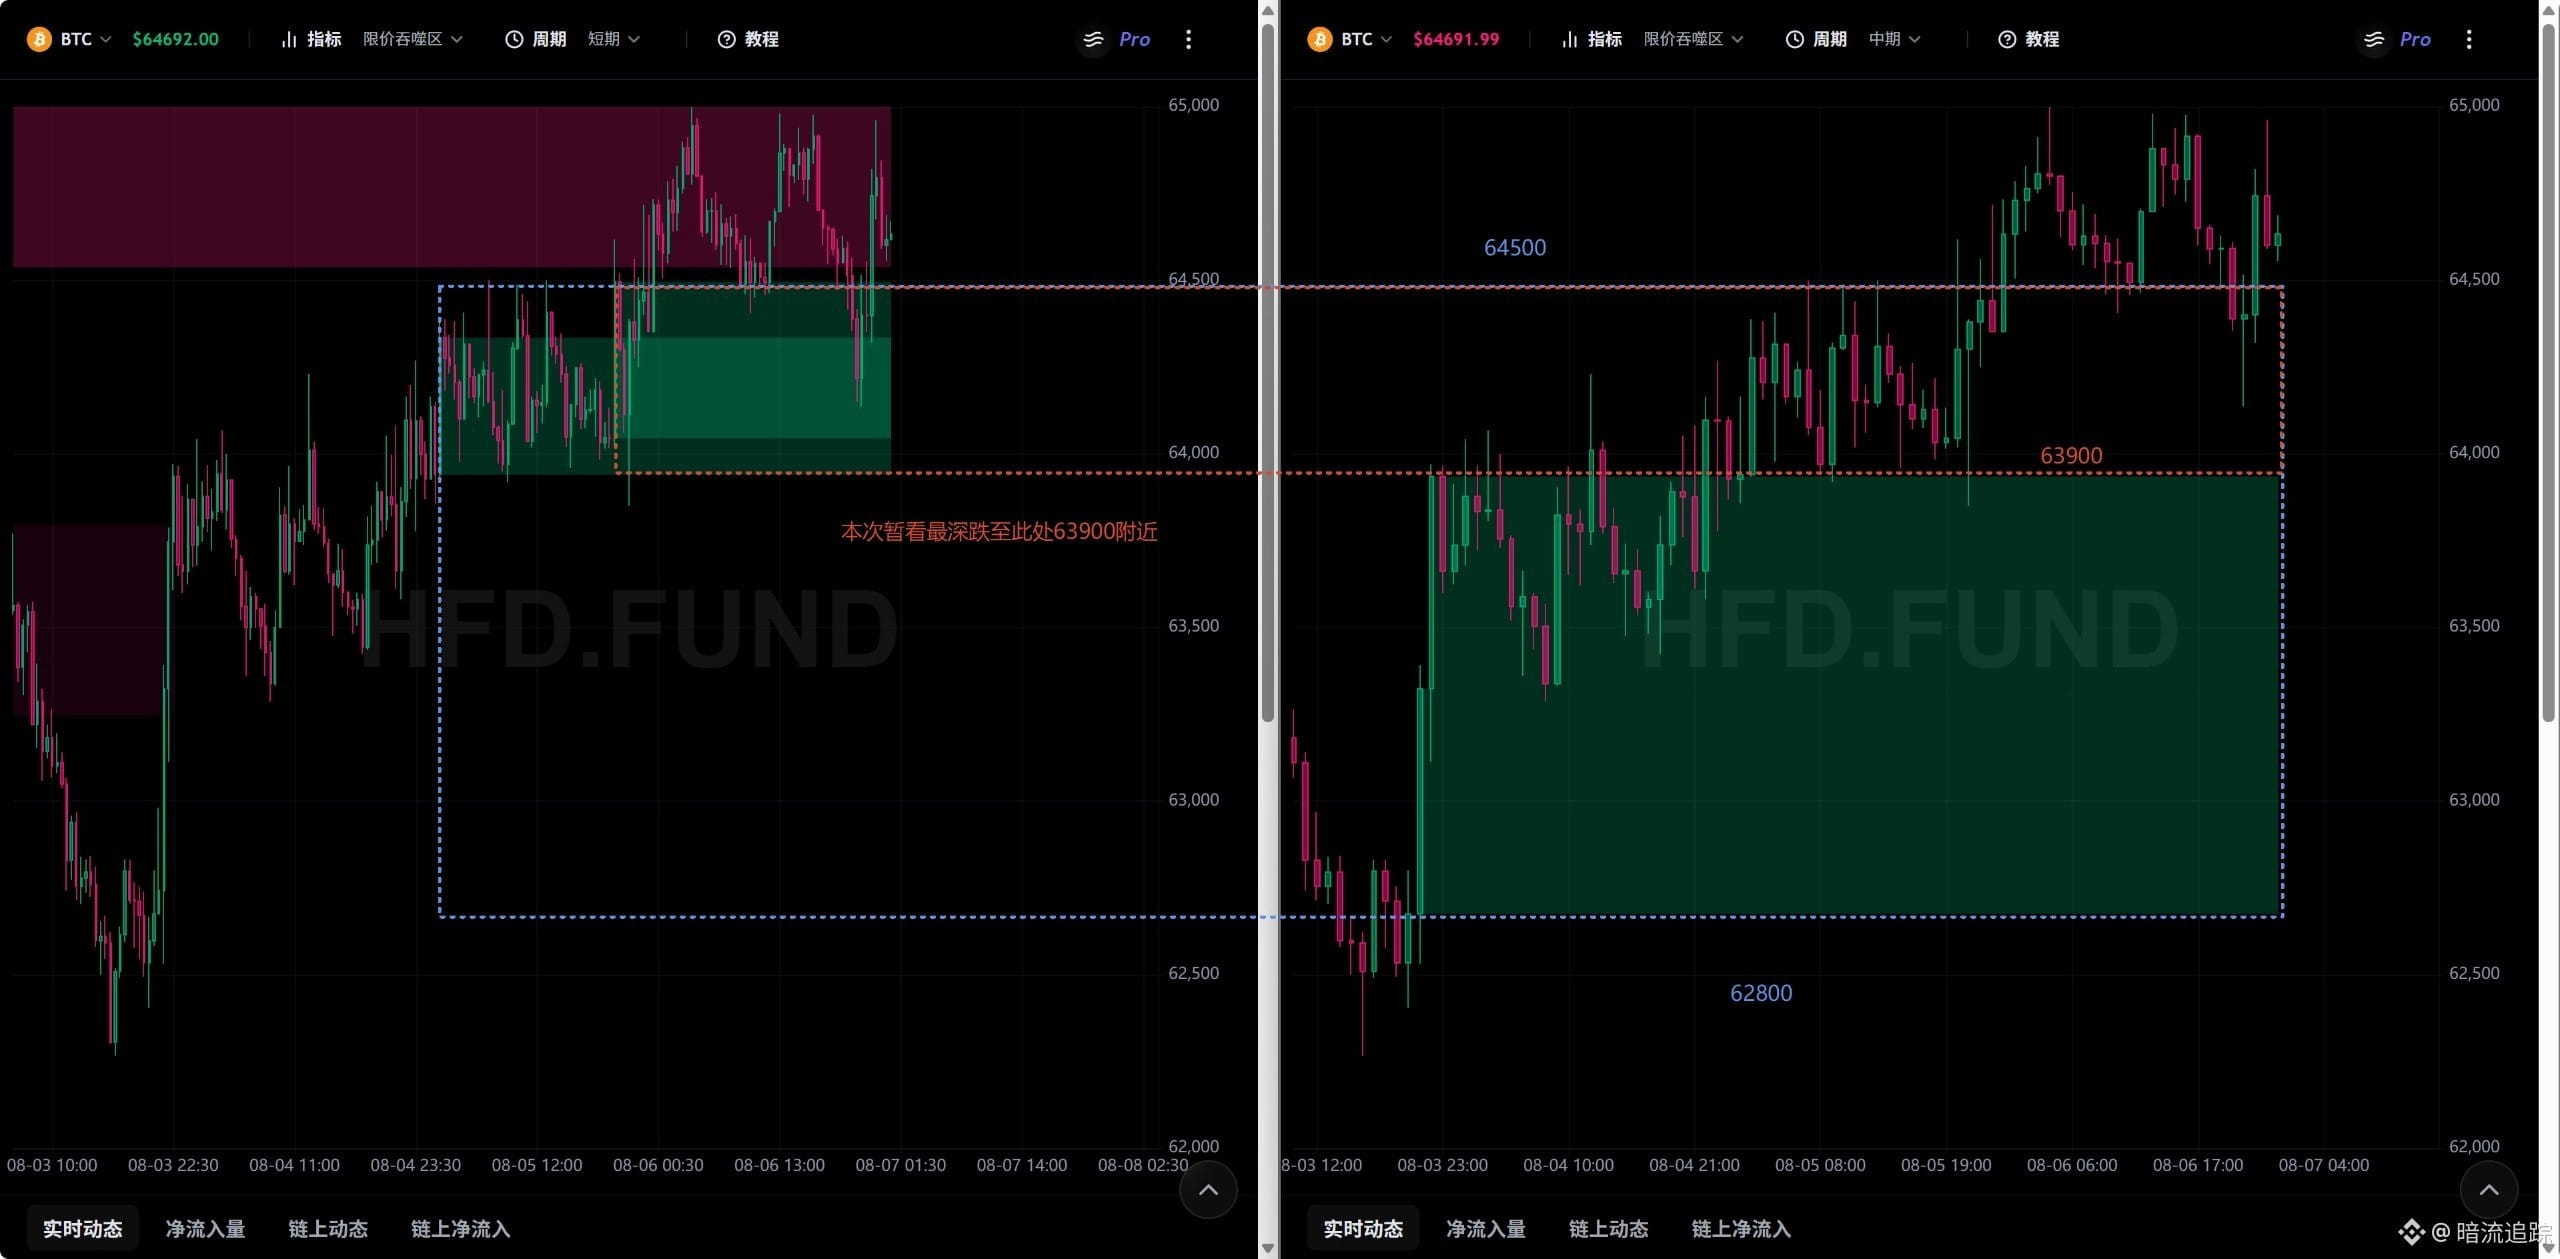
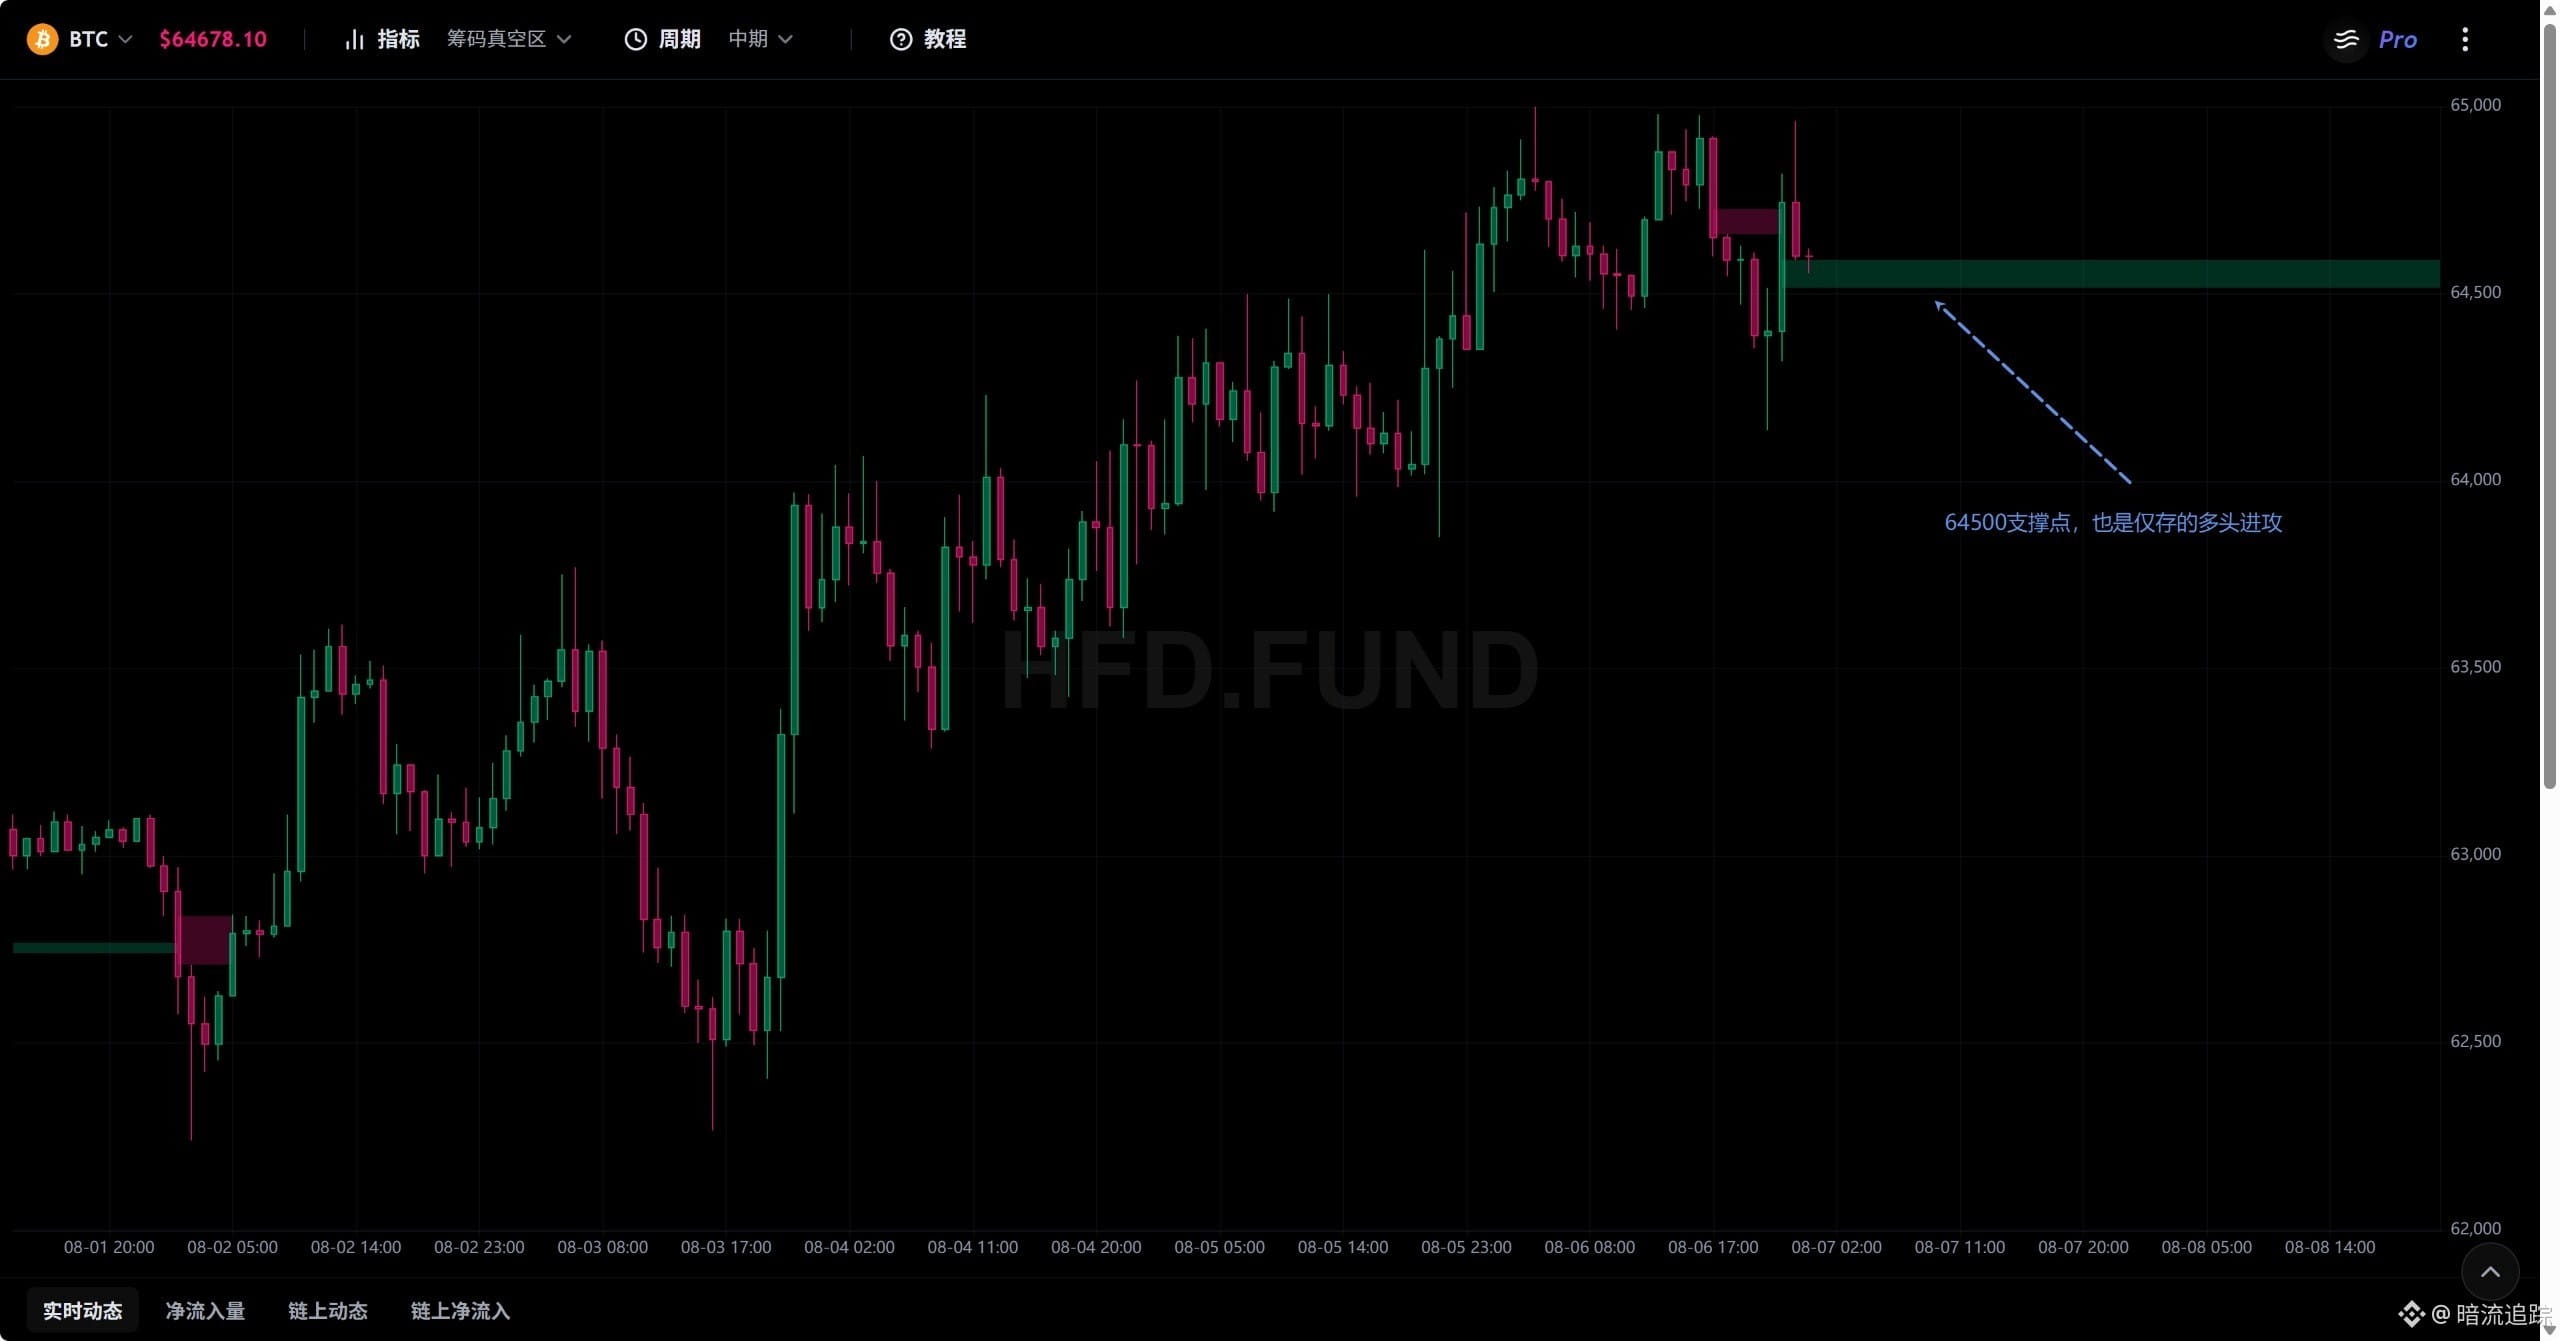
Summary:
Building on the previous section, the trend has shifted from ranging to upward, but upside space is limited.
Price projection:
Price is expected to move higher. The first target is to break through 64761, followed by breaking through 64843. After encountering this kind of sell-side pressure, the price may retreat to 64300 to find support, and then rise again. The extreme (peak) could be around 65167.
Previous price projection:
Ranging around 63500–63700. After the range, it moves up to 64320, where it meets resistance. Once 64320 holds, it will rise to the 64545–65167 area. After a spike near 65167, it is likely to pull back.
Actual price action:
Ranging around 63500–63700. Wide-range fluctuations near 64200. The current high has already pierced up to 64746.
Outlook:
Chip (order) vacuum
In the short term, bulls are attacking; however, after each bull attack forms a line of defense, it gets refilled.
In the medium and long term, the outlook remains ranging.
This indicates that disagreement in the market is still relatively large. Overall, however, market opinions are not consistently bullish, which is why wide-range consolidation is occurring.
Therefore, this indicator suggests that current price will keep making wide-range fluctuations but with an upward bias.
Price channel
For the equal-quantity short-term moving average: 63960; upper bound 71700; lower bound 58260.
For the equal-quantity mid-term moving average: 63660; upper bound 66810; lower bound 59360.
For the equal-quantity long-term moving average: 70210; lower bound 59300.
Based on this indicator, both the short- and mid-term moving averages and their upper bounds have increased. Also, price is above the moving averages, which suggests that market expectations for price are rising, and support has increased to 63660–63960.
For the equal-quantity short-term average: 64280; upper bound 66810; lower bound 61900.
For the equal-quantity mid-term average: 63630; upper bound 66810; lower bound 58310.
For the equal-quantity long-term average: 63700; upper bound 64950; lower bound 62690.
Based on this indicator, the most important change is that price has moved above the short-term average 64280. This means the trend has shifted from ranging to an uptrend. The 64280 pressure line has become support, and the latest pressure line is around 64950.
Combining both indicators: currently, the trend has shifted from fluctuation between the various moving averages to climbing upward after holding above each of them. However, with the long-term resistance at 64950 capping it, the highs are unlikely to be very high, and there isn’t much remaining upside space.
Limit-price absorption (price engulfing)
Short-term bull attacks: 63943–64337, 64051–64495.
In the mid-term, it is still the bull attack described earlier, with the defensive zone at 63938–62680.
At present, it appears that bulls are in control and pushing upward. The target remains the historical short position area of 64545–65167. So price is very likely to be capped above 64300 as it attempts a move toward 65167.
Building on the previous section, the trend has shifted from ranging to upward, but upside space is limited.
Price projection:
Price is expected to move higher. The first target is to break through 64761, followed by breaking through 64843. After encountering this kind of sell-side pressure, the price may retreat to 64300 to find support, and then rise again. The extreme (peak) could be around 65167.
Previous price projection:
Ranging around 63500–63700. After the range, it moves up to 64320, where it meets resistance. Once 64320 holds, it will rise to the 64545–65167 area. After a spike near 65167, it is likely to pull back.
Actual price action:
Ranging around 63500–63700. Wide-range fluctuations near 64200. The current high has already pierced up to 64746.
Outlook:
Chip (order) vacuum
In the short term, bulls are attacking; however, after each bull attack forms a line of defense, it gets refilled.
In the medium and long term, the outlook remains ranging.
This indicates that disagreement in the market is still relatively large. Overall, however, market opinions are not consistently bullish, which is why wide-range consolidation is occurring.
Therefore, this indicator suggests that current price will keep making wide-range fluctuations but with an upward bias.
Price channel
For the equal-quantity short-term moving average: 63960; upper bound 71700; lower bound 58260.
For the equal-quantity mid-term moving average: 63660; upper bound 66810; lower bound 59360.
For the equal-quantity long-term moving average: 70210; lower bound 59300.
Based on this indicator, both the short- and mid-term moving averages and their upper bounds have increased. Also, price is above the moving averages, which suggests that market expectations for price are rising, and support has increased to 63660–63960.
For the equal-quantity short-term average: 64280; upper bound 66810; lower bound 61900.
For the equal-quantity mid-term average: 63630; upper bound 66810; lower bound 58310.
For the equal-quantity long-term average: 63700; upper bound 64950; lower bound 62690.
Based on this indicator, the most important change is that price has moved above the short-term average 64280. This means the trend has shifted from ranging to an uptrend. The 64280 pressure line has become support, and the latest pressure line is around 64950.
Combining both indicators: currently, the trend has shifted from fluctuation between the various moving averages to climbing upward after holding above each of them. However, with the long-term resistance at 64950 capping it, the highs are unlikely to be very high, and there isn’t much remaining upside space.
Limit-price absorption (price engulfing)
Short-term bull attacks: 63943–64337, 64051–64495.
In the mid-term, it is still the bull attack described earlier, with the defensive zone at 63938–62680.
At present, it appears that bulls are in control and pushing upward. The target remains the historical short position area of 64545–65167. So price is very likely to be capped above 64300 as it attempts a move toward 65167.
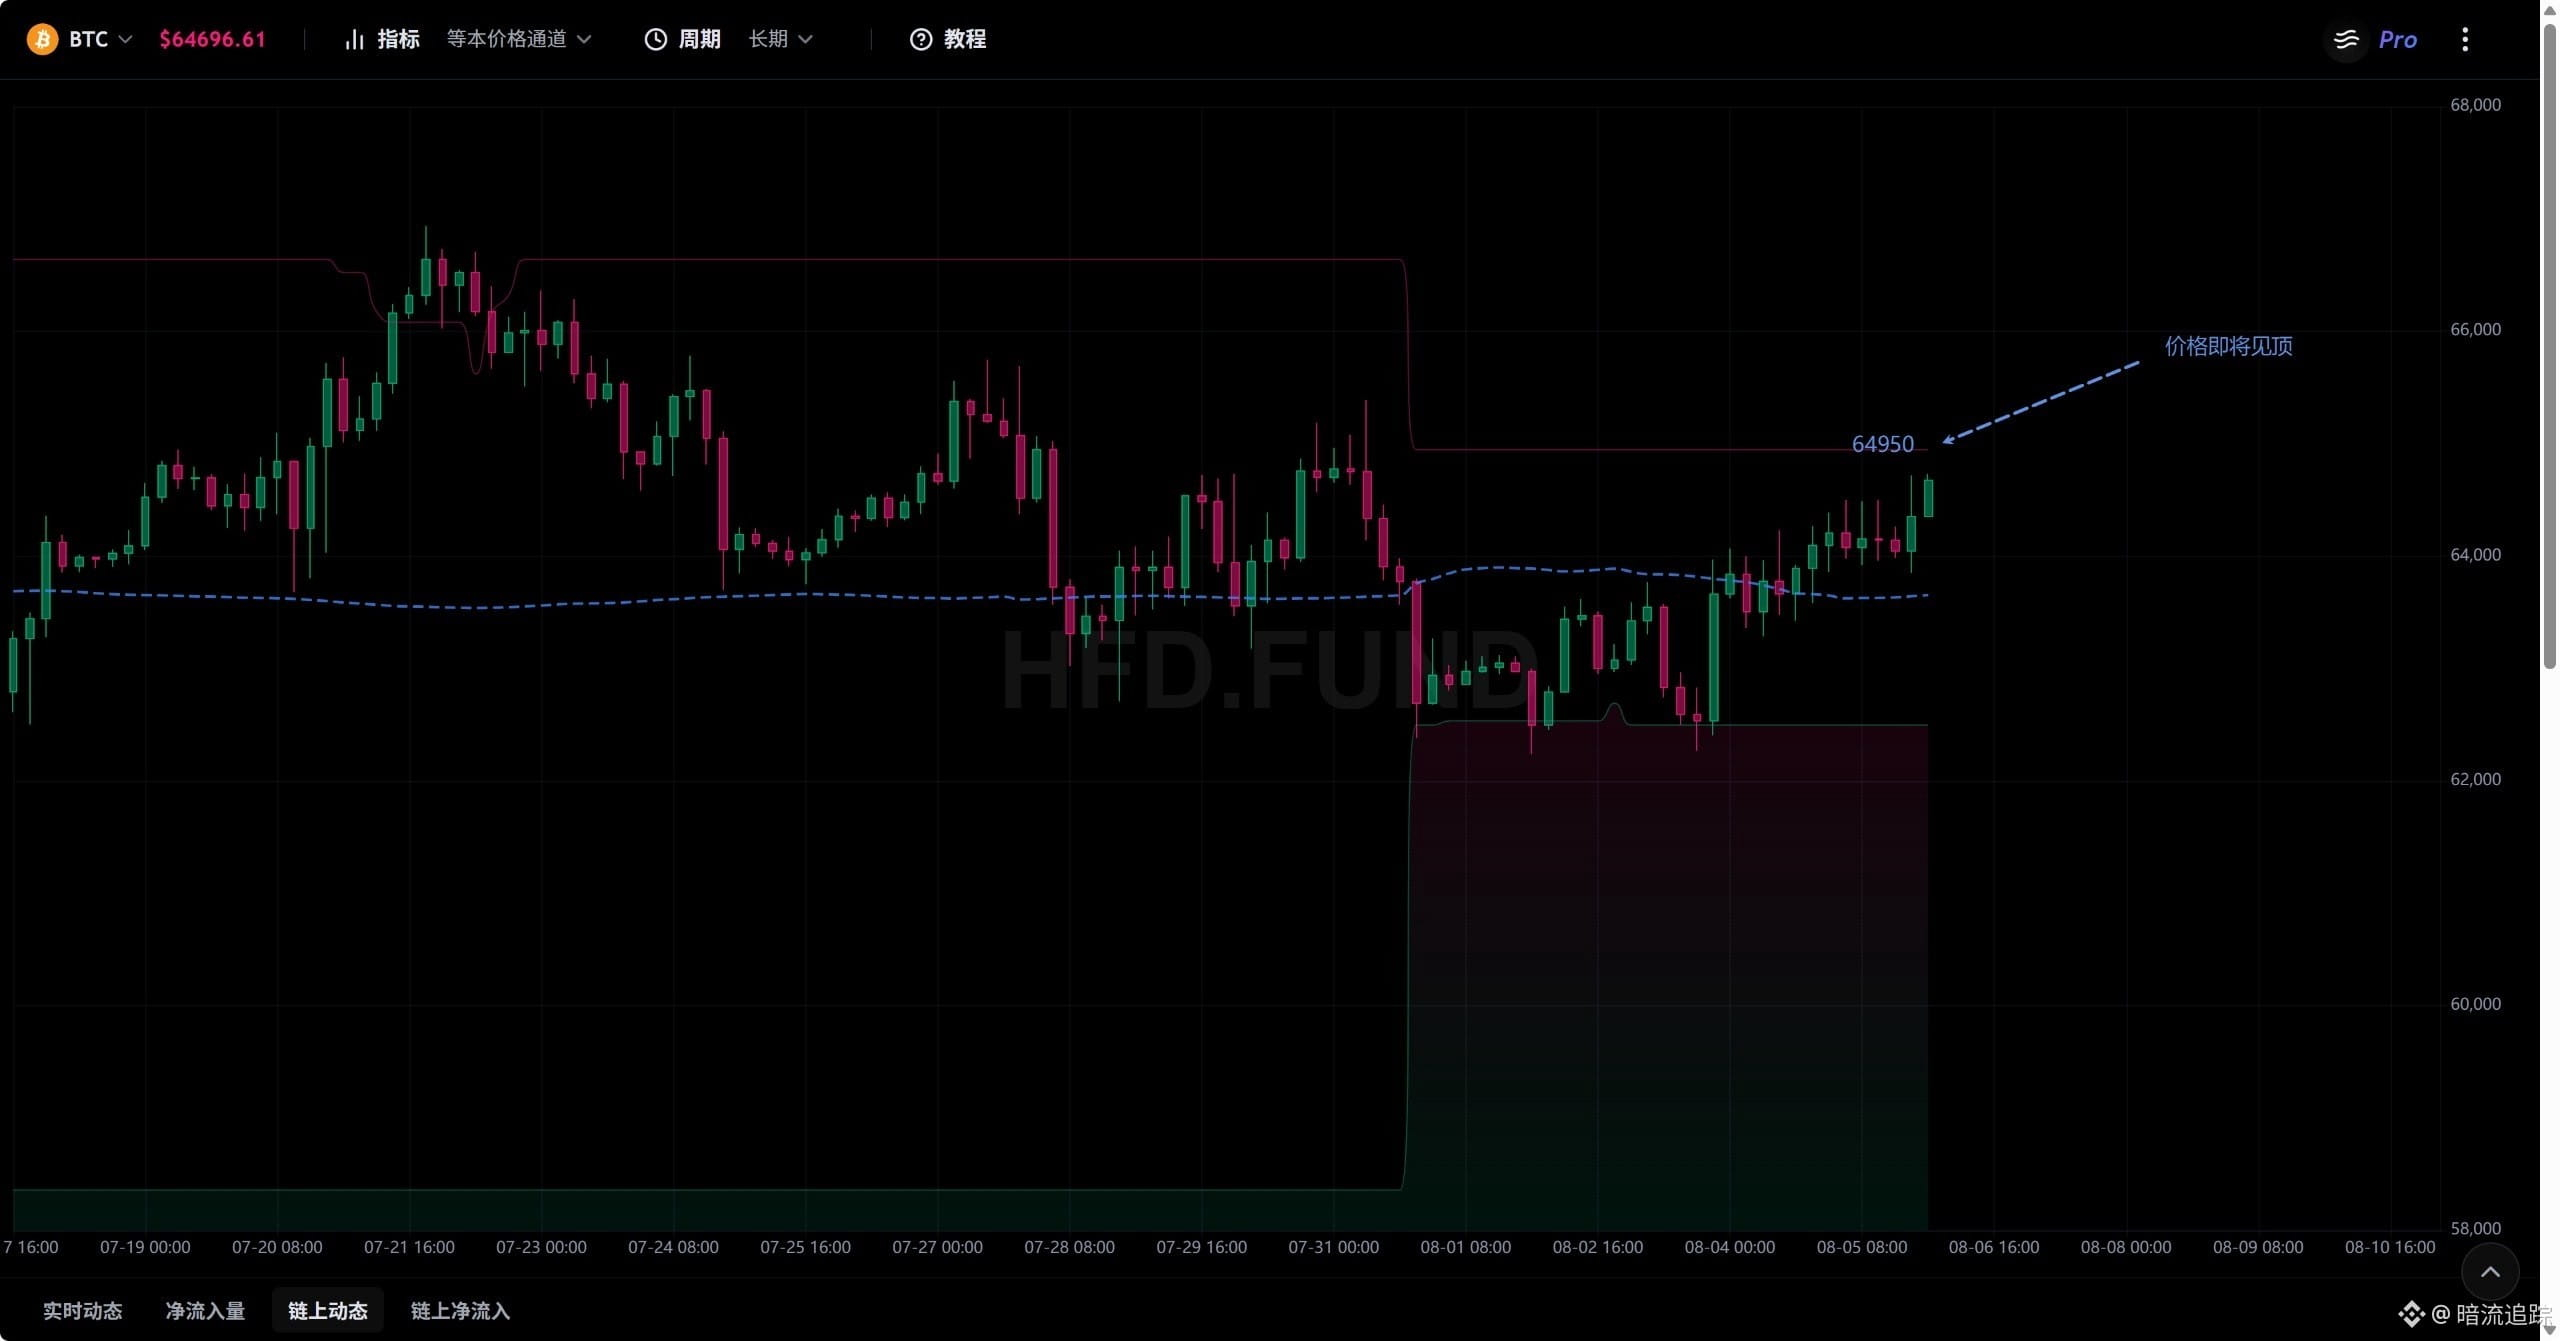
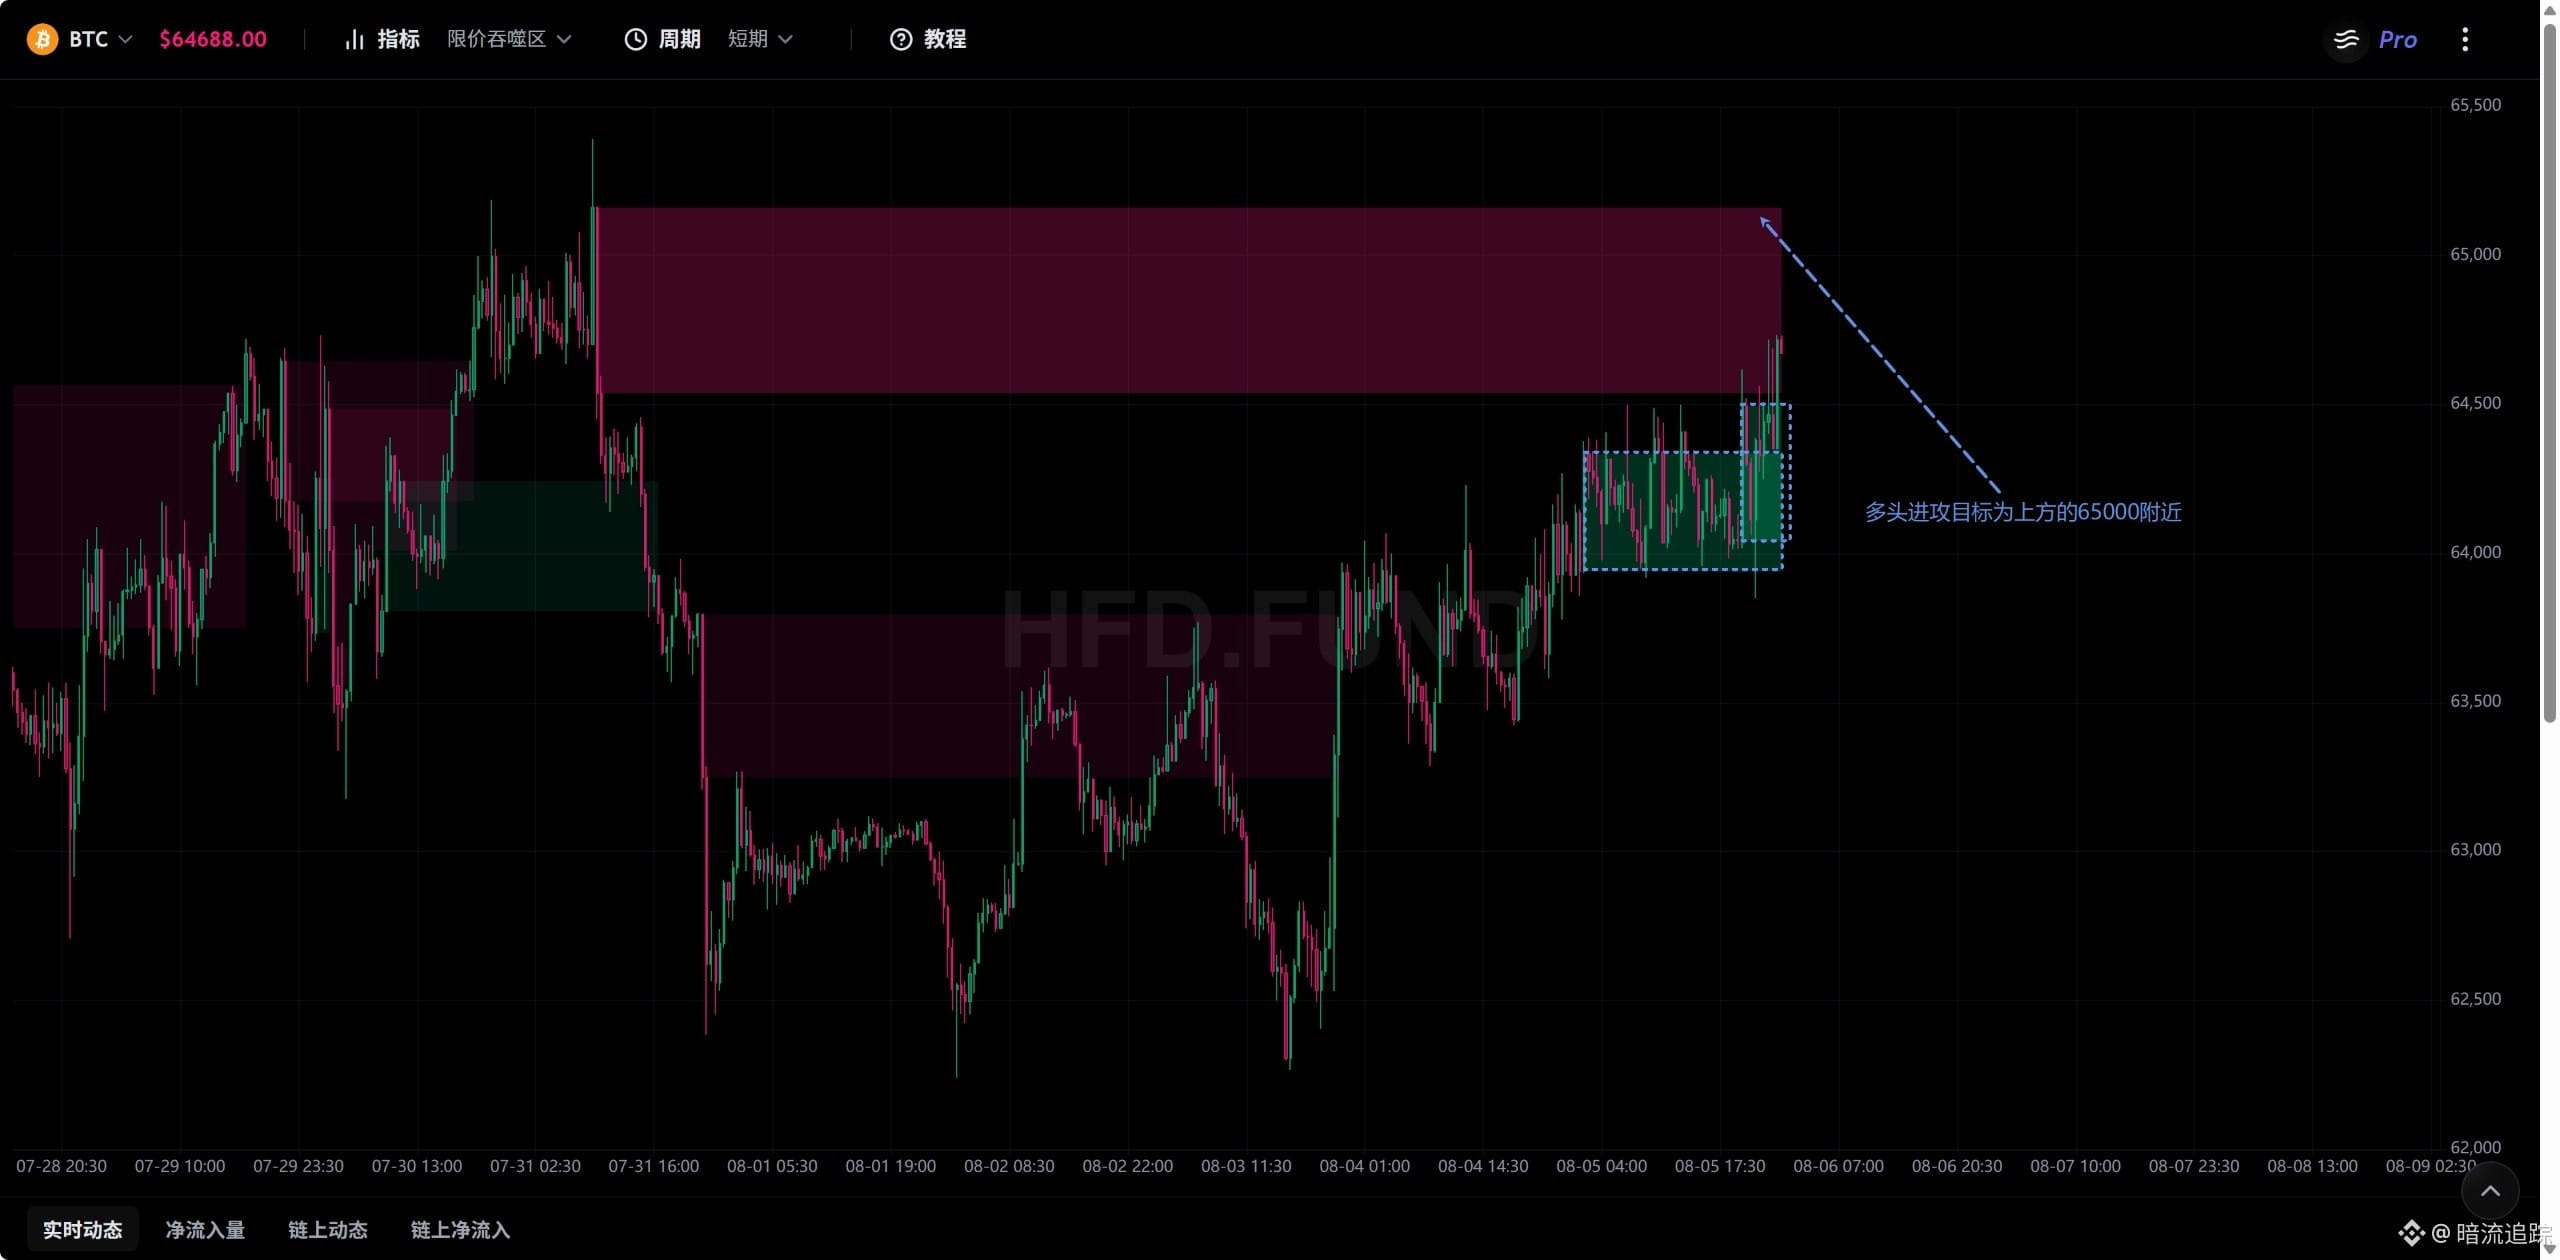
Summary:
Building on the previous section, the trend has shifted from choppy declines to choppy upswings.
Price movement projection:
Around 63,500–63,700, the price will oscillate. After the consolidation, it will rise to 64,320, where it will meet resistance. Once 64,320 holds, the price is expected to rise to the 64,545–65,167 area. After an extreme wick near 65,167, it will pull back.
Note: If 64,320 cannot hold and immediately drops, the target is 62,680 below.
Previous price projection:
After oscillating around 63,100, the price starts to probe lower; the deepest dip is expected to reach 62,690.
If 62,690 is quickly reclaimed above 62,690, the trend can continue upward. If it cannot be reclaimed, then expect a period of a fairly sharp decline.
Actual price movement:
The lowest the price probed was 62,266, and it quickly rebounded back above 62,690. The price is now around 63,800.
Future price movement:
Chip vacuum
All three cycles have shifted from decline to consolidation.
Price channels
Equal short-term average: 63,530; upper limit 70,090; lower limit 58,260.
Equal mid-term average: 63,160; upper limit 66,810; lower limit 58,260.
Equal long-term average: 70,210; lower limit 59,300.
Based on this indicator, the price has shifted from below the moving averages to above them, so the short- and mid-term trend has also changed from bearish to consolidation-with-bullish bias.
As for the equivalent-based near-term average of 64,320: upper limit 66,810; lower limit 61,900.
Equivalent-based mid-term average of 63,630: upper limit 66,810; lower limit 58,310.
Equivalent-based long-term average of 63,700: upper limit 64,950; lower limit 62,690.
Based on this indicator, the mid- and long-term moving averages provide support, while the short-term moving average and the long-term upper bound act as pressure. The price may fluctuate between 63,600 and 64,590. Once it touches either side significantly, it is likely to reverse toward the other side. The price is extremely compressed, so there is limited upside and limited downside. At the same time, it currently appears that the long-term lower bound has been touched; that would likely trigger a rebound, and once it holds the moving average, it could look toward 64,950.
Combining the two indicators, the current trend has shifted from the earlier weakness to consolidation after holding the moving average, with the early stage of strengthening. However, the recent highs won’t be too high—64,320 and 64,950 will both likely form resistance.
Limit-price engulfing
In the mid-term, bullish forces are strongly pushing, with the defense line at 63,938–62,680. The short-term historical bearish high at 63,800 has finally been broken through, and the outlook is for consolidation.
After that, under the mid-term push, the price may continue rising. The first historical bearish area it bumps into is 64,545–65,167, which has substantial power. It may drop after reaching the lower edge there; after filling back to 62,680, it could rise again and pierce through 65,167 with a wick.
Building on the previous section, the trend has shifted from choppy declines to choppy upswings.
Price movement projection:
Around 63,500–63,700, the price will oscillate. After the consolidation, it will rise to 64,320, where it will meet resistance. Once 64,320 holds, the price is expected to rise to the 64,545–65,167 area. After an extreme wick near 65,167, it will pull back.
Note: If 64,320 cannot hold and immediately drops, the target is 62,680 below.
Previous price projection:
After oscillating around 63,100, the price starts to probe lower; the deepest dip is expected to reach 62,690.
If 62,690 is quickly reclaimed above 62,690, the trend can continue upward. If it cannot be reclaimed, then expect a period of a fairly sharp decline.
Actual price movement:
The lowest the price probed was 62,266, and it quickly rebounded back above 62,690. The price is now around 63,800.
Future price movement:
Chip vacuum
All three cycles have shifted from decline to consolidation.
Price channels
Equal short-term average: 63,530; upper limit 70,090; lower limit 58,260.
Equal mid-term average: 63,160; upper limit 66,810; lower limit 58,260.
Equal long-term average: 70,210; lower limit 59,300.
Based on this indicator, the price has shifted from below the moving averages to above them, so the short- and mid-term trend has also changed from bearish to consolidation-with-bullish bias.
As for the equivalent-based near-term average of 64,320: upper limit 66,810; lower limit 61,900.
Equivalent-based mid-term average of 63,630: upper limit 66,810; lower limit 58,310.
Equivalent-based long-term average of 63,700: upper limit 64,950; lower limit 62,690.
Based on this indicator, the mid- and long-term moving averages provide support, while the short-term moving average and the long-term upper bound act as pressure. The price may fluctuate between 63,600 and 64,590. Once it touches either side significantly, it is likely to reverse toward the other side. The price is extremely compressed, so there is limited upside and limited downside. At the same time, it currently appears that the long-term lower bound has been touched; that would likely trigger a rebound, and once it holds the moving average, it could look toward 64,950.
Combining the two indicators, the current trend has shifted from the earlier weakness to consolidation after holding the moving average, with the early stage of strengthening. However, the recent highs won’t be too high—64,320 and 64,950 will both likely form resistance.
Limit-price engulfing
In the mid-term, bullish forces are strongly pushing, with the defense line at 63,938–62,680. The short-term historical bearish high at 63,800 has finally been broken through, and the outlook is for consolidation.
After that, under the mid-term push, the price may continue rising. The first historical bearish area it bumps into is 64,545–65,167, which has substantial power. It may drop after reaching the lower edge there; after filling back to 62,680, it could rise again and pierce through 65,167 with a wick.
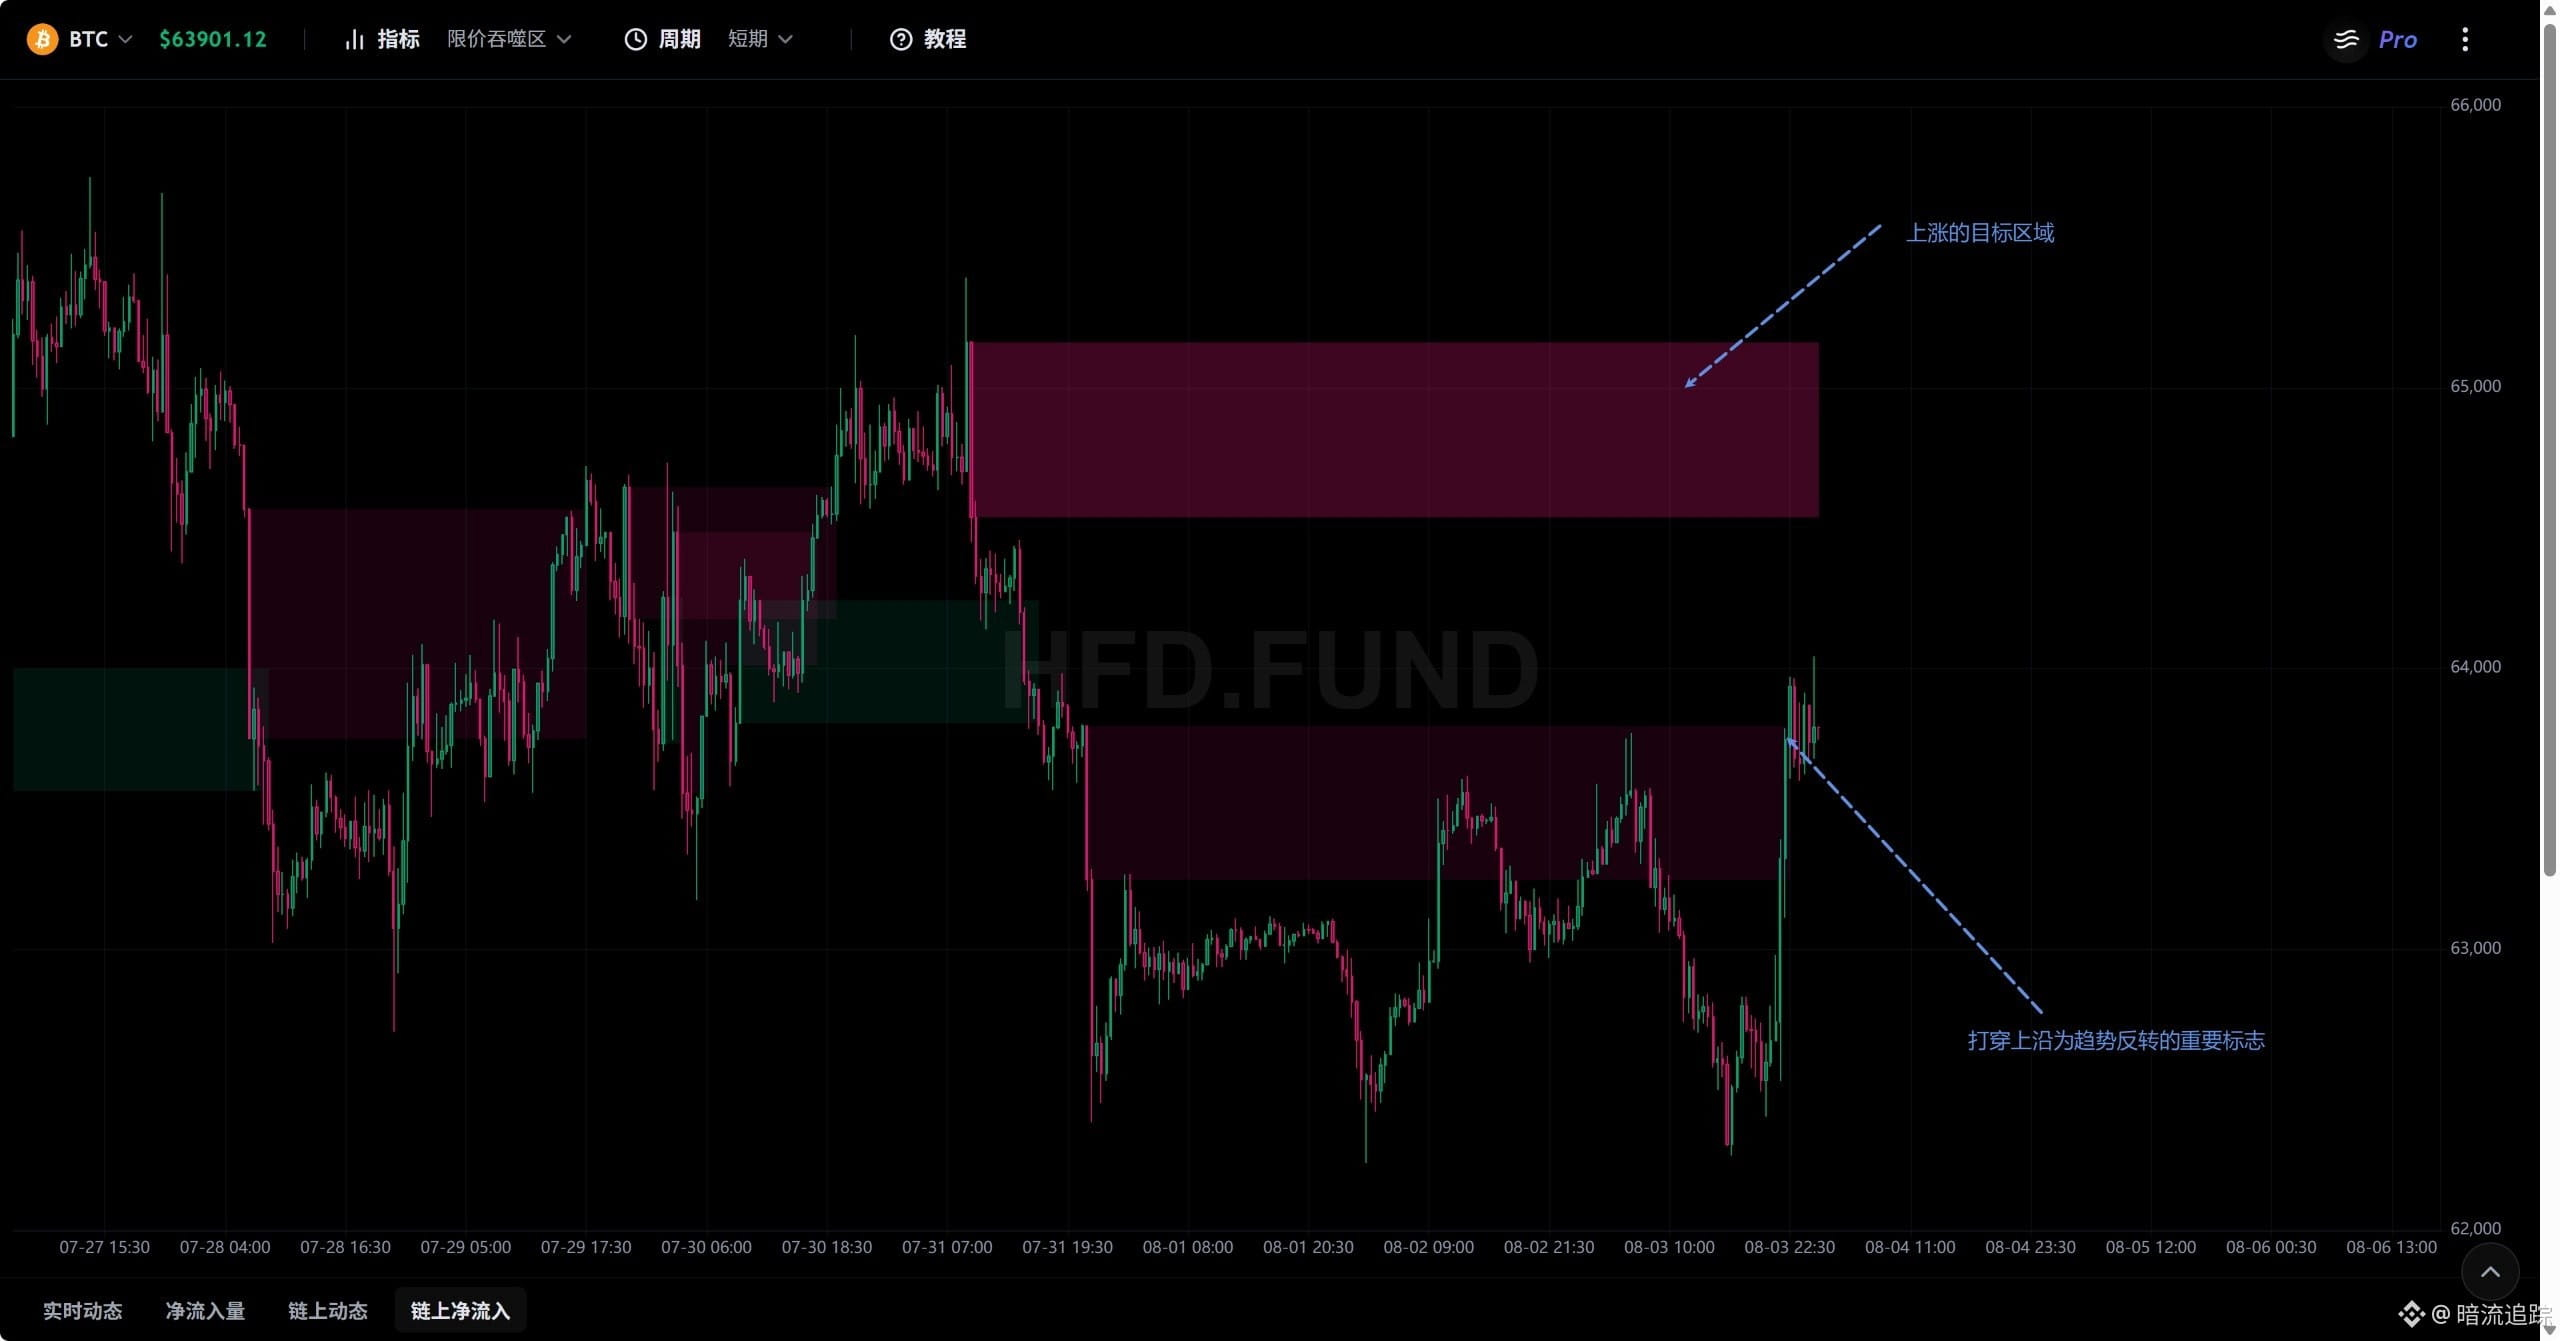
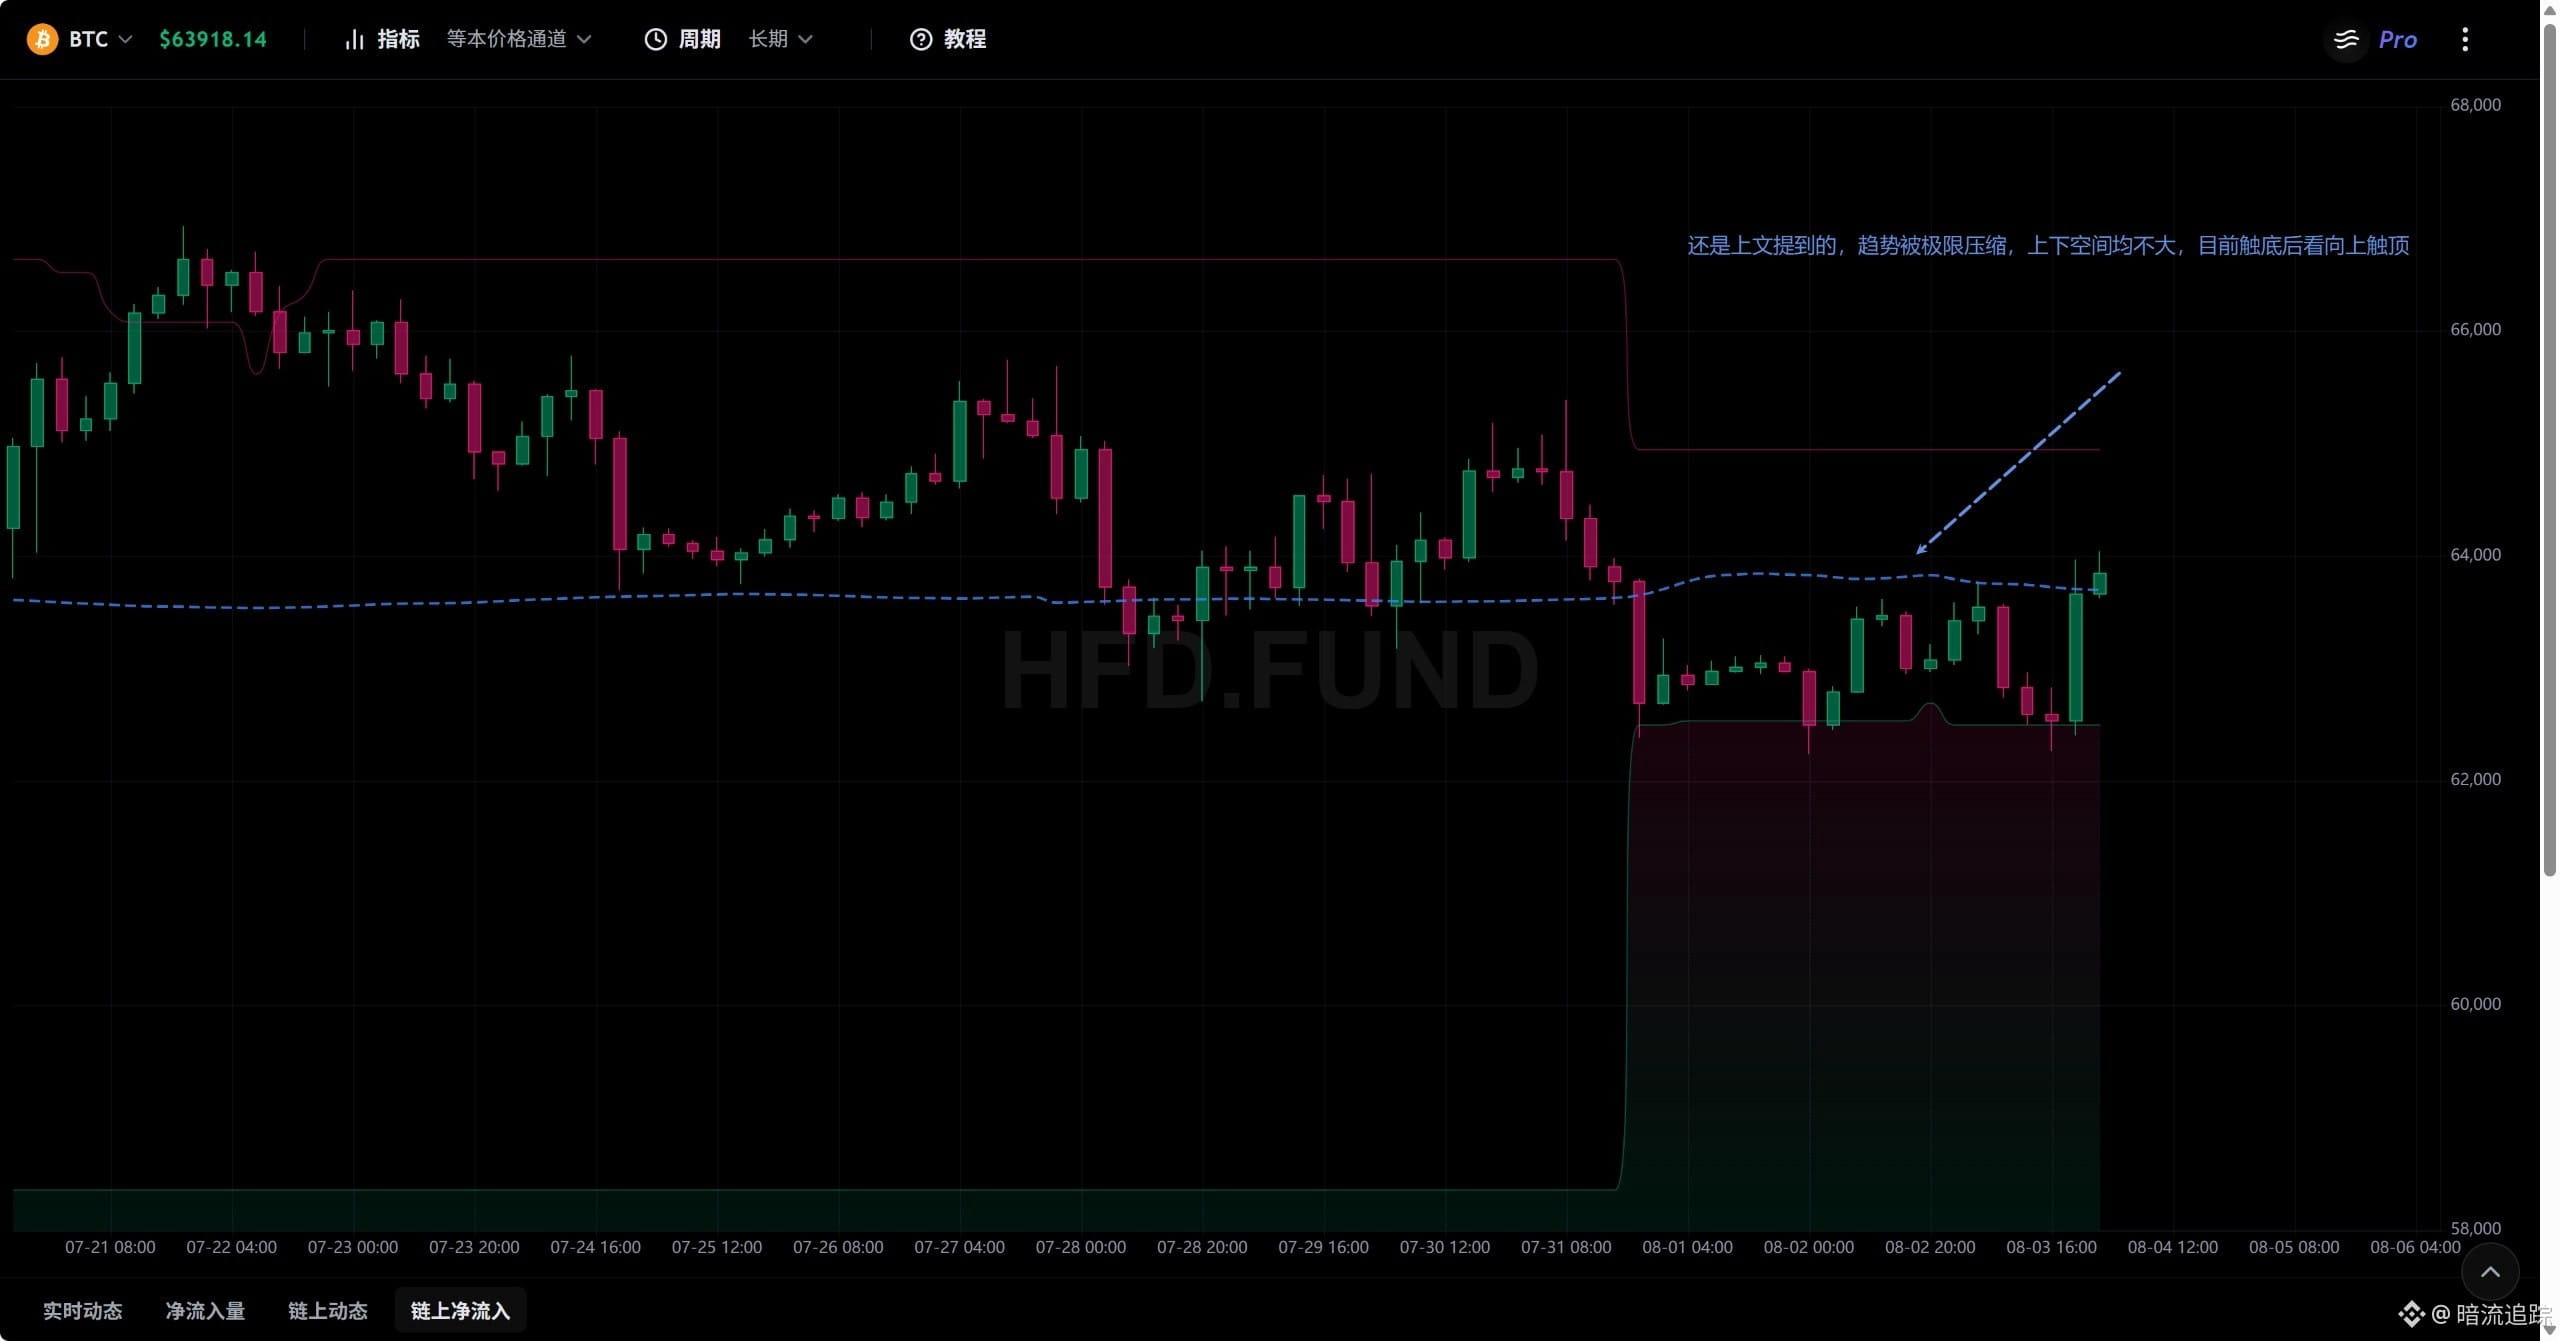
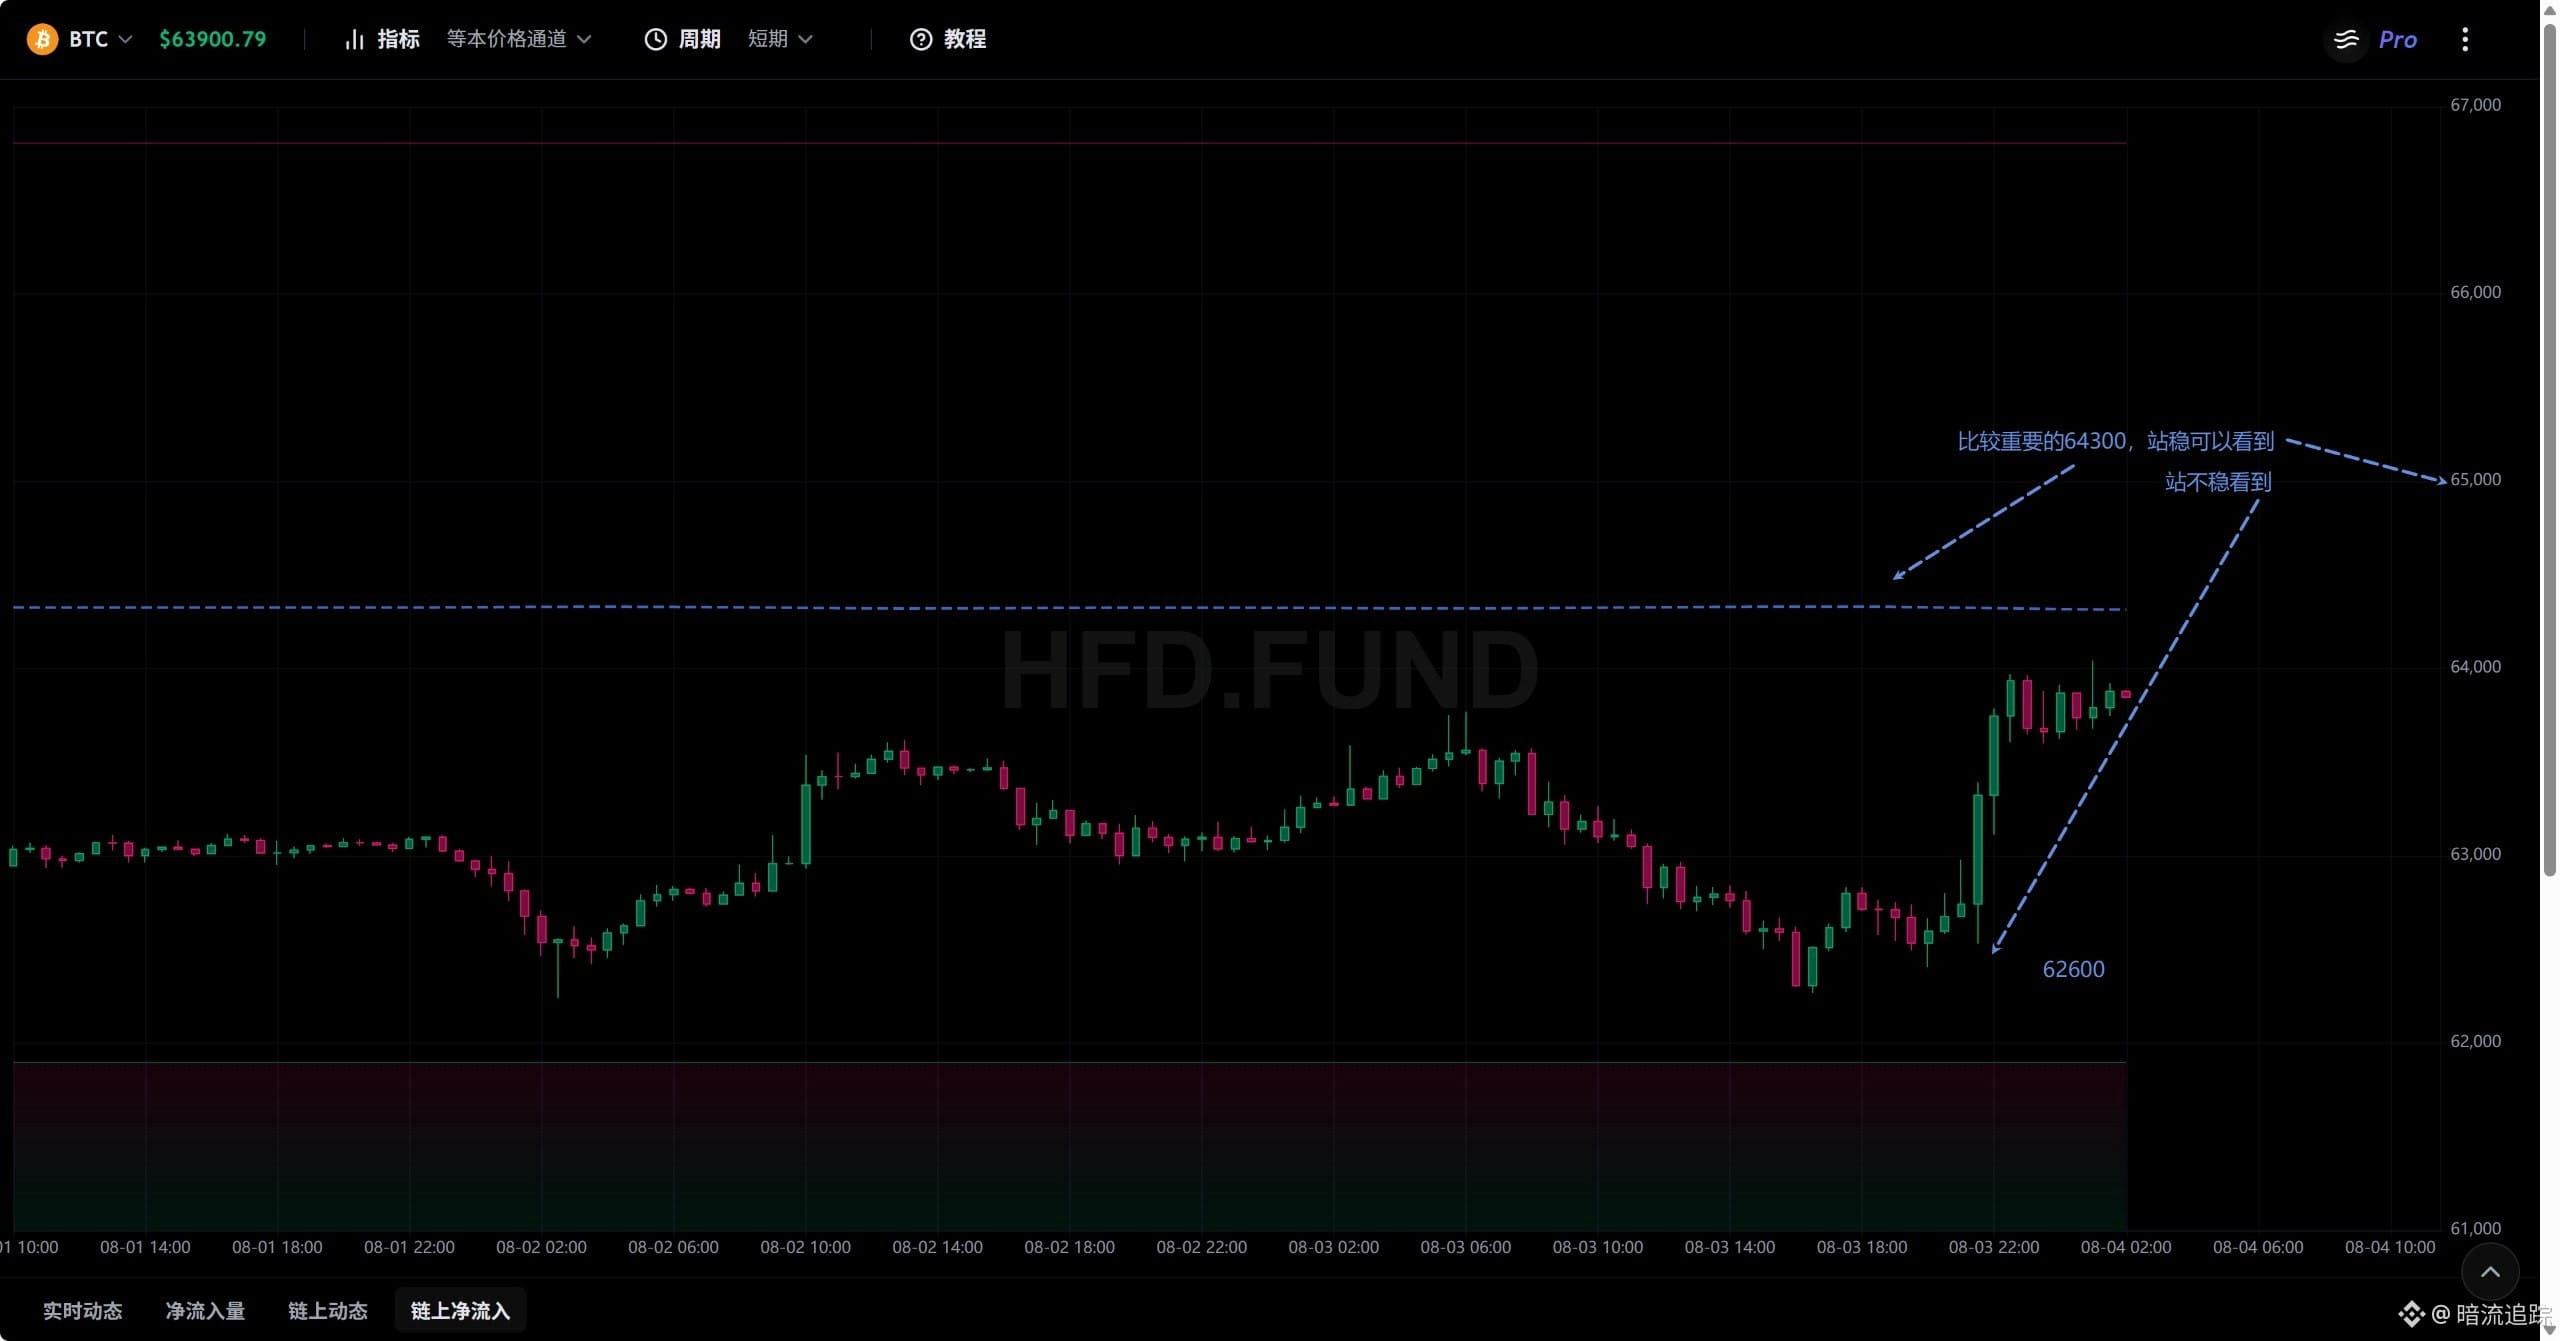
Summary:
Following the previous discussion, the initial target has been reached. Now, the trend appears to be oscillating and dipping.
Next price projection:
After oscillating around 63,100, it begins to fall further. The lowest point could dip to 62,690.
Note:
If 62,690 is rapidly reclaimed above 62,690, the trend may continue upward.
If it cannot be reclaimed, then look for a fairly significant drop.
Previous price projection:
From 62,711 to 62,967, there would be a period of consolidation. After consolidation, once it holds above 62,967, it should bounce a bit higher, rising to 63,200–63,500, with an extreme possibility of breaking through 63,700.
Actual price movement:
After the peak touched 63,617, it began to fall back. The current price is now around 63,100.
Next outlook:
Chip/position “vacuum”
In the short term, it is a bearish attack. However, the last historical bearish attack line, 63,689–63,291, is about to be filled. Once this zone is filled, expect consolidation.
In the medium term, it’s a consolidation trend. In the long term, this recent upswing has exactly filled the historical bearish attack zone 63,571–63,275, so the trend is also expected to consolidate.
Based on this indicator, the short term is still a bearish trend, while the short-to-medium term points to consolidation.
Price channel
Equal-quantity short-term average: 63,530; upper bound 70,090; lower bound 58,260.
Equal-quantity medium-term average: 63,160; upper bound 66,810; lower bound 58,260.
Equal-quantity long-term average: 70,210; lower bound 59,300.
Based on this indicator, the current price is below the mid- and short-term averages. The trend points downward. The medium-term average (63,160) and the short-term average (about 63,500) act as pressure lines. For now, expect the price to fluctuate between 63,160 and 63,500.
Equal-quantity (this short-term reference): 64,540; upper bound 66,230; lower bound 61,870.
Equal-quantity (this medium-term reference): 63,630; upper bound 66,810; lower bound 58,310.
Equal-quantity (this long-term reference): 63,830; upper bound 64,950; lower bound 62,690.
Based on this indicator, the price remains weak. An important point is that the long-term structure has been compressed to an extreme; the long-term direction is about to emerge, and the most likely outcome is a drop toward 62,690.
From these two indicators together: first, price is in a bearish trend, oscillating under pressure between 63,160 and 63,500. If it breaks below 63,160 and cannot reclaim it, then the bearish scenario targets the long-term lower bound near 62,690.
Institutional volume-price order blocks
For the short term: the latest buy-accumulation orders’ lowest posted position is 62,608; distribution (sell) orders are at 63,148.
For the medium term: the buy-accumulation orders’ base price is 62,128.
For the long term: the latest buy-accumulation orders’ lowest posted position is 61,897.
Based on this indicator, the band of short-term buy/sell posted orders has already been fully consumed. Meanwhile, new accumulation has started again: orders continue to be placed lower. The medium-term side also begins placing orders further down.
Following the previous discussion, the initial target has been reached. Now, the trend appears to be oscillating and dipping.
Next price projection:
After oscillating around 63,100, it begins to fall further. The lowest point could dip to 62,690.
Note:
If 62,690 is rapidly reclaimed above 62,690, the trend may continue upward.
If it cannot be reclaimed, then look for a fairly significant drop.
Previous price projection:
From 62,711 to 62,967, there would be a period of consolidation. After consolidation, once it holds above 62,967, it should bounce a bit higher, rising to 63,200–63,500, with an extreme possibility of breaking through 63,700.
Actual price movement:
After the peak touched 63,617, it began to fall back. The current price is now around 63,100.
Next outlook:
Chip/position “vacuum”
In the short term, it is a bearish attack. However, the last historical bearish attack line, 63,689–63,291, is about to be filled. Once this zone is filled, expect consolidation.
In the medium term, it’s a consolidation trend. In the long term, this recent upswing has exactly filled the historical bearish attack zone 63,571–63,275, so the trend is also expected to consolidate.
Based on this indicator, the short term is still a bearish trend, while the short-to-medium term points to consolidation.
Price channel
Equal-quantity short-term average: 63,530; upper bound 70,090; lower bound 58,260.
Equal-quantity medium-term average: 63,160; upper bound 66,810; lower bound 58,260.
Equal-quantity long-term average: 70,210; lower bound 59,300.
Based on this indicator, the current price is below the mid- and short-term averages. The trend points downward. The medium-term average (63,160) and the short-term average (about 63,500) act as pressure lines. For now, expect the price to fluctuate between 63,160 and 63,500.
Equal-quantity (this short-term reference): 64,540; upper bound 66,230; lower bound 61,870.
Equal-quantity (this medium-term reference): 63,630; upper bound 66,810; lower bound 58,310.
Equal-quantity (this long-term reference): 63,830; upper bound 64,950; lower bound 62,690.
Based on this indicator, the price remains weak. An important point is that the long-term structure has been compressed to an extreme; the long-term direction is about to emerge, and the most likely outcome is a drop toward 62,690.
From these two indicators together: first, price is in a bearish trend, oscillating under pressure between 63,160 and 63,500. If it breaks below 63,160 and cannot reclaim it, then the bearish scenario targets the long-term lower bound near 62,690.
Institutional volume-price order blocks
For the short term: the latest buy-accumulation orders’ lowest posted position is 62,608; distribution (sell) orders are at 63,148.
For the medium term: the buy-accumulation orders’ base price is 62,128.
For the long term: the latest buy-accumulation orders’ lowest posted position is 61,897.
Based on this indicator, the band of short-term buy/sell posted orders has already been fully consumed. Meanwhile, new accumulation has started again: orders continue to be placed lower. The medium-term side also begins placing orders further down.
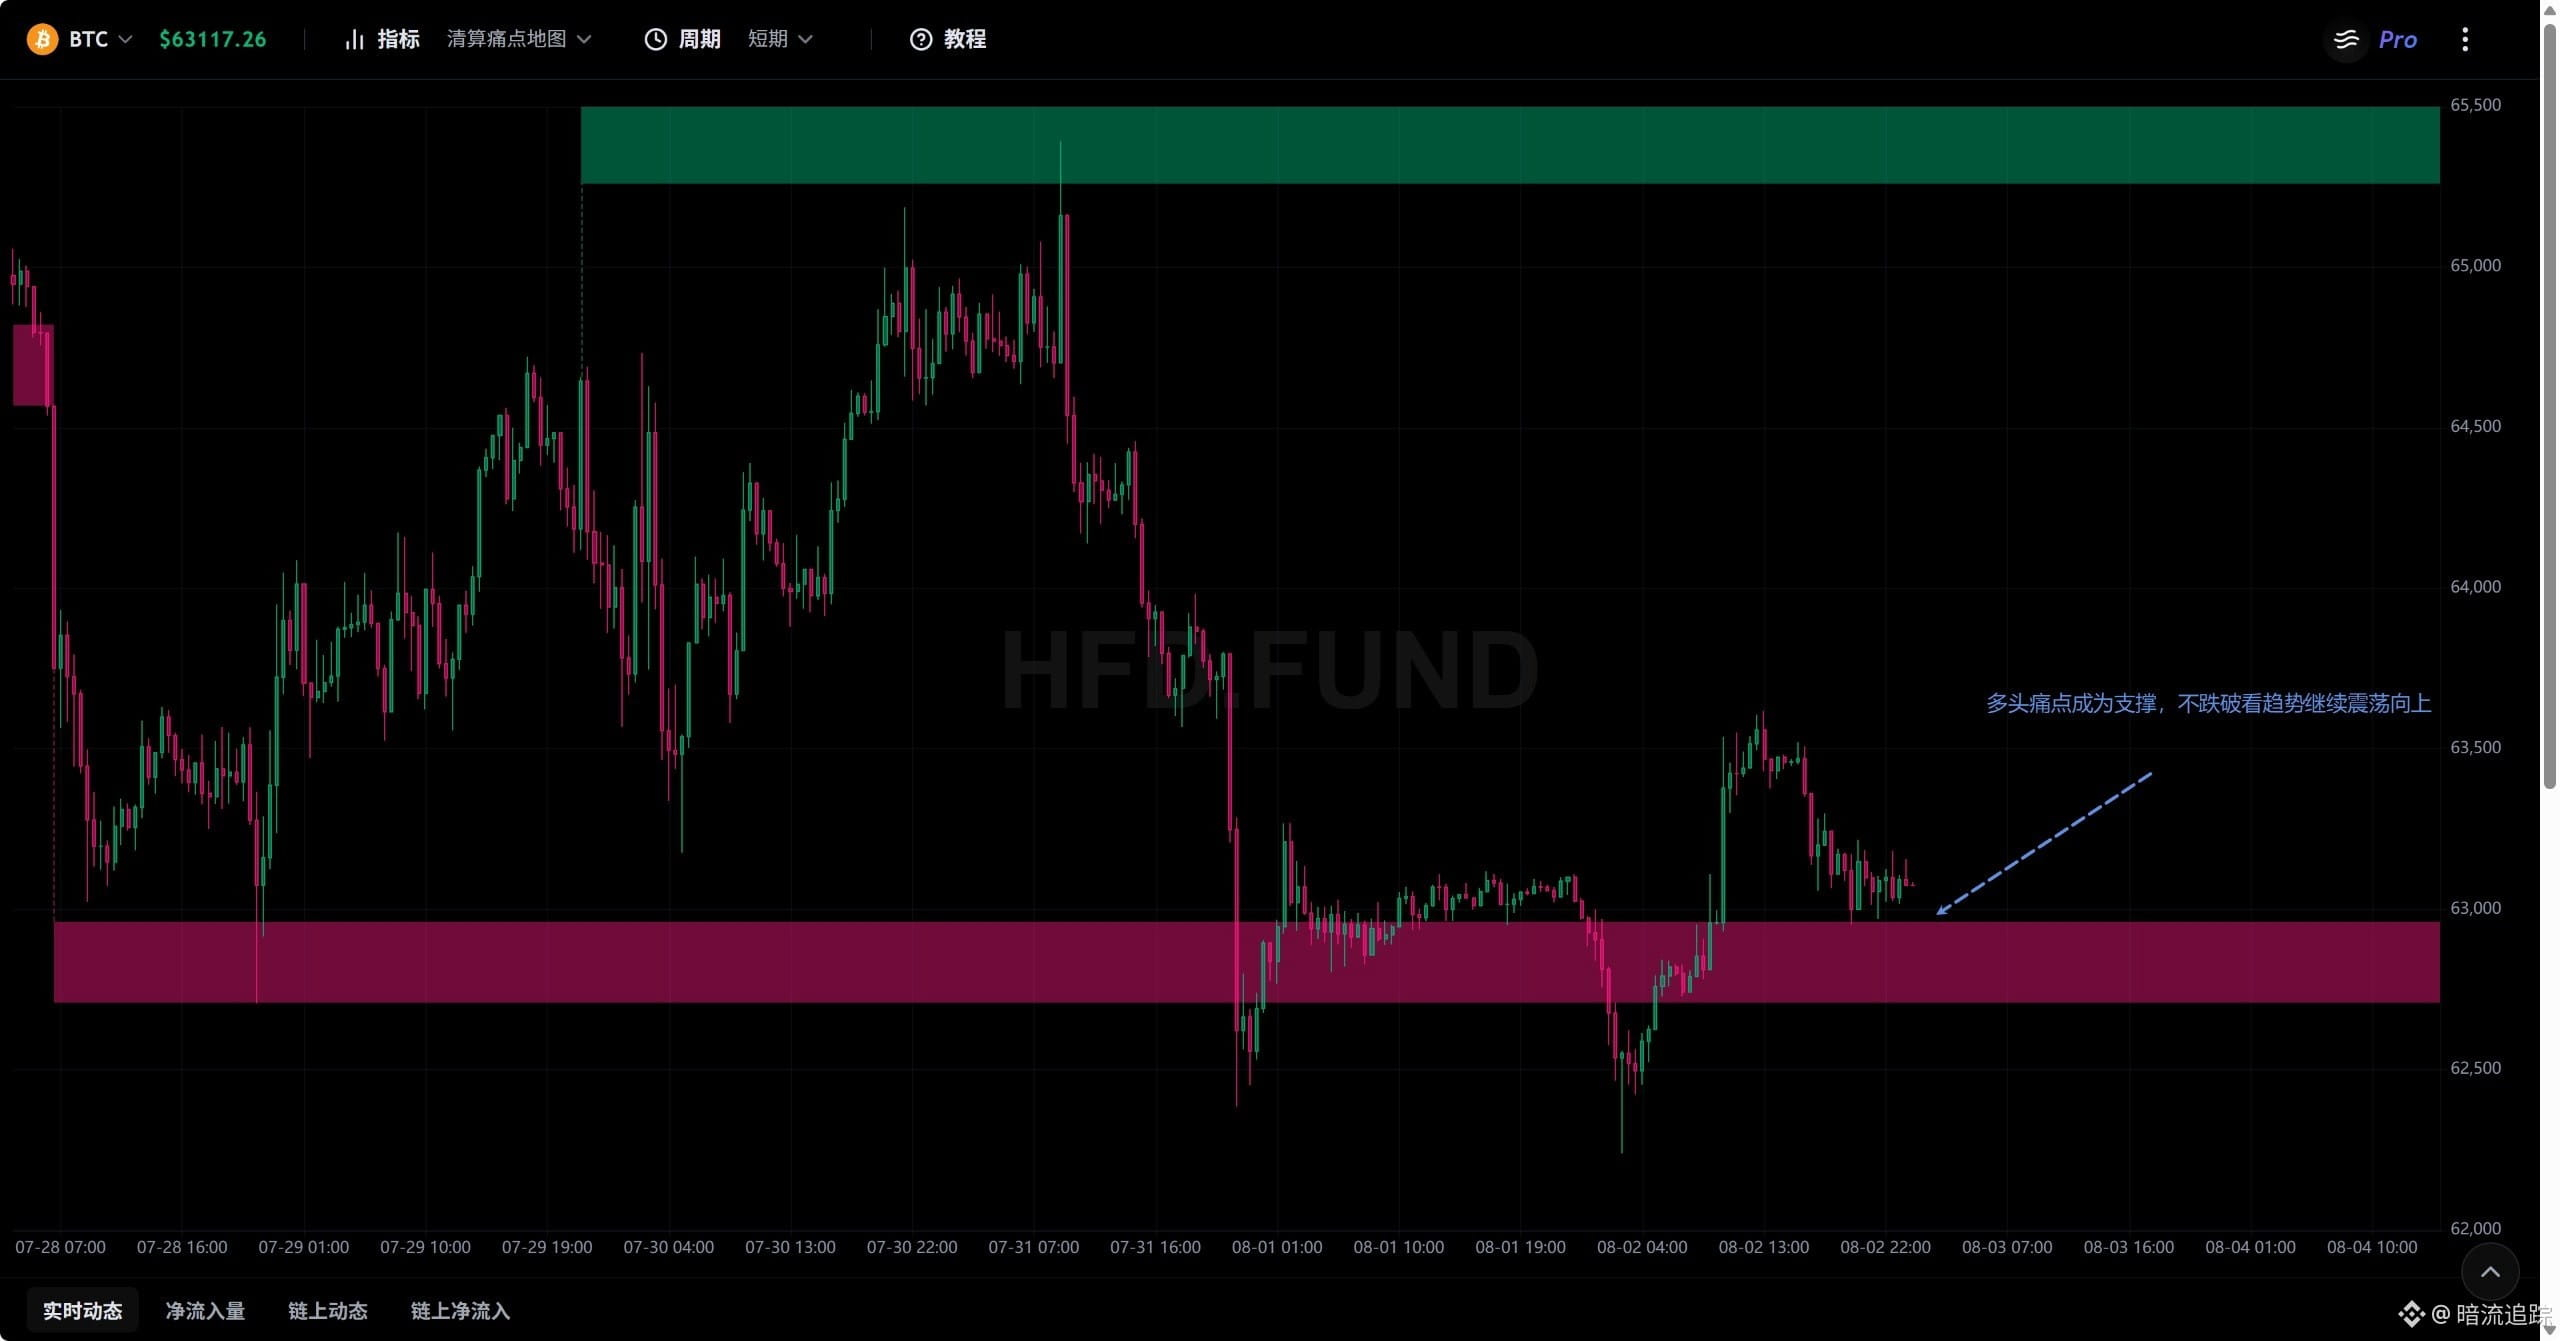
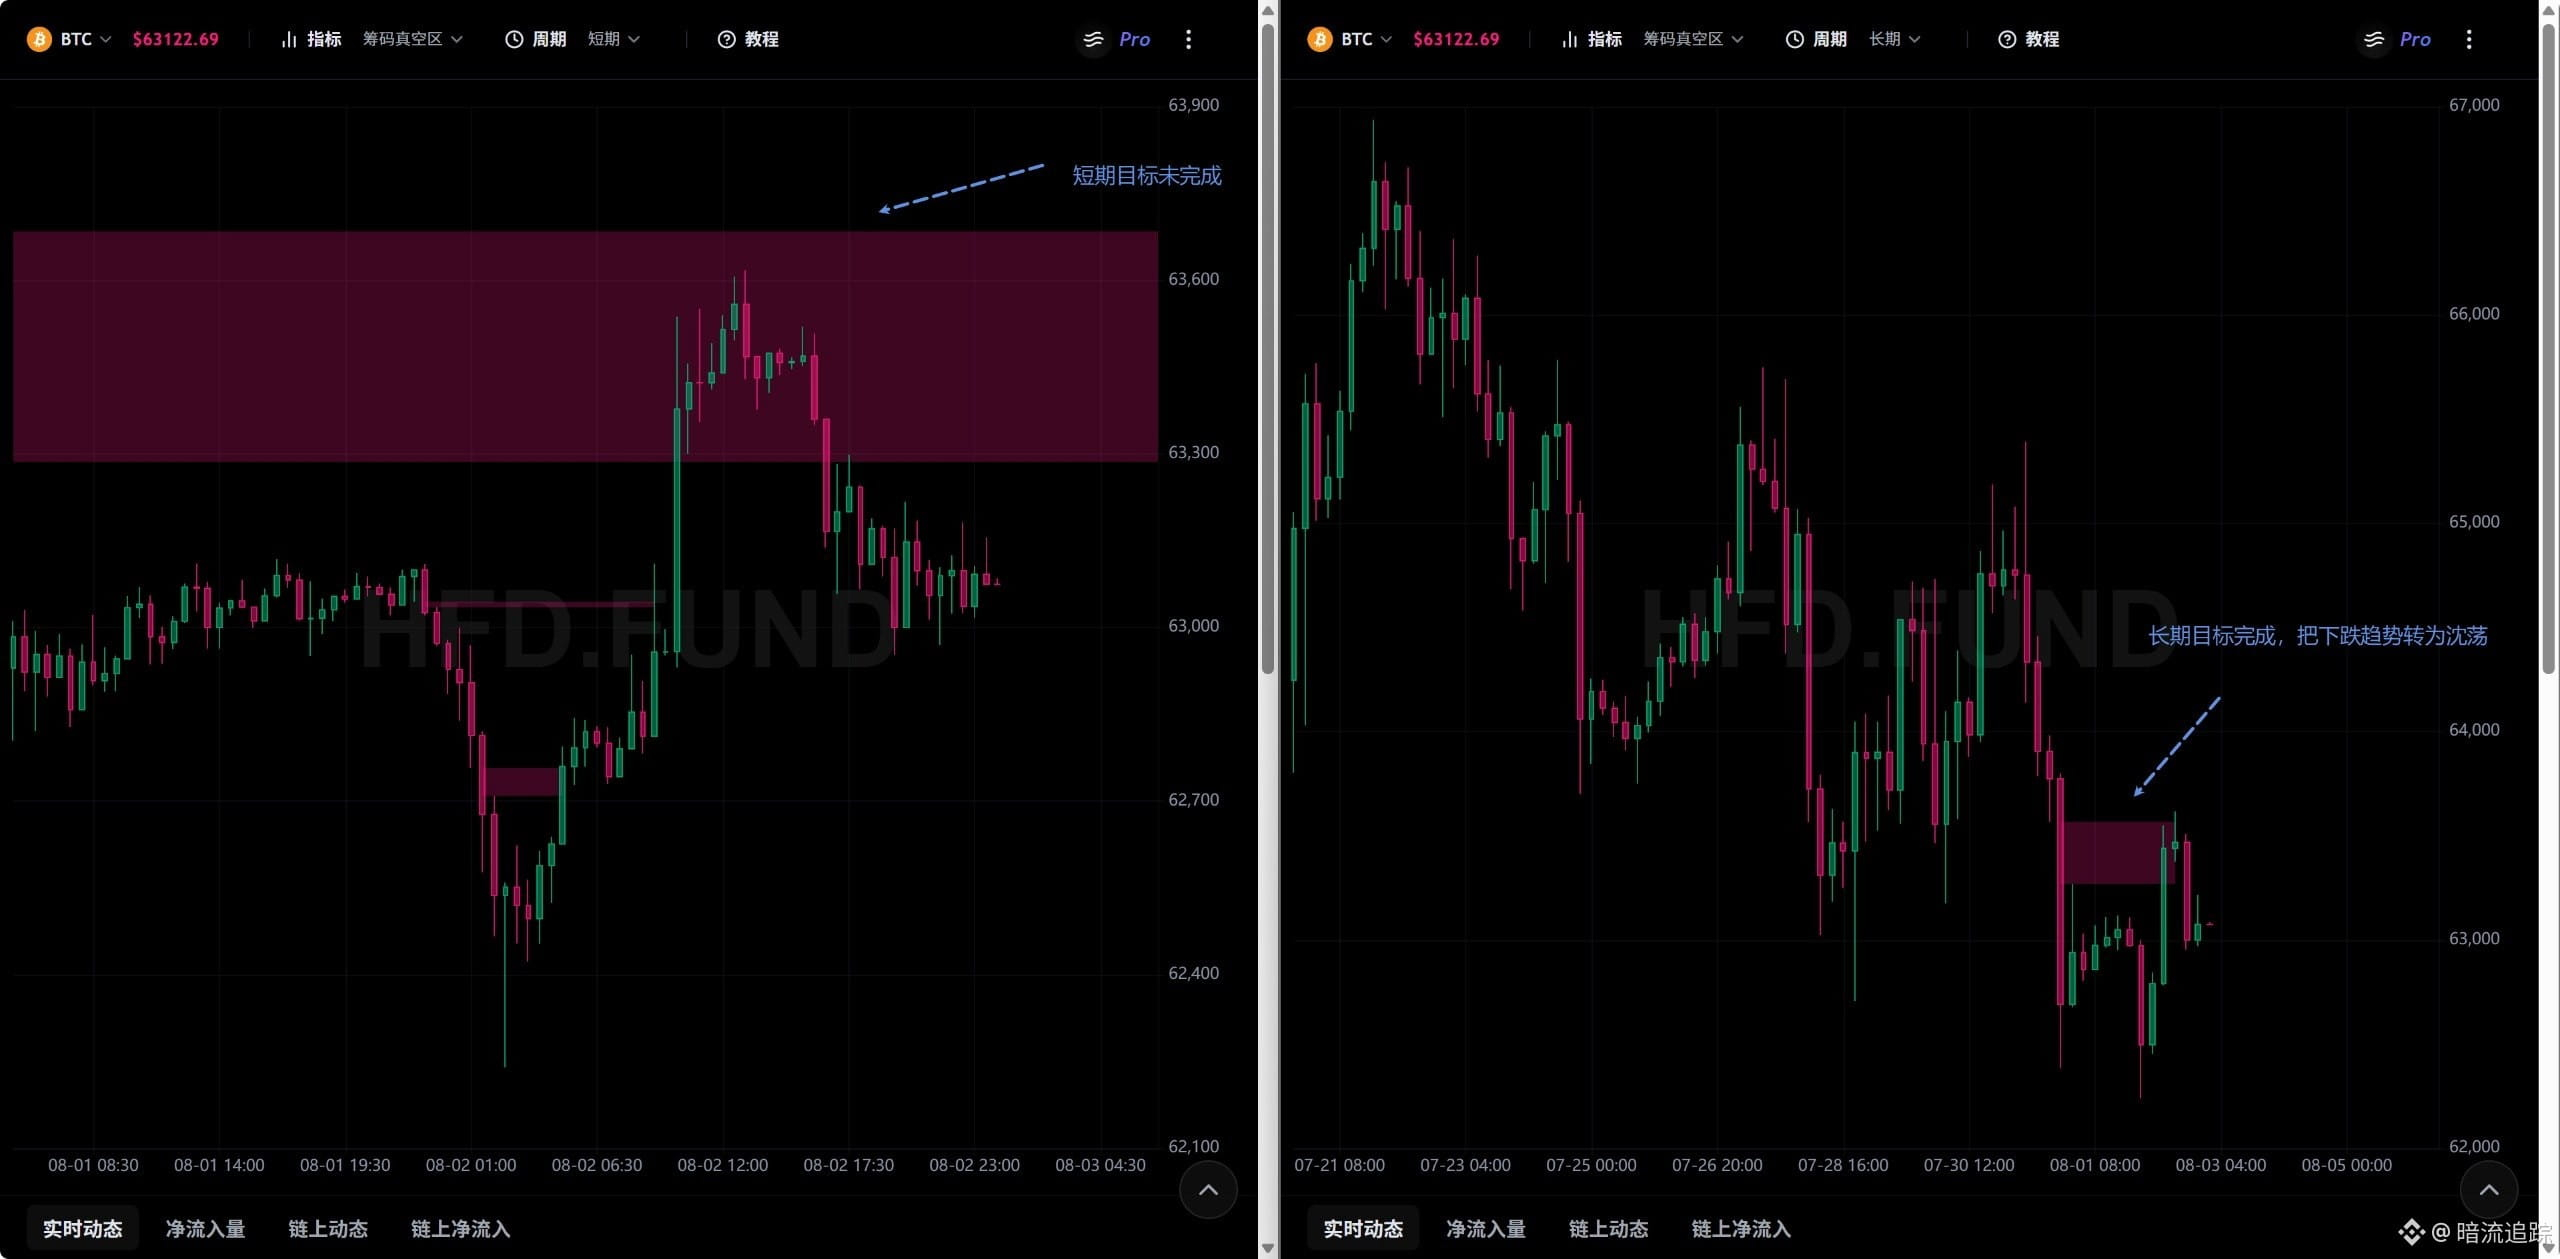
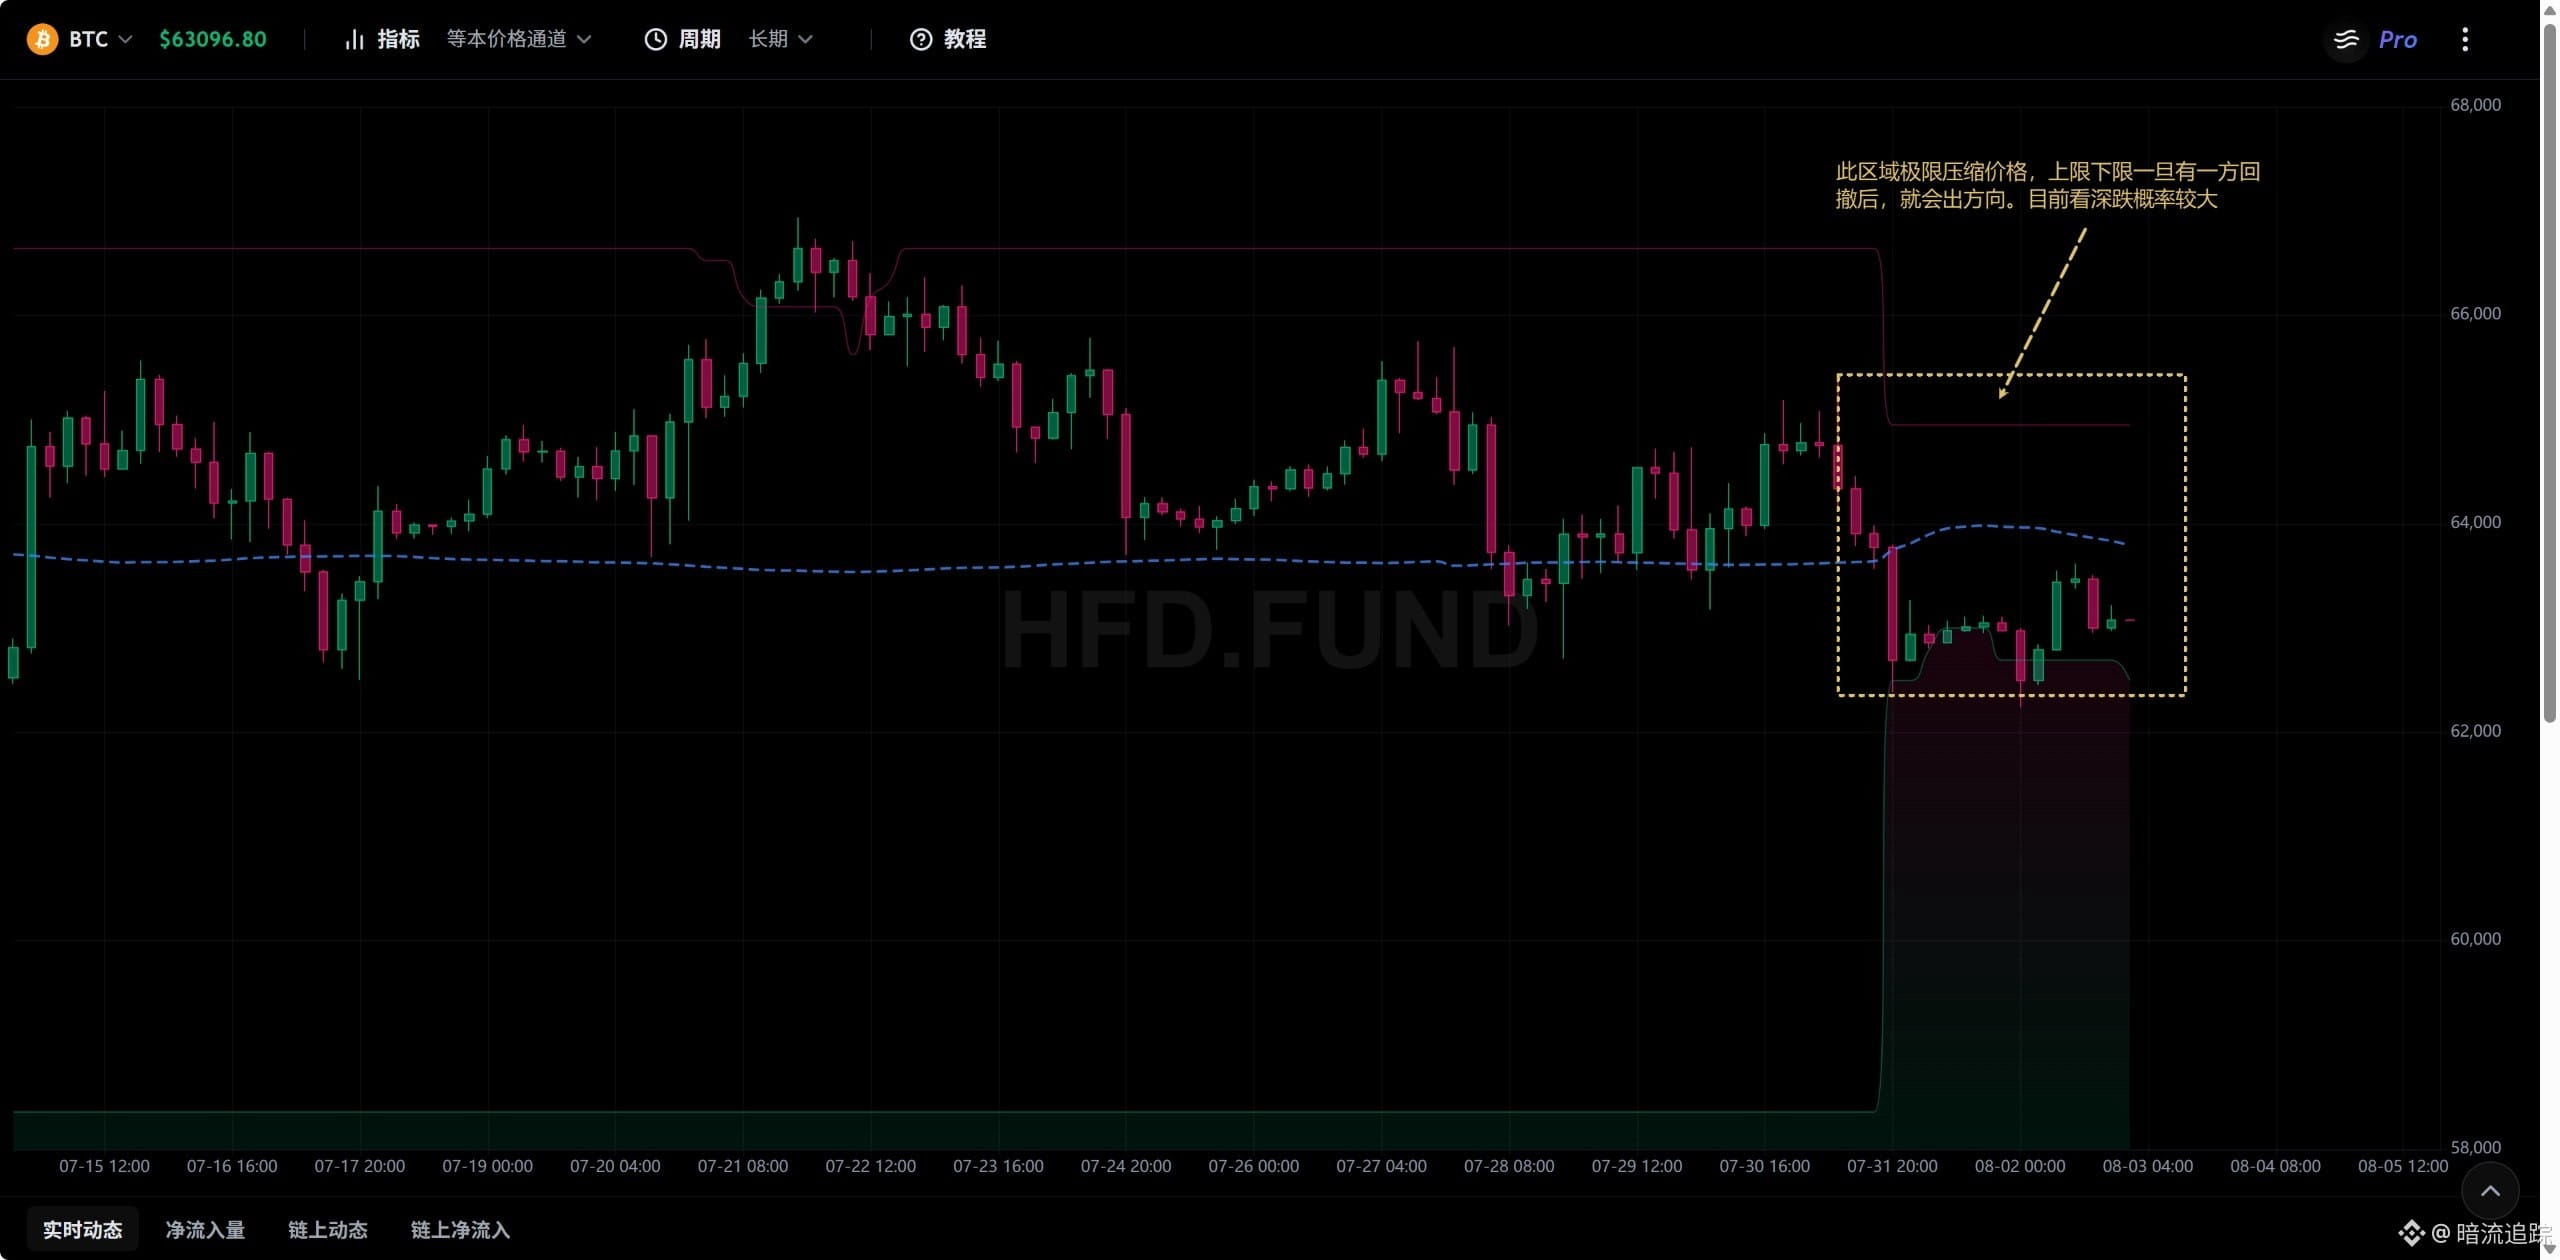
Summary:
Building on the previous section, prices are currently temporarily stabilizing, entering a period of consolidation. After the consolidation, the price will likely experience a small rebound.
Next price projections:
62711-62967 will undergo consolidation for some time. After that, once it holds above 62967, there will be a brief rebound, rising to 63200-63500, with the extreme scenario breaking through 63700.
Previous price projections:
Around 64540, prices consolidate and then break through 65161-65300, with the extreme scenario breaking through 65518. After breaking through, it may pull back to around 64200, or even briefly spike to 63800. However, because the moving-average line provides support, the price would likely return to around 64500 and consolidate again.
Actual price movement:
After consolidating around 64540, the price spiked up to 65391 and then started to fall. After consolidating around 64400, it directly broke below 63800, and is now around 62800.
Next price movement:
Comprehensive analysis:
Liquidation pain point: 62711-62967 need a longer period of consolidation and turnover to complete the shakeout. Only after holding firmly above 62967 can we consider the downtrend to be ending.
Chip vacuum: There is a possibility of a rebound back to 63500 during the ongoing downtrend.
Price channel: The support line is around 61800, but prices have already fallen below the average price level of 63500. The market will move back toward the average, so the trend is expected to gradually stabilize and move toward 63500. However, when selling pressure appears, the price may slide toward 61800 at any time.
Institutional volume-price order blocks: In the medium term, there is a trend of accumulating positions and building a base through consolidation. It may not temporarily break below 62230 or 61897.
Limit order absorption: The bears are attacking. But as the attack pauses, the market will freely slide toward 63249 and 63797.
Overall:
The target for liquidation-driven liquidity has been completed, and price needs to return to around the average price of 63500.
During the return, it first needs a longer period of consolidation and turnover in the higher-liquidity zone of 62711-62967.
After holding above 62967, the gap will likely fill with prices returning to 63200-63500, and the extreme case may spike to 63700.
The lower support area around 61800 aligns with both accumulation limit orders and the lower bound of price, forming strong support. Even though the accumulation limit orders are attractive, it’s more likely to be a defensive base-building phase.
Building on the previous section, prices are currently temporarily stabilizing, entering a period of consolidation. After the consolidation, the price will likely experience a small rebound.
Next price projections:
62711-62967 will undergo consolidation for some time. After that, once it holds above 62967, there will be a brief rebound, rising to 63200-63500, with the extreme scenario breaking through 63700.
Previous price projections:
Around 64540, prices consolidate and then break through 65161-65300, with the extreme scenario breaking through 65518. After breaking through, it may pull back to around 64200, or even briefly spike to 63800. However, because the moving-average line provides support, the price would likely return to around 64500 and consolidate again.
Actual price movement:
After consolidating around 64540, the price spiked up to 65391 and then started to fall. After consolidating around 64400, it directly broke below 63800, and is now around 62800.
Next price movement:
Comprehensive analysis:
Liquidation pain point: 62711-62967 need a longer period of consolidation and turnover to complete the shakeout. Only after holding firmly above 62967 can we consider the downtrend to be ending.
Chip vacuum: There is a possibility of a rebound back to 63500 during the ongoing downtrend.
Price channel: The support line is around 61800, but prices have already fallen below the average price level of 63500. The market will move back toward the average, so the trend is expected to gradually stabilize and move toward 63500. However, when selling pressure appears, the price may slide toward 61800 at any time.
Institutional volume-price order blocks: In the medium term, there is a trend of accumulating positions and building a base through consolidation. It may not temporarily break below 62230 or 61897.
Limit order absorption: The bears are attacking. But as the attack pauses, the market will freely slide toward 63249 and 63797.
Overall:
The target for liquidation-driven liquidity has been completed, and price needs to return to around the average price of 63500.
During the return, it first needs a longer period of consolidation and turnover in the higher-liquidity zone of 62711-62967.
After holding above 62967, the gap will likely fill with prices returning to 63200-63500, and the extreme case may spike to 63700.
The lower support area around 61800 aligns with both accumulation limit orders and the lower bound of price, forming strong support. Even though the accumulation limit orders are attractive, it’s more likely to be a defensive base-building phase.
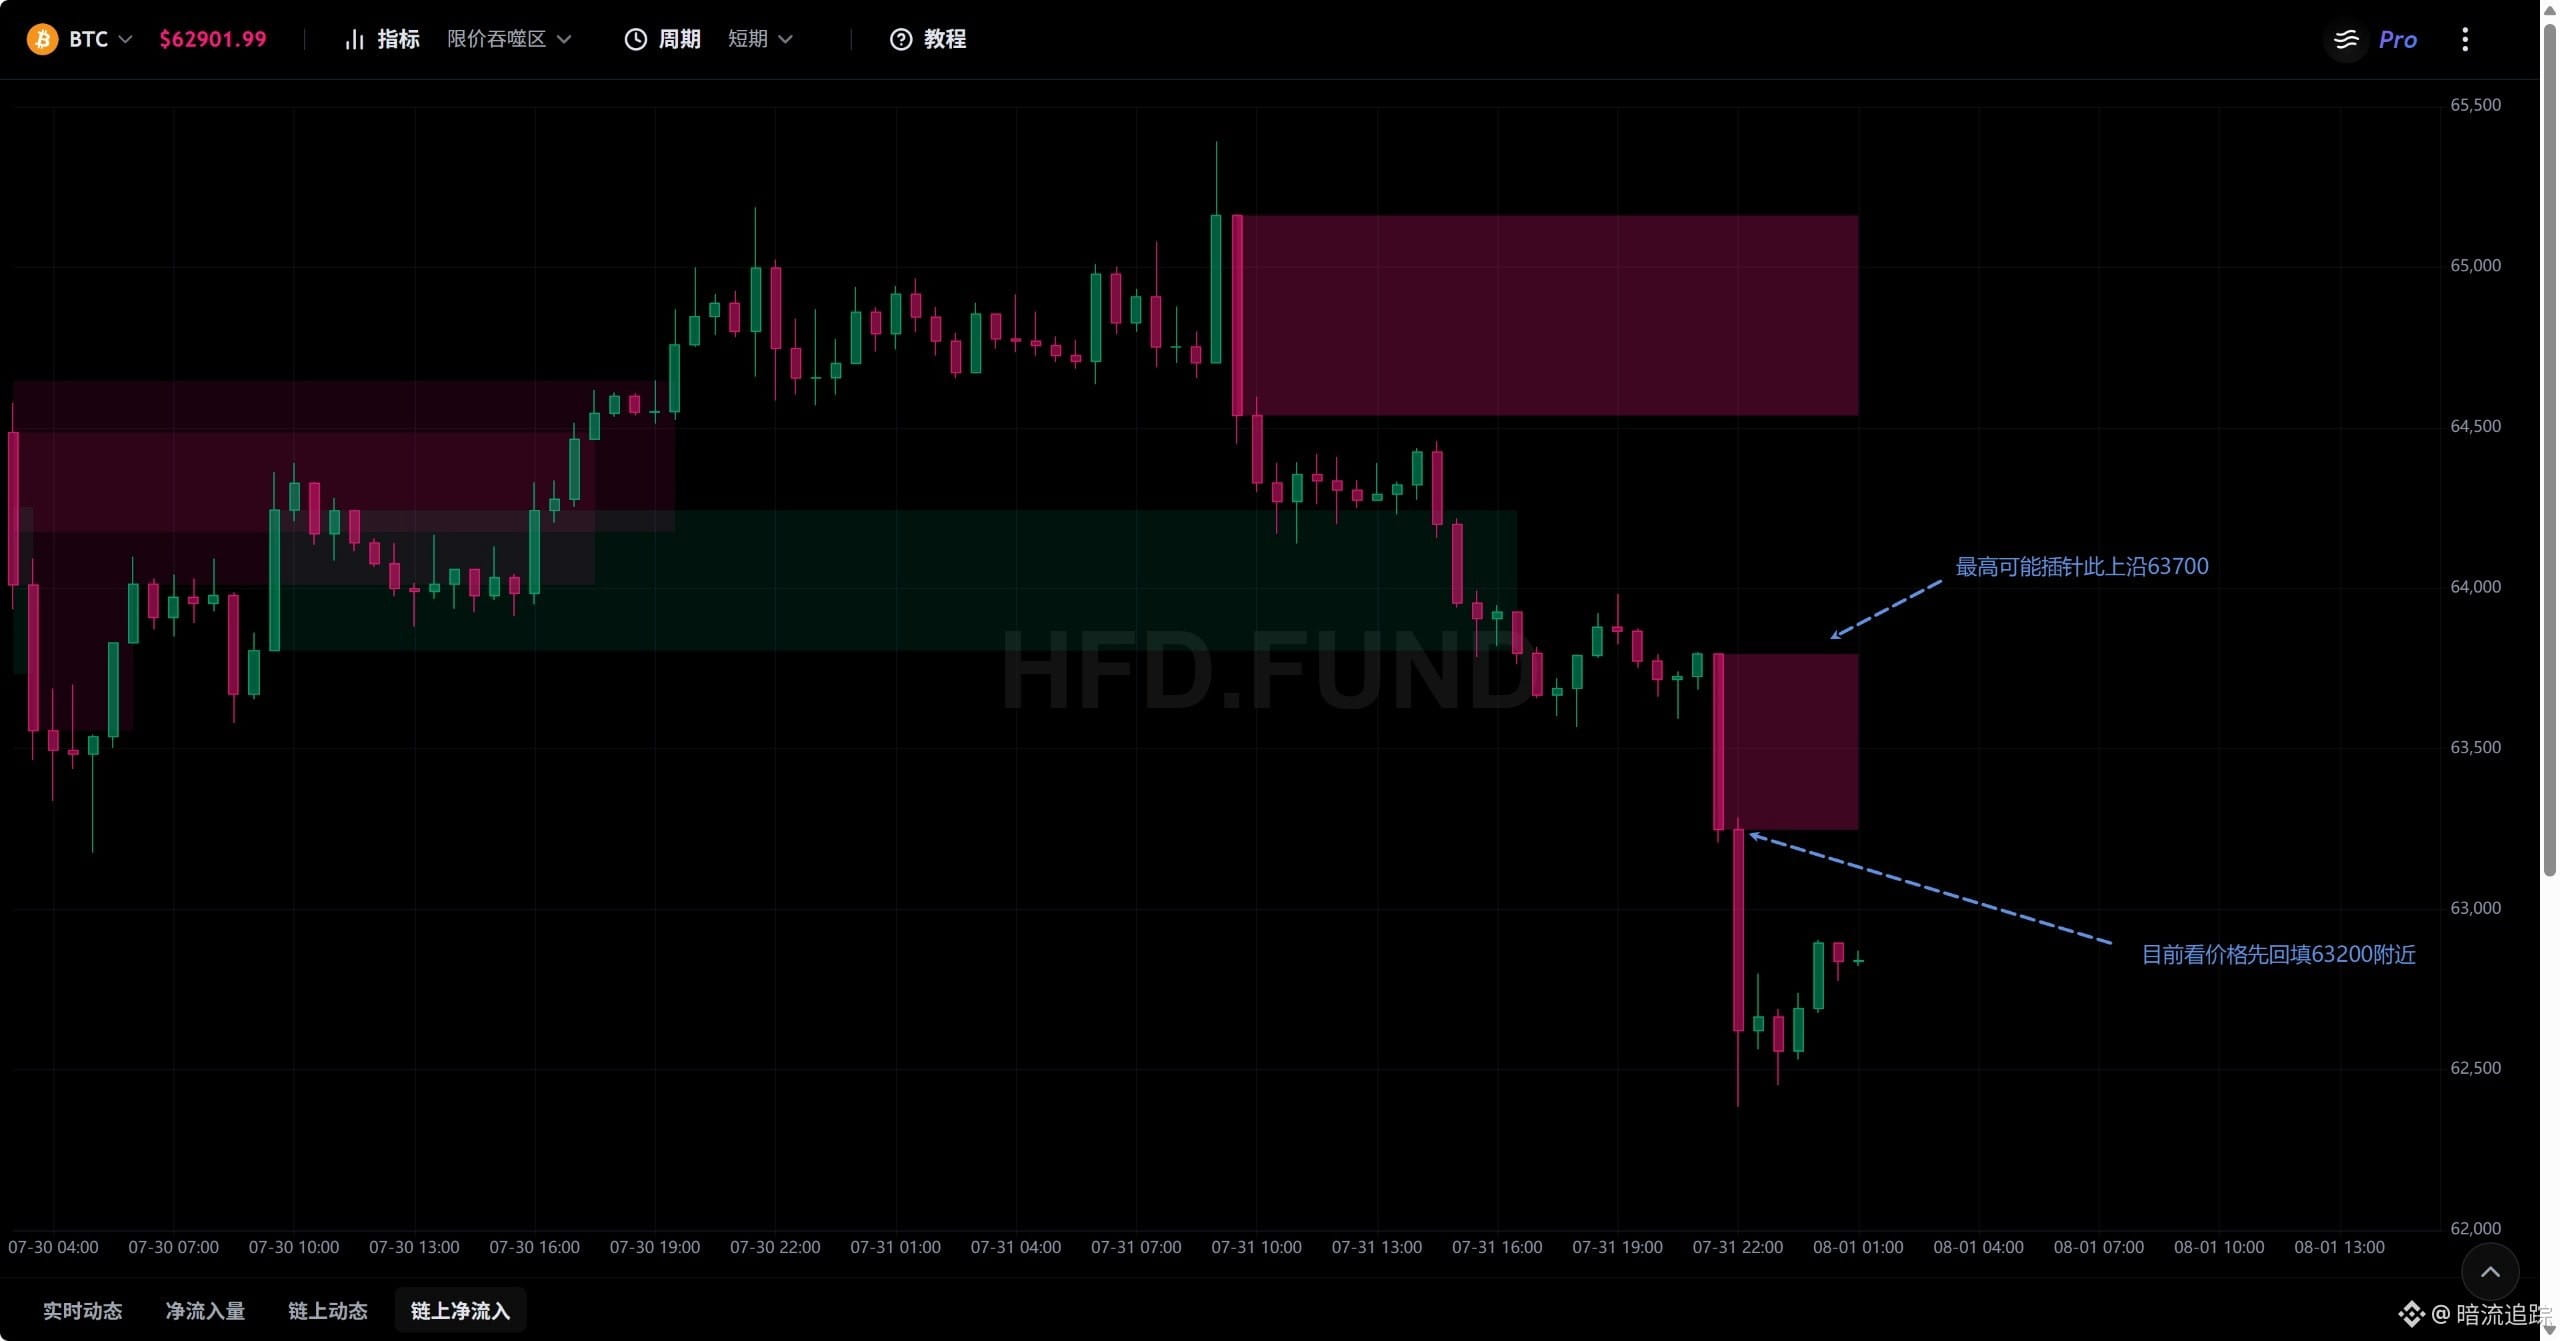
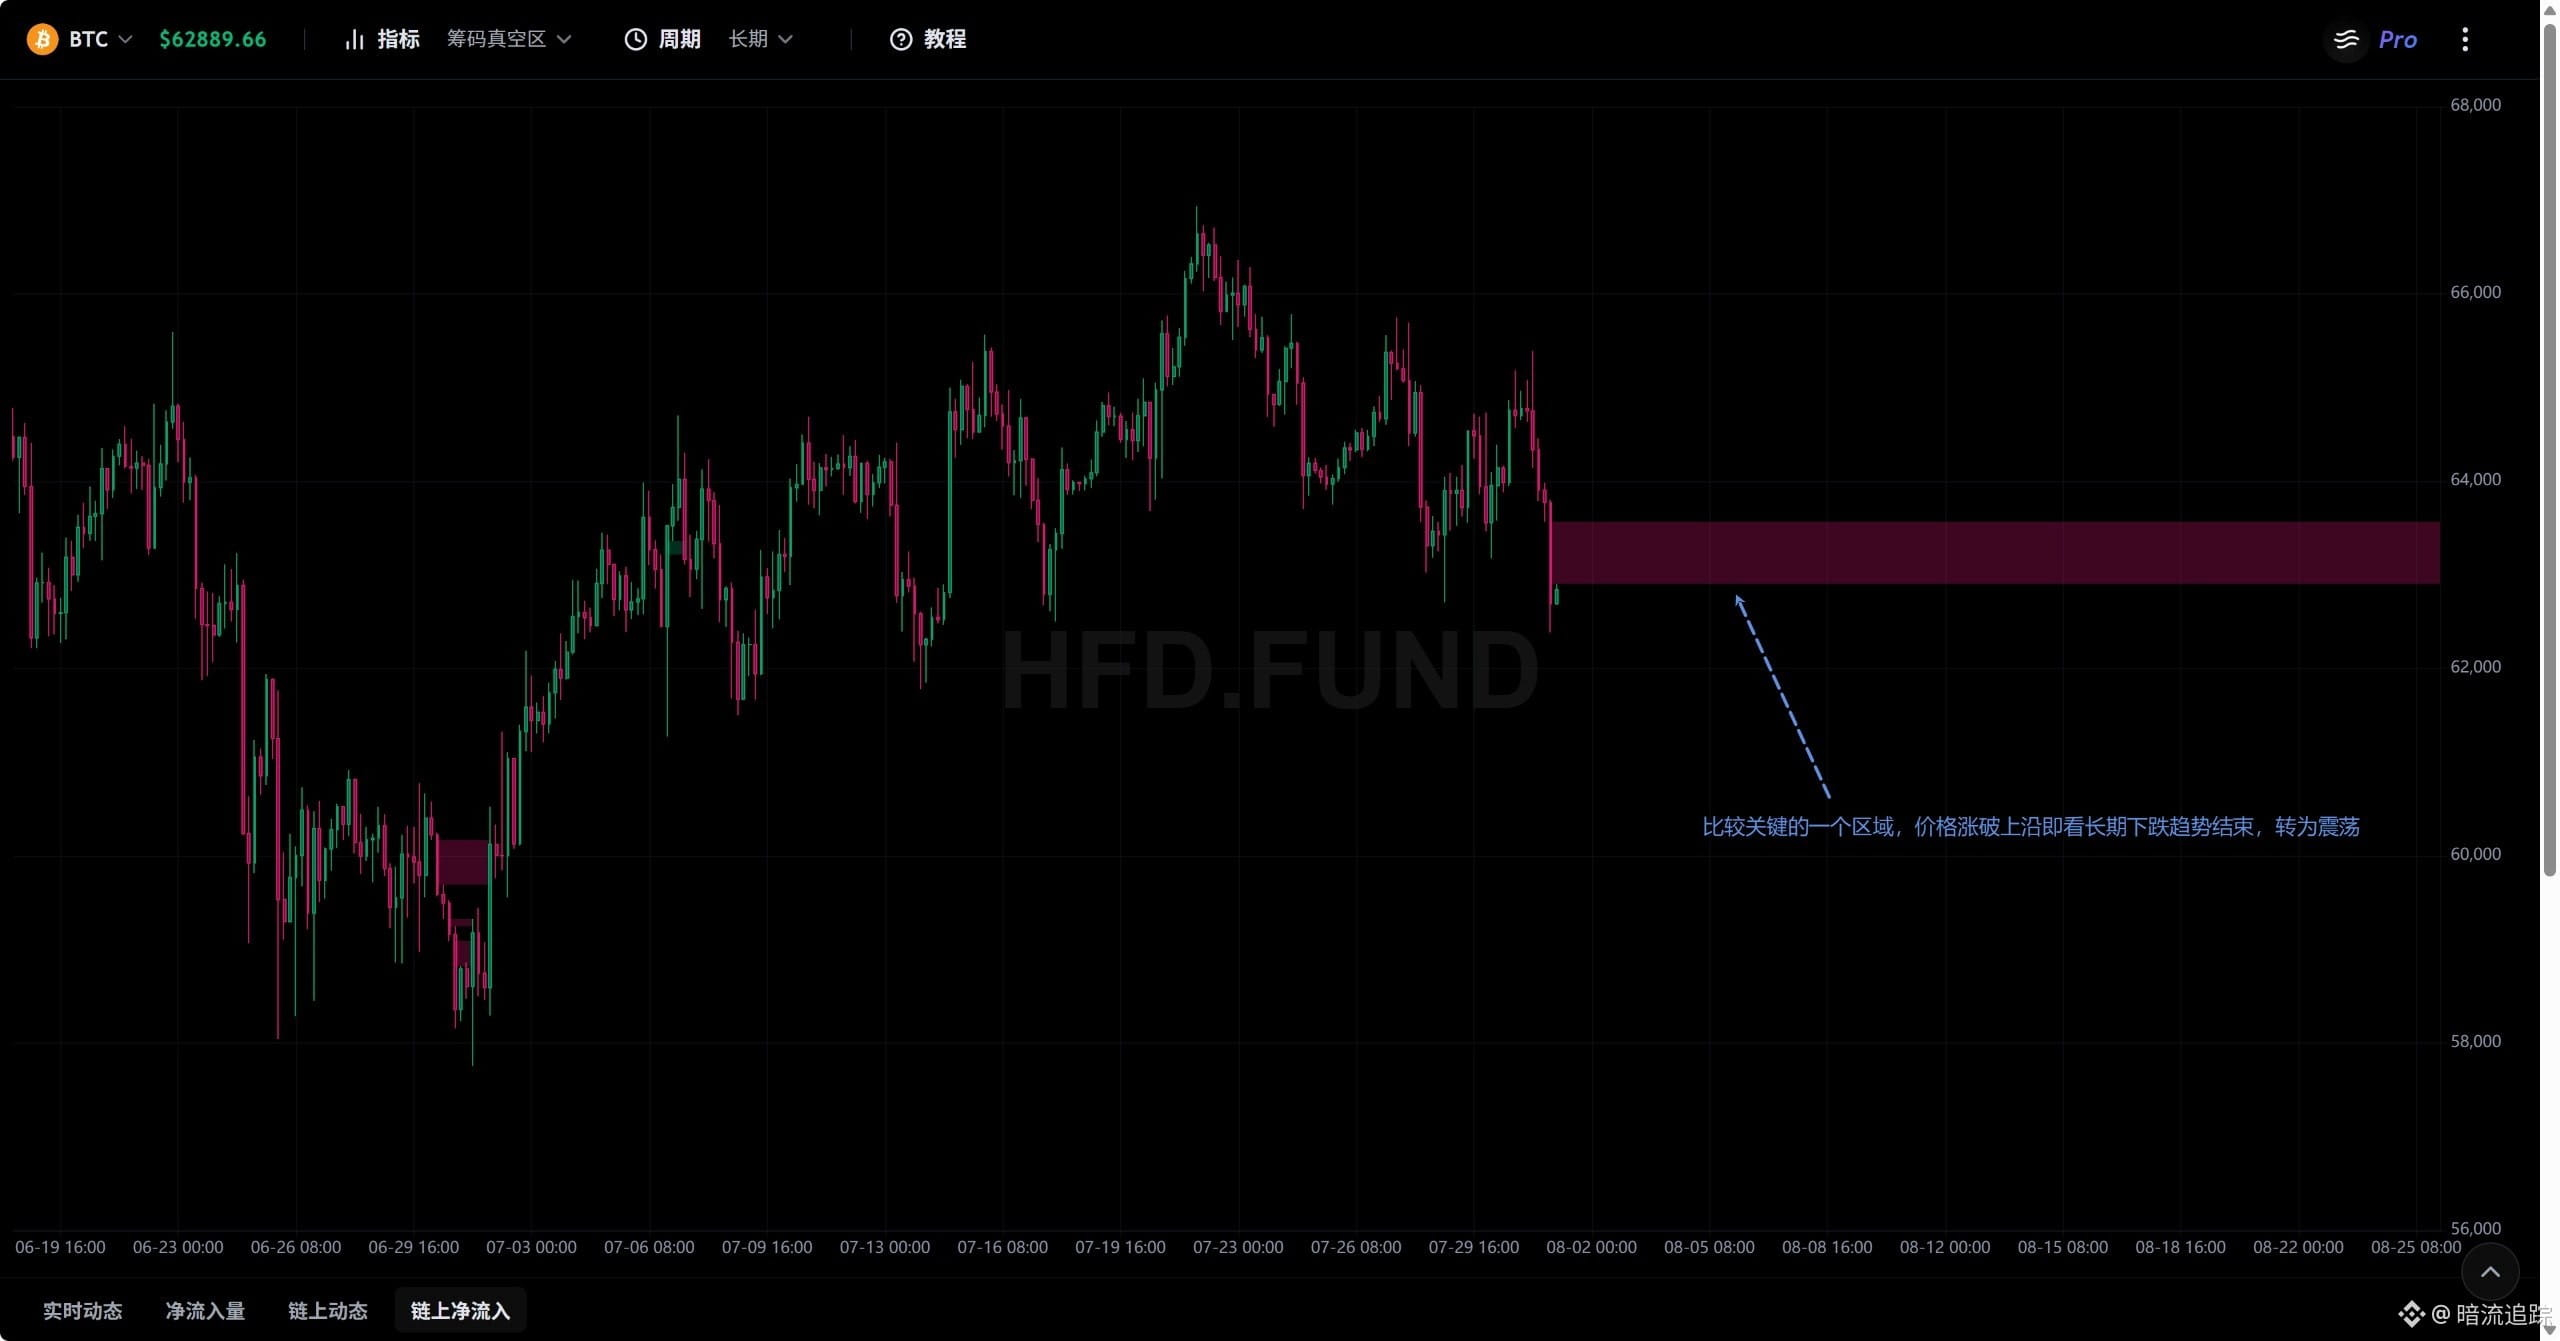
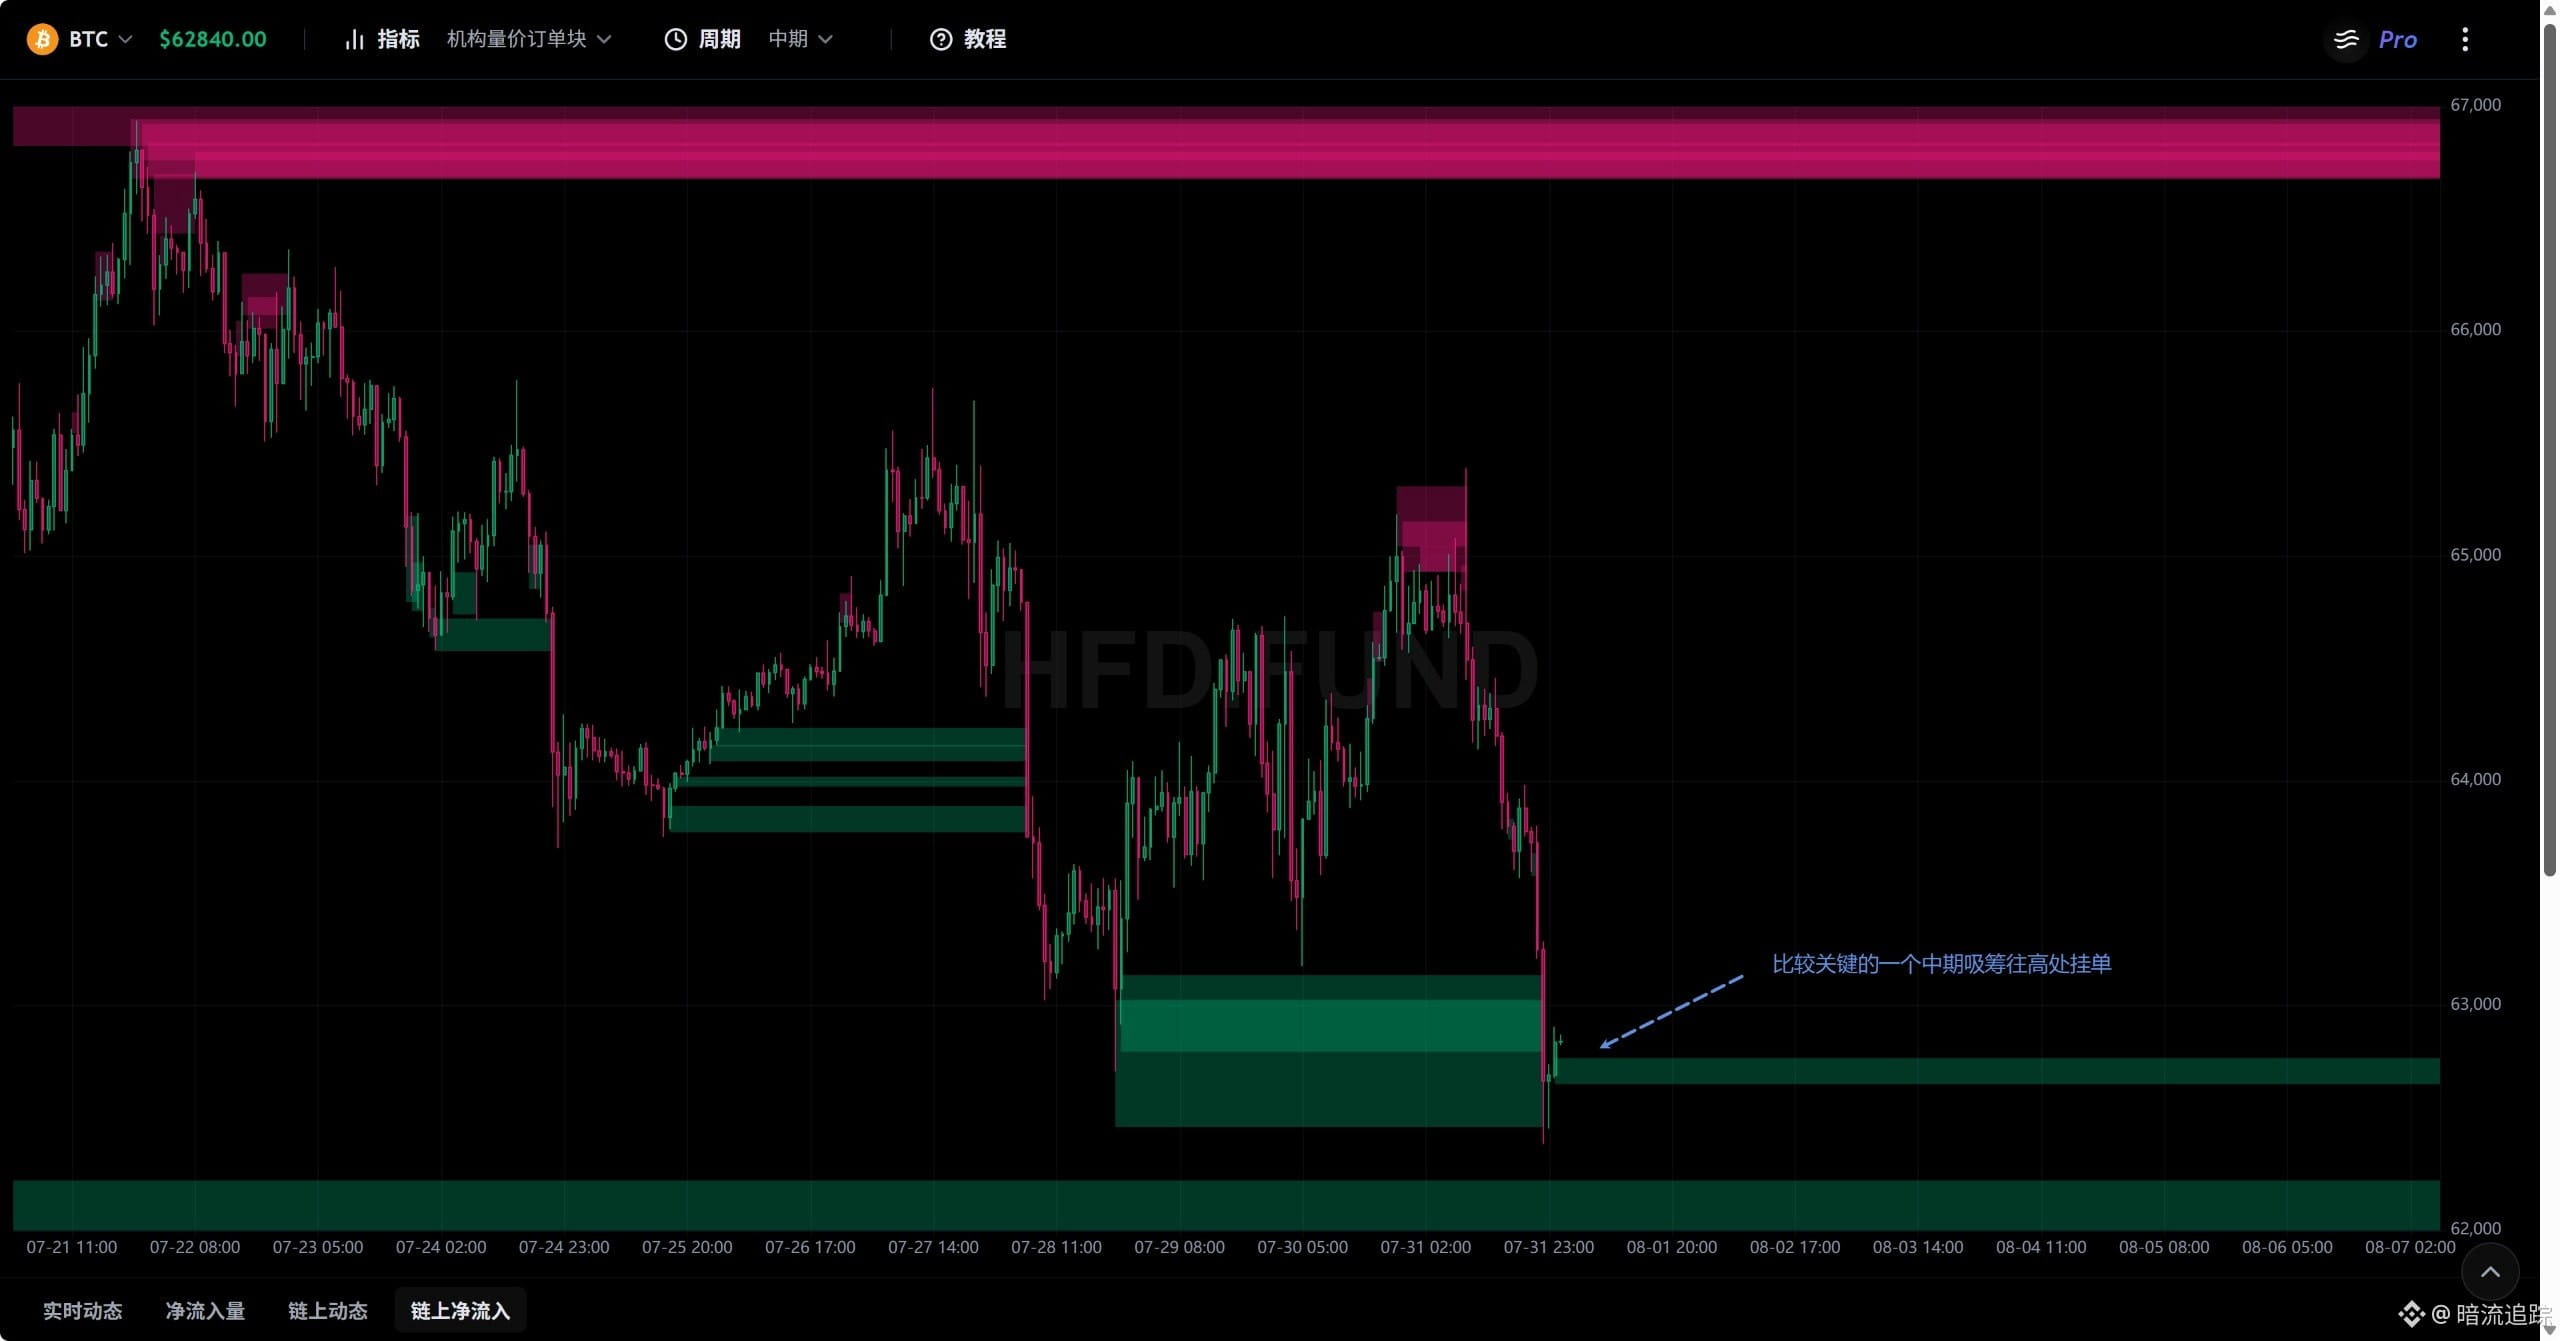
Summary:
Continuing from the previous discussion, after the shakeout the price rises, then falls back again.
Projected price movement:
After consolidating around 64540, the price breaks through 65161-65300, with an extreme breakthrough at 65518.
After breaking through, it may pull back to around 64200, or even wick down to 63800.
However, because the moving-average line provides support, it may retract and consolidate around 64500 again.
Previous price projection:
The price fluctuated around 63600. Later, there should be a slight rise: the first upward target is around 64200. After breaking through, it may further break through 64500, with an extreme wick to 64800. After the wick, it may pull back.
Actual price action:
The price rose from around 63600 to 64733, then pulled back to 63176. Now the price is back around 64800.
Next price action:
Liquidation pain points
In the short term, 65252-65518 is a relatively large short (bearish) pain point, with strong attraction.
And it has not been tested yet. Within the current broad range, this is the only pain point.
So there is a high probability that the price will be drawn toward this area, and will consolidate within this price band until it breaks through, after which it may pull back.
Order-flow void (chip vacuum)
In the short term, at 17:00 (last 30 days), longs begin their push from 64350-64450. So far, the upward long-push line has been filled—this means the upward trend has shifted into high-range consolidation.
In the medium term, starting from 16:00 longs begin their advance. The defense line is 64135-64534. Based on current conditions, the trend is still upward.
Looking at both cycles together: the longs’ push continues, so the price will keep rising.
Price channel
Same-amount short-term average: 63670; upper limit 70090; lower limit 58260.
Same-amount medium-term average: 63450; upper limit 66810; lower limit 59040.
Same-amount long-term average: 70210; lower limit 59300.
From this indicator, the current price is above the short- and medium-term averages. The medium-term average is moving up, so the trend continues upward.
Same-amount (this period) short-term average: 64540; upper limit 66230; lower limit 61870.
Same-amount (this period) medium-term average: 63630; upper limit 66810; lower limit 58310.
Same-amount (this period) long-term average: 63650; upper limit 66640; lower limit 58360.
From this indicator, the price has held above the average lines across three cycles, indicating an upward trend.
Combining both: the trend has held above the 64540 average, with the trend pointing upward. Here becomes the first support, and the second support is near 63500.
Institutional volume-price order blocks
In the short term, the distribution (sell) pending-order trend is to place orders upward, with the highest point around 65300. This suggests the trend may continue to wick upward toward 65300.
In the medium term, the distribution pending-order trend is downward. The latest pending order is 65161, and the highest pending order price is around 65300.
Continuing from the previous discussion, after the shakeout the price rises, then falls back again.
Projected price movement:
After consolidating around 64540, the price breaks through 65161-65300, with an extreme breakthrough at 65518.
After breaking through, it may pull back to around 64200, or even wick down to 63800.
However, because the moving-average line provides support, it may retract and consolidate around 64500 again.
Previous price projection:
The price fluctuated around 63600. Later, there should be a slight rise: the first upward target is around 64200. After breaking through, it may further break through 64500, with an extreme wick to 64800. After the wick, it may pull back.
Actual price action:
The price rose from around 63600 to 64733, then pulled back to 63176. Now the price is back around 64800.
Next price action:
Liquidation pain points
In the short term, 65252-65518 is a relatively large short (bearish) pain point, with strong attraction.
And it has not been tested yet. Within the current broad range, this is the only pain point.
So there is a high probability that the price will be drawn toward this area, and will consolidate within this price band until it breaks through, after which it may pull back.
Order-flow void (chip vacuum)
In the short term, at 17:00 (last 30 days), longs begin their push from 64350-64450. So far, the upward long-push line has been filled—this means the upward trend has shifted into high-range consolidation.
In the medium term, starting from 16:00 longs begin their advance. The defense line is 64135-64534. Based on current conditions, the trend is still upward.
Looking at both cycles together: the longs’ push continues, so the price will keep rising.
Price channel
Same-amount short-term average: 63670; upper limit 70090; lower limit 58260.
Same-amount medium-term average: 63450; upper limit 66810; lower limit 59040.
Same-amount long-term average: 70210; lower limit 59300.
From this indicator, the current price is above the short- and medium-term averages. The medium-term average is moving up, so the trend continues upward.
Same-amount (this period) short-term average: 64540; upper limit 66230; lower limit 61870.
Same-amount (this period) medium-term average: 63630; upper limit 66810; lower limit 58310.
Same-amount (this period) long-term average: 63650; upper limit 66640; lower limit 58360.
From this indicator, the price has held above the average lines across three cycles, indicating an upward trend.
Combining both: the trend has held above the 64540 average, with the trend pointing upward. Here becomes the first support, and the second support is near 63500.
Institutional volume-price order blocks
In the short term, the distribution (sell) pending-order trend is to place orders upward, with the highest point around 65300. This suggests the trend may continue to wick upward toward 65300.
In the medium term, the distribution pending-order trend is downward. The latest pending order is 65161, and the highest pending order price is around 65300.
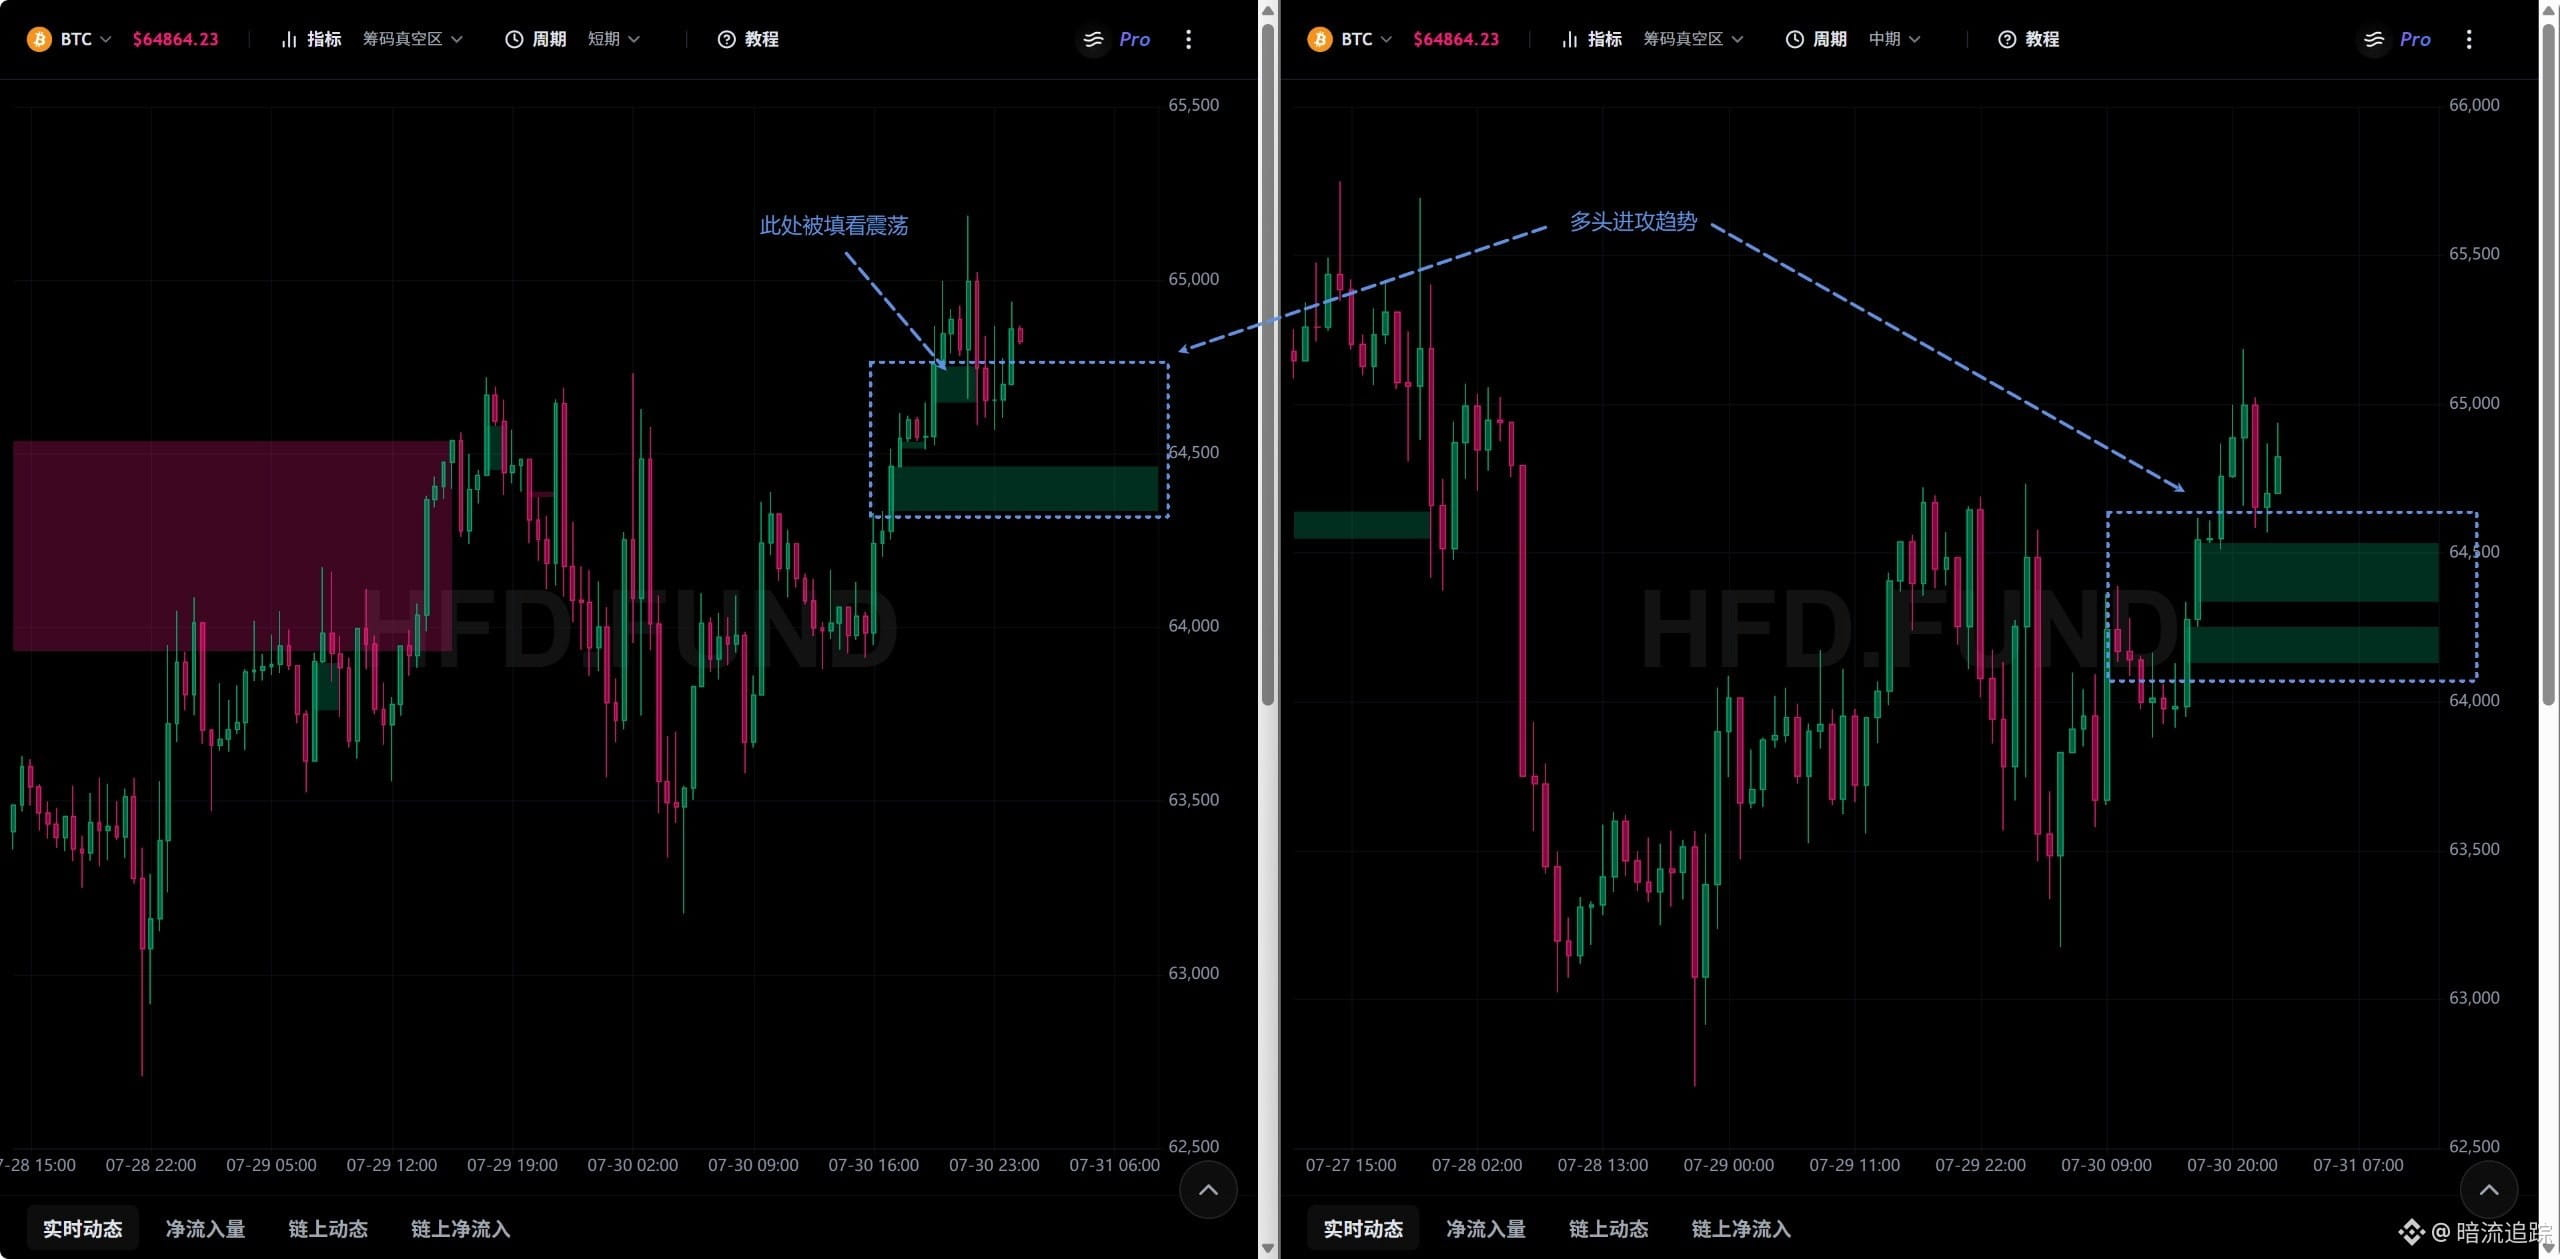
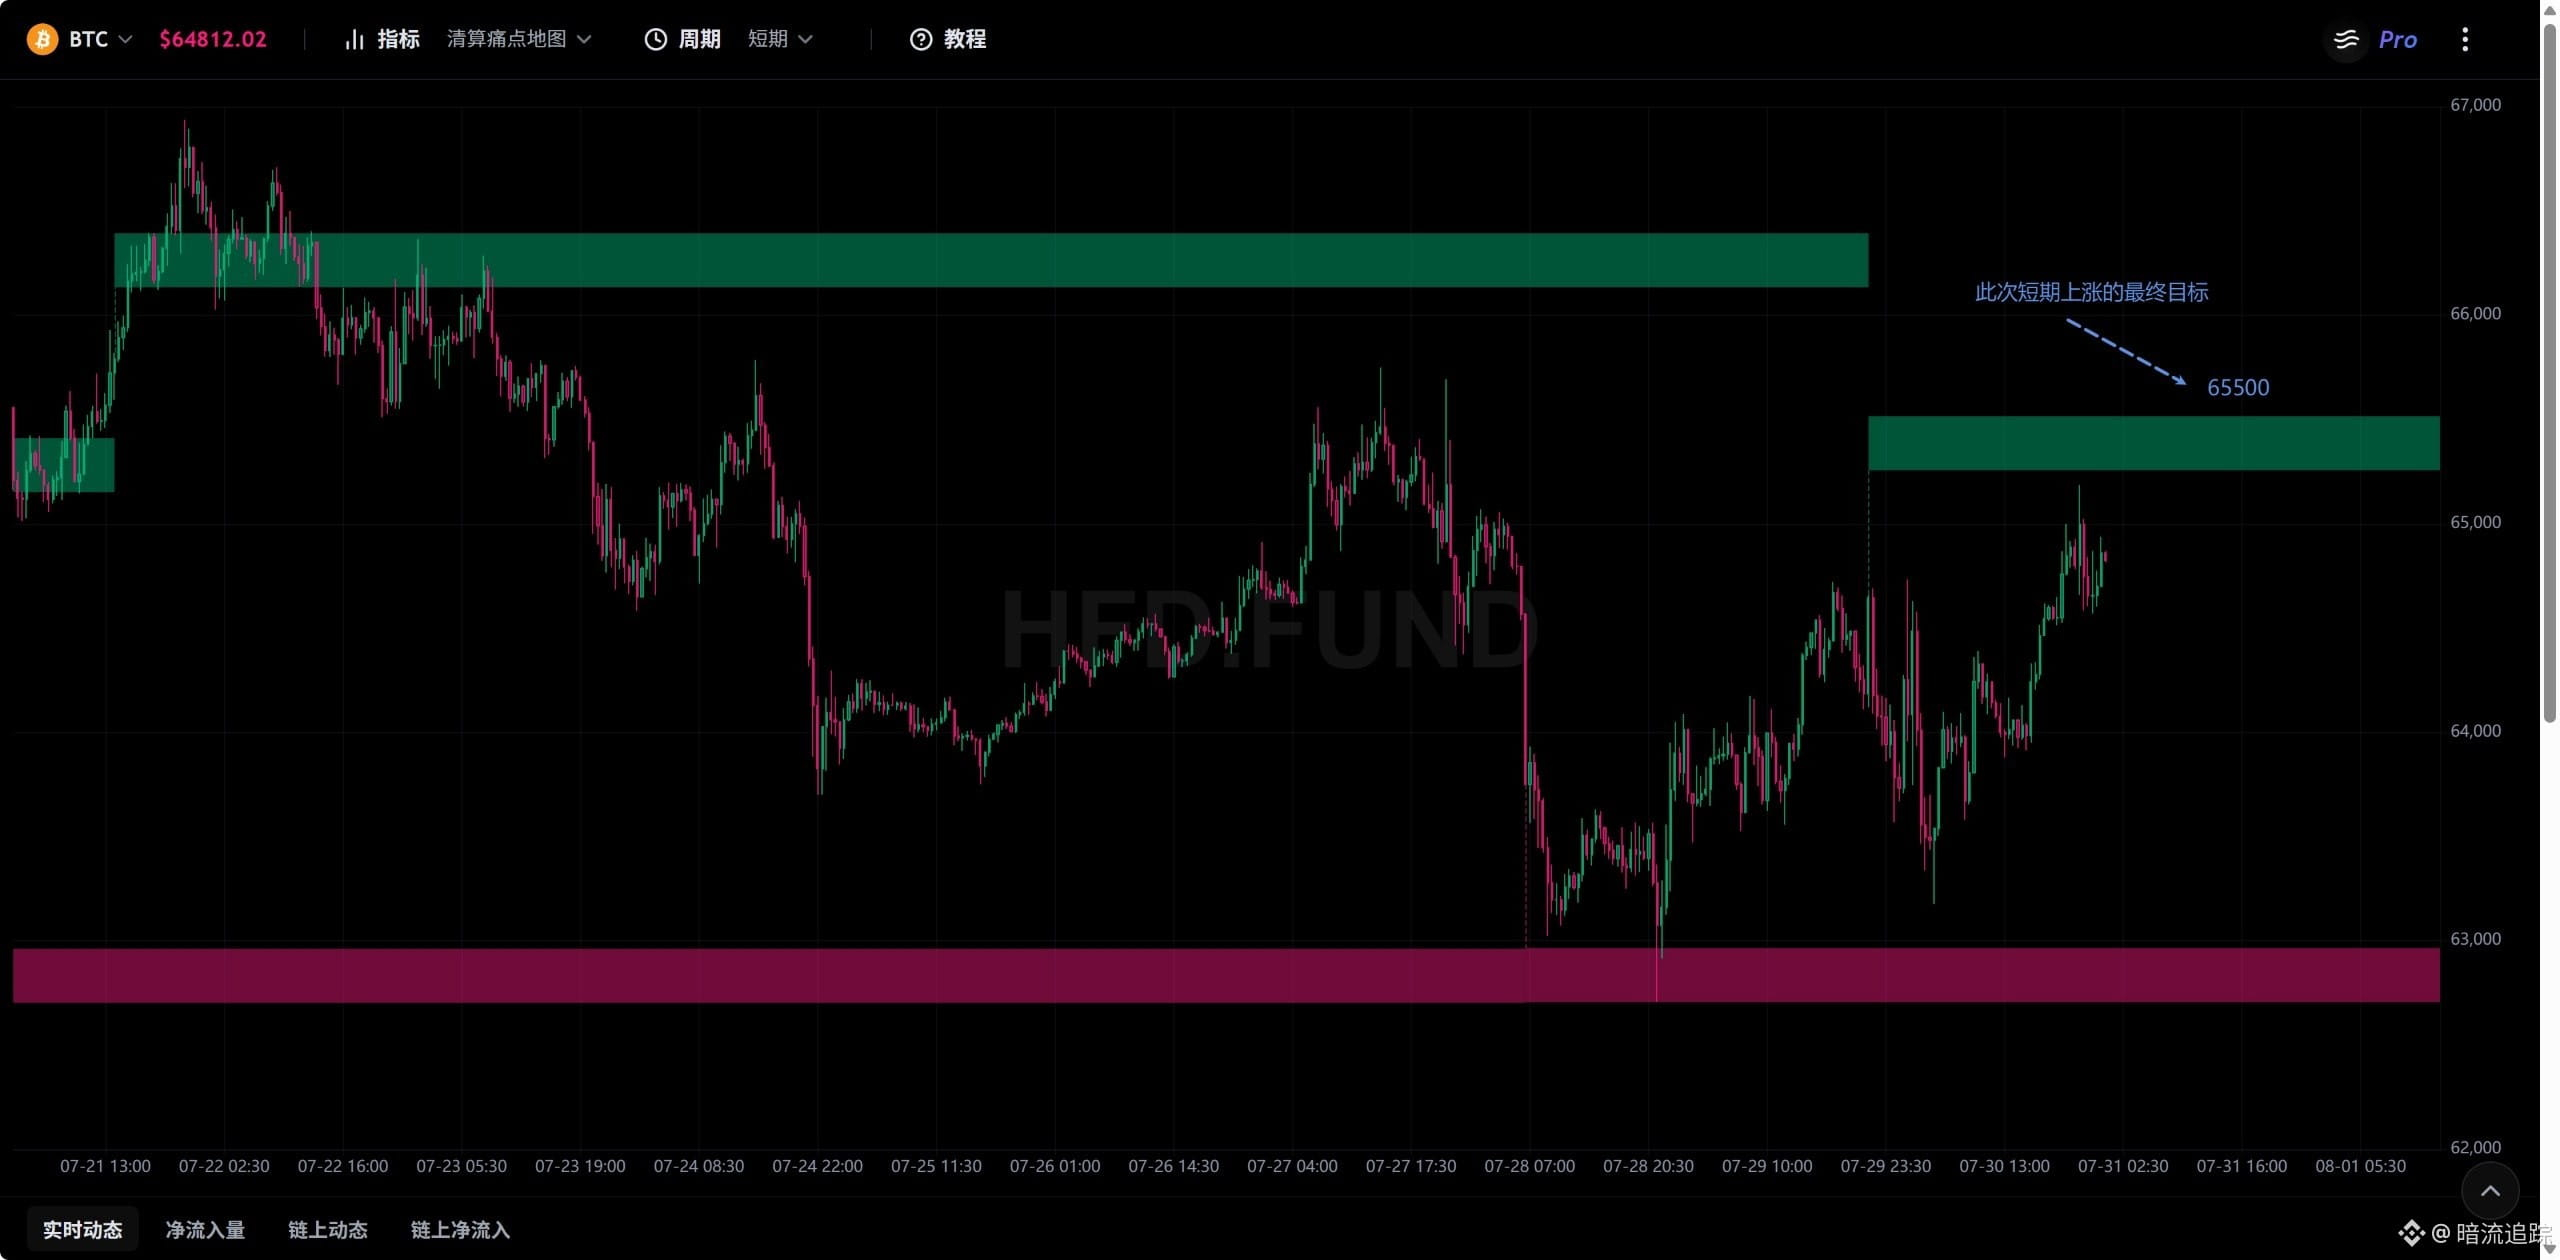
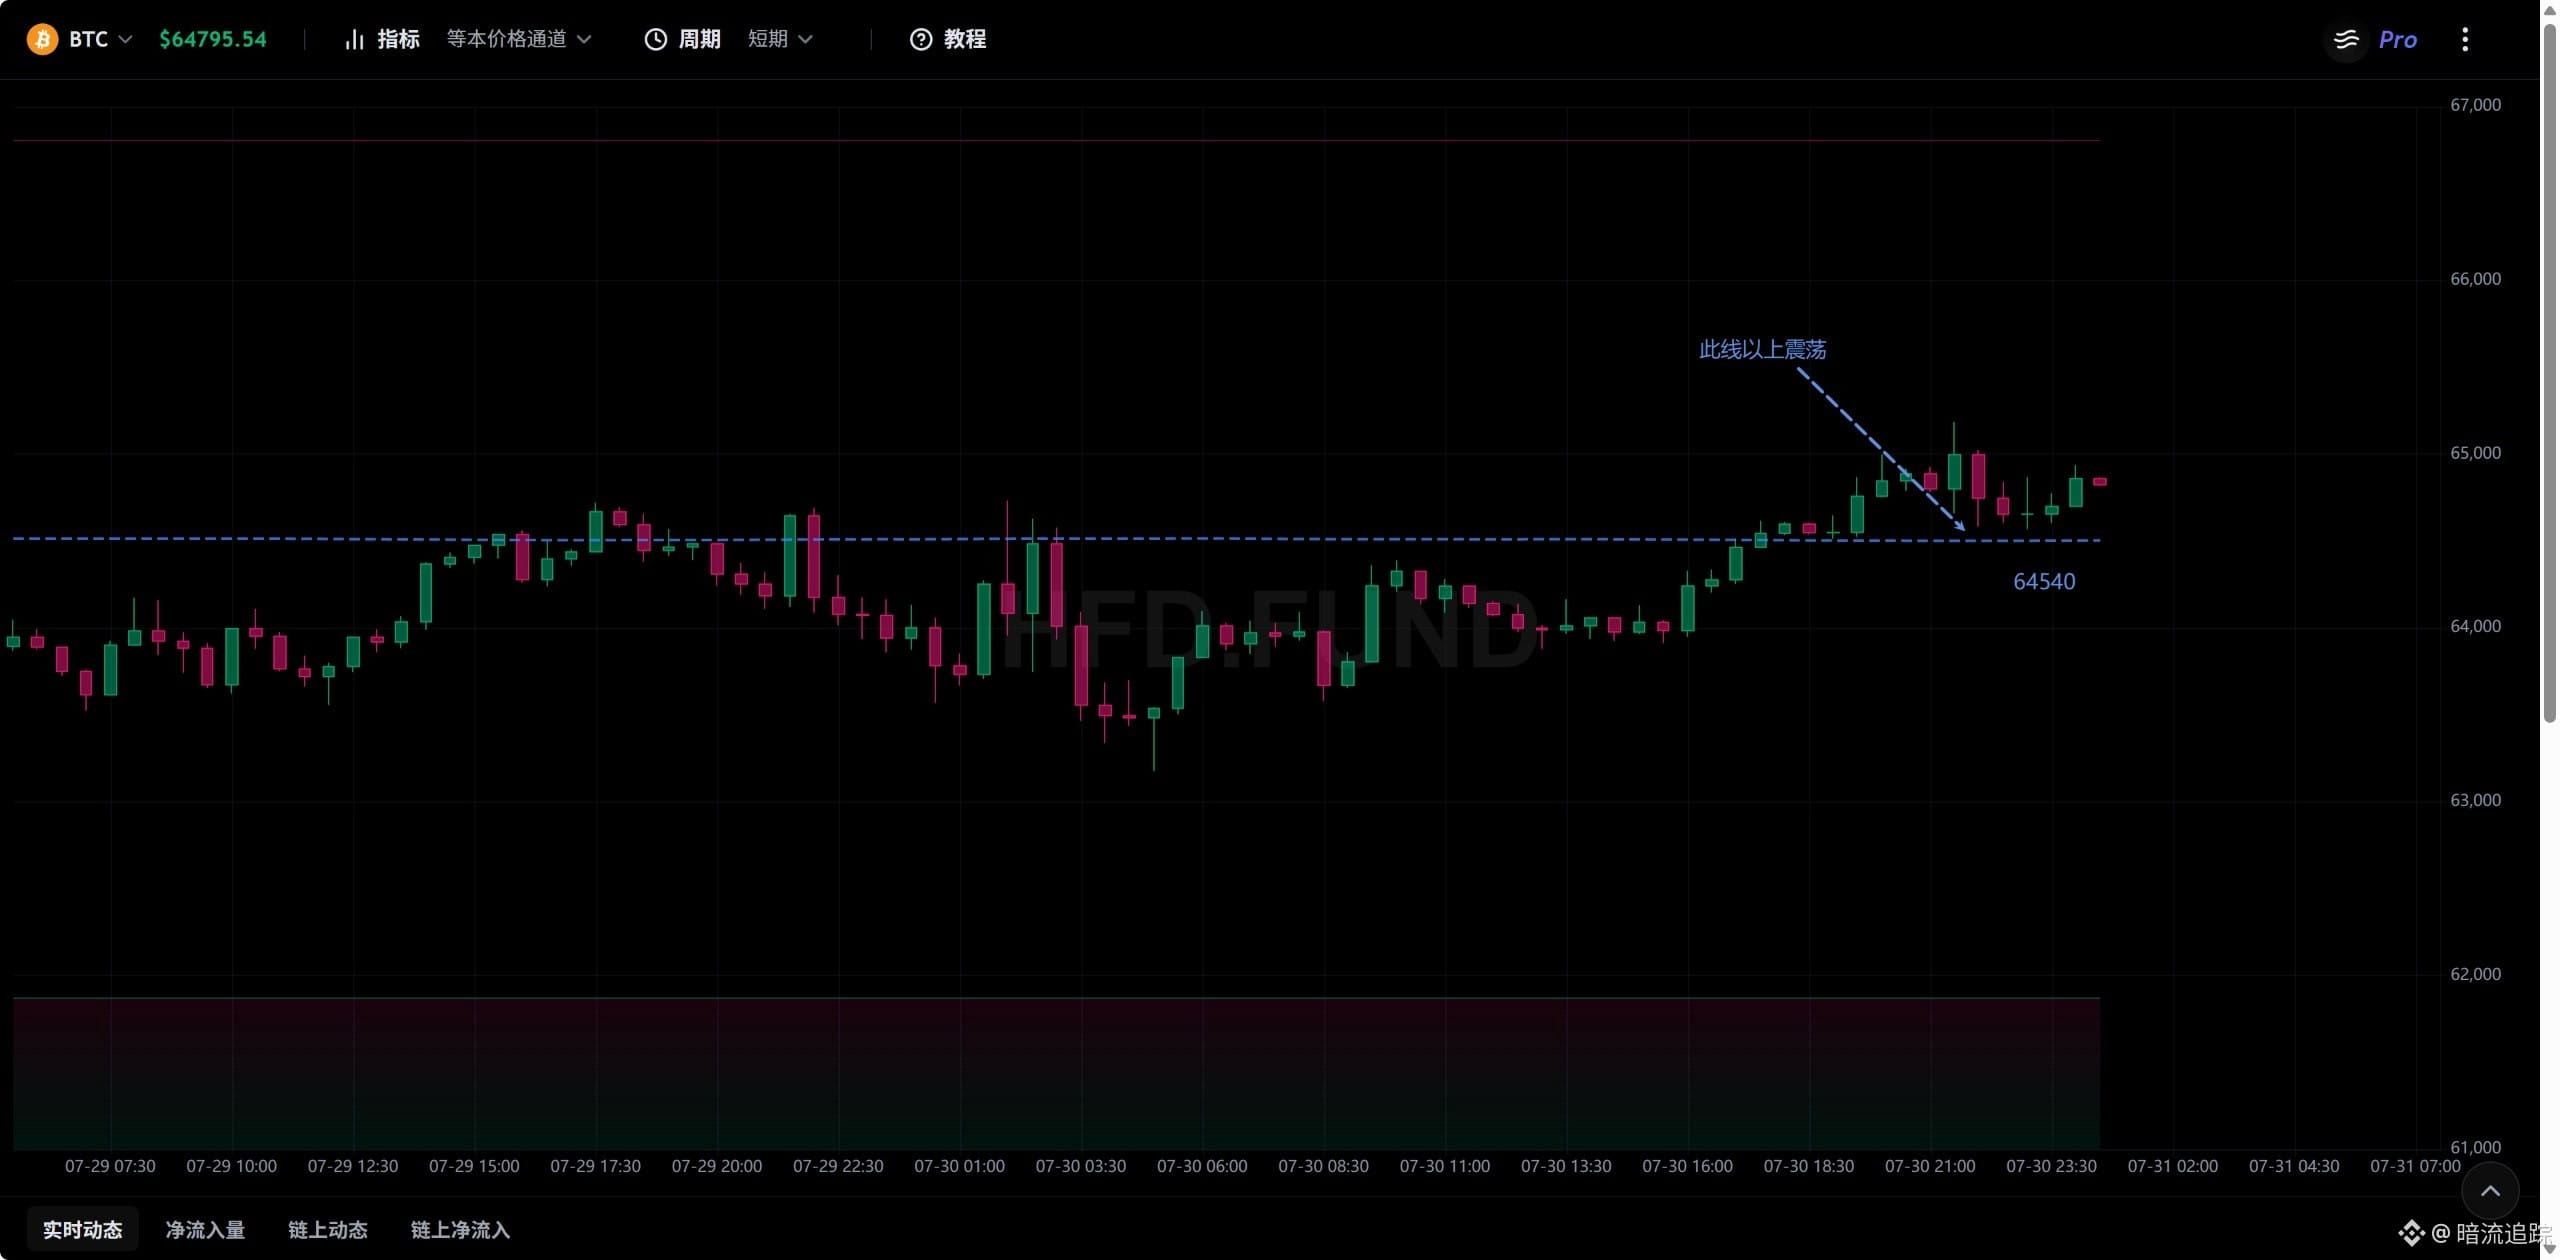
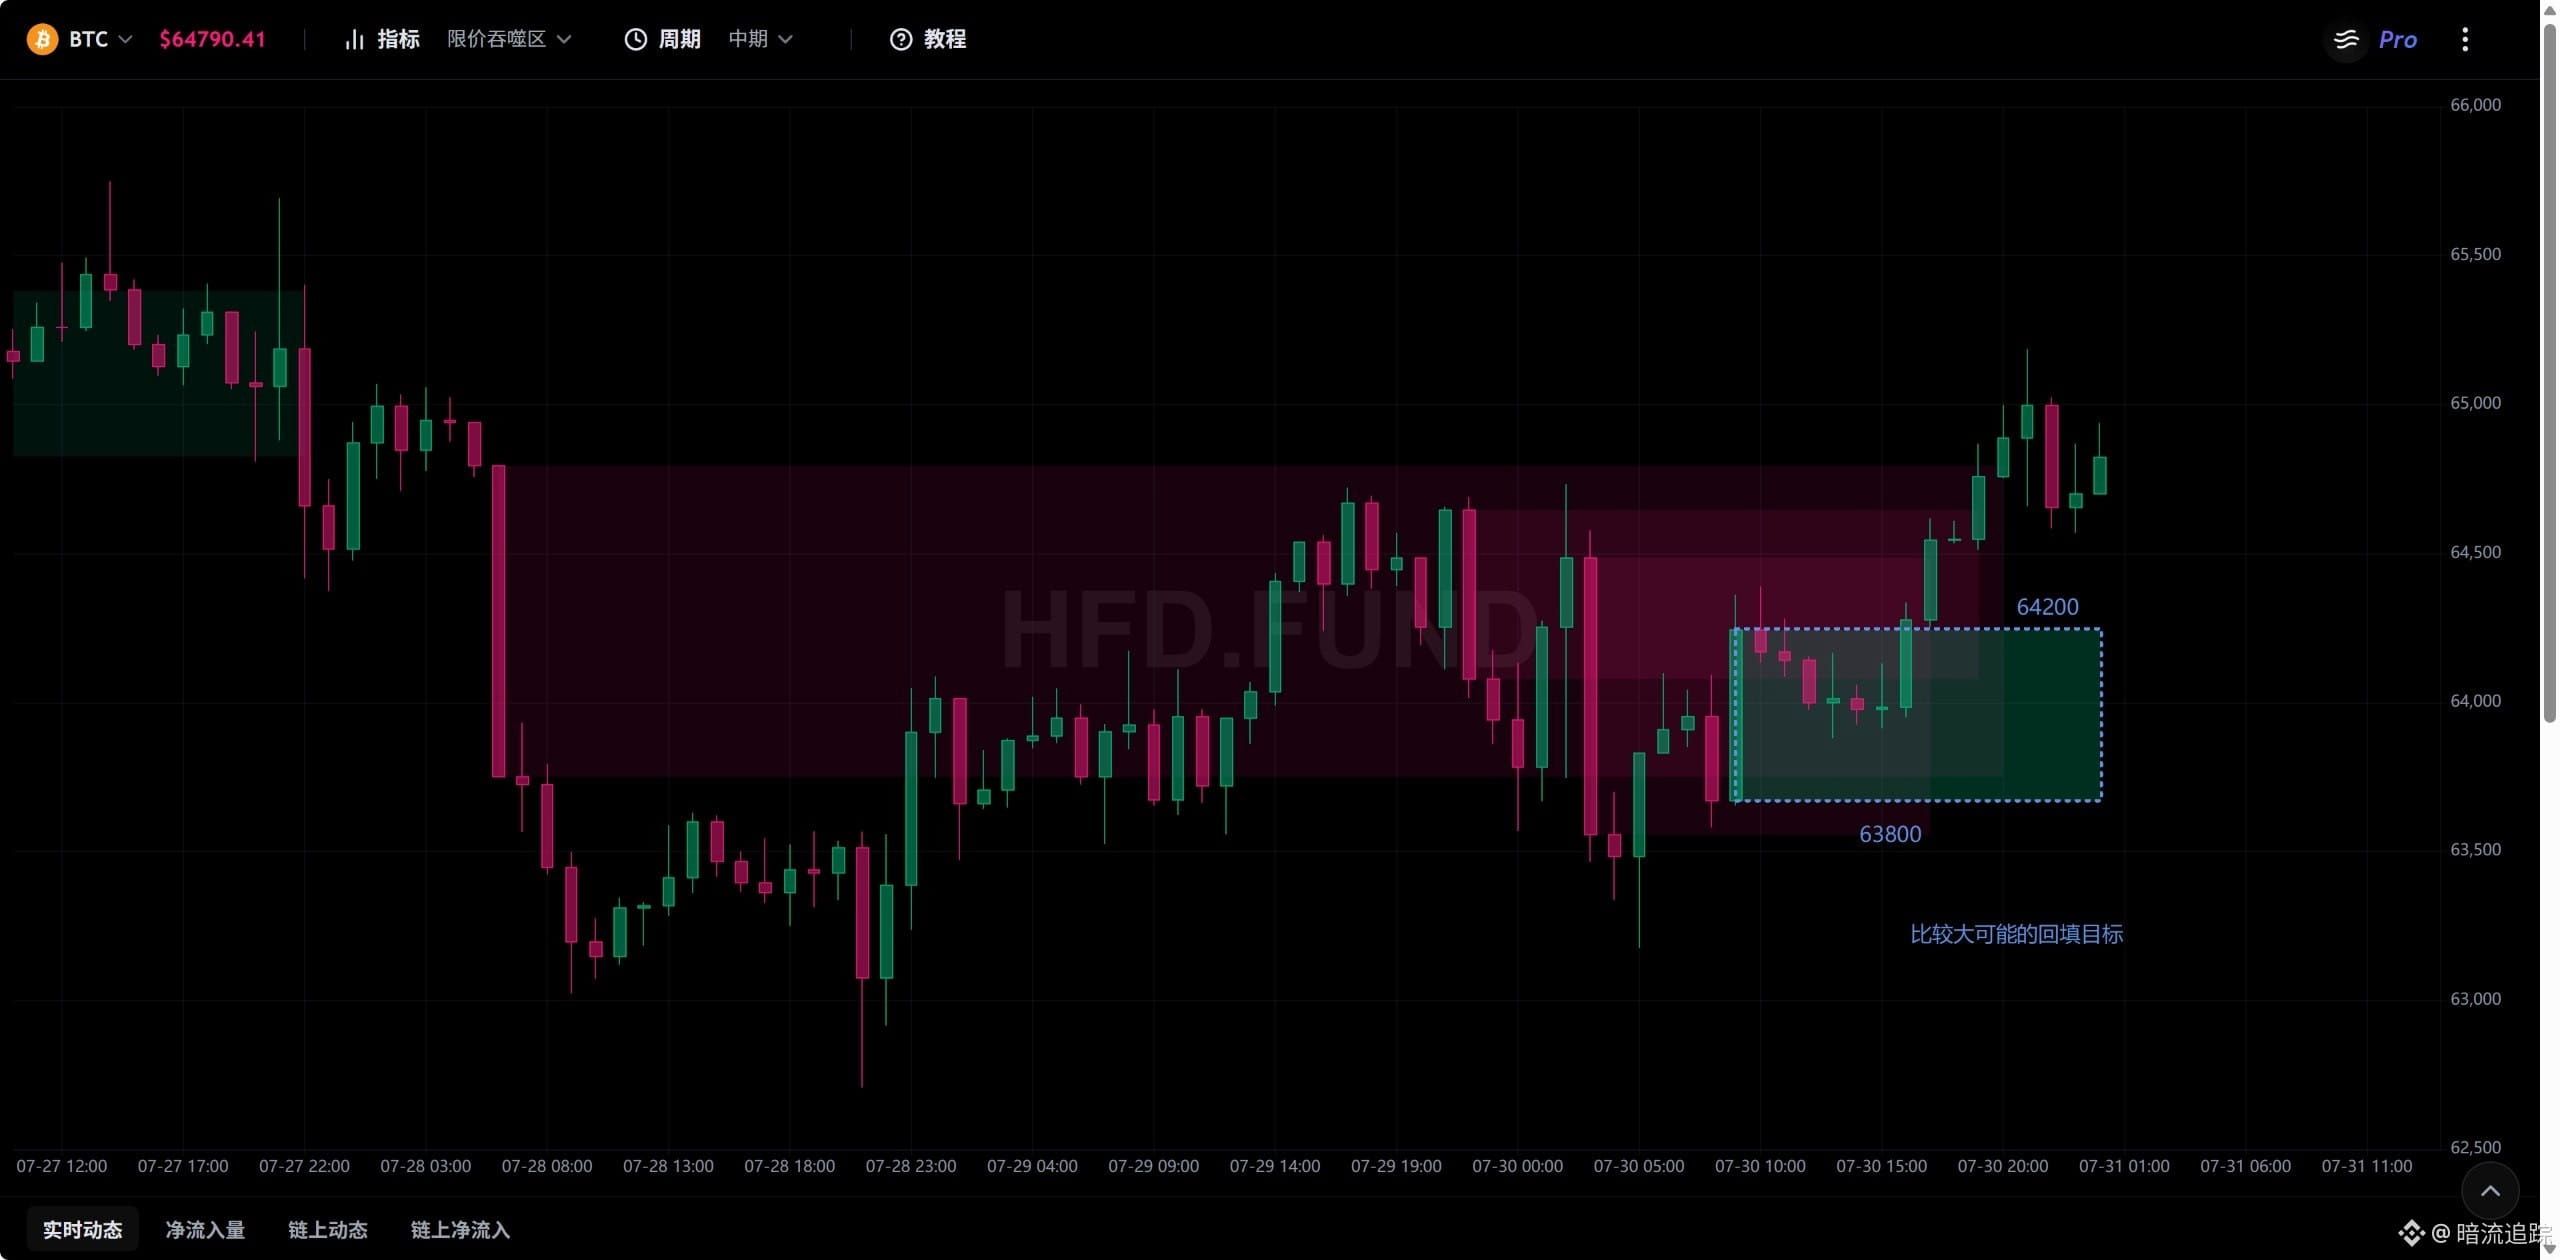
Log in to explore more content