Summary:
Building on the previous section, the trend has shifted from ranging to upward, but upside space is limited.
Price projection:
Price is expected to move higher. The first target is to break through 64761, followed by breaking through 64843. After encountering this kind of sell-side pressure, the price may retreat to 64300 to find support, and then rise again. The extreme (peak) could be around 65167.
Previous price projection:
Ranging around 63500–63700. After the range, it moves up to 64320, where it meets resistance. Once 64320 holds, it will rise to the 64545–65167 area. After a spike near 65167, it is likely to pull back.
Actual price action:
Ranging around 63500–63700. Wide-range fluctuations near 64200. The current high has already pierced up to 64746.
Outlook:
Chip (order) vacuum
In the short term, bulls are attacking; however, after each bull attack forms a line of defense, it gets refilled.
In the medium and long term, the outlook remains ranging.
This indicates that disagreement in the market is still relatively large. Overall, however, market opinions are not consistently bullish, which is why wide-range consolidation is occurring.
Therefore, this indicator suggests that current price will keep making wide-range fluctuations but with an upward bias.
Price channel
For the equal-quantity short-term moving average: 63960; upper bound 71700; lower bound 58260.
For the equal-quantity mid-term moving average: 63660; upper bound 66810; lower bound 59360.
For the equal-quantity long-term moving average: 70210; lower bound 59300.
Based on this indicator, both the short- and mid-term moving averages and their upper bounds have increased. Also, price is above the moving averages, which suggests that market expectations for price are rising, and support has increased to 63660–63960.
For the equal-quantity short-term average: 64280; upper bound 66810; lower bound 61900.
For the equal-quantity mid-term average: 63630; upper bound 66810; lower bound 58310.
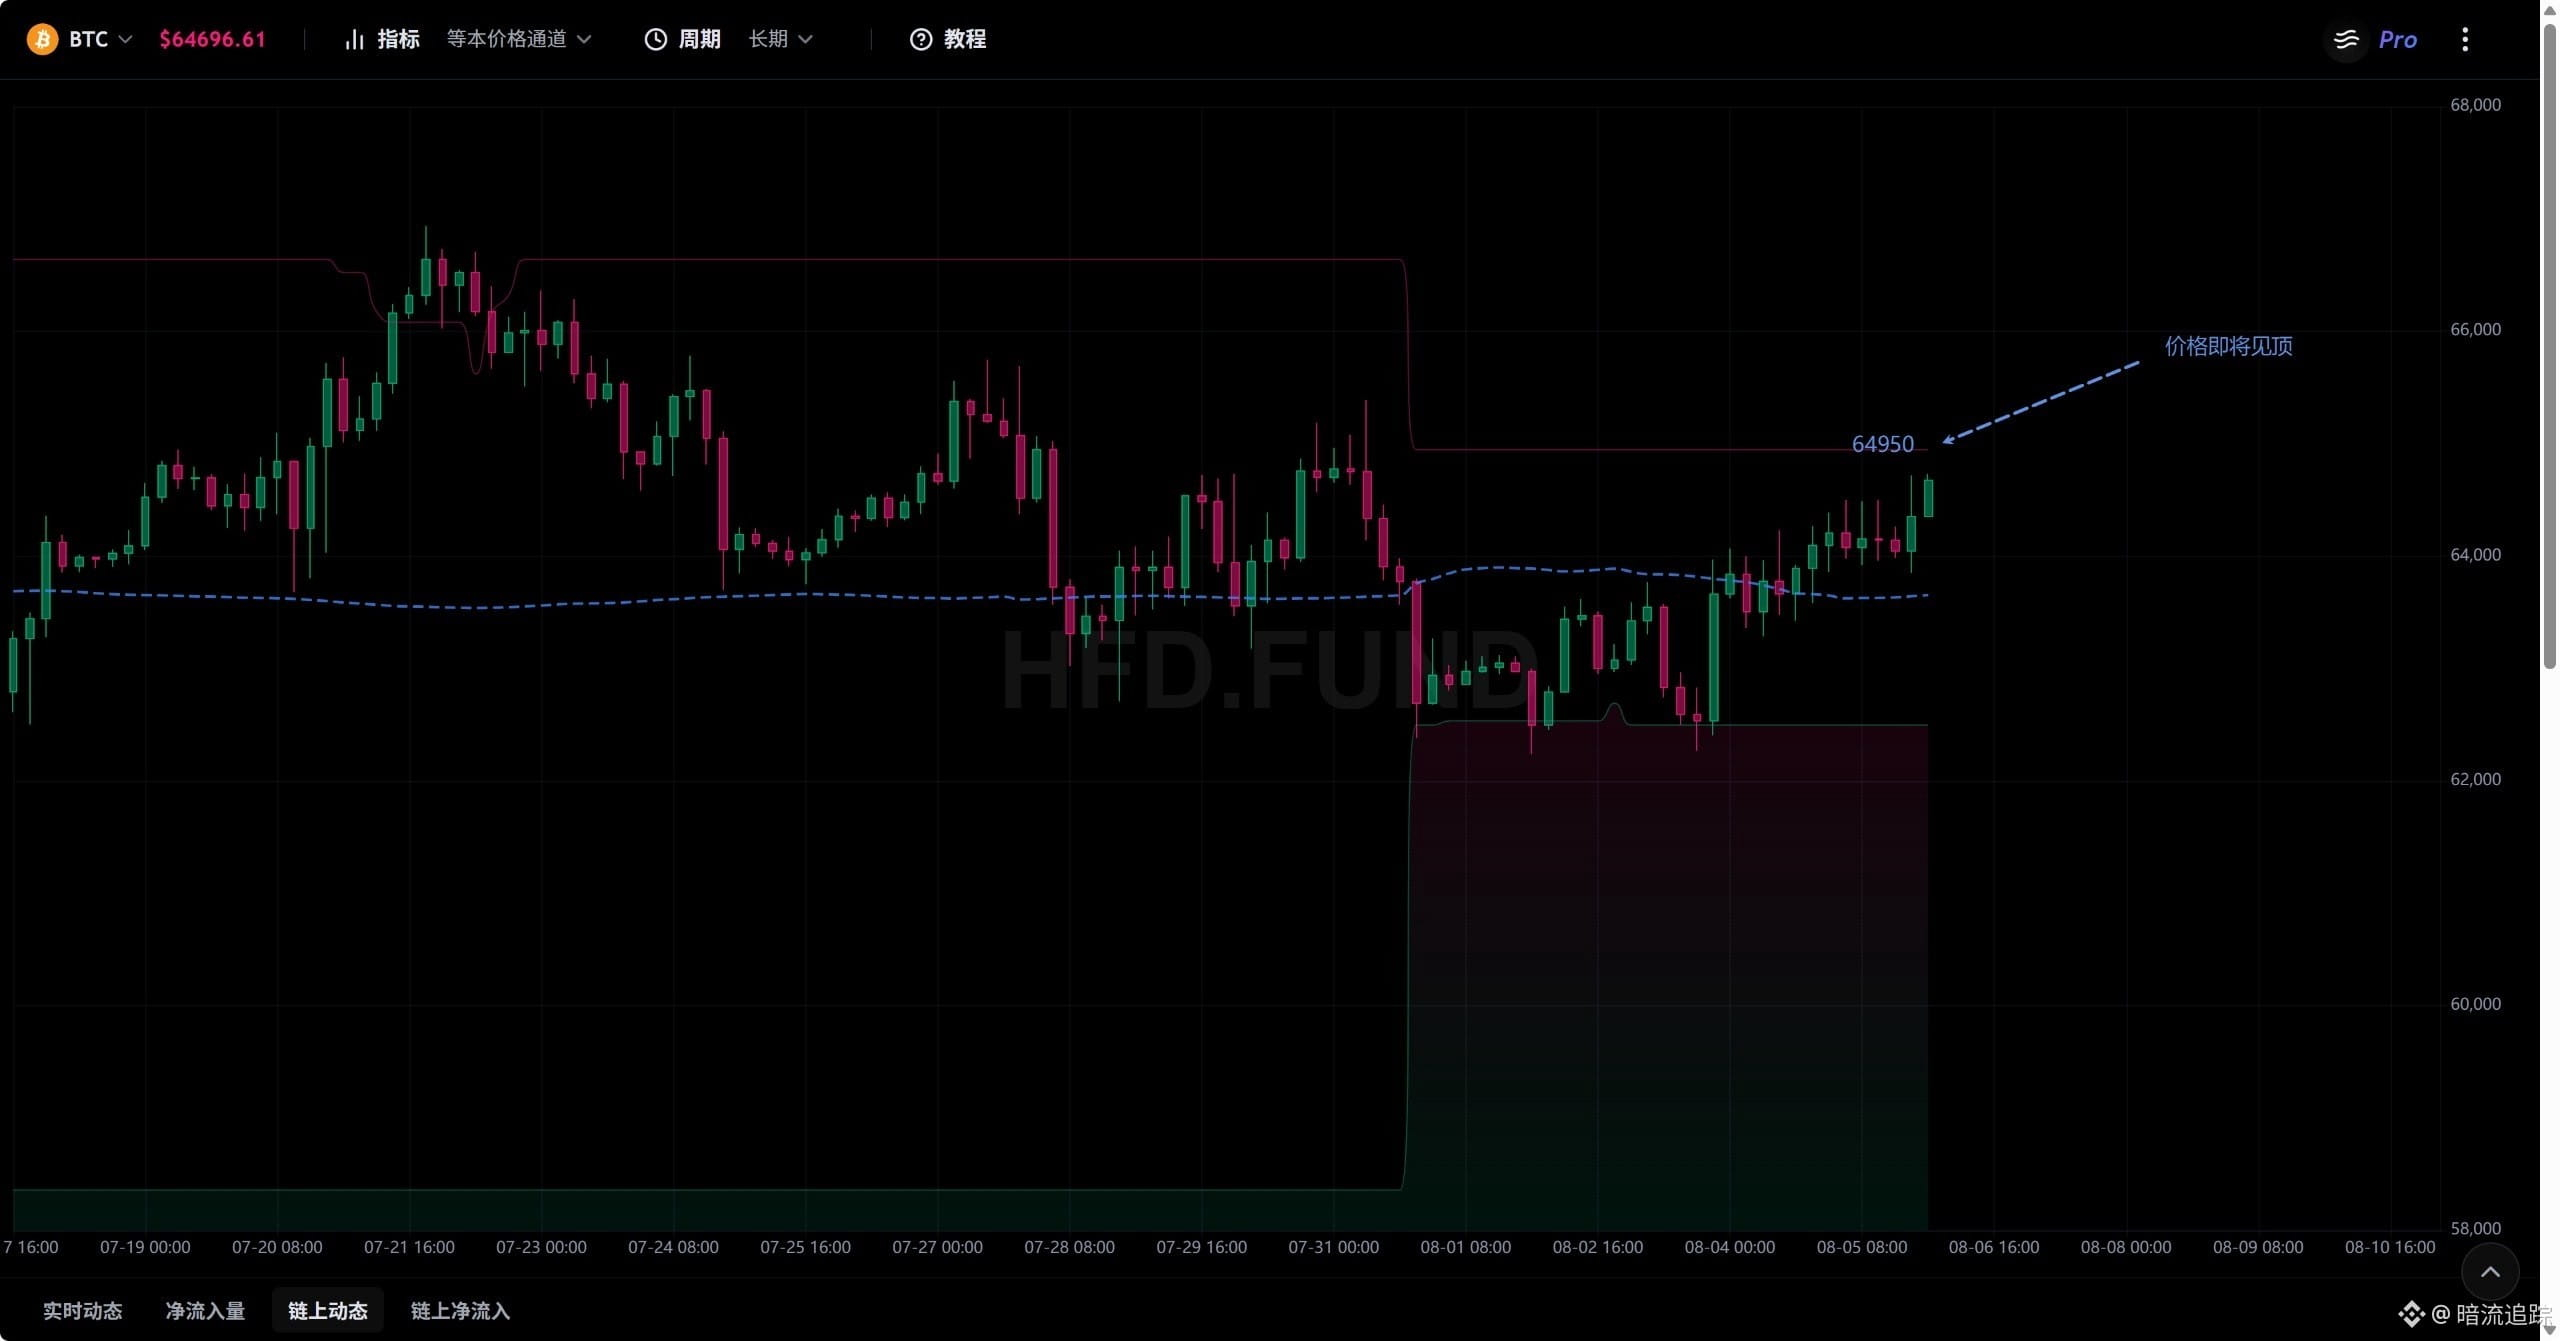
For the equal-quantity long-term average: 63700; upper bound 64950; lower bound 62690.
Based on this indicator, the most important change is that price has moved above the short-term average 64280. This means the trend has shifted from ranging to an uptrend. The 64280 pressure line has become support, and the latest pressure line is around 64950.
Combining both indicators: currently, the trend has shifted from fluctuation between the various moving averages to climbing upward after holding above each of them. However, with the long-term resistance at 64950 capping it, the highs are unlikely to be very high, and there isn’t much remaining upside space.
Limit-price absorption (price engulfing)
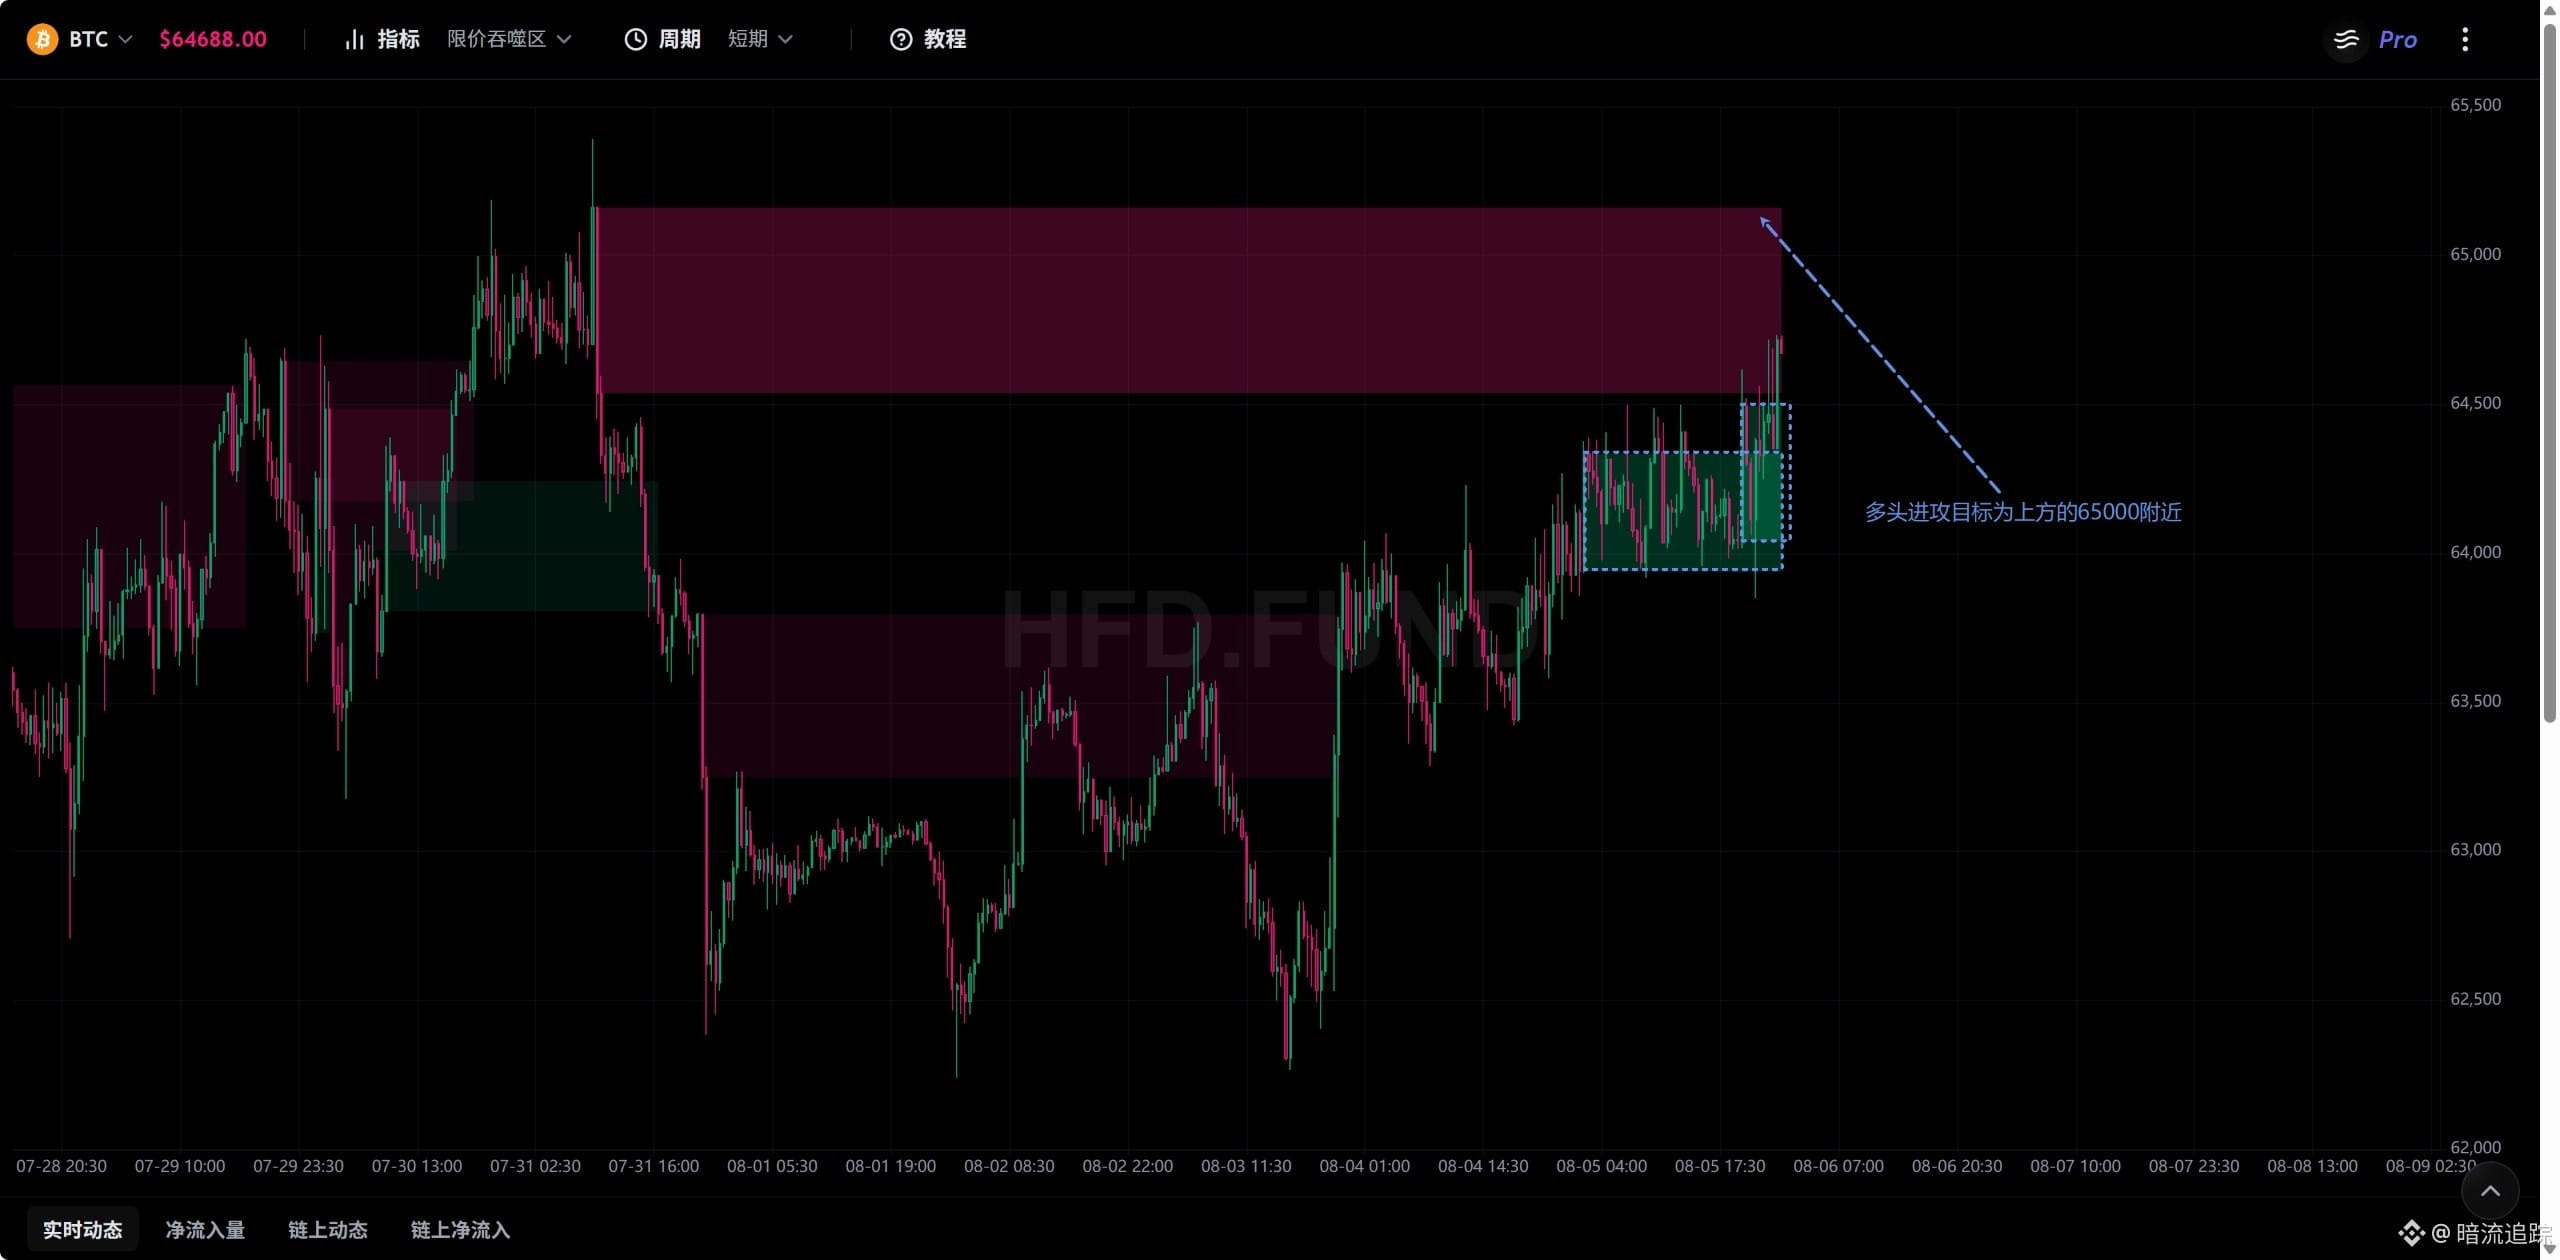
Short-term bull attacks: 63943–64337, 64051–64495.
In the mid-term, it is still the bull attack described earlier, with the defensive zone at 63938–62680.
At present, it appears that bulls are in control and pushing upward. The target remains the historical short position area of 64545–65167. So price is very likely to be capped above 64300 as it attempts a move toward 65167.
Building on the previous section, the trend has shifted from ranging to upward, but upside space is limited.
Price projection:
Price is expected to move higher. The first target is to break through 64761, followed by breaking through 64843. After encountering this kind of sell-side pressure, the price may retreat to 64300 to find support, and then rise again. The extreme (peak) could be around 65167.
Previous price projection:
Ranging around 63500–63700. After the range, it moves up to 64320, where it meets resistance. Once 64320 holds, it will rise to the 64545–65167 area. After a spike near 65167, it is likely to pull back.
Actual price action:
Ranging around 63500–63700. Wide-range fluctuations near 64200. The current high has already pierced up to 64746.
Outlook:
Chip (order) vacuum
In the short term, bulls are attacking; however, after each bull attack forms a line of defense, it gets refilled.
In the medium and long term, the outlook remains ranging.
This indicates that disagreement in the market is still relatively large. Overall, however, market opinions are not consistently bullish, which is why wide-range consolidation is occurring.
Therefore, this indicator suggests that current price will keep making wide-range fluctuations but with an upward bias.
Price channel
For the equal-quantity short-term moving average: 63960; upper bound 71700; lower bound 58260.
For the equal-quantity mid-term moving average: 63660; upper bound 66810; lower bound 59360.
For the equal-quantity long-term moving average: 70210; lower bound 59300.
Based on this indicator, both the short- and mid-term moving averages and their upper bounds have increased. Also, price is above the moving averages, which suggests that market expectations for price are rising, and support has increased to 63660–63960.
For the equal-quantity short-term average: 64280; upper bound 66810; lower bound 61900.
For the equal-quantity mid-term average: 63630; upper bound 66810; lower bound 58310.
For the equal-quantity long-term average: 63700; upper bound 64950; lower bound 62690.
Based on this indicator, the most important change is that price has moved above the short-term average 64280. This means the trend has shifted from ranging to an uptrend. The 64280 pressure line has become support, and the latest pressure line is around 64950.
Combining both indicators: currently, the trend has shifted from fluctuation between the various moving averages to climbing upward after holding above each of them. However, with the long-term resistance at 64950 capping it, the highs are unlikely to be very high, and there isn’t much remaining upside space.
Limit-price absorption (price engulfing)
Short-term bull attacks: 63943–64337, 64051–64495.
In the mid-term, it is still the bull attack described earlier, with the defensive zone at 63938–62680.
At present, it appears that bulls are in control and pushing upward. The target remains the historical short position area of 64545–65167. So price is very likely to be capped above 64300 as it attempts a move toward 65167.