Summary:
Following the previous discussion, the earlier decline is temporarily over; we will first look for a bottoming out, with a modest rebound.
Future price scenarios:
Due to the impact of a short-term bullish push, the price may rebound as high as around 64,430. When it meets resistance, it will likely fall back again and then range-trade in the 63,700–64,000 zone.
Previous scenario:
The trend is downward. We expect it may drop toward the 64,300 average price area, and then fluctuate around this level to find direction.
Since mid-term accumulation (buying) is about to begin, take note: if 64,300 is broken and the price cannot quickly reclaim it, the bearish outlook could target the 64,000–63,700 area.
Actual price action:
The lowest point dropped to 63,779, then it began to move upward in consolidation, and it is now around 64,100.
Future price action:
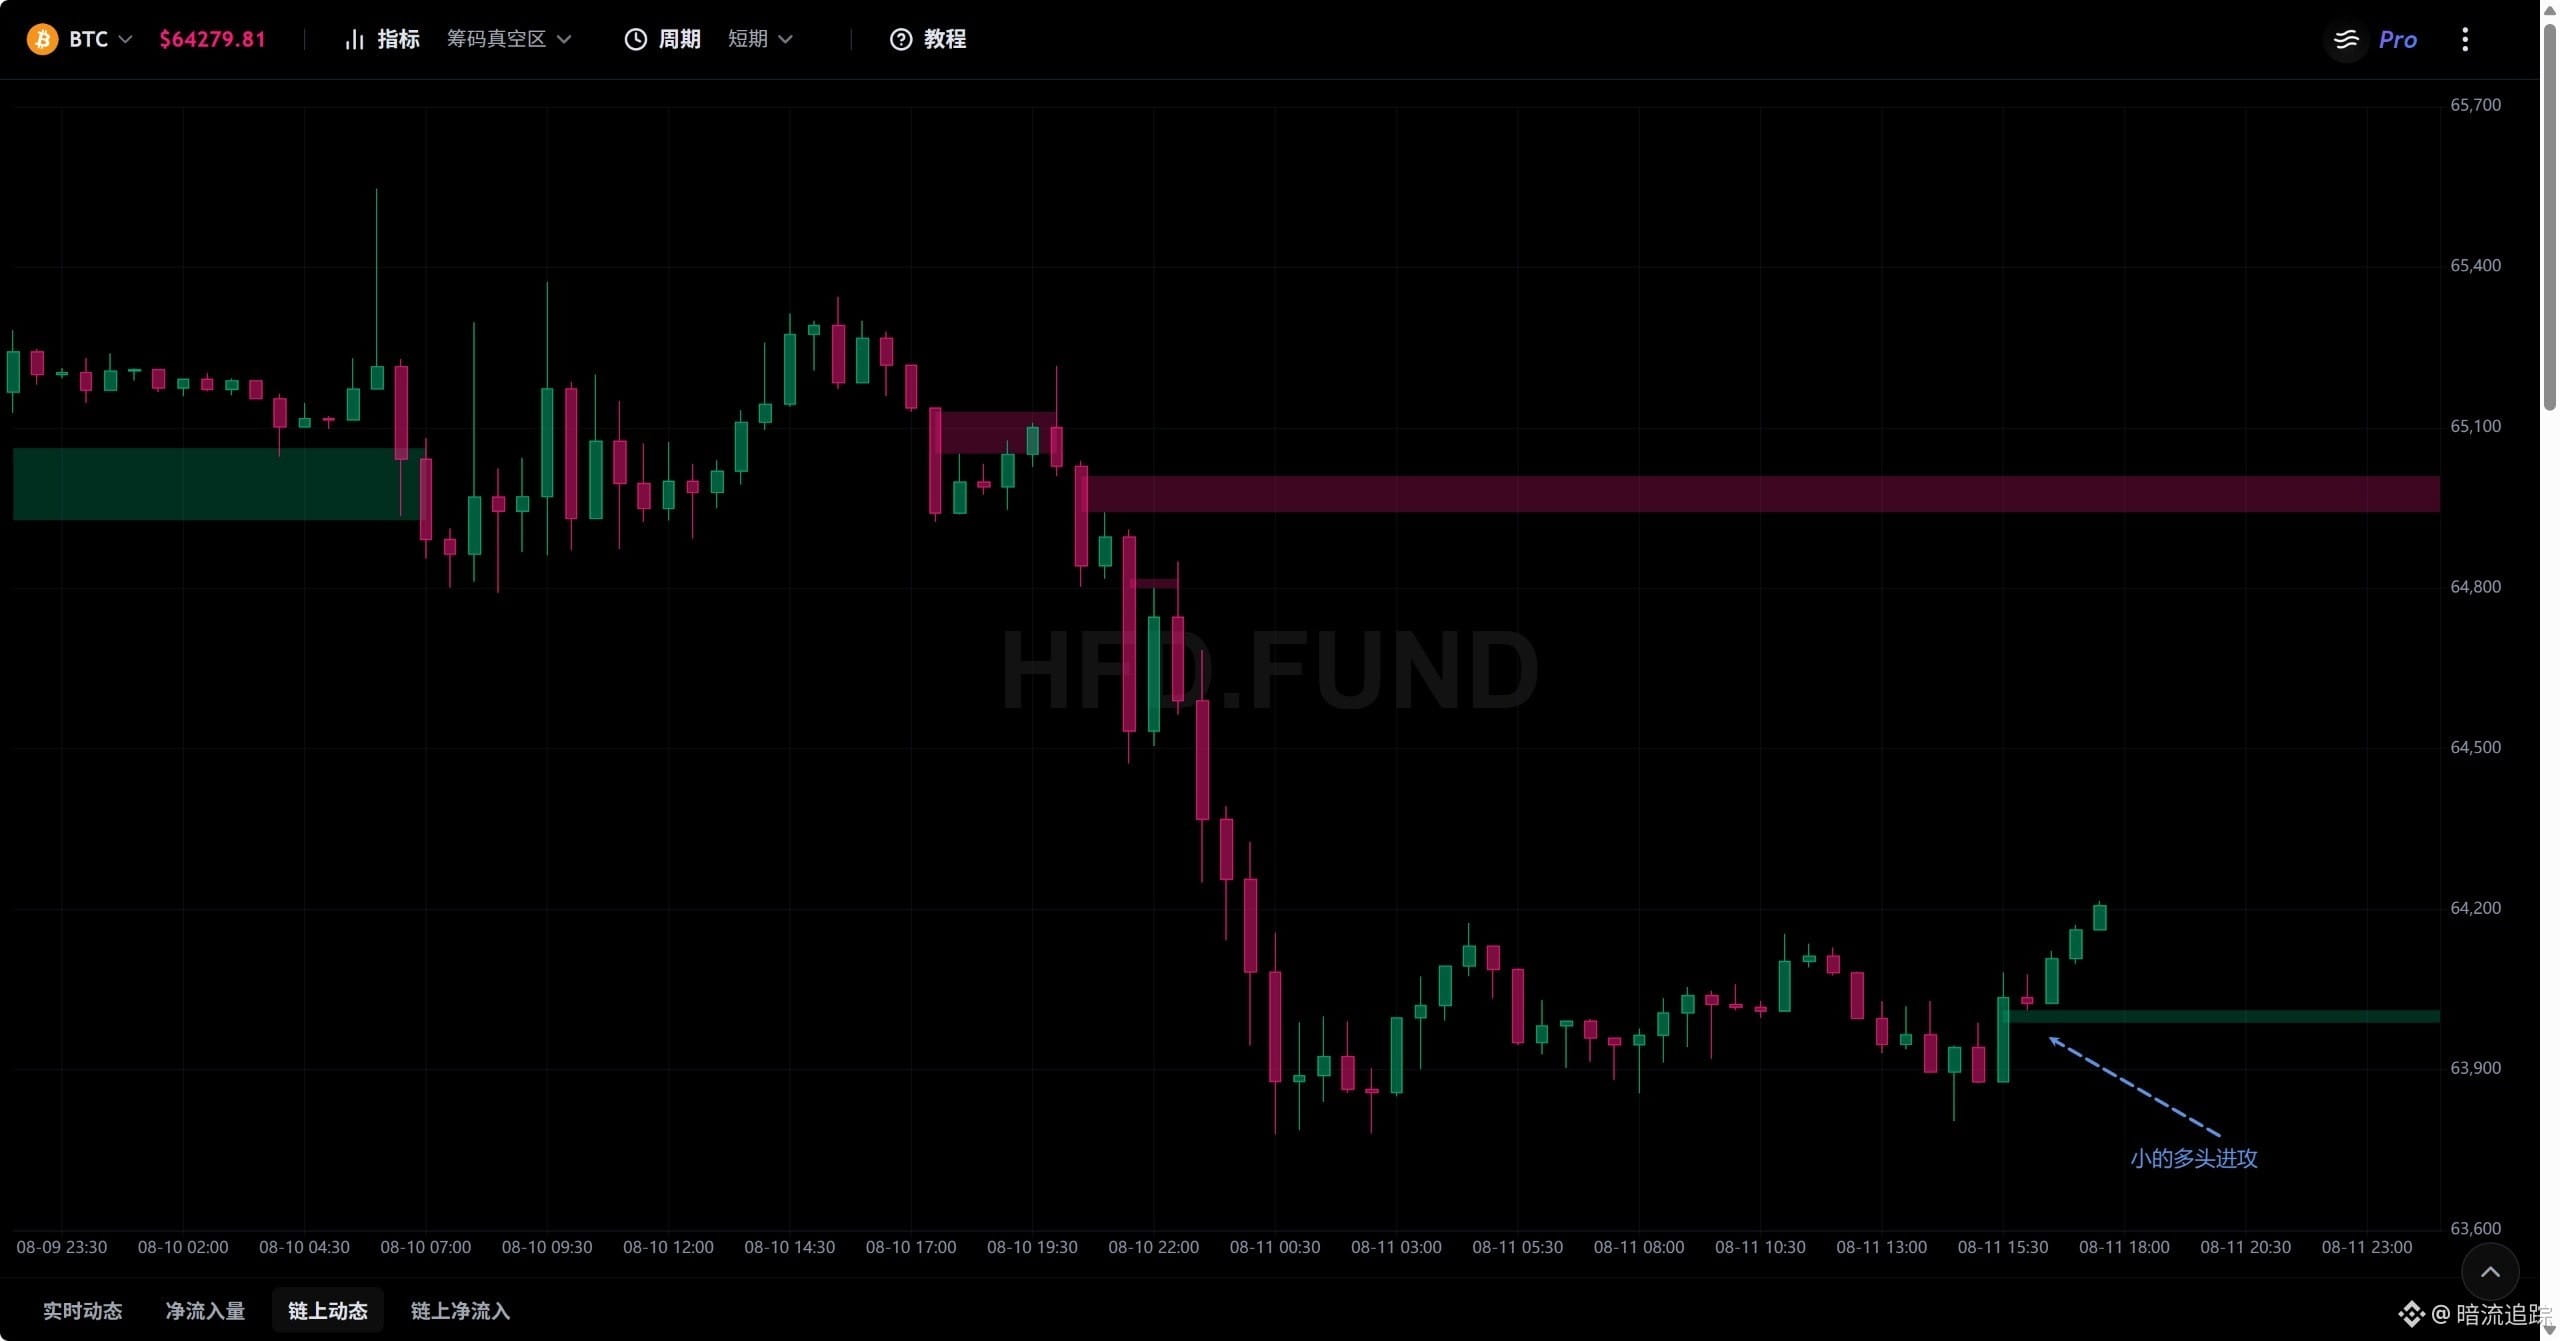
Trading volume vacuum
With a short-term bullish offensive, the defense line is 64,012–63,980. In the short term, the trend is shifting from bearish pressure to bullish pressure, which also indicates that the decline has paused and consolidation has begun.
For the mid-term and long-term, we still expect consolidation, with no new actions.
Price channel
Equal short-term average price: 63,660; upper bound: 70,090; lower bound: 58,260.
Equal mid-term average price: 63,900; upper bound: 67,260; lower bound: 59,360.
Equal long-term average price: 69,590; upper bound: 93,760; lower bound: 59,160.
Based on this indicator, the current price has fallen to near the average price. The average price has started to provide support to the price. This also suggests that the market has returned to a price level recognized as a standard by institutions. As institutions move their average price downward, that average continues to support the price. Therefore, we can judge that the current price is still standing above the average price due to average-based support. The upward trend has not been broken; we expect consolidation above 63,900, and after it stabilizes, look for the target level at 67,260.
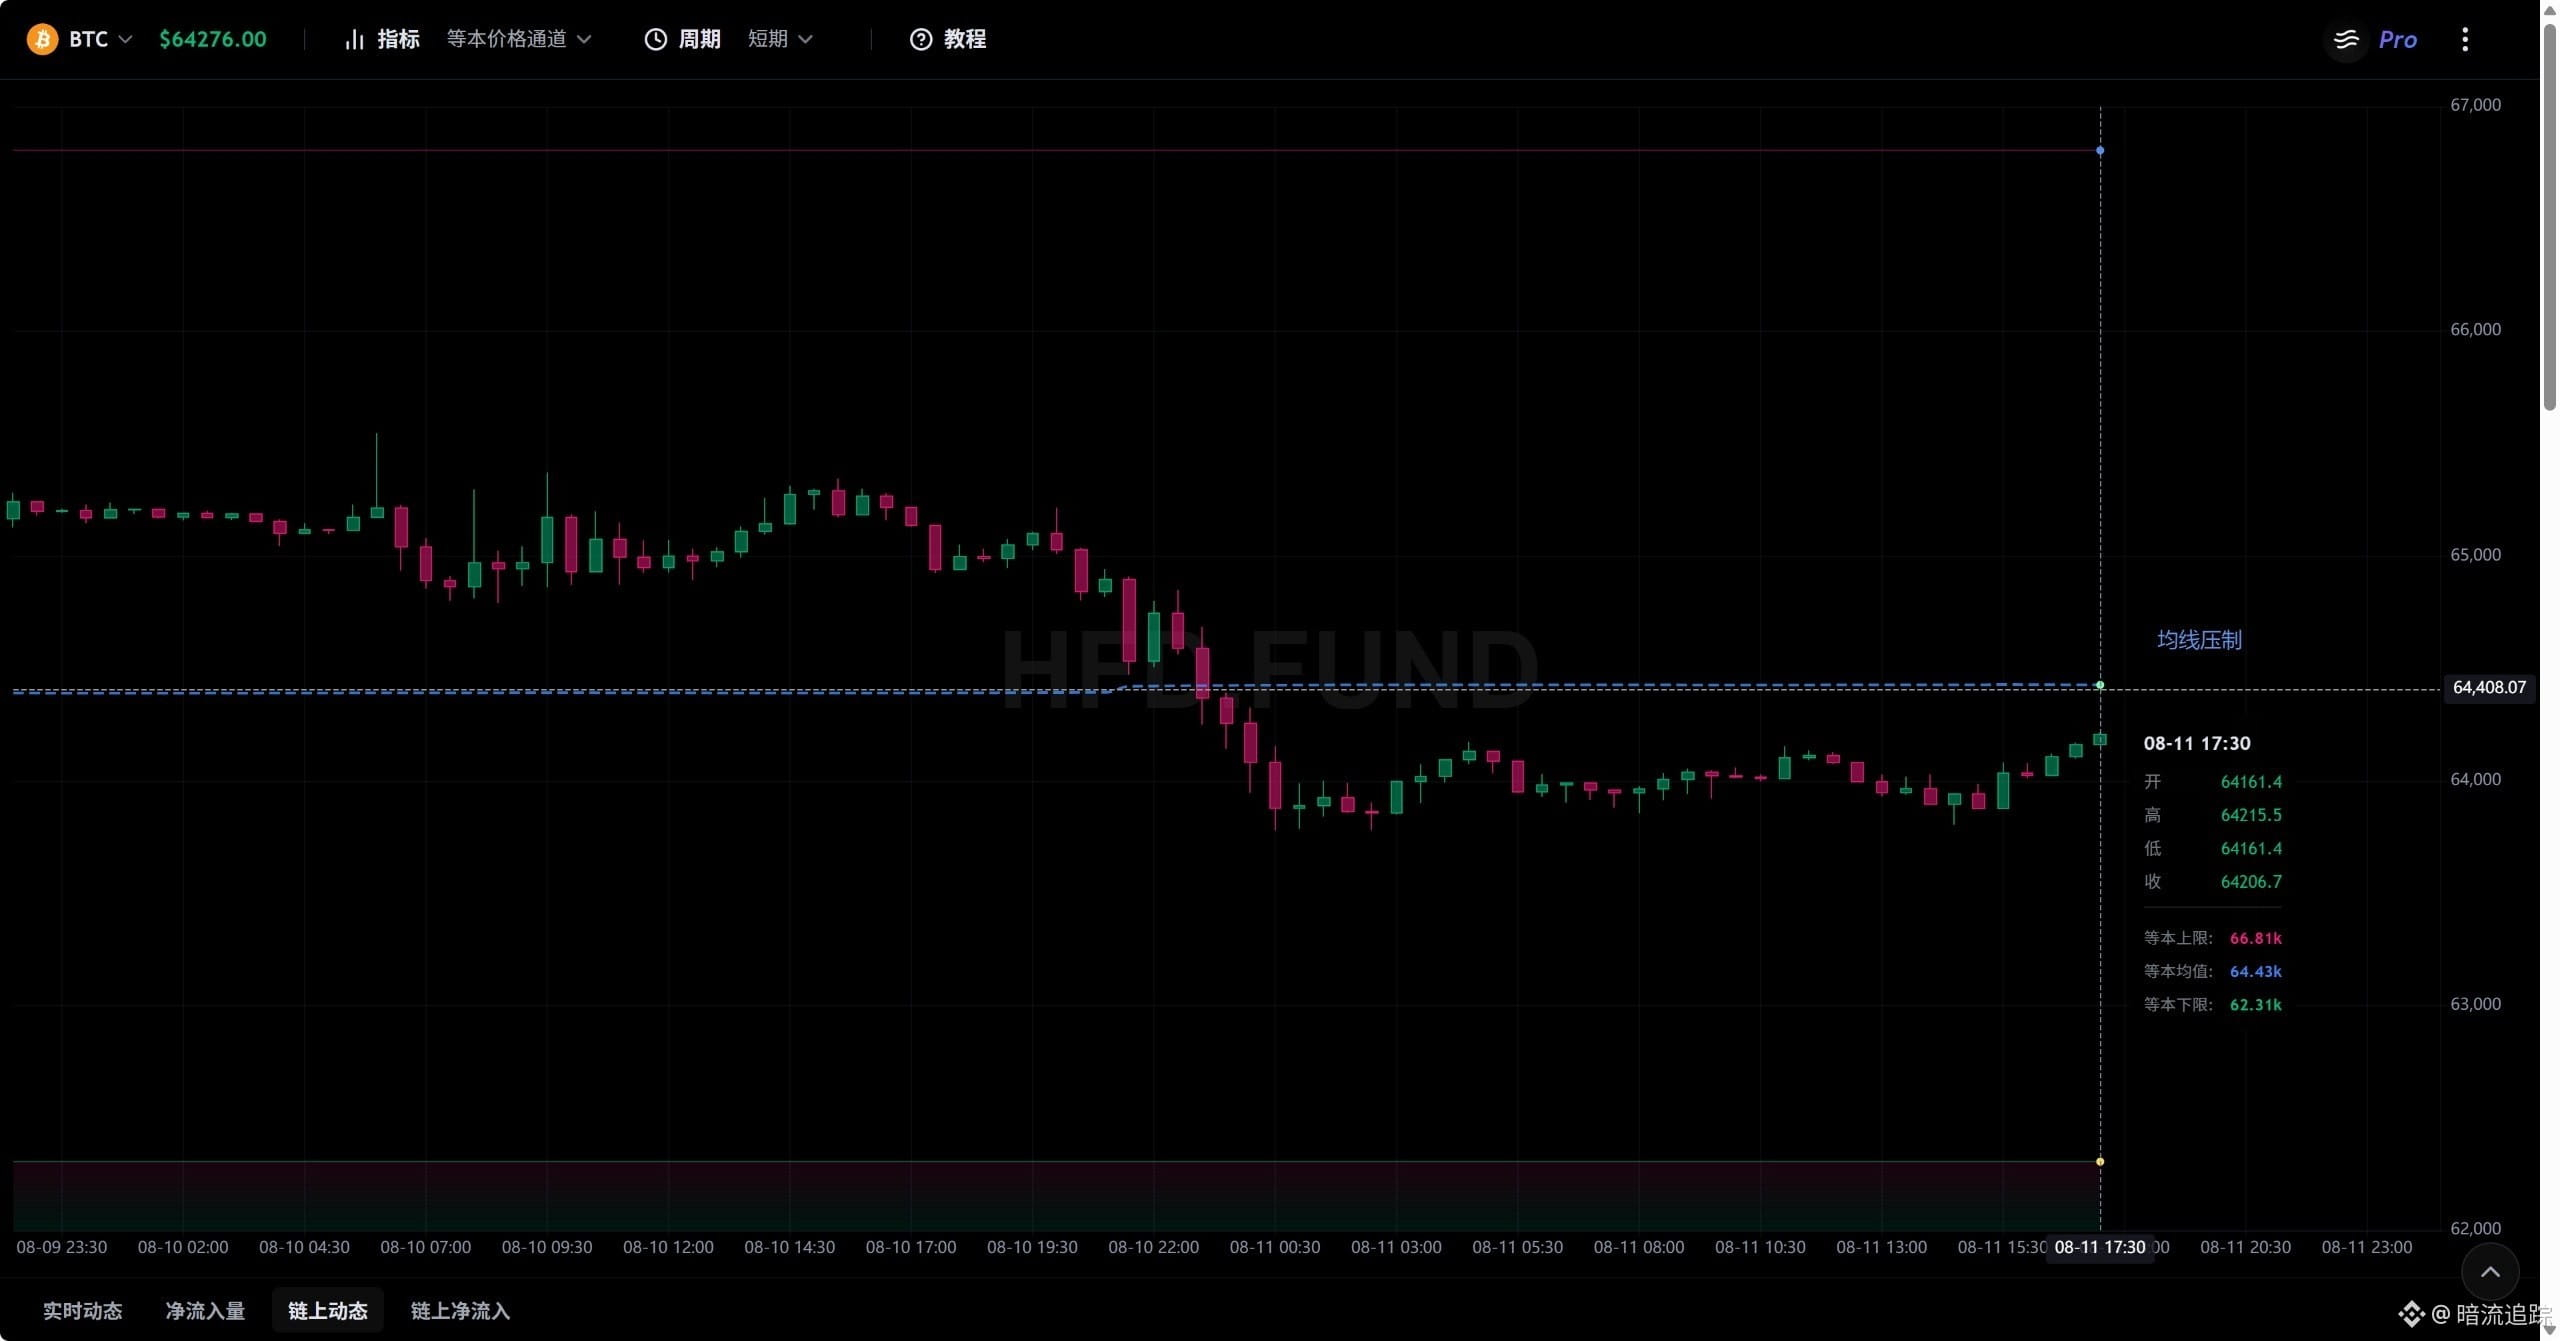
Equal last/this-term short-term average: 64,430; upper bound: 66,810; lower bound: 62,310.
Equal last/this-term mid-term average: 63,790; upper bound: 66,810; lower bound: 58,360.
Equal last/this-term long-term average: 64,080; upper bound: 65,200; lower bound: 62,500.
Based on this indicator, the current price has also fallen to around the average price. The mid- and long-term averages form support, while the short-term average acts as resistance. So we should watch for consolidation between 63,790–64,430.
Taking the two indicators together, the price is still being supported by the moving averages across different timeframes that are relatively aligned. For now, it is consolidating in the 64,000–64,400 range.
Volume-Price Order Block
Short-term accumulation is continuing to place buy orders higher, from 36,810–64,140, with buy orders placed progressively upward. This suggests that the trend is stabilizing from the bottom and beginning to consolidate upward.
Mid-term accumulation buy orders at 63,963–63,856 are temporarily becoming support and have not been broken through yet.
Based on this indicator, the short-term trend is upward. However, due to the draw/influence of mid-term accumulation buy orders…
Following the previous discussion, the earlier decline is temporarily over; we will first look for a bottoming out, with a modest rebound.
Future price scenarios:
Due to the impact of a short-term bullish push, the price may rebound as high as around 64,430. When it meets resistance, it will likely fall back again and then range-trade in the 63,700–64,000 zone.
Previous scenario:
The trend is downward. We expect it may drop toward the 64,300 average price area, and then fluctuate around this level to find direction.
Since mid-term accumulation (buying) is about to begin, take note: if 64,300 is broken and the price cannot quickly reclaim it, the bearish outlook could target the 64,000–63,700 area.
Actual price action:
The lowest point dropped to 63,779, then it began to move upward in consolidation, and it is now around 64,100.
Future price action:
Trading volume vacuum
With a short-term bullish offensive, the defense line is 64,012–63,980. In the short term, the trend is shifting from bearish pressure to bullish pressure, which also indicates that the decline has paused and consolidation has begun.
For the mid-term and long-term, we still expect consolidation, with no new actions.
Price channel
Equal short-term average price: 63,660; upper bound: 70,090; lower bound: 58,260.
Equal mid-term average price: 63,900; upper bound: 67,260; lower bound: 59,360.
Equal long-term average price: 69,590; upper bound: 93,760; lower bound: 59,160.
Based on this indicator, the current price has fallen to near the average price. The average price has started to provide support to the price. This also suggests that the market has returned to a price level recognized as a standard by institutions. As institutions move their average price downward, that average continues to support the price. Therefore, we can judge that the current price is still standing above the average price due to average-based support. The upward trend has not been broken; we expect consolidation above 63,900, and after it stabilizes, look for the target level at 67,260.
Equal last/this-term short-term average: 64,430; upper bound: 66,810; lower bound: 62,310.
Equal last/this-term mid-term average: 63,790; upper bound: 66,810; lower bound: 58,360.
Equal last/this-term long-term average: 64,080; upper bound: 65,200; lower bound: 62,500.
Based on this indicator, the current price has also fallen to around the average price. The mid- and long-term averages form support, while the short-term average acts as resistance. So we should watch for consolidation between 63,790–64,430.
Taking the two indicators together, the price is still being supported by the moving averages across different timeframes that are relatively aligned. For now, it is consolidating in the 64,000–64,400 range.
Volume-Price Order Block
Short-term accumulation is continuing to place buy orders higher, from 36,810–64,140, with buy orders placed progressively upward. This suggests that the trend is stabilizing from the bottom and beginning to consolidate upward.
Mid-term accumulation buy orders at 63,963–63,856 are temporarily becoming support and have not been broken through yet.
Based on this indicator, the short-term trend is upward. However, due to the draw/influence of mid-term accumulation buy orders…