
SuMo_GiLl
9 Posts

SuMo_GiLl
Report
Block User
Open Trade
2 Days
0 Following
1 Followers
2 Liked
Posts
Portfolio
·
--
Technical analysis
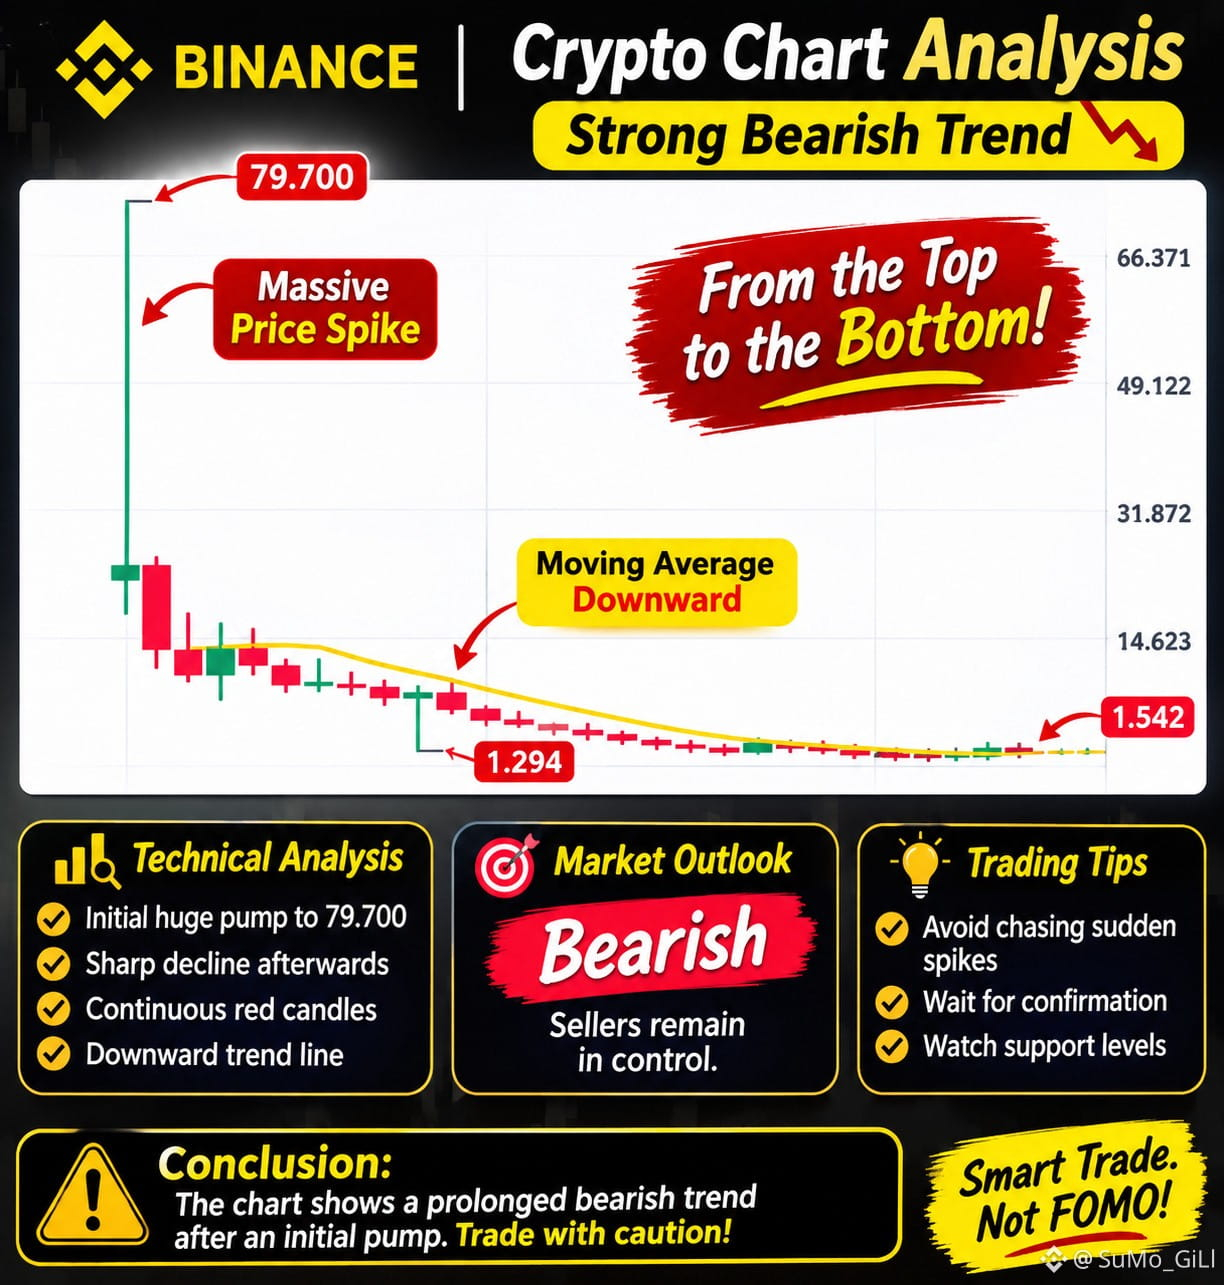
Initial movement: A sudden pump pushed the price toward $TRUMP 79.700.
Sharp correction: Sellers quickly took control, causing a major price drop.
Downtrend: Consecutive red candles indicate persistent bearish momentum.
Moving average: The yellow moving-average line is sloping downward, confirming weakness.
Current price: Approximately 1.542, as displayed in the chart.
Market outlook
Bearish — Sellers remain in control.
Further downside is possible if selling continues.
A recovery needs strong buying volume.
A break above the moving average could be an early recovery signal.
{spot}(TRUMPUSDT)
#TRUMP
Technical analysis
Initial movement: A sudden pump pushed the price toward $TRUMP 79.700.
Sharp correction: Sellers quickly took control, causing a major price drop.
Downtrend: Consecutive red candles indicate persistent bearish momentum.
Moving average: The yellow moving-average line is sloping downward, confirming weakness.
Current price: Approximately 1.542, as displayed in the chart.
Market outlook
Bearish — Sellers remain in control.
Further downside is possible if selling continues.
A recovery needs strong buying volume.
A break above the moving average could be an early recovery signal.
#TRUMP
Initial movement: A sudden pump pushed the price toward $TRUMP 79.700.
Sharp correction: Sellers quickly took control, causing a major price drop.
Downtrend: Consecutive red candles indicate persistent bearish momentum.
Moving average: The yellow moving-average line is sloping downward, confirming weakness.
Current price: Approximately 1.542, as displayed in the chart.
Market outlook
Bearish — Sellers remain in control.
Further downside is possible if selling continues.
A recovery needs strong buying volume.
A break above the moving average could be an early recovery signal.
#TRUMP
2
995
·
--
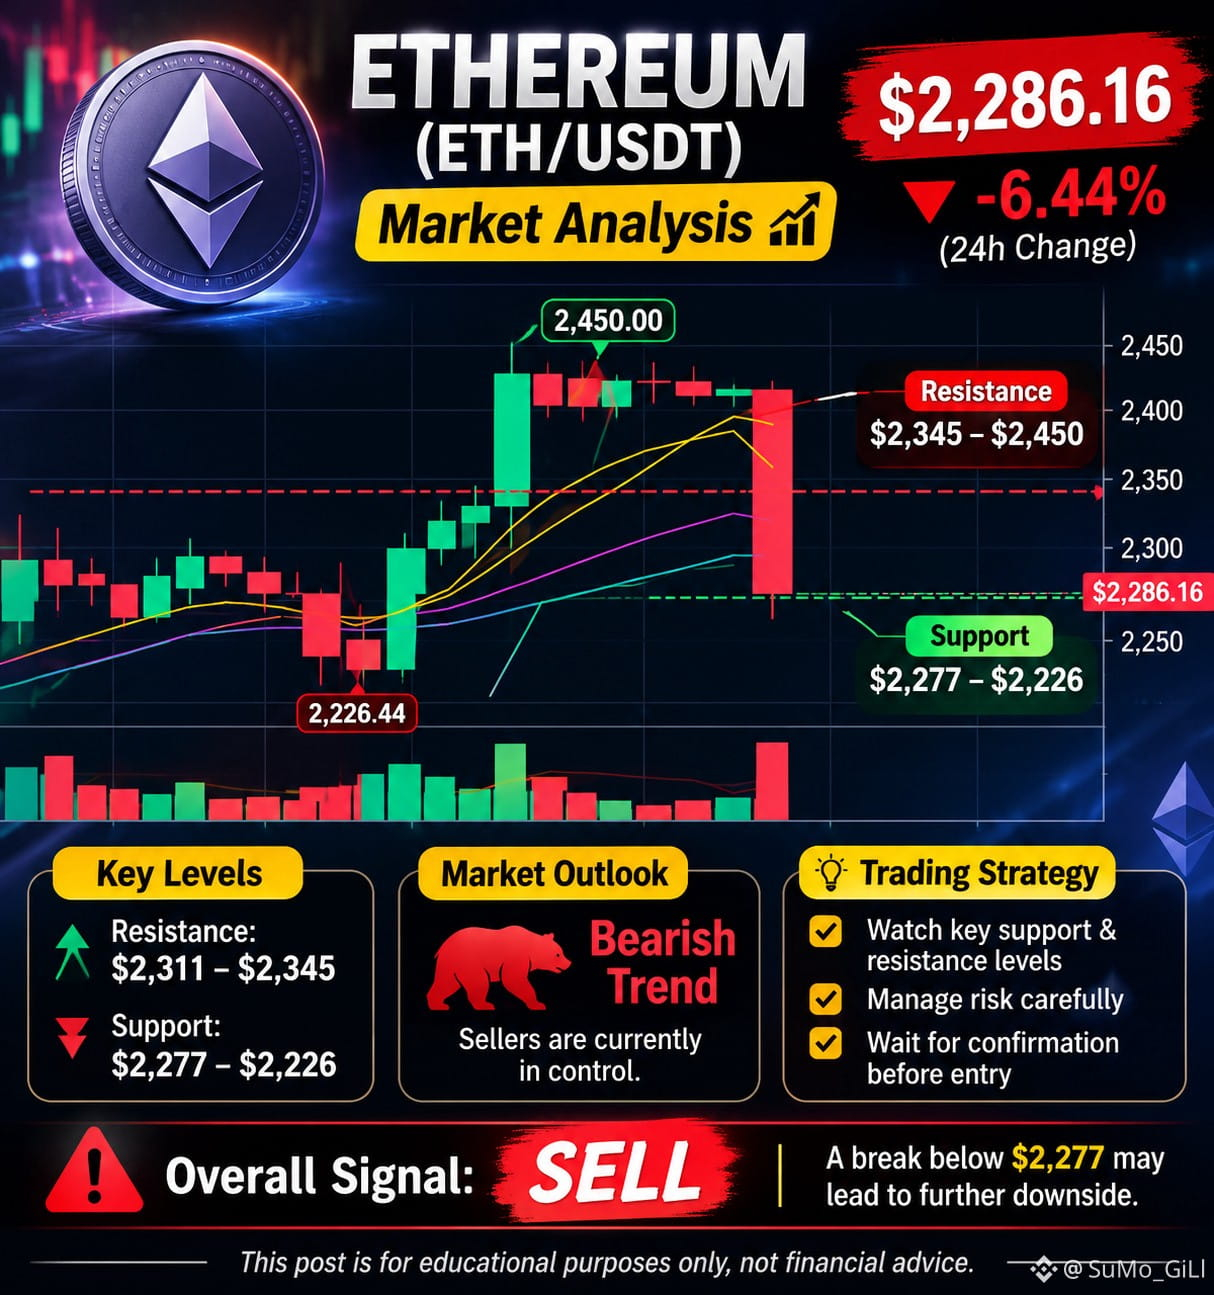
📊 ETHEREUM (ETH/USDT) MARKET ANALYSIS
🔴 Ethereum Faces Strong Selling Pressure!
Ethereum is currently trading around $ETH 2,286, down 6.44% in the last 24 hours.
📉 Technical Analysis:
- Current Price: $2,286.16
- 24H High: $2,446.28
- 24H Low: $2,277.53
- Support Zone: $2,277 – $2,226
- Resistance Zone: $2,311 – $2,345
Market Outlook:
ETH is showing bearish momentum on the 4-hour chart. Increased selling volume suggests that sellers are dominating the market.
⚠️ A break below $2,277 could trigger further downside, while a recovery above $ETH 2,345 may indicate a possible bullish reversal.
📌 Trading Strategy: Watch key support and resistance levels before entering any trade. Manage risk carefully.
{spot}(ETHUSDT)
#CryptoTrends2024 #CryptocurrencyWealth
📊 ETHEREUM (ETH/USDT) MARKET ANALYSIS
🔴 Ethereum Faces Strong Selling Pressure!
Ethereum is currently trading around $ETH 2,286, down 6.44% in the last 24 hours.
📉 Technical Analysis:
- Current Price: $2,286.16
- 24H High: $2,446.28
- 24H Low: $2,277.53
- Support Zone: $2,277 – $2,226
- Resistance Zone: $2,311 – $2,345
Market Outlook:
ETH is showing bearish momentum on the 4-hour chart. Increased selling volume suggests that sellers are dominating the market.
⚠️ A break below $2,277 could trigger further downside, while a recovery above $ETH 2,345 may indicate a possible bullish reversal.
📌 Trading Strategy: Watch key support and resistance levels before entering any trade. Manage risk carefully.
#CryptoTrends2024 #CryptocurrencyWealth
🔴 Ethereum Faces Strong Selling Pressure!
Ethereum is currently trading around $ETH 2,286, down 6.44% in the last 24 hours.
📉 Technical Analysis:
- Current Price: $2,286.16
- 24H High: $2,446.28
- 24H Low: $2,277.53
- Support Zone: $2,277 – $2,226
- Resistance Zone: $2,311 – $2,345
Market Outlook:
ETH is showing bearish momentum on the 4-hour chart. Increased selling volume suggests that sellers are dominating the market.
⚠️ A break below $2,277 could trigger further downside, while a recovery above $ETH 2,345 may indicate a possible bullish reversal.
📌 Trading Strategy: Watch key support and resistance levels before entering any trade. Manage risk carefully.
#CryptoTrends2024 #CryptocurrencyWealth
65
·
--
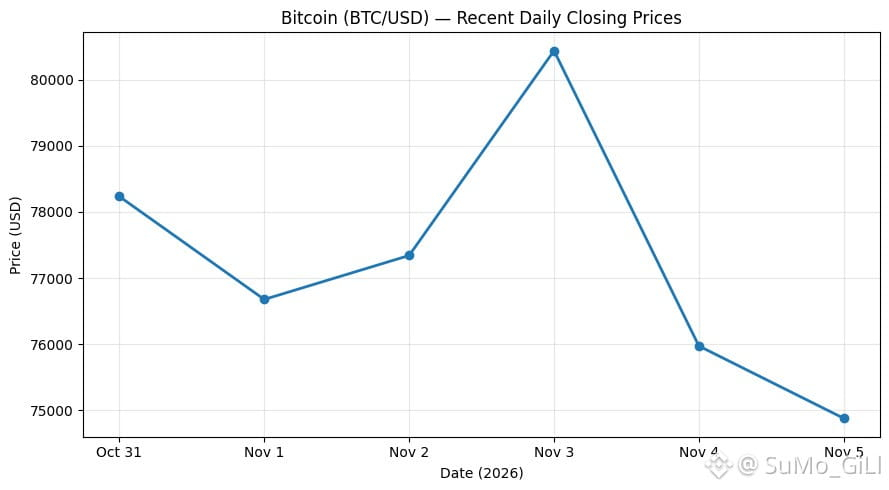
Bitcoin is facing selling pressure after a recent market decline. $BTC is testing important support around $74,979. Weak momentum and market uncertainty suggest caution.
Key levels:
Support: $74,979
Resistance: $76,647
Next target: $78,008
Lower target: $73,294
Market Outlook: If BTC breaks above $76,647, a recovery toward $78,008 is possible. If it falls below $74,979, further downside may follow.
{spot}(BTCUSDT)
#CanUSStocksReboundAfterNonfarmPayrolls? #BinanceReopensWithdrawalsForMoreAssets
Bitcoin is facing selling pressure after a recent market decline. $BTC is testing important support around $74,979. Weak momentum and market uncertainty suggest caution.
Key levels:
Support: $74,979
Resistance: $76,647
Next target: $78,008
Lower target: $73,294
Market Outlook: If BTC breaks above $76,647, a recovery toward $78,008 is possible. If it falls below $74,979, further downside may follow.
#CanUSStocksReboundAfterNonfarmPayrolls? #BinanceReopensWithdrawalsForMoreAssets
Key levels:
Support: $74,979
Resistance: $76,647
Next target: $78,008
Lower target: $73,294
Market Outlook: If BTC breaks above $76,647, a recovery toward $78,008 is possible. If it falls below $74,979, further downside may follow.
#CanUSStocksReboundAfterNonfarmPayrolls? #BinanceReopensWithdrawalsForMoreAssets
65
·
--
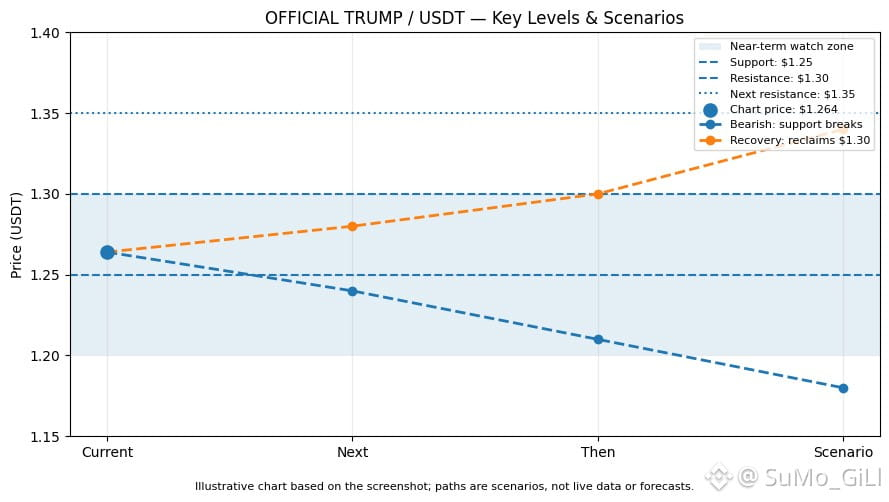
$TRUMP is experiencing strong selling pressure, dropping sharply from around $1.70 to $1.264. The chart shows consecutive red candles, indicating strong bearish momentum.
Support: $1.25 – $1.20
Resistance: $1.30 – $1.35
Bullish Scenario: A recovery above $1.30 could push the price toward $1.35.
Bearish Scenario: A break below $1.25 may trigger further downside.
{spot}(TRUMPUSDT)
#US10YearTreasuryYieldFallsTo4.845% #USMidterms-WhatAreMarketsExpecting?
$TRUMP is experiencing strong selling pressure, dropping sharply from around $1.70 to $1.264. The chart shows consecutive red candles, indicating strong bearish momentum.
Support: $1.25 – $1.20
Resistance: $1.30 – $1.35
Bullish Scenario: A recovery above $1.30 could push the price toward $1.35.
Bearish Scenario: A break below $1.25 may trigger further downside.
#US10YearTreasuryYieldFallsTo4.845% #USMidterms-WhatAreMarketsExpecting?
Support: $1.25 – $1.20
Resistance: $1.30 – $1.35
Bullish Scenario: A recovery above $1.30 could push the price toward $1.35.
Bearish Scenario: A break below $1.25 may trigger further downside.
#US10YearTreasuryYieldFallsTo4.845% #USMidterms-WhatAreMarketsExpecting?
230
·
--
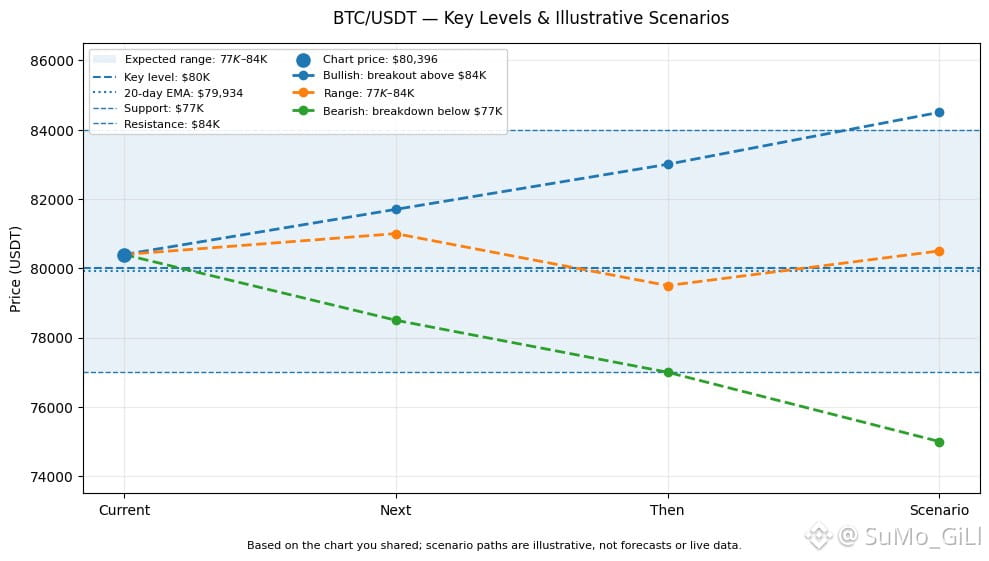
Bitcoin is trading around $BTC 80,396 (+3.6%), showing positive short-term momentum after moving above the 20-day EMA ($79,934).
🟢 Support: $80,000 / $77,000
🔴 Resistance: $82,000 / $84,000
Bullish Scenario: A breakout above $84K could trigger further upside.
Bearish Scenario: A drop below $77K may lead to stronger selling pressure.
Overall Outlook: Slightly bullish, but BTC may remain range-bound between $77K and $84K.
{spot}(BTCUSDT)
#BinanceReopensWithdrawalsForMoreAssets #Binance98PercentReplenished
Bitcoin is trading around $BTC 80,396 (+3.6%), showing positive short-term momentum after moving above the 20-day EMA ($79,934).
🟢 Support: $80,000 / $77,000
🔴 Resistance: $82,000 / $84,000
Bullish Scenario: A breakout above $84K could trigger further upside.
Bearish Scenario: A drop below $77K may lead to stronger selling pressure.
Overall Outlook: Slightly bullish, but BTC may remain range-bound between $77K and $84K.
#BinanceReopensWithdrawalsForMoreAssets #Binance98PercentReplenished
🟢 Support: $80,000 / $77,000
🔴 Resistance: $82,000 / $84,000
Bullish Scenario: A breakout above $84K could trigger further upside.
Bearish Scenario: A drop below $77K may lead to stronger selling pressure.
Overall Outlook: Slightly bullish, but BTC may remain range-bound between $77K and $84K.
#BinanceReopensWithdrawalsForMoreAssets #Binance98PercentReplenished
68
·
--
Bullish
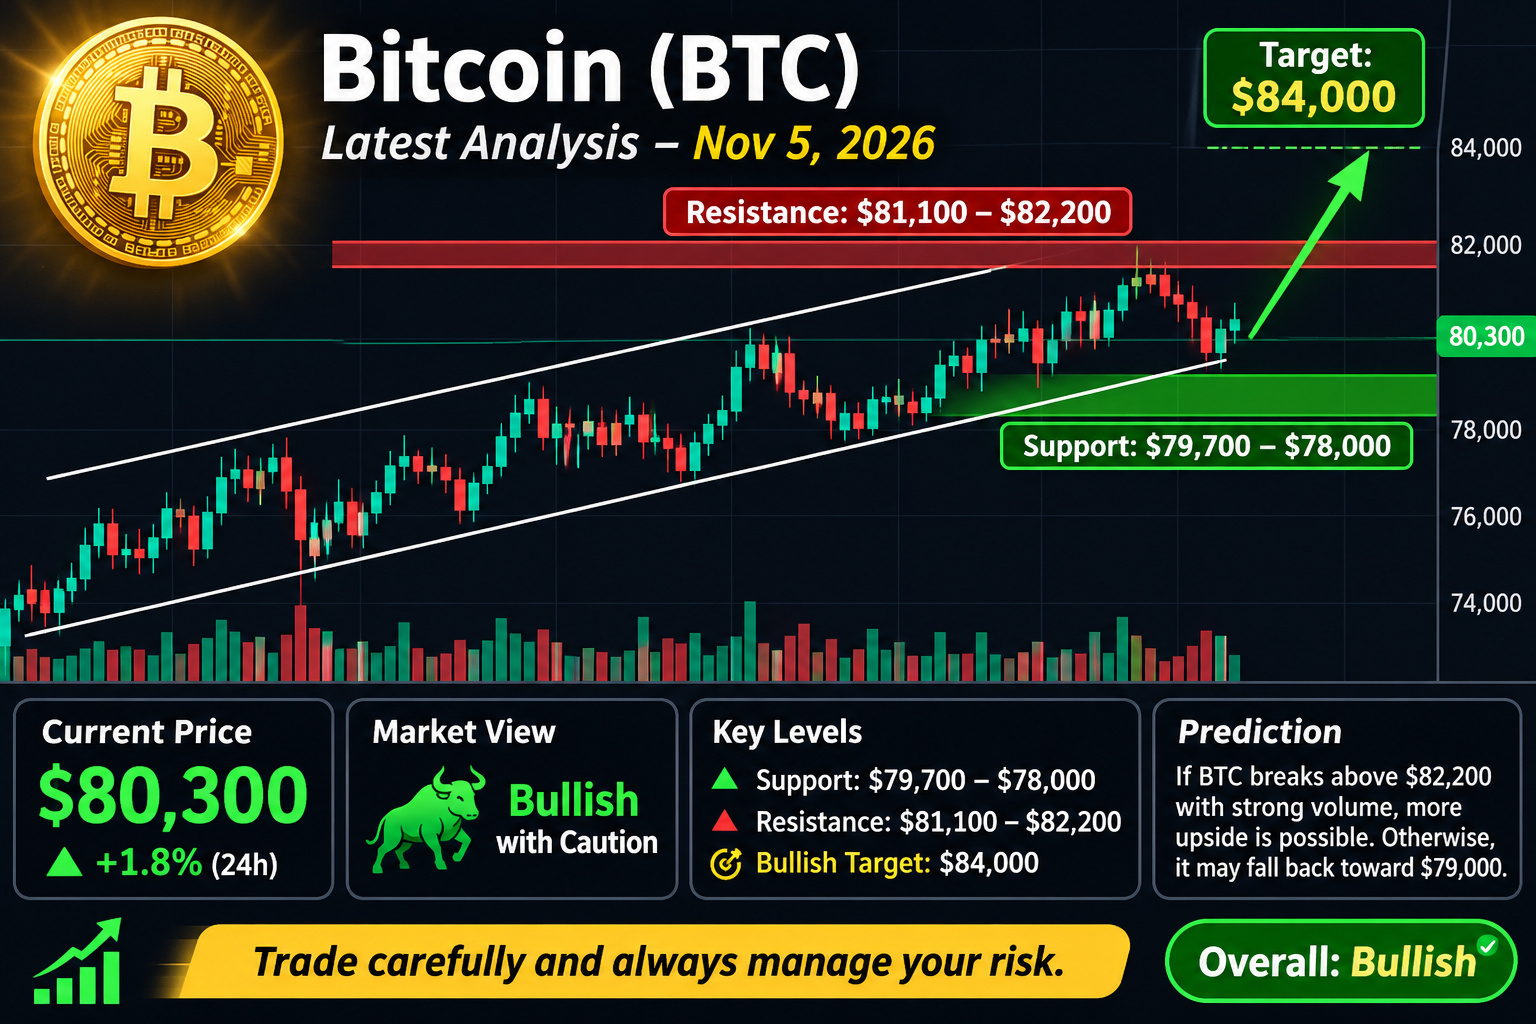
Bitcoin is showing signs of recovery after recent volatility, holding around the $BTC 80,000 level. Buyers are gaining momentum, but strong resistance remains ahead.
Key Levels:
🟢 Support: $79,700 – $78,000
🔴 Resistance: $81,100 – $82,200
🎯 Bullish Target: $84,000
My Market Prediction:
If BTC breaks above $82,200 with strong volume, further upside is possible. However, a rejection could push the price back toward $79,000 or lower.
{spot}(BTCUSDT)
#BinanceReopensWithdrawalsForMoreAssets #Binance98PercentReplenished
Bitcoin is showing signs of recovery after recent volatility, holding around the $BTC 80,000 level. Buyers are gaining momentum, but strong resistance remains ahead.
Key Levels:
🟢 Support: $79,700 – $78,000
🔴 Resistance: $81,100 – $82,200
🎯 Bullish Target: $84,000
My Market Prediction:
If BTC breaks above $82,200 with strong volume, further upside is possible. However, a rejection could push the price back toward $79,000 or lower.
#BinanceReopensWithdrawalsForMoreAssets #Binance98PercentReplenished
Key Levels:
🟢 Support: $79,700 – $78,000
🔴 Resistance: $81,100 – $82,200
🎯 Bullish Target: $84,000
My Market Prediction:
If BTC breaks above $82,200 with strong volume, further upside is possible. However, a rejection could push the price back toward $79,000 or lower.
#BinanceReopensWithdrawalsForMoreAssets #Binance98PercentReplenished
74
·
--
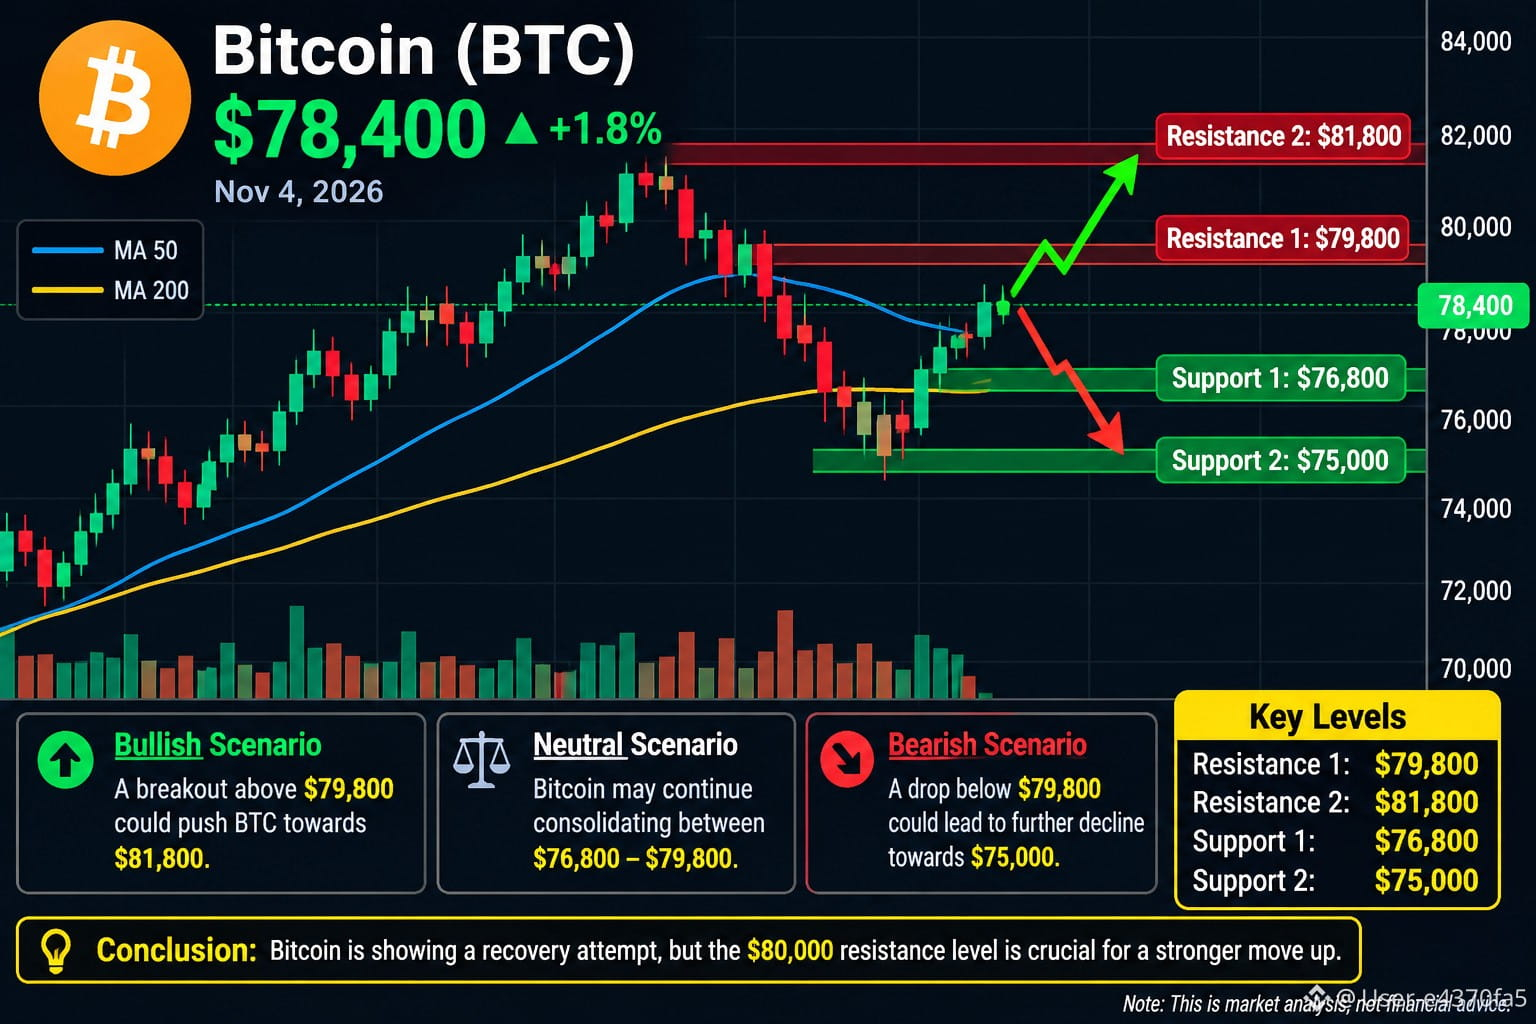
Bitcoin is showing signs of a short-term recovery after recent selling pressure. is trading around
$BTC 78,400, but the overall market remains cautious. Investors are watching the $76,000 support zone and whether Bitcoin can break above $80,000.
Key Technical Levels
Indicator Price
Resistance 1 $79,800
Resistance 2 $81,800
Support 1 $76,800
Support 2 $75,000
Market Outlook
Bullish: A strong breakout above $79,800 could push BTC towards $81,800.
Bearish: A breakdown below $76,800 could lead to further downside towars $75,000.
Neutral: Bitcoin may continue consolidating between $76,800 and $79,800.
{spot}(BTCUSDT)
Bitcoin is showing signs of a short-term recovery after recent selling pressure. is trading around
$BTC 78,400, but the overall market remains cautious. Investors are watching the $76,000 support zone and whether Bitcoin can break above $80,000.
Key Technical Levels
Indicator Price
Resistance 1 $79,800
Resistance 2 $81,800
Support 1 $76,800
Support 2 $75,000
Market Outlook
Bullish: A strong breakout above $79,800 could push BTC towards $81,800.
Bearish: A breakdown below $76,800 could lead to further downside towars $75,000.
Neutral: Bitcoin may continue consolidating between $76,800 and $79,800.
$BTC 78,400, but the overall market remains cautious. Investors are watching the $76,000 support zone and whether Bitcoin can break above $80,000.
Key Technical Levels
Indicator Price
Resistance 1 $79,800
Resistance 2 $81,800
Support 1 $76,800
Support 2 $75,000
Market Outlook
Bullish: A strong breakout above $79,800 could push BTC towards $81,800.
Bearish: A breakdown below $76,800 could lead to further downside towars $75,000.
Neutral: Bitcoin may continue consolidating between $76,800 and $79,800.
48
·
--
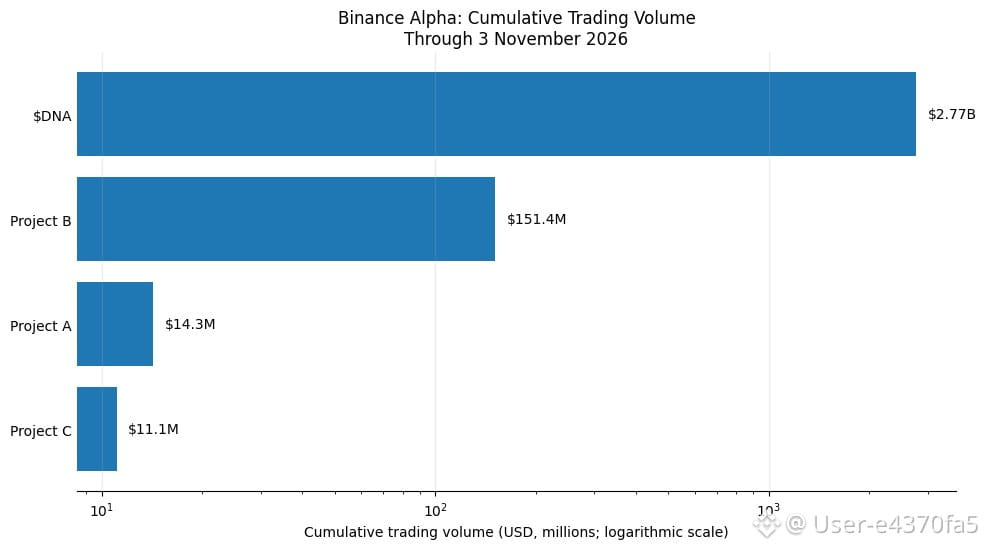
$DNA is showing impressive trading activity on Binance Alpha, recording $2.77 billion in cumulative volume and 85.4 million trades within just 19 days. It has also recorded 14 days with trading volume above $100 million, showing strong market participation.
Compared with similar projects, $DNA is demonstrating significantly higher trading activity, suggesting growing market interest and liquidity.
Market Outlook: Strong trading volume is a positive signal, but investors should monitor price action, liquidity sustainability, and market sentiment before making trading decisions.#DNA_Token #BinanceReopensWithdrawalsForMoreAssets #HongKongToLicenseVirtualAssetCustodyAndAdvisory #BinanceHourlyDepositsExceedWithdrawals #BinanceReopensWithdrawalsForMoreAssets
{alpha}(560xa991f61940095aea0724ef54077223b048c5cf7b)
$DNA is showing impressive trading activity on Binance Alpha, recording $2.77 billion in cumulative volume and 85.4 million trades within just 19 days. It has also recorded 14 days with trading volume above $100 million, showing strong market participation.
Compared with similar projects, $DNA is demonstrating significantly higher trading activity, suggesting growing market interest and liquidity.
Market Outlook: Strong trading volume is a positive signal, but investors should monitor price action, liquidity sustainability, and market sentiment before making trading decisions.#DNA_Token #BinanceReopensWithdrawalsForMoreAssets #HongKongToLicenseVirtualAssetCustodyAndAdvisory #BinanceHourlyDepositsExceedWithdrawals #BinanceReopensWithdrawalsForMoreAssets
Compared with similar projects, $DNA is demonstrating significantly higher trading activity, suggesting growing market interest and liquidity.
Market Outlook: Strong trading volume is a positive signal, but investors should monitor price action, liquidity sustainability, and market sentiment before making trading decisions.#DNA_Token #BinanceReopensWithdrawalsForMoreAssets #HongKongToLicenseVirtualAssetCustodyAndAdvisory #BinanceHourlyDepositsExceedWithdrawals #BinanceReopensWithdrawalsForMoreAssets
103
·
--
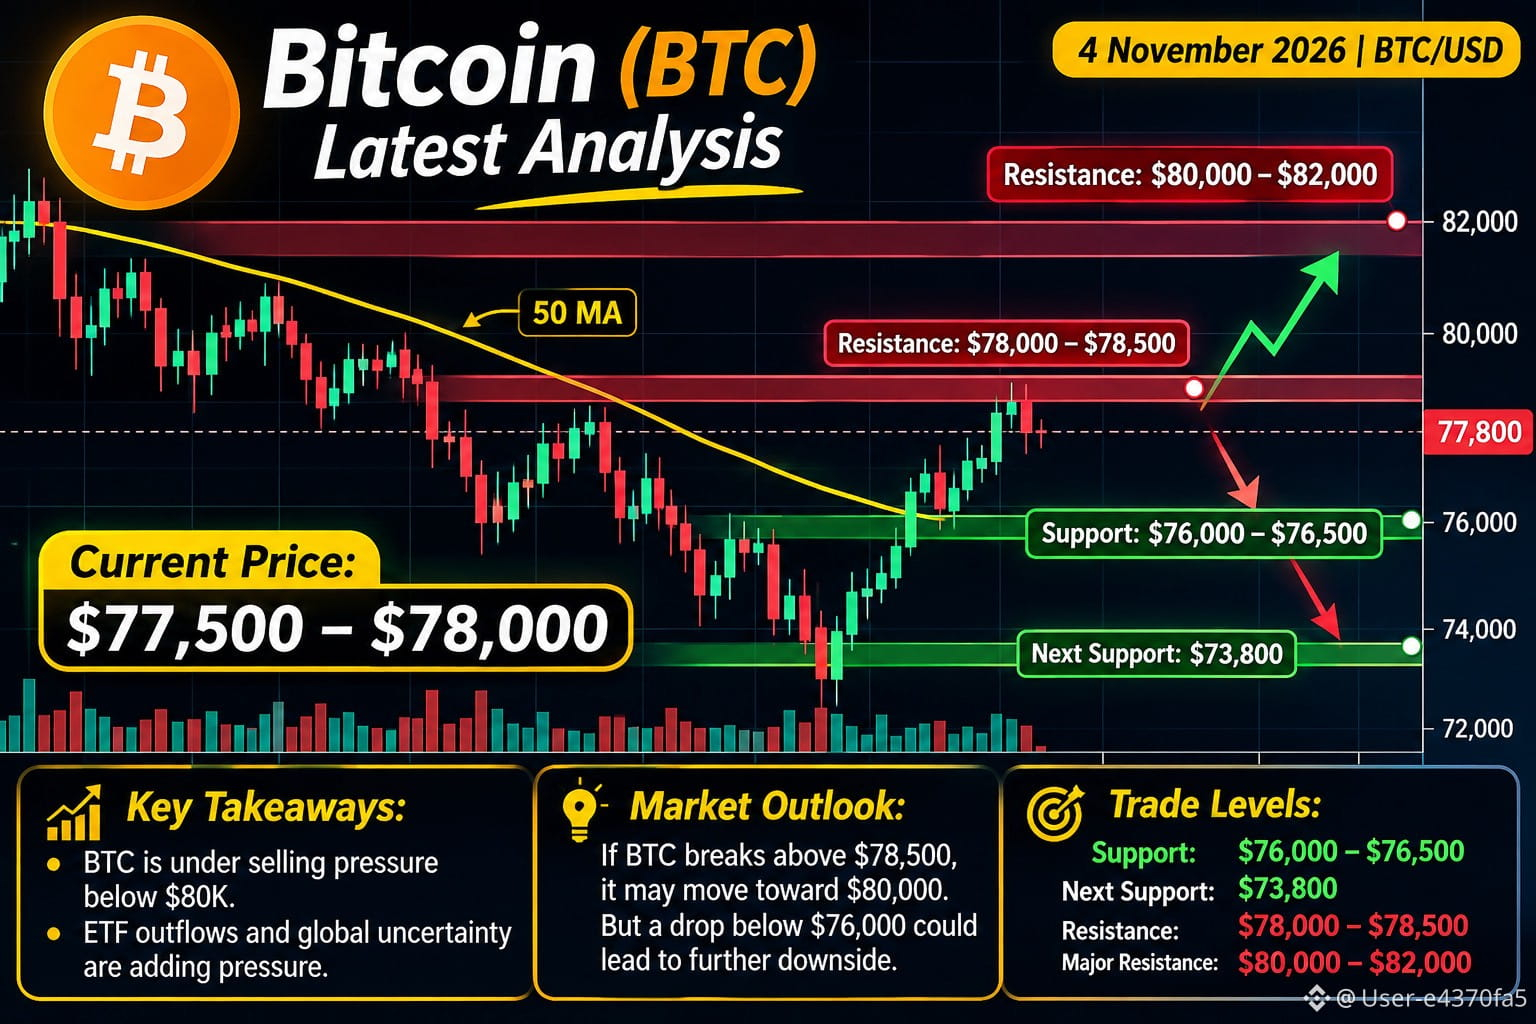
Current price: Around $BTC 78,300
{future}(BTCUSDT)
Bitcoin has recovered after briefly dropping below $76,000. However, selling pressure and institutional ETF outflows are keeping the market uncertain. BTC needs to break above $78,500 to strengthen its recovery.
Key trading levels:
Support: $76,400–$75,600
Stronger support: $73,800
Resistance: $78,500
Next resistance: $80,000–$82,000
Prediction: A breakout above $78,500 could push BTC toward $80,000. A fall below $75,600 could lead to further losses.#USMidterms-WhatAreMarketsExpecting? #USOctoberNFP-AreRateCutsStillPossible #AMDBeatsExpectations-AINarrativeContinues #BinanceIncidentReport #37thQuarterlyBNBBurnRemoves1.64MillionBNB
Current price: Around $BTC 78,300
Bitcoin has recovered after briefly dropping below $76,000. However, selling pressure and institutional ETF outflows are keeping the market uncertain. BTC needs to break above $78,500 to strengthen its recovery.
Key trading levels:
Support: $76,400–$75,600
Stronger support: $73,800
Resistance: $78,500
Next resistance: $80,000–$82,000
Prediction: A breakout above $78,500 could push BTC toward $80,000. A fall below $75,600 could lead to further losses.#USMidterms-WhatAreMarketsExpecting? #USOctoberNFP-AreRateCutsStillPossible #AMDBeatsExpectations-AINarrativeContinues #BinanceIncidentReport #37thQuarterlyBNBBurnRemoves1.64MillionBNB
Bitcoin has recovered after briefly dropping below $76,000. However, selling pressure and institutional ETF outflows are keeping the market uncertain. BTC needs to break above $78,500 to strengthen its recovery.
Key trading levels:
Support: $76,400–$75,600
Stronger support: $73,800
Resistance: $78,500
Next resistance: $80,000–$82,000
Prediction: A breakout above $78,500 could push BTC toward $80,000. A fall below $75,600 could lead to further losses.#USMidterms-WhatAreMarketsExpecting? #USOctoberNFP-AreRateCutsStillPossible #AMDBeatsExpectations-AINarrativeContinues #BinanceIncidentReport #37thQuarterlyBNBBurnRemoves1.64MillionBNB
78
Log in to explore more content
Join global crypto users on Binance Square
⚡️ Get latest and useful information about crypto.
💬 Trusted by the world’s largest crypto exchange.
👍 Discover real insights from verified creators.
Email / Phone number
Trending Topics
JobsReportRaisesHikeOdds
198,358 views
1,623 Discussing
TradFi News | US Adds 165,000 Jobs in October, More Than Double the 65,000 Forecast, as Unemployment Falls to 4.1%
Binance News
·28 Likes
·20.7k views
CPITestsDecemberRateOutlook
4,657 views
84 Discussing
BitcoinRebounds$75KAsChipsLead
18,067 views
191 Discussing