
MRT Trader
5.3k Posts

MRT Trader
Report
Block User
Follow for Insights and Signal. Lunching our own Crypto Assets.
Open Trade
Occasional Trader
3 Years
1.1K+ Following
5.7K+ Followers
7.0K+ Liked
Posts
Portfolio
All
Quotes
Videos
Live
PINNED
·
--
Article
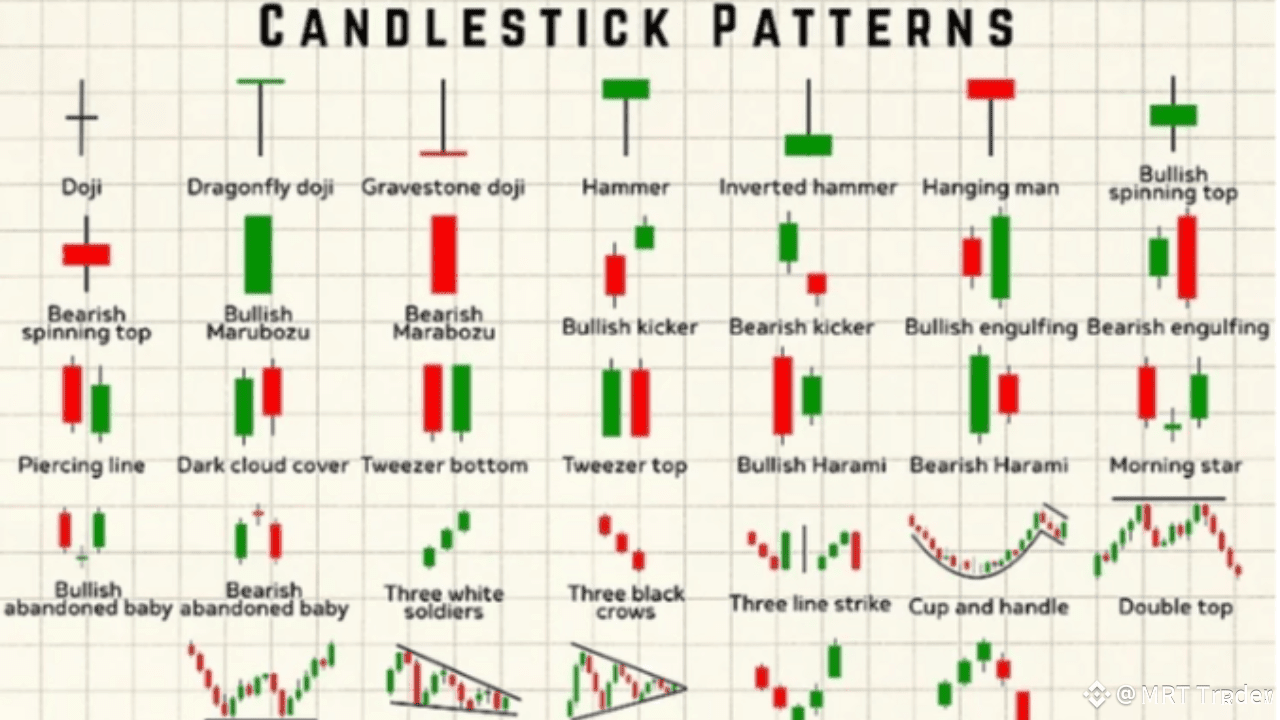
A Beginner’s Guide to Candlestick PatternsThere are two basic forms of information that traders rely on: fundamental analysis (FA), the study of a company’s financial books and ratios, and technical analysis (TA), the study of a stock’s price behavior. With FA, the aim is to identify undervalued companies that should grow in the future, while TA aims to predict future price action based on past behavior. To do this, traders track candlestick patterns. In this article, we’ll explain how to read candles and cover the 37 most essential patterns that every active trader and chartist needs to know.
Common Candlestick Patterns Cheat Sheet
What is a candlestick pattern?
To understand candle patterns, you must know how to read a candle.Candlesticks themselves contain a wealth of information. Ever since they were invented in the 1700s by Japanese rice traders, they’ve helped investors and traders everywhere visualize price action. Here are the components of a candle:[1]Duration. This one isn’t actually on the candle, but the duration of your chart determines the duration of the candle, so it’s important to keep in mind. For example, on a weekly chart, a single candle represents one week. On a daily chart, a candle represents one day, etc.Body. The body of the candle refers to the filled-in blocky part that makes up most of the candle itself.The top and bottom of a candle represent where the price started and closed.Color. The color of the candle determines whether the price went up or down.A red candle started the trading period at the top of the candle and closed the trading period at the bottom.A green candle is the opposite. The bottom of the candle is where trading started and the trading period closed at the top of the body.Size. The size tells you how far the price moved from open to close.A small candle represents relatively little price movement.A large candle represents a lot of price movement.Wick. The wick is the little line that pops out of the top and bottom of the candle’s body. Wicks represent the peaks of that trading period’s price level.A short wick means the price didn’t move very far away from the opening or closing price (depending on the color).A long wick means the price moved well outside of the range of the open or close (depending on the color).
Single Candlestick Patterns
DojiA doji has basically no body, indicating the open and close price were basically identical. The size of the wick may indicate how much volatility occurred over the session, but this neutral candle often indicates uncertainty (or lack of trading interest).[2]Bullish or bearish? Neutral.Dragonfly dojiA dragonfly doji refers to a doji with an extremely long bottom-side wick, indicating there was a of intrasession price action below the open and close.Bullish or bearish? Bullish.Gravestone dojiAlso known as the inverted dragonfly, this doji has a long wick above the body. This is universally noted as bearish, since it means there was a larger attempt for the price to move higher that ultimately failed.Bullish or bearish? Bearish.HammerA hammer is always green. It has a small body with a wick sticking out through the bottom of the candle. That wick may be relatively short or kind of on the longer side.[3]Bullish or bearish? Bullish.Inverted hammerPeople assume the inverted hammer is bearish since it’s the “opposite” of a hammer, but it’s not. The green body with the wick on top indicates the market is trying to push the price higher, even if there might have been a return to lower levels heading into close.Bullish or bearish? Bullish.Hanging manThe hanging man looks identical to the hammer except it can be red or green. The key with the hanging man is when it appears. It only counts as a hanging man candle if it appears after a dedicated uptrend.Bullish or bearish? Bearish.The hanging man is often considered a potential reversal indicator, meaning that it’s possible the uptrend will become a downtrend.Bullish spinning topNicknamed the spinning top after its shape (it looks kind of like a children’s top), the bullish spinning top has a small, green body and a wick sticking out of both ends. It can only appear after a prolonged downtrend.Bullish or bearish? Bullish. Also, a reversal indicator.Bearish spinning topThe bearish spinning top is the inverse of a bullish spinning top—it’s just a red body and it appears after a prolonged uptrend.Bullish or bearish? Bearish. Also, a reversal indicator.Bullish MarubozuThe bullish Marubozu stands out prominently on charts. It's got a very large body and no wick on either side (or an extremely tiny wick). The bullish Marubozu is a huge sign that the market is moving with conviction in one direction.[4]Bullish or bearish? Bullish.Bearish MarubozuThe only difference between the bullish and the bearish Marubozu is the color of the body. The bullish version is green; the bearish version is red.[5]Bullish or bearish? Bearish.
Double Candlestick Patterns
Bullish kickerThe bullish kicker occurs when a red candle is followed immediately by a green candle with a gap between the two.[6]Bullish or bearish? Bullish.What is a gap? A gap refers to a specific phenomenon that occurs between candlesticks. Normally, one candle overlaps with the next one, indicating that the price is moving in increments. A gap occurs when there’s open space separating one candle and another. This occurs when the price jumps way up (or way down) between sessions.Bearish kickerA bearish kicker is the opposite of a bullish kicker—a green candle is followed by a red candle that gaps down.[7]Bullish or bearish? Bearish.Bullish engulfingA bullish engulfing candle occurs when a green candle follows a red candle. The “engulfing” part is where the green candle is bigger than the red candle in terms of the body. The green candle has a lower low and a higher high.[8]Bullish or bearish? Bullish. This is also considered a reversal pattern.Bearish engulfingThe bearish engulfing candle occurs when a green candle is completely engulfed by a larger red candle.Bullish or bearish? Bearish. This is widely accepted as a reversal pattern.Piercing lineThe piercing line is one of the more difficult patterns to spot just because it seems kind of innocuous at first. It requires a long red candle with short wicks, followed by a smaller green candle that punctures the base of the previous candle’s bottom.[9]Bullish or bearish? Bullish. This is also considered a reversal pattern.Dark cloud coverDark cloud cover is the opposite of a piercing line—a green candle with a large body is followed by a red candle with a smaller body. The top of the red candle must be higher than the top of the green candle, and the bottom of the red candle must hit roughly around the midpoint of the green candle.[10]Bullish or bearish? Bearish. This is also a reversal pattern.Tweezer bottomThe tweezer bottom is easy to spot by the two long wicks that stop at the same price level. This pattern also must occur at the bottom of a downtrend, and the two candles must have relatively similar tops. The first candle must be red and the second candle must be green.[11]Bullish or bearish? Bullish. This is also considered to be a reversal pattern.Tweezer topThe tweezer top is the inverse of the tweezer bottom. Two long wicks must sit at the same price level, the first candle must be green, and the second candle must be red. Also, this pattern only counts if it appears at the top of an uptrend.[12]Bullish or bearish? Bearish. This is a reversal pattern.Bullish HaramiThe bullish Harami is noted by its large red candle, followed by an engulfed green candle. The green candle must be small, and there must be a wick hanging from the bottom of the candle.[13]Bullish or bearish? Bullish.Bearish HaramiThe bearish Harami requires a large green candle followed by an engulfed red candle with a tiny wick on top.[14]Bullish or bearish? Bearish.
Triple Candlestick Patterns
Morning starThe morning star pattern is considered a classic reversal pattern. It is noted by a substantial red candle, a smaller green candle that gaps down, and a larger green candle that gaps up. The last candle must close higher than the midpoint of the first candle.[15]Bullish or bearish? Bullish.Bullish abandoned babyIf you see a substantial red candle and a gap down to a green doji followed by a gap up and a huge green candle, you’re looking at a bullish abandoned baby. You can remember this pattern by noting that the tiny doji looks like it has been “abandoned” by the red and green “parents” above it.[16]Bullish or bearish? Bullish.Bearish abandoned babyThe bearish abandoned baby is the reverse of the bullish abandoned baby. The first candle is green, the “baby” will be a doji floating above, and the last candle below will be red.[17]Bullish or bearish? Bearish.Three white soldiersThree white soldiers is pretty easy to remember because it's just three green candles. The candles must all be green and either matching or drifting upwards.[18]Bullish or bearish? Bullish. This is considered one of the more consistent patterns in TA.Three black crowsThree black crows is the opposite of three white soldiers. You’ve got three red candles with large bodies all matching levels or slowly drifting downward.[19]Bullish or bearish? Bearish.Three line strikeThree line strike is actually a four-candle pattern. It is sort of an extension of the three black crows or three white soldiers and is considered a reversal pattern. It occurs when a large engulfing candle overtakes the three previous candles of a different color. So, with three white soldiers, you’d need a large red candle to overtake the previous three. With three black crows, you’d need a giant green candle to overtake the previous three.[20]Bullish or bearish? Depends on the trend.
Larger Patterns
Cup and handleThe cup and handle is a larger pattern consisting usually of 20+ candles. It appears kind of like an old school coffee cup: there’s a large downtrend that smooths out at the bottom of the “cup.” Then, there’s an uptrend that matches the downtrend symmetrically. At the end of the “cup,” a sharp downturn marks the “handle,” which is often followed by a new bullish trend.[21]Bullish or bearish? Bullish.Double topA double top simply refers to any extended series of candles where the peak of the uptrend stops at a specific price level twice. These are typically easy to spot because the wicks will poke out from the chart and touch the same price level twice.[22]Bullish or bearish? Bearish.Double bottomThe inverse of the double top is the double bottom. It’s any pattern where two wicks in a channel touch down at the same price level.[23]Bullish or bearish? Bullish.WedgeWedges are a type of channel. They are noted by an upward or downward trend where the channel slowly feeds down into a narrower point. As the wedge tightens, it gets closer to a decision area where the trend can break up or down.[24]Bullish or bearish? Neutral. The shape of the wedge can help you identify confirmations and reversals, but the wedges themselves aren’t bearish or bullish.What is a channel? A channel is sort of like a lane on a road. It refers to two lines that contain all of the price action in an area. The edges of a channel are often the source of resistance or support points.FlagFlags, also known as pennants, are a kind of extremely tight wedge that often appears after large moves up or down. The shape of the flag is more of a triangular boat flag as opposed to a standard national flag.[25]Bullish or bearish? Neutral. Flags don’t signal anything other than decision points where investors and traders are unsure of what to do.
Confirmation Patterns
Rising windowThe rising window is a two-candle confirmation signal that occurs when a candle gaps up past a support or resistance line following an uptrend.[26]Bullish or bearish? Bullish.What is a confirmation? In technical analysis, a confirmation refers to any event which affirms the previous signal. So, take three white soldiers—a classic bullish signal. If the three white soldiers sit on a resistance line and then a rising window breaks that line, it is considered a confirmation—the bullish trend is set to continue.Falling windowThe falling window (sometimes casually and incorrectly called a falling dagger) is the reverse of a rising window. It’s a two-candle confirmation that breaks a trend or support/resistance line by gapping down past it.[27]Bullish or bearish? Bearish.Three inside upFollowing a period of consolidation or a downward trend, you can spot a reversal confirmation with the three inside up pattern. This is a large red candle, a smaller green candle that sits around the base of the first candle, and then a green candle rising above the first candle's high.[28]Bullish or bearish? Bullish.Three inside downThree inside down is the bearish version of the three inside up. A large green candle is followed by a rising red candle, then a red candle that breaks the previous low of the initial green candle.[29]Bullish or bearish? Bearish.Three outside upThree outside up is a bullish confirmation signal that requires a red candle, an engulfing green candle, and a third green candle with a midpoint higher than the top of the previous candle.[30]Bullish or bearish? Bullish.Three outside downThree outside down is the reverse of the three outside up. A green candle is engulfed by a large red candle, then there’s a third red candle trending down and passing the base of the engulfing candle.Bullish or bearish? Bearish.
$ETH
{spot}(ETHUSDT)
$BTC
{spot}(BTCUSDT)
A Beginner’s Guide to Candlestick Patterns
There are two basic forms of information that traders rely on: fundamental analysis (FA), the study of a company’s financial books and ratios, and technical analysis (TA), the study of a stock’s price behavior. With FA, the aim is to identify undervalued companies that should grow in the future, while TA aims to predict future price action based on past behavior. To do this, traders track candlestick patterns. In this article, we’ll explain how to read candles and cover the 37 most essential patterns that every active trader and chartist needs to know.
Common Candlestick Patterns Cheat Sheet
What is a candlestick pattern?
To understand candle patterns, you must know how to read a candle.Candlesticks themselves contain a wealth of information. Ever since they were invented in the 1700s by Japanese rice traders, they’ve helped investors and traders everywhere visualize price action. Here are the components of a candle:[1]Duration. This one isn’t actually on the candle, but the duration of your chart determines the duration of the candle, so it’s important to keep in mind. For example, on a weekly chart, a single candle represents one week. On a daily chart, a candle represents one day, etc.Body. The body of the candle refers to the filled-in blocky part that makes up most of the candle itself.The top and bottom of a candle represent where the price started and closed.Color. The color of the candle determines whether the price went up or down.A red candle started the trading period at the top of the candle and closed the trading period at the bottom.A green candle is the opposite. The bottom of the candle is where trading started and the trading period closed at the top of the body.Size. The size tells you how far the price moved from open to close.A small candle represents relatively little price movement.A large candle represents a lot of price movement.Wick. The wick is the little line that pops out of the top and bottom of the candle’s body. Wicks represent the peaks of that trading period’s price level.A short wick means the price didn’t move very far away from the opening or closing price (depending on the color).A long wick means the price moved well outside of the range of the open or close (depending on the color).
Single Candlestick Patterns
DojiA doji has basically no body, indicating the open and close price were basically identical. The size of the wick may indicate how much volatility occurred over the session, but this neutral candle often indicates uncertainty (or lack of trading interest).[2]Bullish or bearish? Neutral.Dragonfly dojiA dragonfly doji refers to a doji with an extremely long bottom-side wick, indicating there was a of intrasession price action below the open and close.Bullish or bearish? Bullish.Gravestone dojiAlso known as the inverted dragonfly, this doji has a long wick above the body. This is universally noted as bearish, since it means there was a larger attempt for the price to move higher that ultimately failed.Bullish or bearish? Bearish.HammerA hammer is always green. It has a small body with a wick sticking out through the bottom of the candle. That wick may be relatively short or kind of on the longer side.[3]Bullish or bearish? Bullish.Inverted hammerPeople assume the inverted hammer is bearish since it’s the “opposite” of a hammer, but it’s not. The green body with the wick on top indicates the market is trying to push the price higher, even if there might have been a return to lower levels heading into close.Bullish or bearish? Bullish.Hanging manThe hanging man looks identical to the hammer except it can be red or green. The key with the hanging man is when it appears. It only counts as a hanging man candle if it appears after a dedicated uptrend.Bullish or bearish? Bearish.The hanging man is often considered a potential reversal indicator, meaning that it’s possible the uptrend will become a downtrend.Bullish spinning topNicknamed the spinning top after its shape (it looks kind of like a children’s top), the bullish spinning top has a small, green body and a wick sticking out of both ends. It can only appear after a prolonged downtrend.Bullish or bearish? Bullish. Also, a reversal indicator.Bearish spinning topThe bearish spinning top is the inverse of a bullish spinning top—it’s just a red body and it appears after a prolonged uptrend.Bullish or bearish? Bearish. Also, a reversal indicator.Bullish MarubozuThe bullish Marubozu stands out prominently on charts. It's got a very large body and no wick on either side (or an extremely tiny wick). The bullish Marubozu is a huge sign that the market is moving with conviction in one direction.[4]Bullish or bearish? Bullish.Bearish MarubozuThe only difference between the bullish and the bearish Marubozu is the color of the body. The bullish version is green; the bearish version is red.[5]Bullish or bearish? Bearish.
Double Candlestick Patterns
Bullish kickerThe bullish kicker occurs when a red candle is followed immediately by a green candle with a gap between the two.[6]Bullish or bearish? Bullish.What is a gap? A gap refers to a specific phenomenon that occurs between candlesticks. Normally, one candle overlaps with the next one, indicating that the price is moving in increments. A gap occurs when there’s open space separating one candle and another. This occurs when the price jumps way up (or way down) between sessions.Bearish kickerA bearish kicker is the opposite of a bullish kicker—a green candle is followed by a red candle that gaps down.[7]Bullish or bearish? Bearish.Bullish engulfingA bullish engulfing candle occurs when a green candle follows a red candle. The “engulfing” part is where the green candle is bigger than the red candle in terms of the body. The green candle has a lower low and a higher high.[8]Bullish or bearish? Bullish. This is also considered a reversal pattern.Bearish engulfingThe bearish engulfing candle occurs when a green candle is completely engulfed by a larger red candle.Bullish or bearish? Bearish. This is widely accepted as a reversal pattern.Piercing lineThe piercing line is one of the more difficult patterns to spot just because it seems kind of innocuous at first. It requires a long red candle with short wicks, followed by a smaller green candle that punctures the base of the previous candle’s bottom.[9]Bullish or bearish? Bullish. This is also considered a reversal pattern.Dark cloud coverDark cloud cover is the opposite of a piercing line—a green candle with a large body is followed by a red candle with a smaller body. The top of the red candle must be higher than the top of the green candle, and the bottom of the red candle must hit roughly around the midpoint of the green candle.[10]Bullish or bearish? Bearish. This is also a reversal pattern.Tweezer bottomThe tweezer bottom is easy to spot by the two long wicks that stop at the same price level. This pattern also must occur at the bottom of a downtrend, and the two candles must have relatively similar tops. The first candle must be red and the second candle must be green.[11]Bullish or bearish? Bullish. This is also considered to be a reversal pattern.Tweezer topThe tweezer top is the inverse of the tweezer bottom. Two long wicks must sit at the same price level, the first candle must be green, and the second candle must be red. Also, this pattern only counts if it appears at the top of an uptrend.[12]Bullish or bearish? Bearish. This is a reversal pattern.Bullish HaramiThe bullish Harami is noted by its large red candle, followed by an engulfed green candle. The green candle must be small, and there must be a wick hanging from the bottom of the candle.[13]Bullish or bearish? Bullish.Bearish HaramiThe bearish Harami requires a large green candle followed by an engulfed red candle with a tiny wick on top.[14]Bullish or bearish? Bearish.
Triple Candlestick Patterns
Morning starThe morning star pattern is considered a classic reversal pattern. It is noted by a substantial red candle, a smaller green candle that gaps down, and a larger green candle that gaps up. The last candle must close higher than the midpoint of the first candle.[15]Bullish or bearish? Bullish.Bullish abandoned babyIf you see a substantial red candle and a gap down to a green doji followed by a gap up and a huge green candle, you’re looking at a bullish abandoned baby. You can remember this pattern by noting that the tiny doji looks like it has been “abandoned” by the red and green “parents” above it.[16]Bullish or bearish? Bullish.Bearish abandoned babyThe bearish abandoned baby is the reverse of the bullish abandoned baby. The first candle is green, the “baby” will be a doji floating above, and the last candle below will be red.[17]Bullish or bearish? Bearish.Three white soldiersThree white soldiers is pretty easy to remember because it's just three green candles. The candles must all be green and either matching or drifting upwards.[18]Bullish or bearish? Bullish. This is considered one of the more consistent patterns in TA.Three black crowsThree black crows is the opposite of three white soldiers. You’ve got three red candles with large bodies all matching levels or slowly drifting downward.[19]Bullish or bearish? Bearish.Three line strikeThree line strike is actually a four-candle pattern. It is sort of an extension of the three black crows or three white soldiers and is considered a reversal pattern. It occurs when a large engulfing candle overtakes the three previous candles of a different color. So, with three white soldiers, you’d need a large red candle to overtake the previous three. With three black crows, you’d need a giant green candle to overtake the previous three.[20]Bullish or bearish? Depends on the trend.
Larger Patterns
Cup and handleThe cup and handle is a larger pattern consisting usually of 20+ candles. It appears kind of like an old school coffee cup: there’s a large downtrend that smooths out at the bottom of the “cup.” Then, there’s an uptrend that matches the downtrend symmetrically. At the end of the “cup,” a sharp downturn marks the “handle,” which is often followed by a new bullish trend.[21]Bullish or bearish? Bullish.Double topA double top simply refers to any extended series of candles where the peak of the uptrend stops at a specific price level twice. These are typically easy to spot because the wicks will poke out from the chart and touch the same price level twice.[22]Bullish or bearish? Bearish.Double bottomThe inverse of the double top is the double bottom. It’s any pattern where two wicks in a channel touch down at the same price level.[23]Bullish or bearish? Bullish.WedgeWedges are a type of channel. They are noted by an upward or downward trend where the channel slowly feeds down into a narrower point. As the wedge tightens, it gets closer to a decision area where the trend can break up or down.[24]Bullish or bearish? Neutral. The shape of the wedge can help you identify confirmations and reversals, but the wedges themselves aren’t bearish or bullish.What is a channel? A channel is sort of like a lane on a road. It refers to two lines that contain all of the price action in an area. The edges of a channel are often the source of resistance or support points.FlagFlags, also known as pennants, are a kind of extremely tight wedge that often appears after large moves up or down. The shape of the flag is more of a triangular boat flag as opposed to a standard national flag.[25]Bullish or bearish? Neutral. Flags don’t signal anything other than decision points where investors and traders are unsure of what to do.
Confirmation Patterns
Rising windowThe rising window is a two-candle confirmation signal that occurs when a candle gaps up past a support or resistance line following an uptrend.[26]Bullish or bearish? Bullish.What is a confirmation? In technical analysis, a confirmation refers to any event which affirms the previous signal. So, take three white soldiers—a classic bullish signal. If the three white soldiers sit on a resistance line and then a rising window breaks that line, it is considered a confirmation—the bullish trend is set to continue.Falling windowThe falling window (sometimes casually and incorrectly called a falling dagger) is the reverse of a rising window. It’s a two-candle confirmation that breaks a trend or support/resistance line by gapping down past it.[27]Bullish or bearish? Bearish.Three inside upFollowing a period of consolidation or a downward trend, you can spot a reversal confirmation with the three inside up pattern. This is a large red candle, a smaller green candle that sits around the base of the first candle, and then a green candle rising above the first candle's high.[28]Bullish or bearish? Bullish.Three inside downThree inside down is the bearish version of the three inside up. A large green candle is followed by a rising red candle, then a red candle that breaks the previous low of the initial green candle.[29]Bullish or bearish? Bearish.Three outside upThree outside up is a bullish confirmation signal that requires a red candle, an engulfing green candle, and a third green candle with a midpoint higher than the top of the previous candle.[30]Bullish or bearish? Bullish.Three outside downThree outside down is the reverse of the three outside up. A green candle is engulfed by a large red candle, then there’s a third red candle trending down and passing the base of the engulfing candle.Bullish or bearish? Bearish.
$ETH
$BTC
Common Candlestick Patterns Cheat Sheet
What is a candlestick pattern?
To understand candle patterns, you must know how to read a candle.Candlesticks themselves contain a wealth of information. Ever since they were invented in the 1700s by Japanese rice traders, they’ve helped investors and traders everywhere visualize price action. Here are the components of a candle:[1]Duration. This one isn’t actually on the candle, but the duration of your chart determines the duration of the candle, so it’s important to keep in mind. For example, on a weekly chart, a single candle represents one week. On a daily chart, a candle represents one day, etc.Body. The body of the candle refers to the filled-in blocky part that makes up most of the candle itself.The top and bottom of a candle represent where the price started and closed.Color. The color of the candle determines whether the price went up or down.A red candle started the trading period at the top of the candle and closed the trading period at the bottom.A green candle is the opposite. The bottom of the candle is where trading started and the trading period closed at the top of the body.Size. The size tells you how far the price moved from open to close.A small candle represents relatively little price movement.A large candle represents a lot of price movement.Wick. The wick is the little line that pops out of the top and bottom of the candle’s body. Wicks represent the peaks of that trading period’s price level.A short wick means the price didn’t move very far away from the opening or closing price (depending on the color).A long wick means the price moved well outside of the range of the open or close (depending on the color).
Single Candlestick Patterns
DojiA doji has basically no body, indicating the open and close price were basically identical. The size of the wick may indicate how much volatility occurred over the session, but this neutral candle often indicates uncertainty (or lack of trading interest).[2]Bullish or bearish? Neutral.Dragonfly dojiA dragonfly doji refers to a doji with an extremely long bottom-side wick, indicating there was a of intrasession price action below the open and close.Bullish or bearish? Bullish.Gravestone dojiAlso known as the inverted dragonfly, this doji has a long wick above the body. This is universally noted as bearish, since it means there was a larger attempt for the price to move higher that ultimately failed.Bullish or bearish? Bearish.HammerA hammer is always green. It has a small body with a wick sticking out through the bottom of the candle. That wick may be relatively short or kind of on the longer side.[3]Bullish or bearish? Bullish.Inverted hammerPeople assume the inverted hammer is bearish since it’s the “opposite” of a hammer, but it’s not. The green body with the wick on top indicates the market is trying to push the price higher, even if there might have been a return to lower levels heading into close.Bullish or bearish? Bullish.Hanging manThe hanging man looks identical to the hammer except it can be red or green. The key with the hanging man is when it appears. It only counts as a hanging man candle if it appears after a dedicated uptrend.Bullish or bearish? Bearish.The hanging man is often considered a potential reversal indicator, meaning that it’s possible the uptrend will become a downtrend.Bullish spinning topNicknamed the spinning top after its shape (it looks kind of like a children’s top), the bullish spinning top has a small, green body and a wick sticking out of both ends. It can only appear after a prolonged downtrend.Bullish or bearish? Bullish. Also, a reversal indicator.Bearish spinning topThe bearish spinning top is the inverse of a bullish spinning top—it’s just a red body and it appears after a prolonged uptrend.Bullish or bearish? Bearish. Also, a reversal indicator.Bullish MarubozuThe bullish Marubozu stands out prominently on charts. It's got a very large body and no wick on either side (or an extremely tiny wick). The bullish Marubozu is a huge sign that the market is moving with conviction in one direction.[4]Bullish or bearish? Bullish.Bearish MarubozuThe only difference between the bullish and the bearish Marubozu is the color of the body. The bullish version is green; the bearish version is red.[5]Bullish or bearish? Bearish.
Double Candlestick Patterns
Bullish kickerThe bullish kicker occurs when a red candle is followed immediately by a green candle with a gap between the two.[6]Bullish or bearish? Bullish.What is a gap? A gap refers to a specific phenomenon that occurs between candlesticks. Normally, one candle overlaps with the next one, indicating that the price is moving in increments. A gap occurs when there’s open space separating one candle and another. This occurs when the price jumps way up (or way down) between sessions.Bearish kickerA bearish kicker is the opposite of a bullish kicker—a green candle is followed by a red candle that gaps down.[7]Bullish or bearish? Bearish.Bullish engulfingA bullish engulfing candle occurs when a green candle follows a red candle. The “engulfing” part is where the green candle is bigger than the red candle in terms of the body. The green candle has a lower low and a higher high.[8]Bullish or bearish? Bullish. This is also considered a reversal pattern.Bearish engulfingThe bearish engulfing candle occurs when a green candle is completely engulfed by a larger red candle.Bullish or bearish? Bearish. This is widely accepted as a reversal pattern.Piercing lineThe piercing line is one of the more difficult patterns to spot just because it seems kind of innocuous at first. It requires a long red candle with short wicks, followed by a smaller green candle that punctures the base of the previous candle’s bottom.[9]Bullish or bearish? Bullish. This is also considered a reversal pattern.Dark cloud coverDark cloud cover is the opposite of a piercing line—a green candle with a large body is followed by a red candle with a smaller body. The top of the red candle must be higher than the top of the green candle, and the bottom of the red candle must hit roughly around the midpoint of the green candle.[10]Bullish or bearish? Bearish. This is also a reversal pattern.Tweezer bottomThe tweezer bottom is easy to spot by the two long wicks that stop at the same price level. This pattern also must occur at the bottom of a downtrend, and the two candles must have relatively similar tops. The first candle must be red and the second candle must be green.[11]Bullish or bearish? Bullish. This is also considered to be a reversal pattern.Tweezer topThe tweezer top is the inverse of the tweezer bottom. Two long wicks must sit at the same price level, the first candle must be green, and the second candle must be red. Also, this pattern only counts if it appears at the top of an uptrend.[12]Bullish or bearish? Bearish. This is a reversal pattern.Bullish HaramiThe bullish Harami is noted by its large red candle, followed by an engulfed green candle. The green candle must be small, and there must be a wick hanging from the bottom of the candle.[13]Bullish or bearish? Bullish.Bearish HaramiThe bearish Harami requires a large green candle followed by an engulfed red candle with a tiny wick on top.[14]Bullish or bearish? Bearish.
Triple Candlestick Patterns
Morning starThe morning star pattern is considered a classic reversal pattern. It is noted by a substantial red candle, a smaller green candle that gaps down, and a larger green candle that gaps up. The last candle must close higher than the midpoint of the first candle.[15]Bullish or bearish? Bullish.Bullish abandoned babyIf you see a substantial red candle and a gap down to a green doji followed by a gap up and a huge green candle, you’re looking at a bullish abandoned baby. You can remember this pattern by noting that the tiny doji looks like it has been “abandoned” by the red and green “parents” above it.[16]Bullish or bearish? Bullish.Bearish abandoned babyThe bearish abandoned baby is the reverse of the bullish abandoned baby. The first candle is green, the “baby” will be a doji floating above, and the last candle below will be red.[17]Bullish or bearish? Bearish.Three white soldiersThree white soldiers is pretty easy to remember because it's just three green candles. The candles must all be green and either matching or drifting upwards.[18]Bullish or bearish? Bullish. This is considered one of the more consistent patterns in TA.Three black crowsThree black crows is the opposite of three white soldiers. You’ve got three red candles with large bodies all matching levels or slowly drifting downward.[19]Bullish or bearish? Bearish.Three line strikeThree line strike is actually a four-candle pattern. It is sort of an extension of the three black crows or three white soldiers and is considered a reversal pattern. It occurs when a large engulfing candle overtakes the three previous candles of a different color. So, with three white soldiers, you’d need a large red candle to overtake the previous three. With three black crows, you’d need a giant green candle to overtake the previous three.[20]Bullish or bearish? Depends on the trend.
Larger Patterns
Cup and handleThe cup and handle is a larger pattern consisting usually of 20+ candles. It appears kind of like an old school coffee cup: there’s a large downtrend that smooths out at the bottom of the “cup.” Then, there’s an uptrend that matches the downtrend symmetrically. At the end of the “cup,” a sharp downturn marks the “handle,” which is often followed by a new bullish trend.[21]Bullish or bearish? Bullish.Double topA double top simply refers to any extended series of candles where the peak of the uptrend stops at a specific price level twice. These are typically easy to spot because the wicks will poke out from the chart and touch the same price level twice.[22]Bullish or bearish? Bearish.Double bottomThe inverse of the double top is the double bottom. It’s any pattern where two wicks in a channel touch down at the same price level.[23]Bullish or bearish? Bullish.WedgeWedges are a type of channel. They are noted by an upward or downward trend where the channel slowly feeds down into a narrower point. As the wedge tightens, it gets closer to a decision area where the trend can break up or down.[24]Bullish or bearish? Neutral. The shape of the wedge can help you identify confirmations and reversals, but the wedges themselves aren’t bearish or bullish.What is a channel? A channel is sort of like a lane on a road. It refers to two lines that contain all of the price action in an area. The edges of a channel are often the source of resistance or support points.FlagFlags, also known as pennants, are a kind of extremely tight wedge that often appears after large moves up or down. The shape of the flag is more of a triangular boat flag as opposed to a standard national flag.[25]Bullish or bearish? Neutral. Flags don’t signal anything other than decision points where investors and traders are unsure of what to do.
Confirmation Patterns
Rising windowThe rising window is a two-candle confirmation signal that occurs when a candle gaps up past a support or resistance line following an uptrend.[26]Bullish or bearish? Bullish.What is a confirmation? In technical analysis, a confirmation refers to any event which affirms the previous signal. So, take three white soldiers—a classic bullish signal. If the three white soldiers sit on a resistance line and then a rising window breaks that line, it is considered a confirmation—the bullish trend is set to continue.Falling windowThe falling window (sometimes casually and incorrectly called a falling dagger) is the reverse of a rising window. It’s a two-candle confirmation that breaks a trend or support/resistance line by gapping down past it.[27]Bullish or bearish? Bearish.Three inside upFollowing a period of consolidation or a downward trend, you can spot a reversal confirmation with the three inside up pattern. This is a large red candle, a smaller green candle that sits around the base of the first candle, and then a green candle rising above the first candle's high.[28]Bullish or bearish? Bullish.Three inside downThree inside down is the bearish version of the three inside up. A large green candle is followed by a rising red candle, then a red candle that breaks the previous low of the initial green candle.[29]Bullish or bearish? Bearish.Three outside upThree outside up is a bullish confirmation signal that requires a red candle, an engulfing green candle, and a third green candle with a midpoint higher than the top of the previous candle.[30]Bullish or bearish? Bullish.Three outside downThree outside down is the reverse of the three outside up. A green candle is engulfed by a large red candle, then there’s a third red candle trending down and passing the base of the engulfing candle.Bullish or bearish? Bearish.
$ETH
$BTC
45
19
113
283
·
--
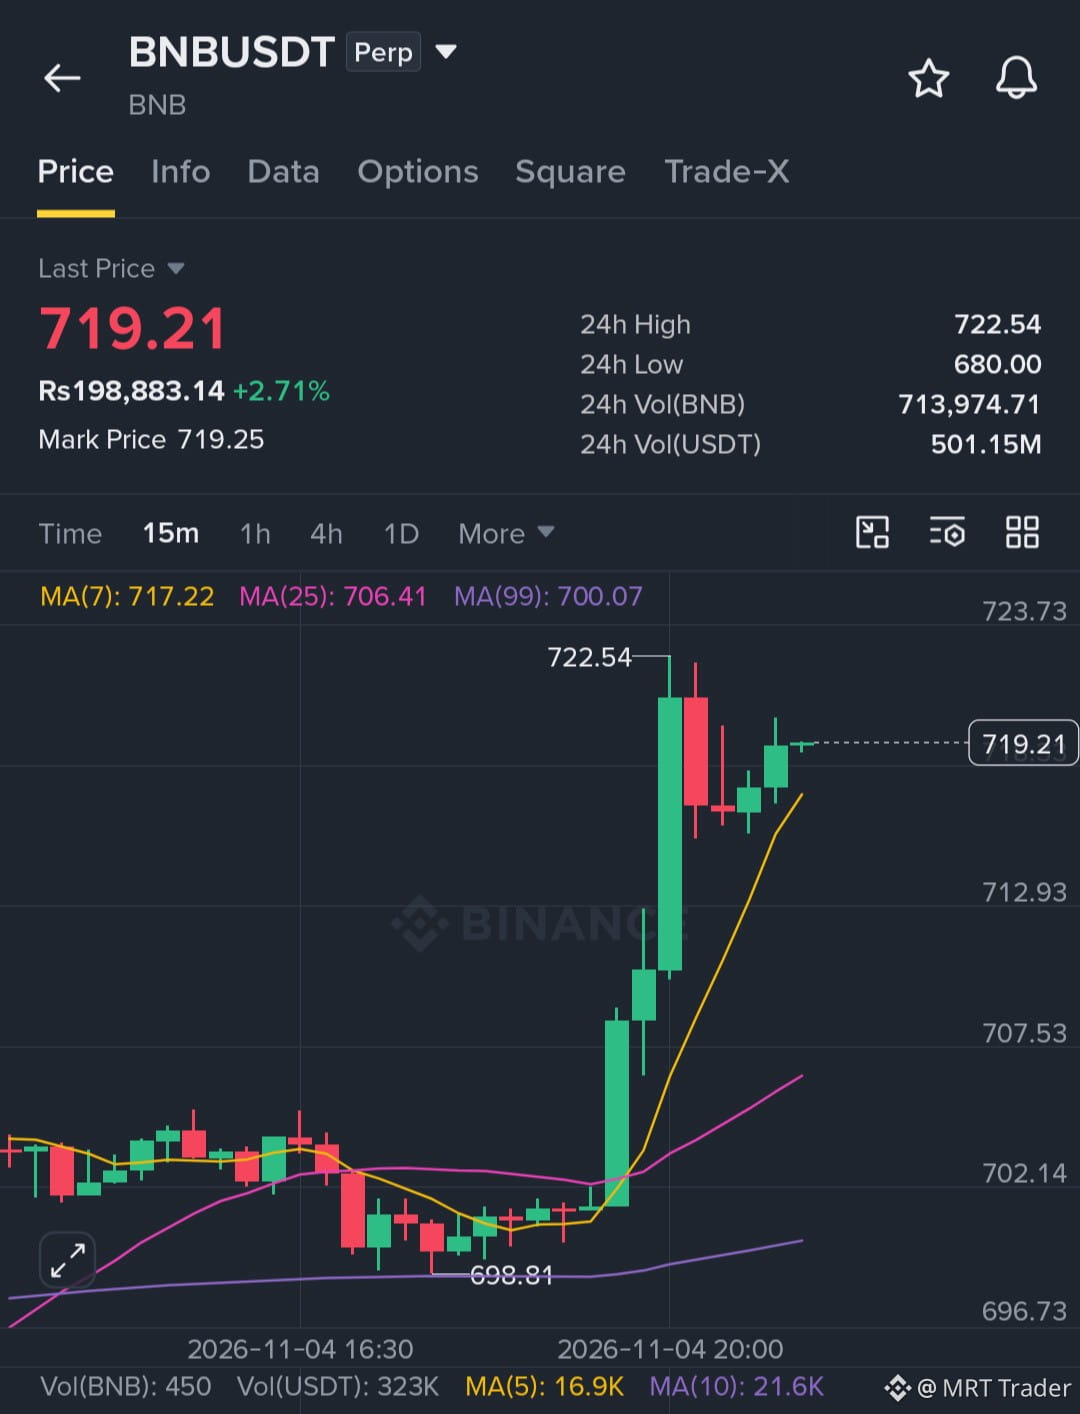
$BNB is showing pure strength! 🚀🔥
Look at that vertical breakout from the 698 lows. Bulls completely took over, pushing it straight to 722. It's currently catching its breath around 719, holding perfectly above the 7 MA.
This tight consolidation is a launchpad. As long as it holds this zone, the next leg up is loading.
Key Level:
🟢 Bullish above: 717.00
Trade Setup (Long):
🟢 Entry Zone: 718.00 – 720.00
🎯 Targets: 723.50 / 728.00 / 735.00
⛔ Stop Loss: 710.50
Don't chase the breakout blindly — enter on this consolidation and manage your risk! 🎯
Click here to trade now 👉 $BNB
{future}(BNBUSDT)
#BNB #CircleQ3Revenue865M
$BNB is showing pure strength! 🚀🔥
Look at that vertical breakout from the 698 lows. Bulls completely took over, pushing it straight to 722. It's currently catching its breath around 719, holding perfectly above the 7 MA.
This tight consolidation is a launchpad. As long as it holds this zone, the next leg up is loading.
Key Level:
🟢 Bullish above: 717.00
Trade Setup (Long):
🟢 Entry Zone: 718.00 – 720.00
🎯 Targets: 723.50 / 728.00 / 735.00
⛔ Stop Loss: 710.50
Don't chase the breakout blindly — enter on this consolidation and manage your risk! 🎯
Click here to trade now 👉 $BNB
#BNB #CircleQ3Revenue865M
Look at that vertical breakout from the 698 lows. Bulls completely took over, pushing it straight to 722. It's currently catching its breath around 719, holding perfectly above the 7 MA.
This tight consolidation is a launchpad. As long as it holds this zone, the next leg up is loading.
Key Level:
🟢 Bullish above: 717.00
Trade Setup (Long):
🟢 Entry Zone: 718.00 – 720.00
🎯 Targets: 723.50 / 728.00 / 735.00
⛔ Stop Loss: 710.50
Don't chase the breakout blindly — enter on this consolidation and manage your risk! 🎯
Click here to trade now 👉 $BNB
#BNB #CircleQ3Revenue865M
1
31
·
--
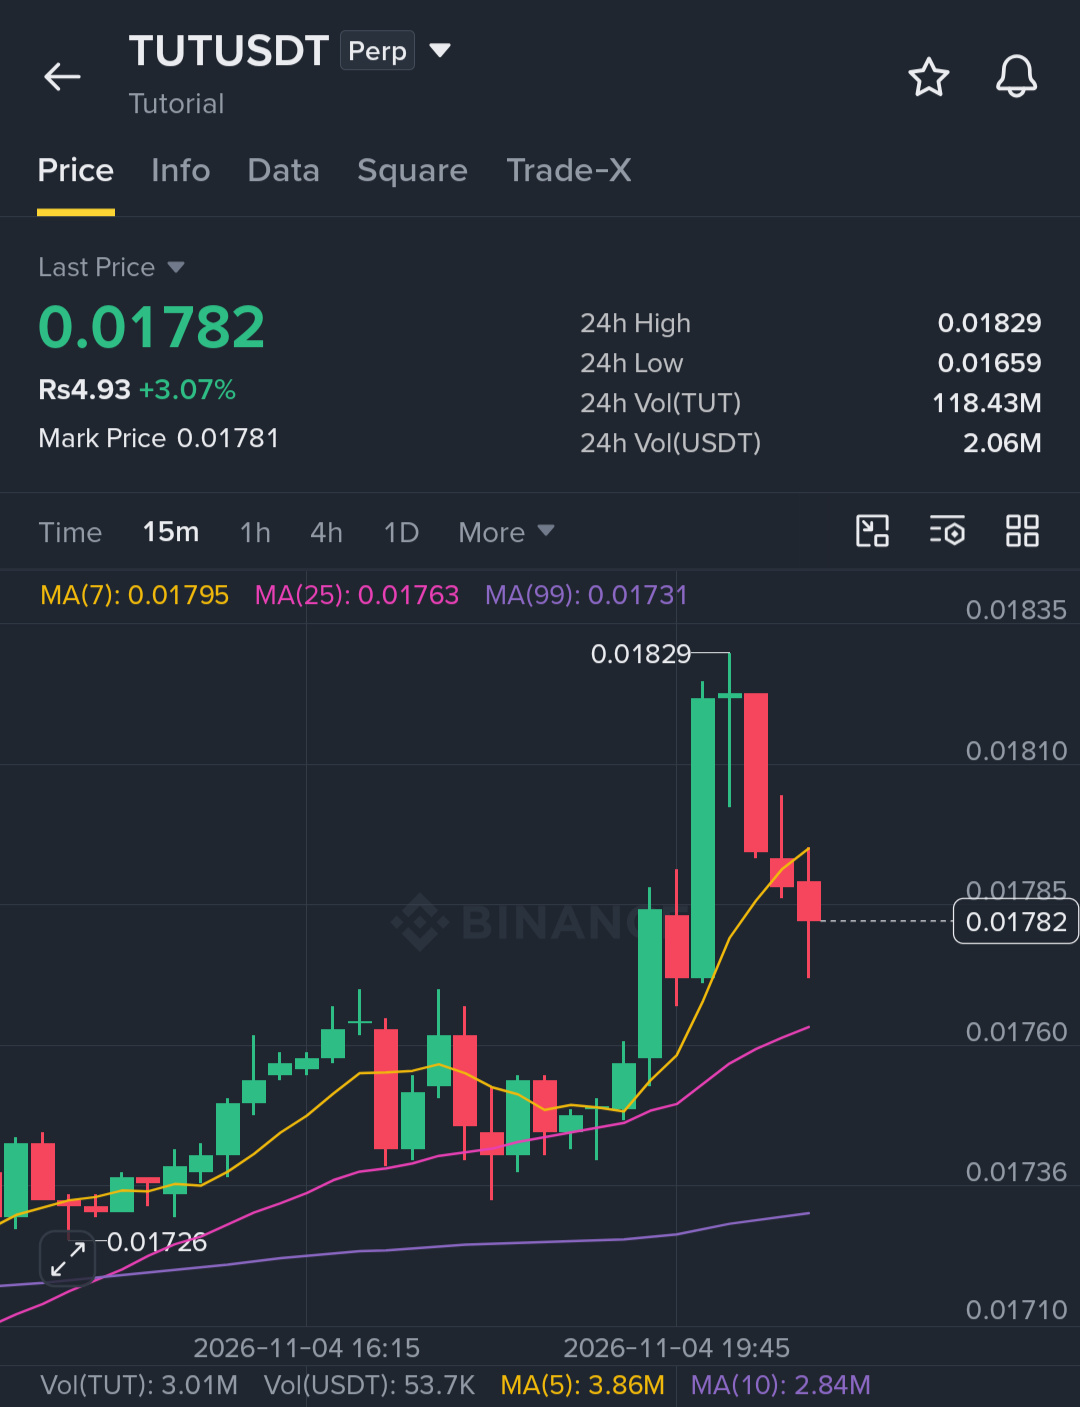
$TUT just had a massive breakout, but the pullback is here! 📉👀
After tagging 0.01829, the red candles are stepping in and price is cooling off right at the 25 MA support.
This is where the real test happens. If buyers step in here and defend this zone, we could see a strong bounce back toward the highs. But if this support cracks, we look lower.
Trade Setup (Long):
🟢 Entry Zone: 0.01765 – 0.01780
🎯 Targets: 0.01815 / 0.01850 / 0.01900
⛔ Stop Loss: 0.01740
Wait for the bounce confirmation before entering and manage your risk! 🎯
Click here to trade now 👉 $TUT
{future}(TUTUSDT)
#TUT #BinanceIncidentReport
$TUT just had a massive breakout, but the pullback is here! 📉👀
After tagging 0.01829, the red candles are stepping in and price is cooling off right at the 25 MA support.
This is where the real test happens. If buyers step in here and defend this zone, we could see a strong bounce back toward the highs. But if this support cracks, we look lower.
Trade Setup (Long):
🟢 Entry Zone: 0.01765 – 0.01780
🎯 Targets: 0.01815 / 0.01850 / 0.01900
⛔ Stop Loss: 0.01740
Wait for the bounce confirmation before entering and manage your risk! 🎯
Click here to trade now 👉 $TUT
#TUT #BinanceIncidentReport
After tagging 0.01829, the red candles are stepping in and price is cooling off right at the 25 MA support.
This is where the real test happens. If buyers step in here and defend this zone, we could see a strong bounce back toward the highs. But if this support cracks, we look lower.
Trade Setup (Long):
🟢 Entry Zone: 0.01765 – 0.01780
🎯 Targets: 0.01815 / 0.01850 / 0.01900
⛔ Stop Loss: 0.01740
Wait for the bounce confirmation before entering and manage your risk! 🎯
Click here to trade now 👉 $TUT
#TUT #BinanceIncidentReport
2
49
·
--
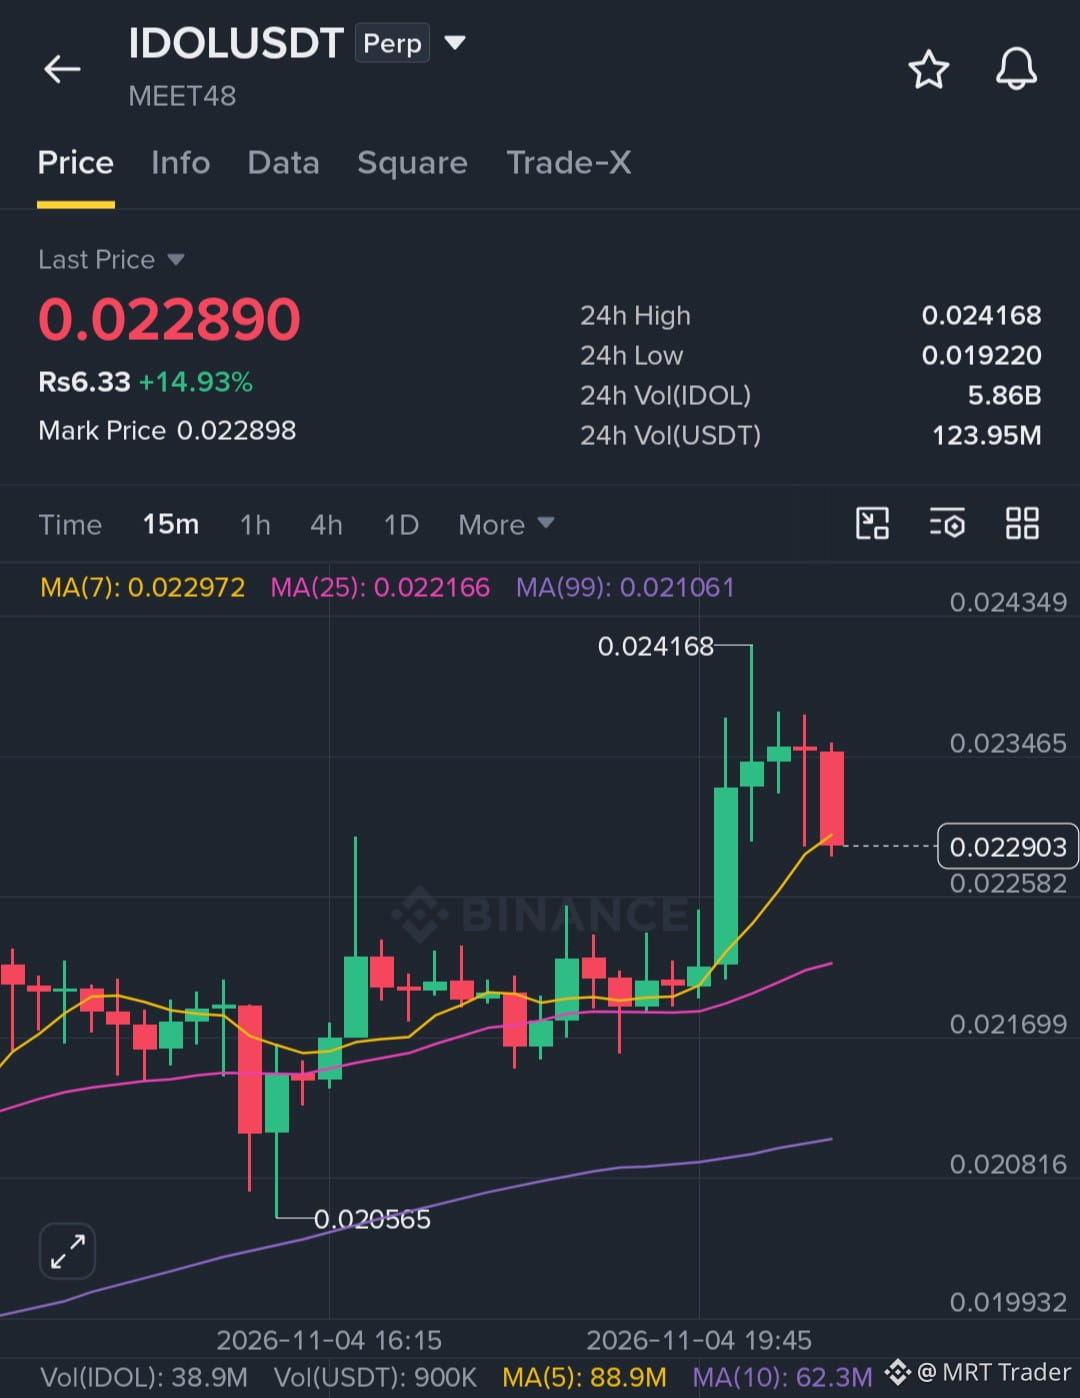
$IDOL just went absolutely parabolic! 🚀📉
As long as buyers defend this zone, the next leg up is loading. Don't chase the top — let the dip come to you.
Key Level:
🟢 Bullish above: 0.0226
Trade Setup (Long):
🟢 Entry Zone: 0.02270 – 0.02295
🎯 Targets: 0.02350 / 0.02410 / 0.02480
⛔ Stop Loss: 0.02180
Wait for the bounce confirmation and manage risk appropriately! 🎯
Click here to buy now 👉 $IDOL
{future}(IDOLUSDT)
#IDOL #ADPUSPrivateEmployersAdd86000JobsInOctober
$IDOL just went absolutely parabolic! 🚀📉
As long as buyers defend this zone, the next leg up is loading. Don't chase the top — let the dip come to you.
Key Level:
🟢 Bullish above: 0.0226
Trade Setup (Long):
🟢 Entry Zone: 0.02270 – 0.02295
🎯 Targets: 0.02350 / 0.02410 / 0.02480
⛔ Stop Loss: 0.02180
Wait for the bounce confirmation and manage risk appropriately! 🎯
Click here to buy now 👉 $IDOL
#IDOL #ADPUSPrivateEmployersAdd86000JobsInOctober
As long as buyers defend this zone, the next leg up is loading. Don't chase the top — let the dip come to you.
Key Level:
🟢 Bullish above: 0.0226
Trade Setup (Long):
🟢 Entry Zone: 0.02270 – 0.02295
🎯 Targets: 0.02350 / 0.02410 / 0.02480
⛔ Stop Loss: 0.02180
Wait for the bounce confirmation and manage risk appropriately! 🎯
Click here to buy now 👉 $IDOL
#IDOL #ADPUSPrivateEmployersAdd86000JobsInOctober
1
39
·
--
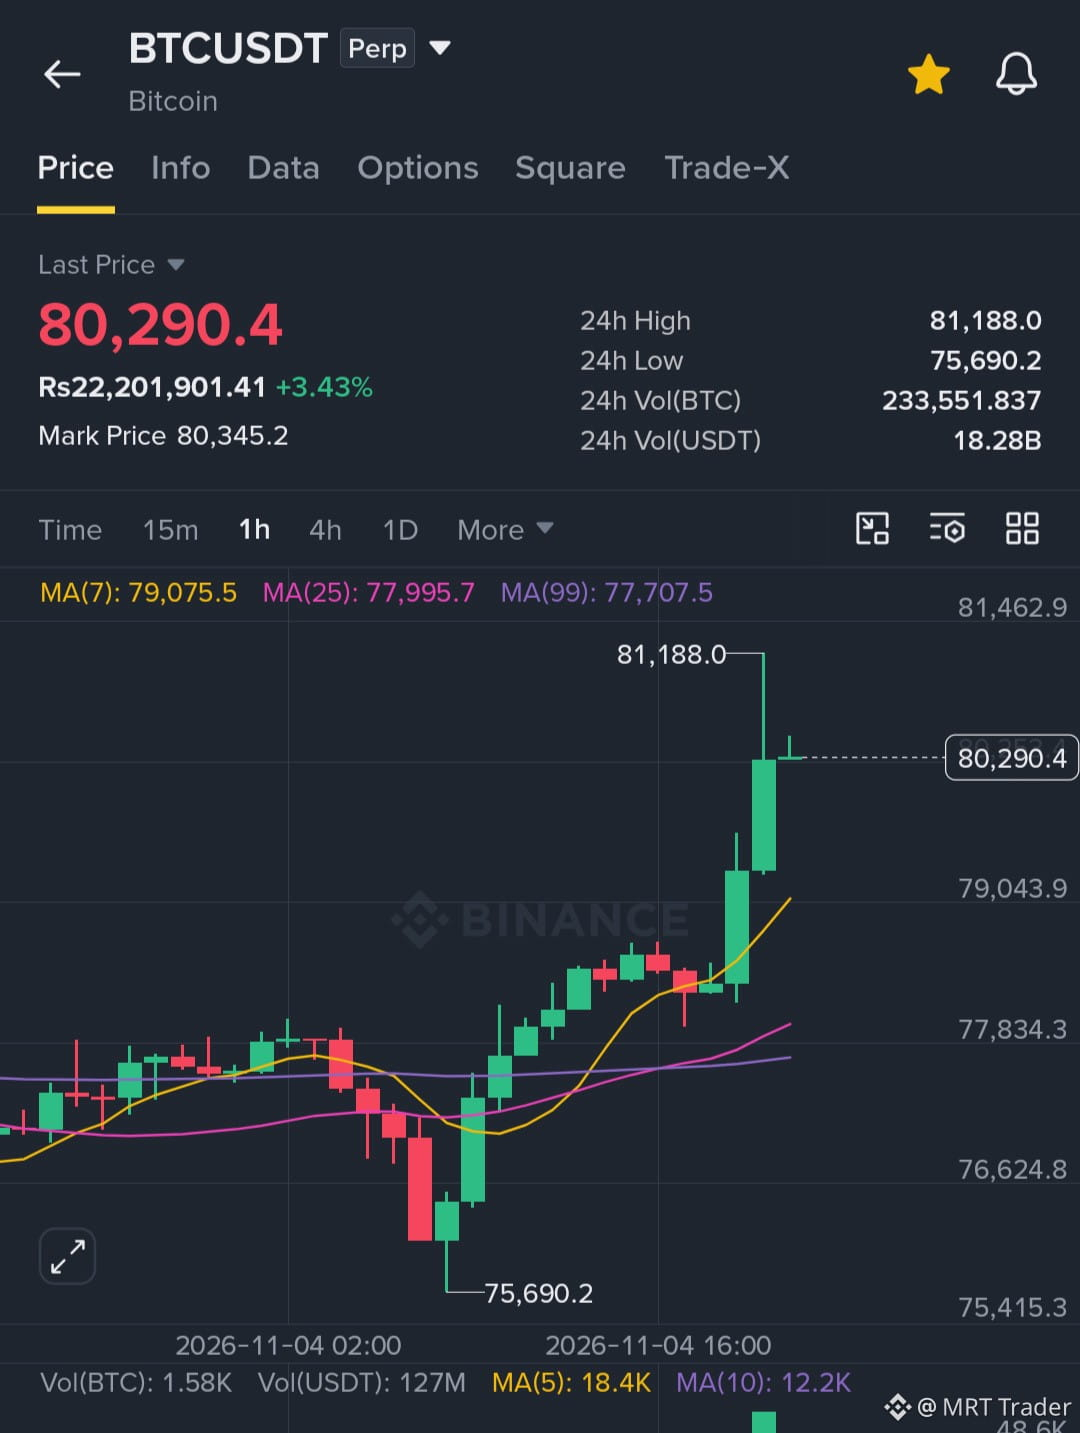
🚀 BOOM! TARGET SMASHED! PERFECT CALL ON $BTC ! 💥📈
If you followed the signal at $78k, you are sitting on massive profits right now!
The Call: Long entry at $78k 🎯
The Breakout: $BTC blasted straight past $80k! 🚀
Current Price: $80,337.2 💰
Massive congratulations to everyone who took this trade and secured the gains! 🤝🎉
Patience, strategy, and perfect execution win again. Don't trade alone—make sure to join the chatroom to lock in for the next high-probability setup!
👇 Did you catch this $BTC move? Drop your profit percentages below! 👇
🚀 BOOM! TARGET SMASHED! PERFECT CALL ON $BTC ! 💥📈
If you followed the signal at $78k, you are sitting on massive profits right now!
The Call: Long entry at $78k 🎯
The Breakout: $BTC blasted straight past $80k! 🚀
Current Price: $80,337.2 💰
Massive congratulations to everyone who took this trade and secured the gains! 🤝🎉
Patience, strategy, and perfect execution win again. Don't trade alone—make sure to join the chatroom to lock in for the next high-probability setup!
👇 Did you catch this $BTC move? Drop your profit percentages below! 👇
If you followed the signal at $78k, you are sitting on massive profits right now!
The Call: Long entry at $78k 🎯
The Breakout: $BTC blasted straight past $80k! 🚀
Current Price: $80,337.2 💰
Massive congratulations to everyone who took this trade and secured the gains! 🤝🎉
Patience, strategy, and perfect execution win again. Don't trade alone—make sure to join the chatroom to lock in for the next high-probability setup!
👇 Did you catch this $BTC move? Drop your profit percentages below! 👇
2
34
·
--
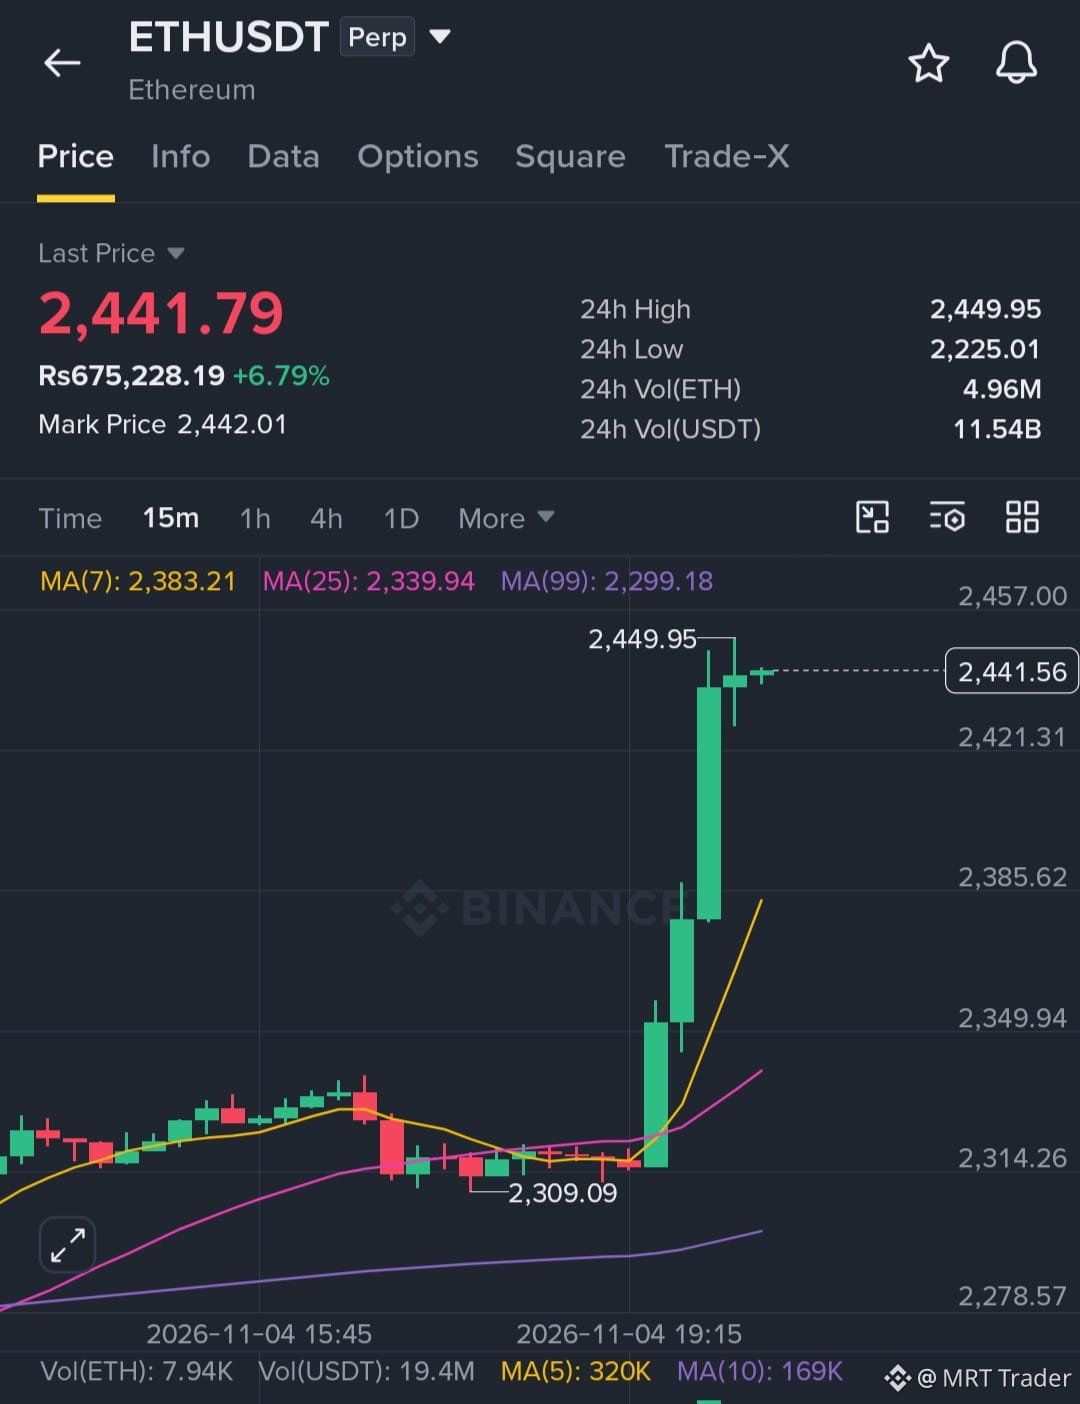
🚀 $ETH MASSIVE PUMP! WIN AGAIN! 🚀
ALL TARGETS SMASHED! We just rode this perfect $ETH LONG trade!
From a strong comeback at $2,225 all the way to a stunning $2,446! The BULLS ARE BACK! What a move!
A massive congratulations to everyone in our community who caught this with us! Your patience and precision paid off!
Don't miss the next one! More opportunities are ahead, so keep managing your risk and stay locked in!
#ETH #Ethereum #Crypto #Trading #USOctoberNFP-AreRateCutsStillPossible
🚀 $ETH MASSIVE PUMP! WIN AGAIN! 🚀
ALL TARGETS SMASHED! We just rode this perfect $ETH LONG trade!
From a strong comeback at $2,225 all the way to a stunning $2,446! The BULLS ARE BACK! What a move!
A massive congratulations to everyone in our community who caught this with us! Your patience and precision paid off!
Don't miss the next one! More opportunities are ahead, so keep managing your risk and stay locked in!
#ETH #Ethereum #Crypto #Trading #USOctoberNFP-AreRateCutsStillPossible
ALL TARGETS SMASHED! We just rode this perfect $ETH LONG trade!
From a strong comeback at $2,225 all the way to a stunning $2,446! The BULLS ARE BACK! What a move!
A massive congratulations to everyone in our community who caught this with us! Your patience and precision paid off!
Don't miss the next one! More opportunities are ahead, so keep managing your risk and stay locked in!
#ETH #Ethereum #Crypto #Trading #USOctoberNFP-AreRateCutsStillPossible
1
15
·
--
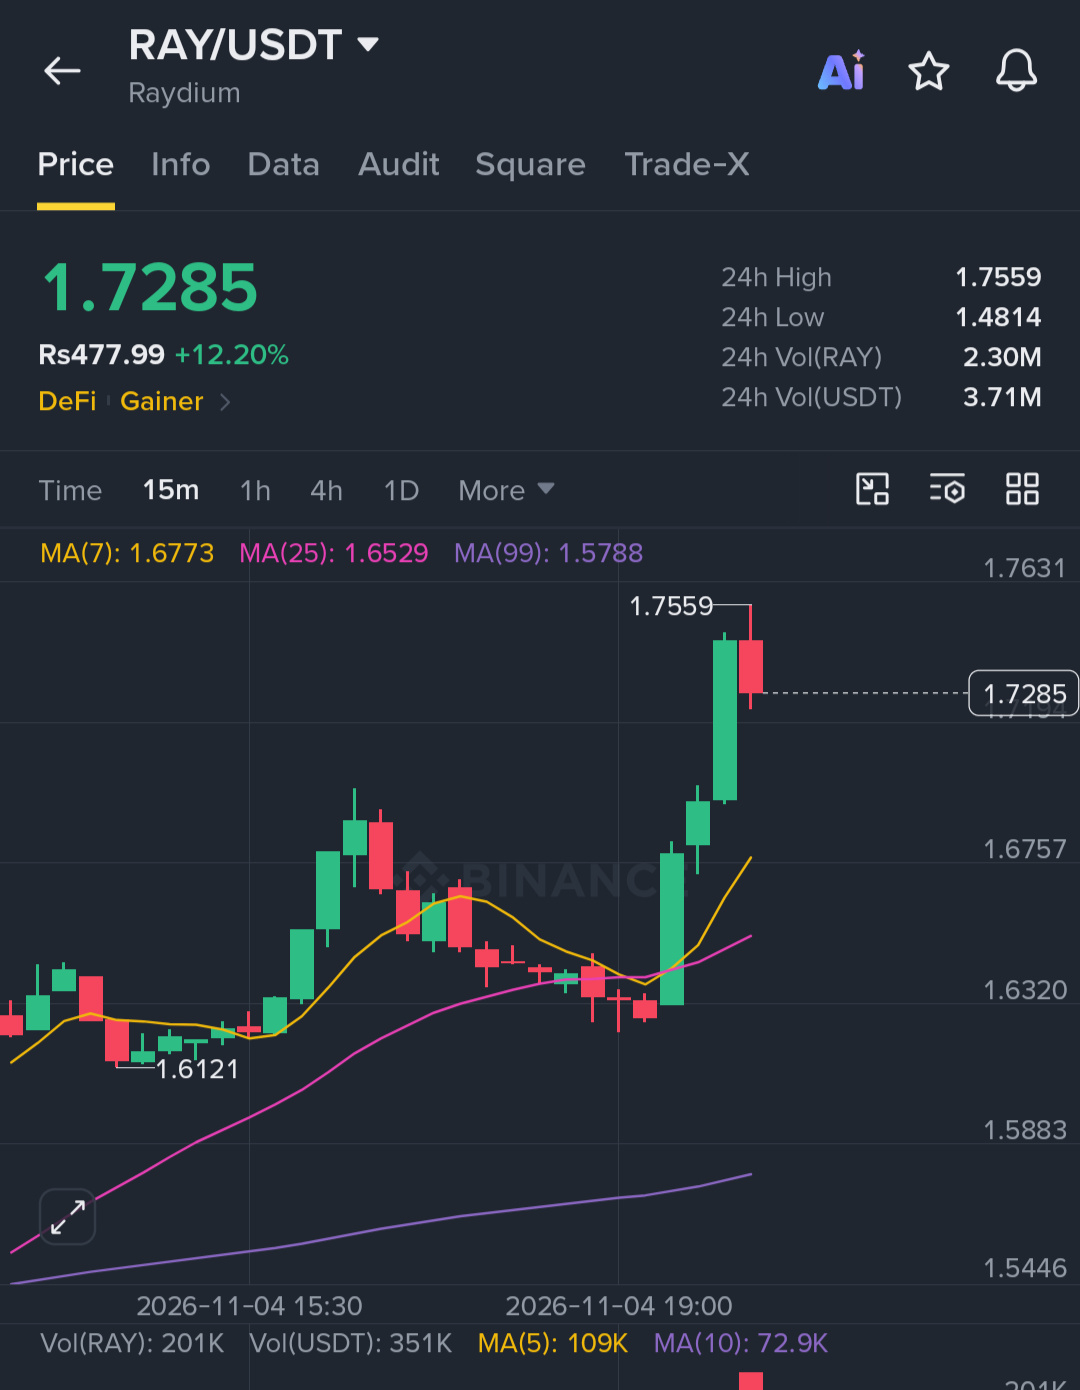
$RAY sharp climb puts a pullback on my radar; I'll consider a long if 1.6500 holds. 👀
Price is showing strong momentum, but I'm not chasing the green candles. I want to see it test support and hold before jumping in.
Key Level:
🟢 Bullish above: 1.6530
Trade Setup (Long):
🟢 Entry Zone: 1.6520 – 1.6580
🎯 Targets: 1.6980 / 1.7520 / 1.7950
⛔ Stop Loss: 1.6050
Wait for confirmation and keep risk small. Manage your position appropriately!
Click here to buy now 👉 $RAY
{spot}(RAYUSDT)
#RAY #AMDBeatsExpectations-AINarrativeContinues
$RAY sharp climb puts a pullback on my radar; I'll consider a long if 1.6500 holds. 👀
Price is showing strong momentum, but I'm not chasing the green candles. I want to see it test support and hold before jumping in.
Key Level:
🟢 Bullish above: 1.6530
Trade Setup (Long):
🟢 Entry Zone: 1.6520 – 1.6580
🎯 Targets: 1.6980 / 1.7520 / 1.7950
⛔ Stop Loss: 1.6050
Wait for confirmation and keep risk small. Manage your position appropriately!
Click here to buy now 👉 $RAY
#RAY #AMDBeatsExpectations-AINarrativeContinues
Price is showing strong momentum, but I'm not chasing the green candles. I want to see it test support and hold before jumping in.
Key Level:
🟢 Bullish above: 1.6530
Trade Setup (Long):
🟢 Entry Zone: 1.6520 – 1.6580
🎯 Targets: 1.6980 / 1.7520 / 1.7950
⛔ Stop Loss: 1.6050
Wait for confirmation and keep risk small. Manage your position appropriately!
Click here to buy now 👉 $RAY
#RAY #AMDBeatsExpectations-AINarrativeContinues
2
14
·
--
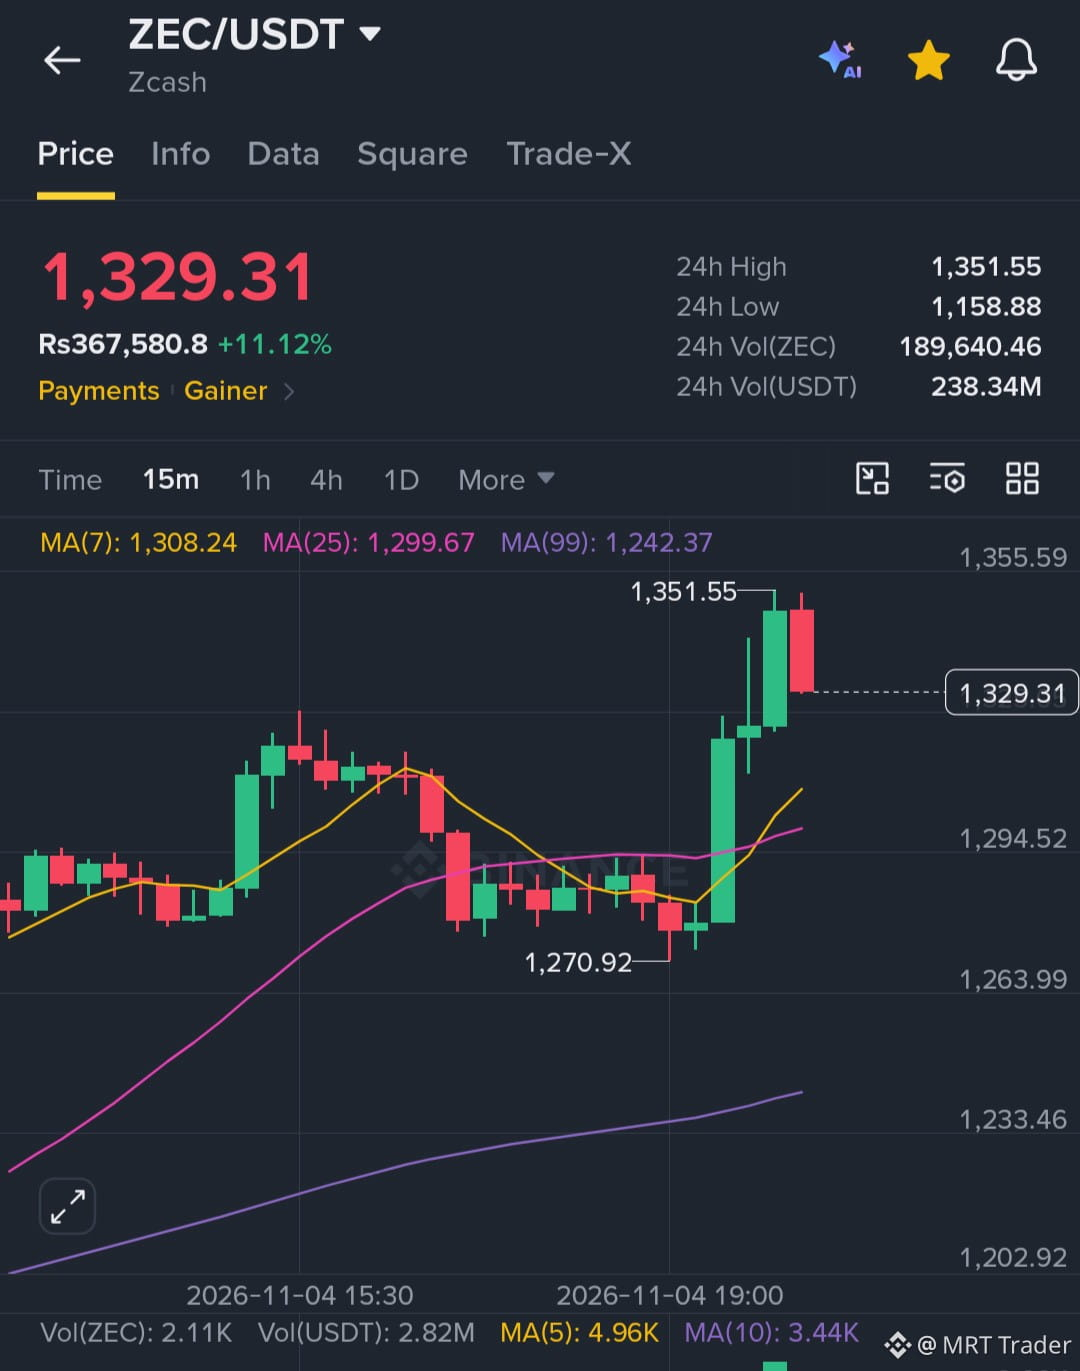
$ZEC is absolutely flying! 🚀📈
After a massive breakout from the 1,270 zone, bulls pushed it straight to a high of 1,351. Now it's catching its breath around 1,329, holding perfectly above the moving averages.
The trend is completely bullish — any dip here is just a setup for the next push higher.
🟢 Entry Zone: 1,320 – 1,330
🎯 Targets: 1,355 / 1,380 / 1,420
⛔ Stop Loss: 1,290
Enter on the pullback and manage your risk appropriately. Let the momentum work for you! 🔥Click here to buy now 👉 $ZEC
{future}(ZECUSDT)
#ZEC #BinanceIncidentReport
$ZEC is absolutely flying! 🚀📈
After a massive breakout from the 1,270 zone, bulls pushed it straight to a high of 1,351. Now it's catching its breath around 1,329, holding perfectly above the moving averages.
The trend is completely bullish — any dip here is just a setup for the next push higher.
🟢 Entry Zone: 1,320 – 1,330
🎯 Targets: 1,355 / 1,380 / 1,420
⛔ Stop Loss: 1,290
Enter on the pullback and manage your risk appropriately. Let the momentum work for you! 🔥Click here to buy now 👉 $ZEC
#ZEC #BinanceIncidentReport
After a massive breakout from the 1,270 zone, bulls pushed it straight to a high of 1,351. Now it's catching its breath around 1,329, holding perfectly above the moving averages.
The trend is completely bullish — any dip here is just a setup for the next push higher.
🟢 Entry Zone: 1,320 – 1,330
🎯 Targets: 1,355 / 1,380 / 1,420
⛔ Stop Loss: 1,290
Enter on the pullback and manage your risk appropriately. Let the momentum work for you! 🔥Click here to buy now 👉 $ZEC
#ZEC #BinanceIncidentReport
1
12
·
--
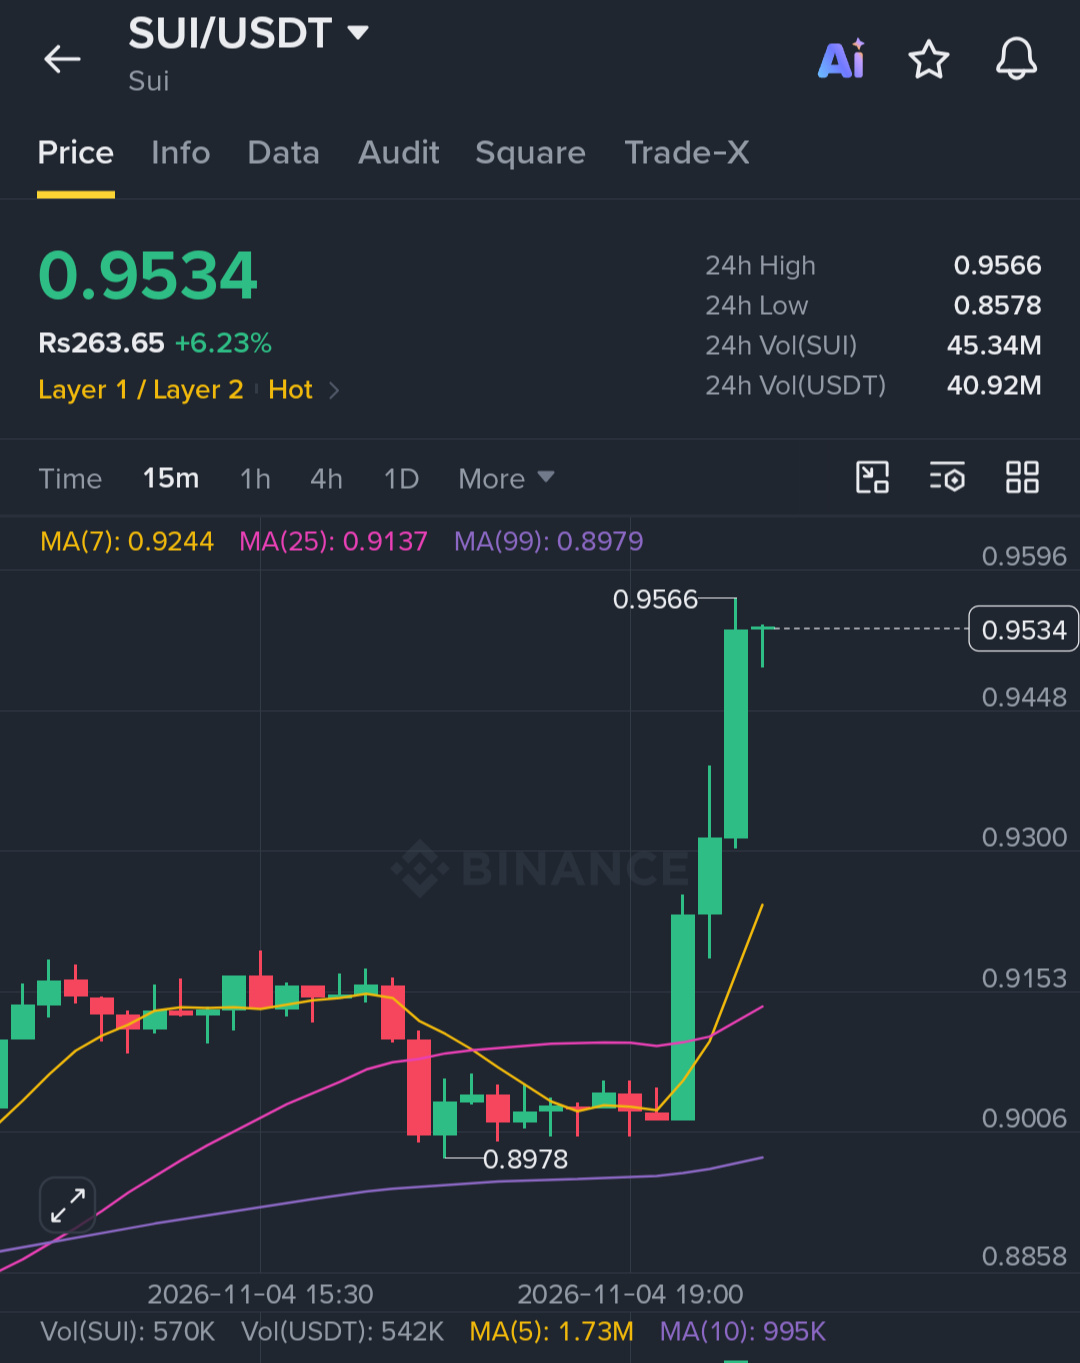
$SUI LONG now with 20x leverage max... 👇🏻👇🏻
Price is showing strong momentum and buyers are stepping in aggressively. The structure is primed for the next leg up!
Trade Setup (Long):
🟢 Entry Zone: 0.916 – 0.926
🎯 Targets: 0.945 / 0.972 / 0.992
⛔ Stop Loss: 0.882
Keep that leverage in check — enter on dips and manage risk appropriately. 🚀
Also keeping a close eye on $CLANKER and $CAP for potential LONG setups! 👀
#SUI #CLANKER #CAP
$SUI LONG now with 20x leverage max... 👇🏻👇🏻
Price is showing strong momentum and buyers are stepping in aggressively. The structure is primed for the next leg up!
Trade Setup (Long):
🟢 Entry Zone: 0.916 – 0.926
🎯 Targets: 0.945 / 0.972 / 0.992
⛔ Stop Loss: 0.882
Keep that leverage in check — enter on dips and manage risk appropriately. 🚀
Also keeping a close eye on $CLANKER and $CAP for potential LONG setups! 👀
#SUI #CLANKER #CAP
Price is showing strong momentum and buyers are stepping in aggressively. The structure is primed for the next leg up!
Trade Setup (Long):
🟢 Entry Zone: 0.916 – 0.926
🎯 Targets: 0.945 / 0.972 / 0.992
⛔ Stop Loss: 0.882
Keep that leverage in check — enter on dips and manage risk appropriately. 🚀
Also keeping a close eye on $CLANKER and $CAP for potential LONG setups! 👀
#SUI #CLANKER #CAP
1
59
·
--
CRYPTO BULLS ARE BACK IN ACTION! 🚀
$BTC , $ETH , $XAUT & $SOL are absolutely exploding right now!
Massive green candles, powerful volume spikes, and aggressive buying pressure across the entire market. The bulls are waking up, and momentum is heating up fast!
BTC Trade Setup (Long):
🟢 Entry Zone: 68,500 – 69,500
🎯 Targets: 71,200 / 73,500 / 76,000
⛔ Stop Loss: 66,800
SOL Trade Setup (Long):
🟢 Entry Zone: 102.50 – 104.20
🎯 Targets: 108.50 / 112.00 / 116.50
⛔ Stop Loss: 99.20
The energy is electric — but don't chase the top green candles. Enter on the pullbacks and manage your risk properly.
IS THE NEXT MEGA BULL RUN JUST GETTING STARTED? 🔥👇
#CryptoTrading #BullRun #BTC #SOL
CRYPTO BULLS ARE BACK IN ACTION! 🚀
$BTC , $ETH , $XAUT & $SOL are absolutely exploding right now!
Massive green candles, powerful volume spikes, and aggressive buying pressure across the entire market. The bulls are waking up, and momentum is heating up fast!
BTC Trade Setup (Long):
🟢 Entry Zone: 68,500 – 69,500
🎯 Targets: 71,200 / 73,500 / 76,000
⛔ Stop Loss: 66,800
SOL Trade Setup (Long):
🟢 Entry Zone: 102.50 – 104.20
🎯 Targets: 108.50 / 112.00 / 116.50
⛔ Stop Loss: 99.20
The energy is electric — but don't chase the top green candles. Enter on the pullbacks and manage your risk properly.
IS THE NEXT MEGA BULL RUN JUST GETTING STARTED? 🔥👇
#CryptoTrading #BullRun #BTC #SOL
$BTC , $ETH , $XAUT & $SOL are absolutely exploding right now!
Massive green candles, powerful volume spikes, and aggressive buying pressure across the entire market. The bulls are waking up, and momentum is heating up fast!
BTC Trade Setup (Long):
🟢 Entry Zone: 68,500 – 69,500
🎯 Targets: 71,200 / 73,500 / 76,000
⛔ Stop Loss: 66,800
SOL Trade Setup (Long):
🟢 Entry Zone: 102.50 – 104.20
🎯 Targets: 108.50 / 112.00 / 116.50
⛔ Stop Loss: 99.20
The energy is electric — but don't chase the top green candles. Enter on the pullbacks and manage your risk properly.
IS THE NEXT MEGA BULL RUN JUST GETTING STARTED? 🔥👇
#CryptoTrading #BullRun #BTC #SOL

22
·
--
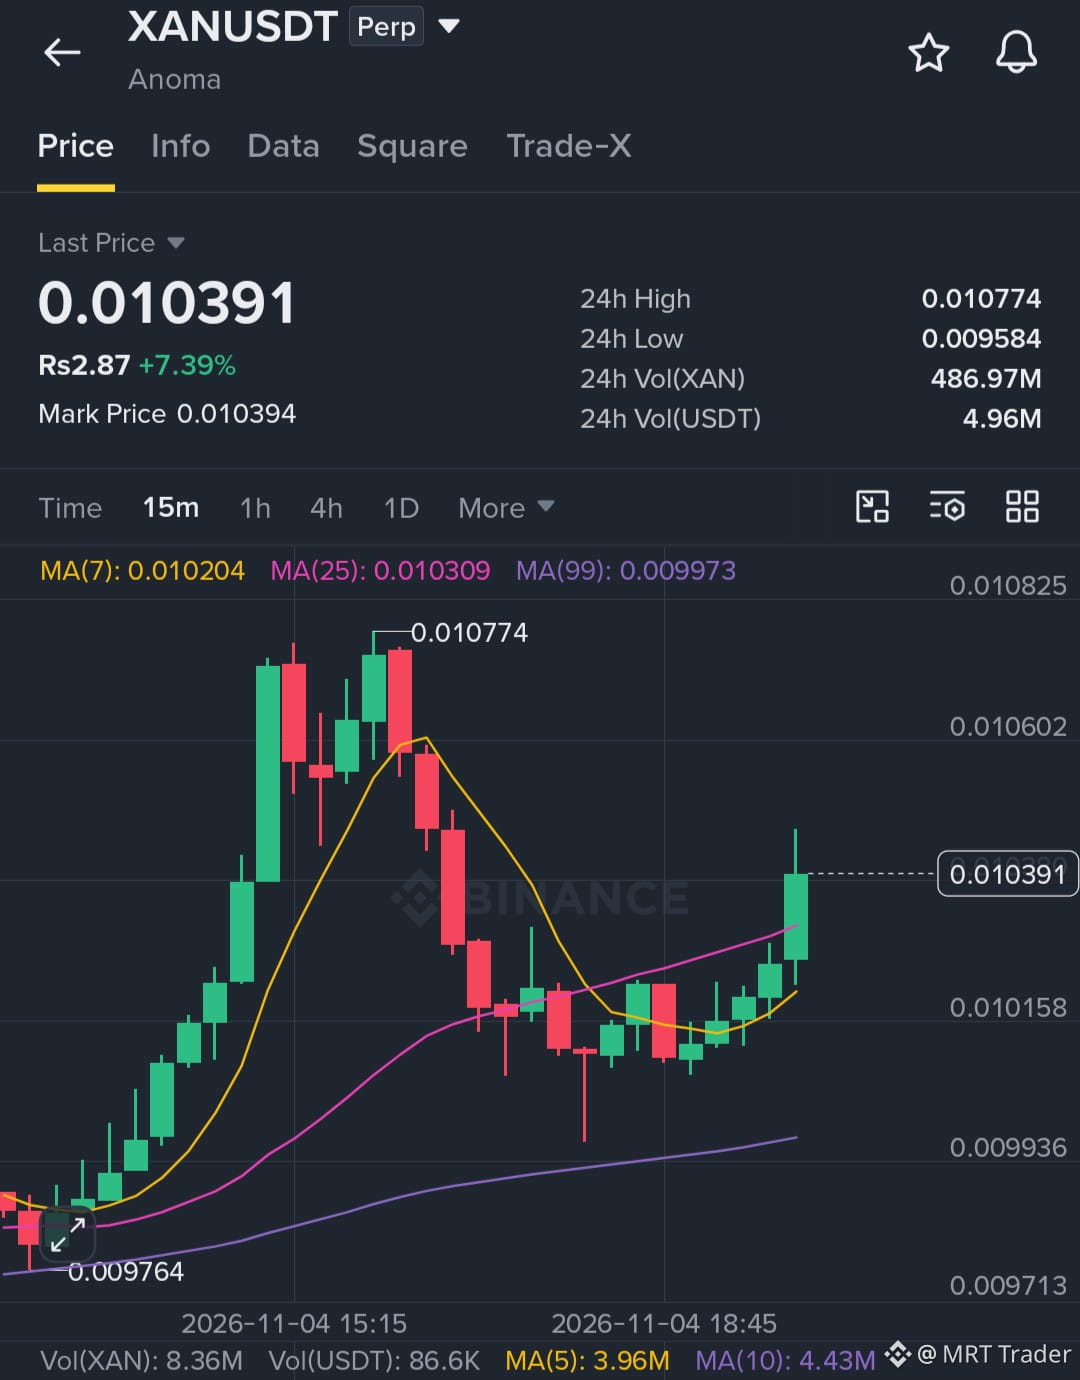
$XAN TRADE UPDATE! 🔥
The stream trade is delivering massive gains! 💰 Price is hovering around $0.010437, with the position showing a crazy +118.14% at 50x leverage.
Momentum is absolutely heating up right now. But remember the golden rule — secure those profits and manage that leverage risk carefully, fam! ⚠️
Keep trailing your stops and don't let a green trade turn red. 🚀
Click here to trade now 👉 $XAN
{future}(XANUSDT)
#XAN #BinanceIncidentReport
$XAN TRADE UPDATE! 🔥
The stream trade is delivering massive gains! 💰 Price is hovering around $0.010437, with the position showing a crazy +118.14% at 50x leverage.
Momentum is absolutely heating up right now. But remember the golden rule — secure those profits and manage that leverage risk carefully, fam! ⚠️
Keep trailing your stops and don't let a green trade turn red. 🚀
Click here to trade now 👉 $XAN
#XAN #BinanceIncidentReport
The stream trade is delivering massive gains! 💰 Price is hovering around $0.010437, with the position showing a crazy +118.14% at 50x leverage.
Momentum is absolutely heating up right now. But remember the golden rule — secure those profits and manage that leverage risk carefully, fam! ⚠️
Keep trailing your stops and don't let a green trade turn red. 🚀
Click here to trade now 👉 $XAN
#XAN #BinanceIncidentReport
15
·
--
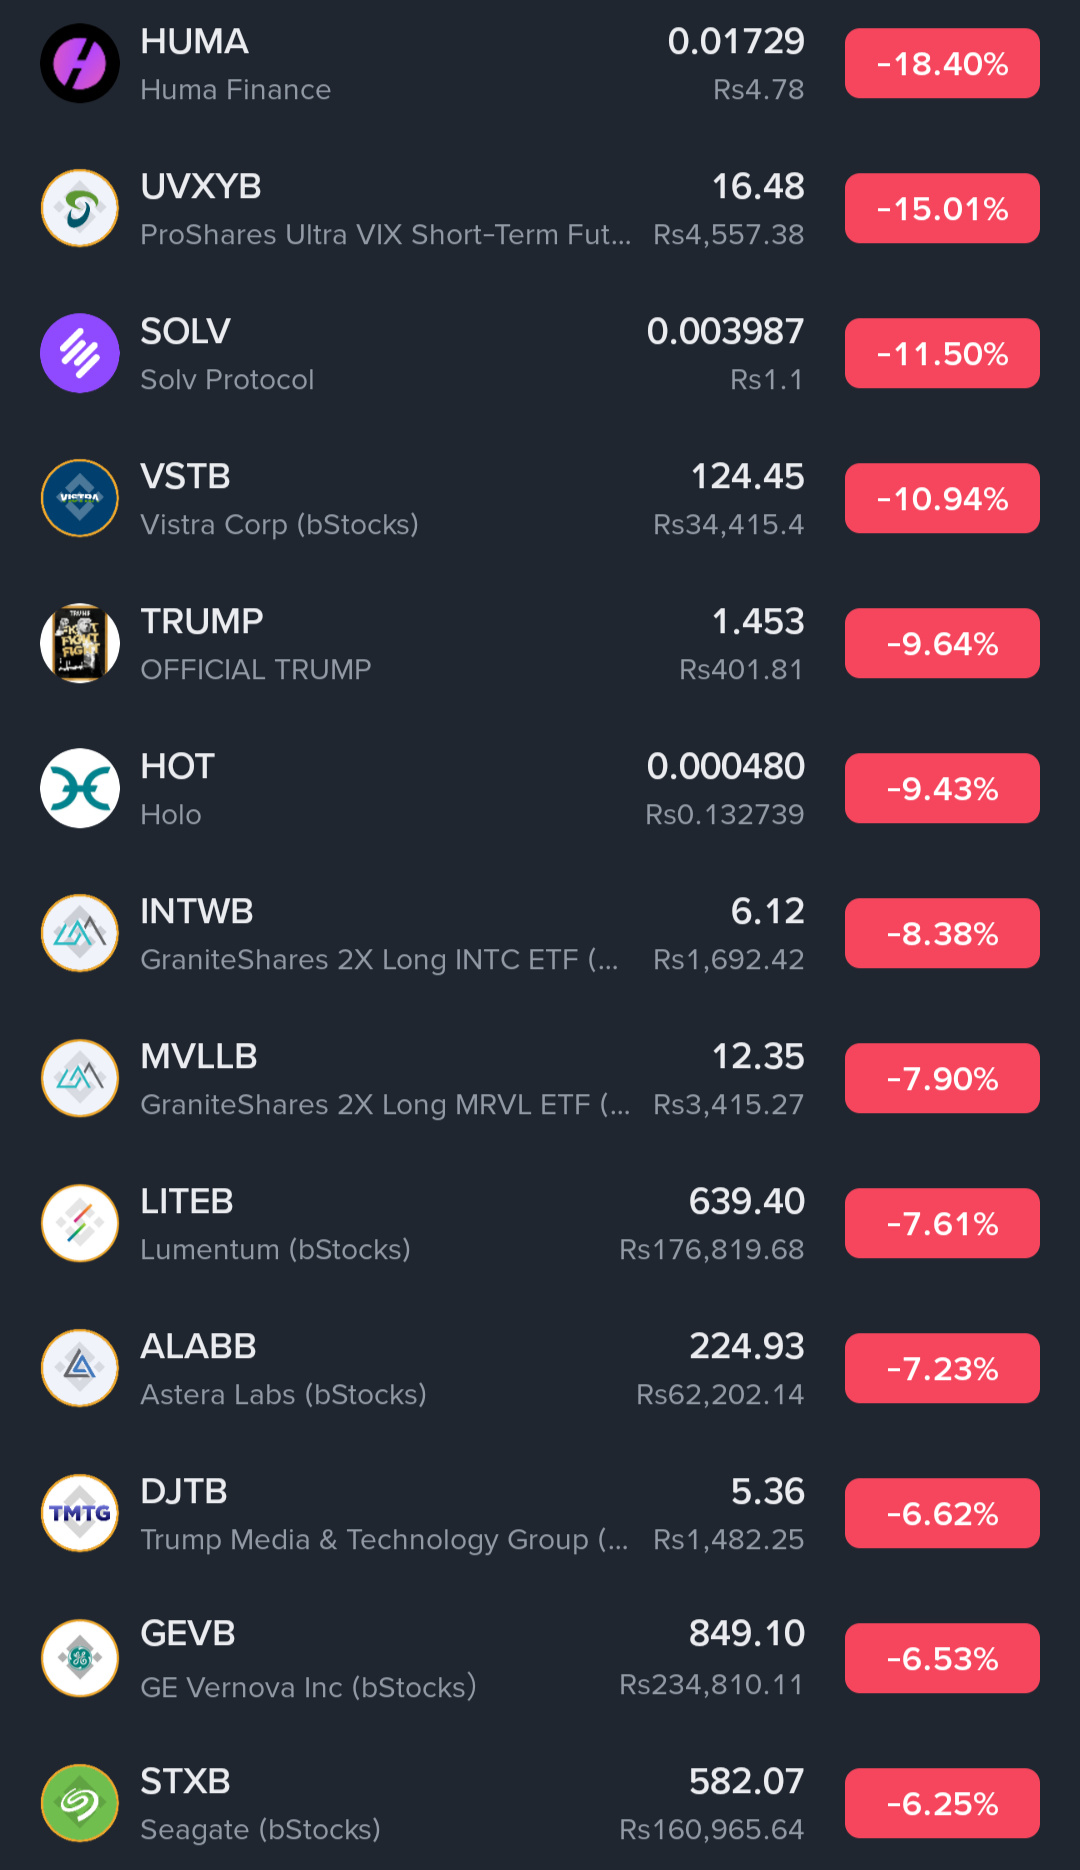
Top spot losers are under pressure today, and sellers are in control. 📉
🔴 $HUMA -18.40%
🔴 $SOLV -11.50%
🔴 $TRUMP -9.64%
🔴 $HOT -9.43%
Top spot losers are under pressure today, and sellers are in control. 📉
🔴 $HUMA -18.40%
🔴 $SOLV -11.50%
🔴 $TRUMP -9.64%
🔴 $HOT -9.43%
🔴 $HUMA -18.40%
🔴 $SOLV -11.50%
🔴 $TRUMP -9.64%
🔴 $HOT -9.43%
60
·
--
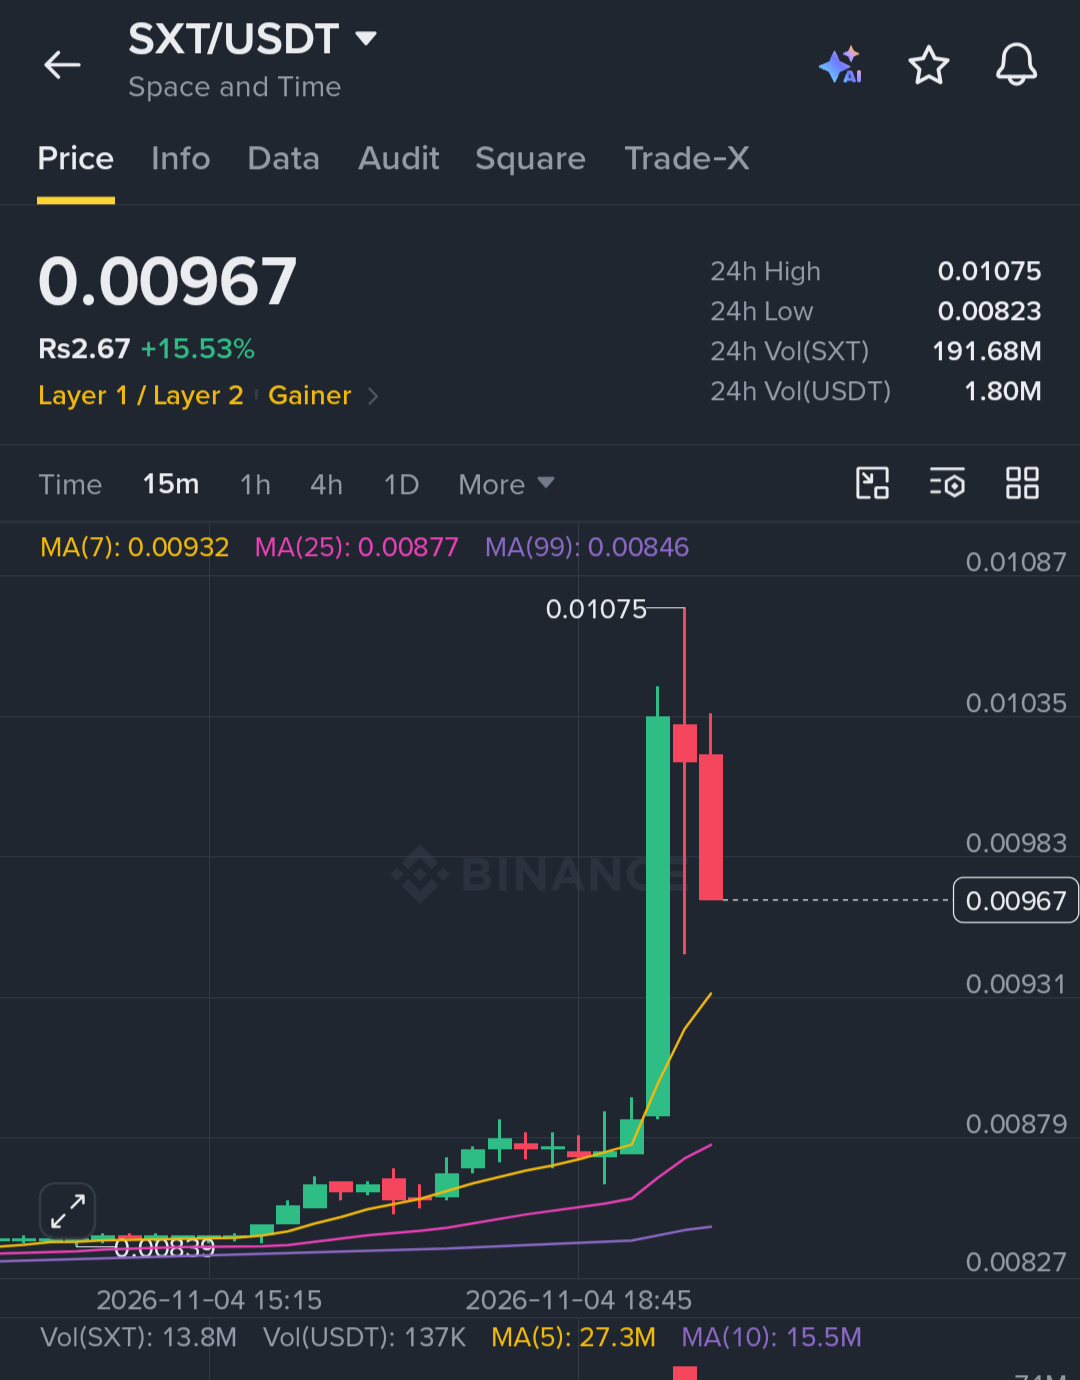
🔥 $SXT is surging over 19%, breaking above 0.0090 and approaching 0.0100.
Key Level:
🟢 Bullish above: 0.0100
Trade Setup (Long):
🟢 Entry Zone: 0.0089 – 0.0094
🎯 Targets: 0.0101 / 0.0107 / 0.0114
⛔ Stop Loss: 0.0083
Buying pressure is strong, but wait for a confirmed breakout above 0.0100 before chasing. Enter on pullbacks and manage risk appropriately.
Click here to buy now 👉 $SXT
{future}(SXTUSDT)
#SXT #BinanceIncidentReport
🔥 $SXT is surging over 19%, breaking above 0.0090 and approaching 0.0100.
Key Level:
🟢 Bullish above: 0.0100
Trade Setup (Long):
🟢 Entry Zone: 0.0089 – 0.0094
🎯 Targets: 0.0101 / 0.0107 / 0.0114
⛔ Stop Loss: 0.0083
Buying pressure is strong, but wait for a confirmed breakout above 0.0100 before chasing. Enter on pullbacks and manage risk appropriately.
Click here to buy now 👉 $SXT
#SXT #BinanceIncidentReport
Key Level:
🟢 Bullish above: 0.0100
Trade Setup (Long):
🟢 Entry Zone: 0.0089 – 0.0094
🎯 Targets: 0.0101 / 0.0107 / 0.0114
⛔ Stop Loss: 0.0083
Buying pressure is strong, but wait for a confirmed breakout above 0.0100 before chasing. Enter on pullbacks and manage risk appropriately.
Click here to buy now 👉 $SXT
#SXT #BinanceIncidentReport
15
·
--
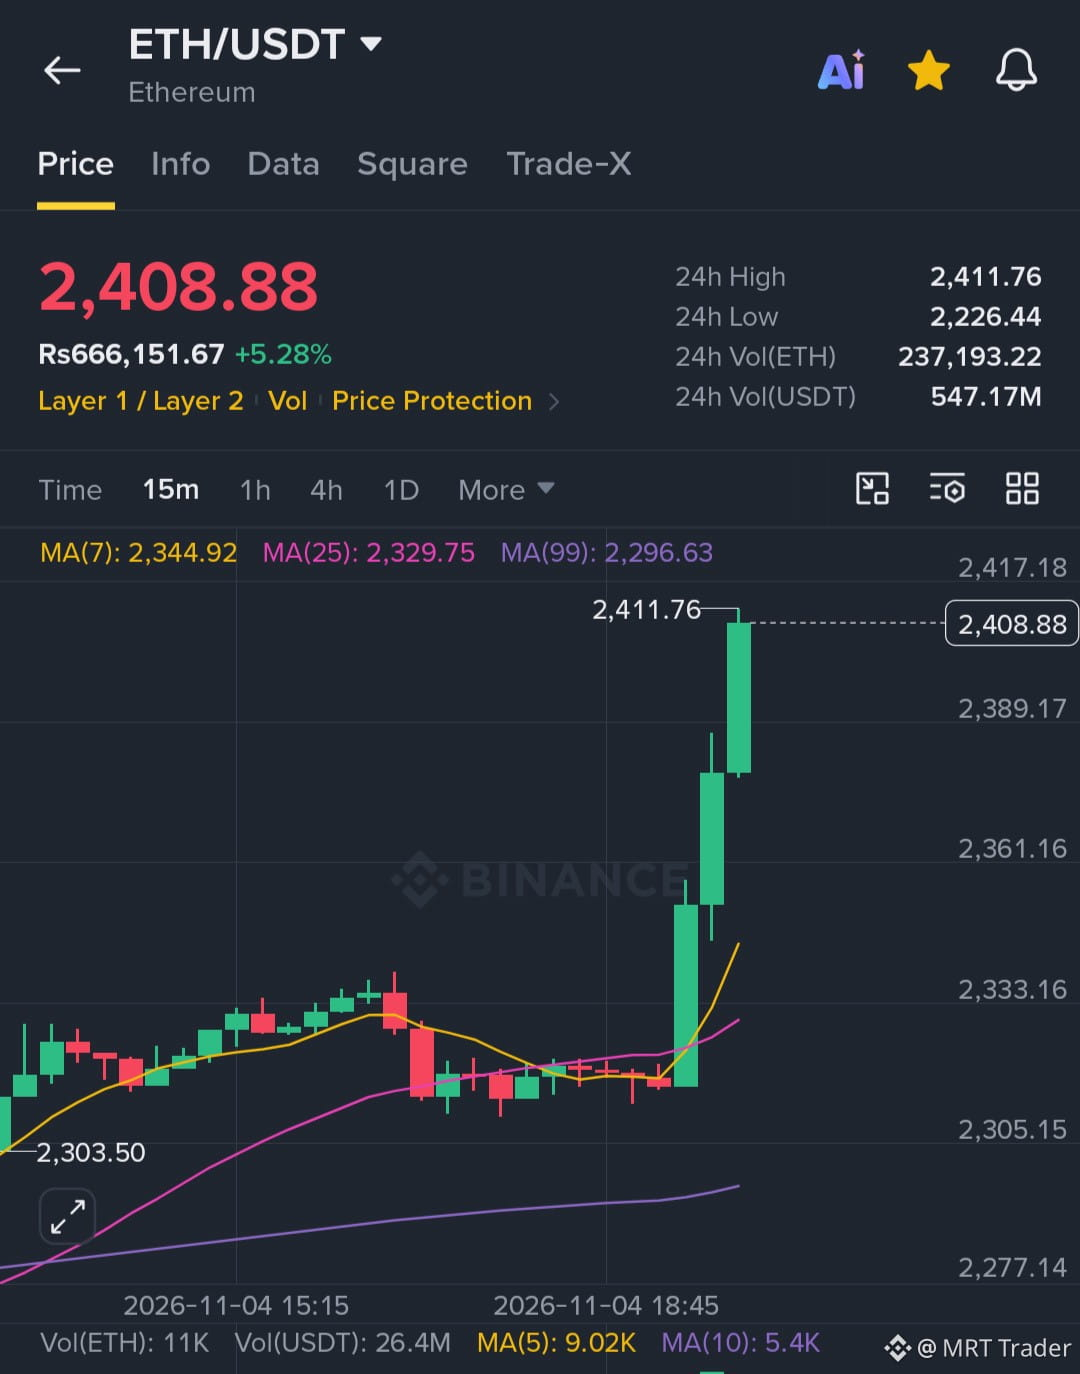
$ETH is showing a sharp bullish breakout, and I'm opening another quick long scalp here.
Key Level:
🟢 Bullish above: 2,398
Trade Setup (Long):
🟢 Entry Zone: 2,378 – 2,392
🎯 Targets: 2,403 / 2,425 / 2,444
⛔ Stop Loss: 2,358
Price is holding bullish strength. This is a quick scalp, so keep size small, enter on pullbacks and manage risk appropriately.
Click here to buy now 👉 $ETH
{future}(ETHUSDT)
#ETH #BinanceIncidentReport
$ETH is showing a sharp bullish breakout, and I'm opening another quick long scalp here.
Key Level:
🟢 Bullish above: 2,398
Trade Setup (Long):
🟢 Entry Zone: 2,378 – 2,392
🎯 Targets: 2,403 / 2,425 / 2,444
⛔ Stop Loss: 2,358
Price is holding bullish strength. This is a quick scalp, so keep size small, enter on pullbacks and manage risk appropriately.
Click here to buy now 👉 $ETH
#ETH #BinanceIncidentReport
Key Level:
🟢 Bullish above: 2,398
Trade Setup (Long):
🟢 Entry Zone: 2,378 – 2,392
🎯 Targets: 2,403 / 2,425 / 2,444
⛔ Stop Loss: 2,358
Price is holding bullish strength. This is a quick scalp, so keep size small, enter on pullbacks and manage risk appropriately.
Click here to buy now 👉 $ETH
#ETH #BinanceIncidentReport
11
·
--
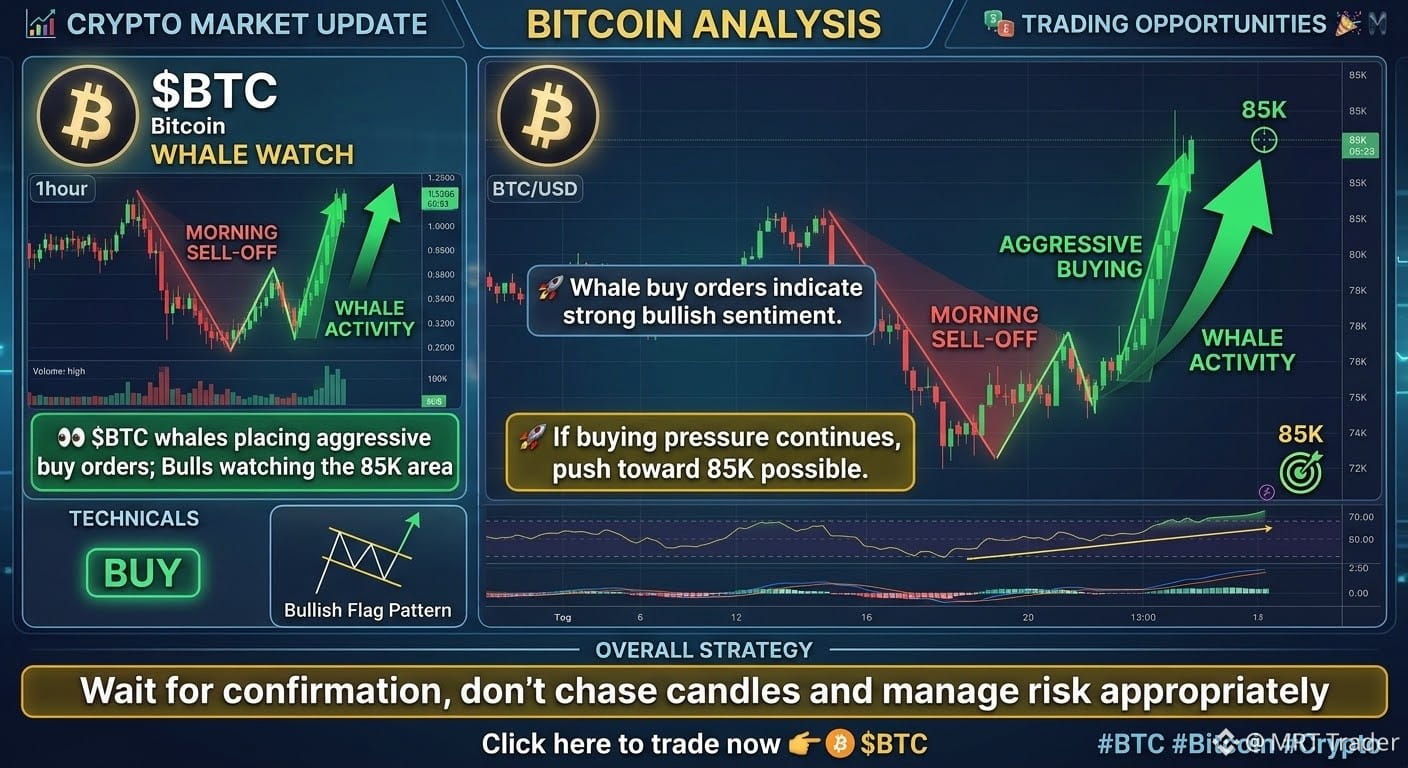
🐋 $BTC whales appear to be placing aggressive buy orders, and bulls are watching the 85K area. 🚀
If the buying pressure continues, a push toward 85K is possible. Nothing is guaranteed, so wait for price confirmation, don't chase candles and manage risk appropriately.
Are you watching $BTC here? 👀
#BTC #Bitcoin #Crypto
🐋 $BTC whales appear to be placing aggressive buy orders, and bulls are watching the 85K area. 🚀
If the buying pressure continues, a push toward 85K is possible. Nothing is guaranteed, so wait for price confirmation, don't chase candles and manage risk appropriately.
Are you watching $BTC here? 👀
#BTC #Bitcoin #Crypto
If the buying pressure continues, a push toward 85K is possible. Nothing is guaranteed, so wait for price confirmation, don't chase candles and manage risk appropriately.
Are you watching $BTC here? 👀
#BTC #Bitcoin #Crypto
15
·
--
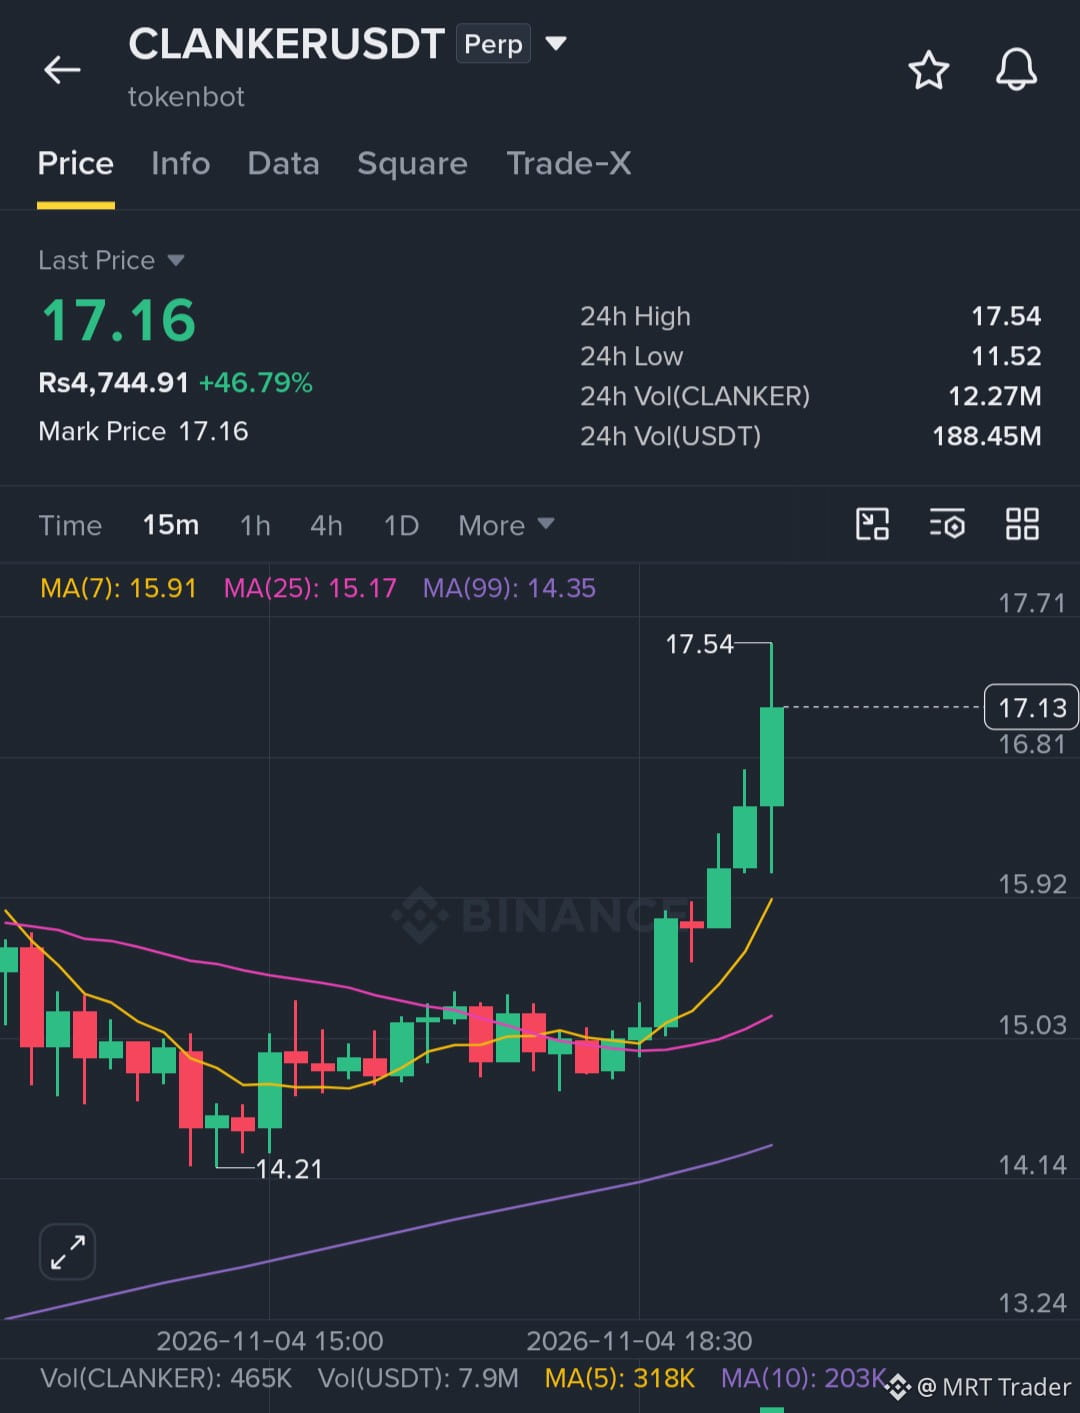
😂 I think $CLANKER is being slept on. It just pumped +40% in a day, and a lot of people are still doubting it.
Could $CLANKER really reach $100 this cycle? What's your prediction? 👇
Pumps this fast can reverse quickly, so don't chase. Wait for pullbacks and manage risk appropriately.
#CLANKER #Crypto #BinanceSquare #USOctoberNFP-AreRateCutsStillPossible
😂 I think $CLANKER is being slept on. It just pumped +40% in a day, and a lot of people are still doubting it.
Could $CLANKER really reach $100 this cycle? What's your prediction? 👇
Pumps this fast can reverse quickly, so don't chase. Wait for pullbacks and manage risk appropriately.
#CLANKER #Crypto #BinanceSquare #USOctoberNFP-AreRateCutsStillPossible
Could $CLANKER really reach $100 this cycle? What's your prediction? 👇
Pumps this fast can reverse quickly, so don't chase. Wait for pullbacks and manage risk appropriately.
#CLANKER #Crypto #BinanceSquare #USOctoberNFP-AreRateCutsStillPossible
11
·
--
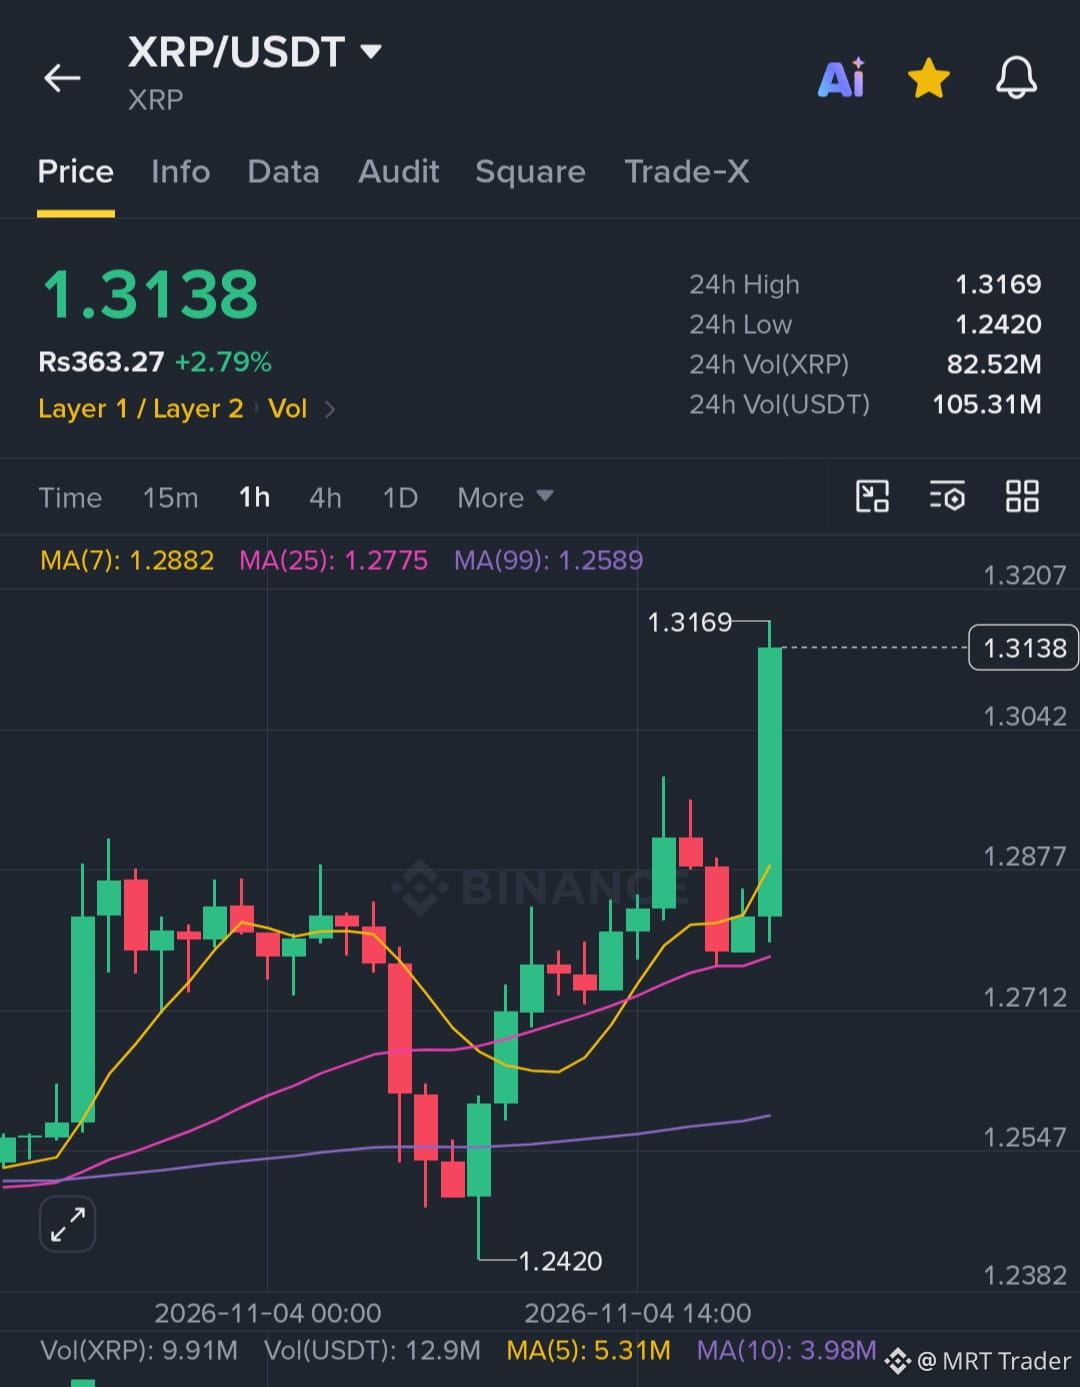
$XRP is breaking higher with a strong green candle above all its moving averages, and structure favors continuation toward higher targets.
Key Level:
🟢 Bullish above: 1.3200
Trade Setup (Long):
🟢 Entry Zone: 1.2980 – 1.3100
🎯 Targets: 1.3260 / 1.3400 / 1.3560
⛔ Stop Loss: 1.2820
Price is holding bullish strength. Enter on pullbacks and manage risk appropriately.
Click here to buy now 👉 $XRP
{future}(XRPUSDT)
#XRP #USOctoberNFP-AreRateCutsStillPossible
$XRP is breaking higher with a strong green candle above all its moving averages, and structure favors continuation toward higher targets.
Key Level:
🟢 Bullish above: 1.3200
Trade Setup (Long):
🟢 Entry Zone: 1.2980 – 1.3100
🎯 Targets: 1.3260 / 1.3400 / 1.3560
⛔ Stop Loss: 1.2820
Price is holding bullish strength. Enter on pullbacks and manage risk appropriately.
Click here to buy now 👉 $XRP
#XRP #USOctoberNFP-AreRateCutsStillPossible
Key Level:
🟢 Bullish above: 1.3200
Trade Setup (Long):
🟢 Entry Zone: 1.2980 – 1.3100
🎯 Targets: 1.3260 / 1.3400 / 1.3560
⛔ Stop Loss: 1.2820
Price is holding bullish strength. Enter on pullbacks and manage risk appropriately.
Click here to buy now 👉 $XRP
#XRP #USOctoberNFP-AreRateCutsStillPossible
13
·
--
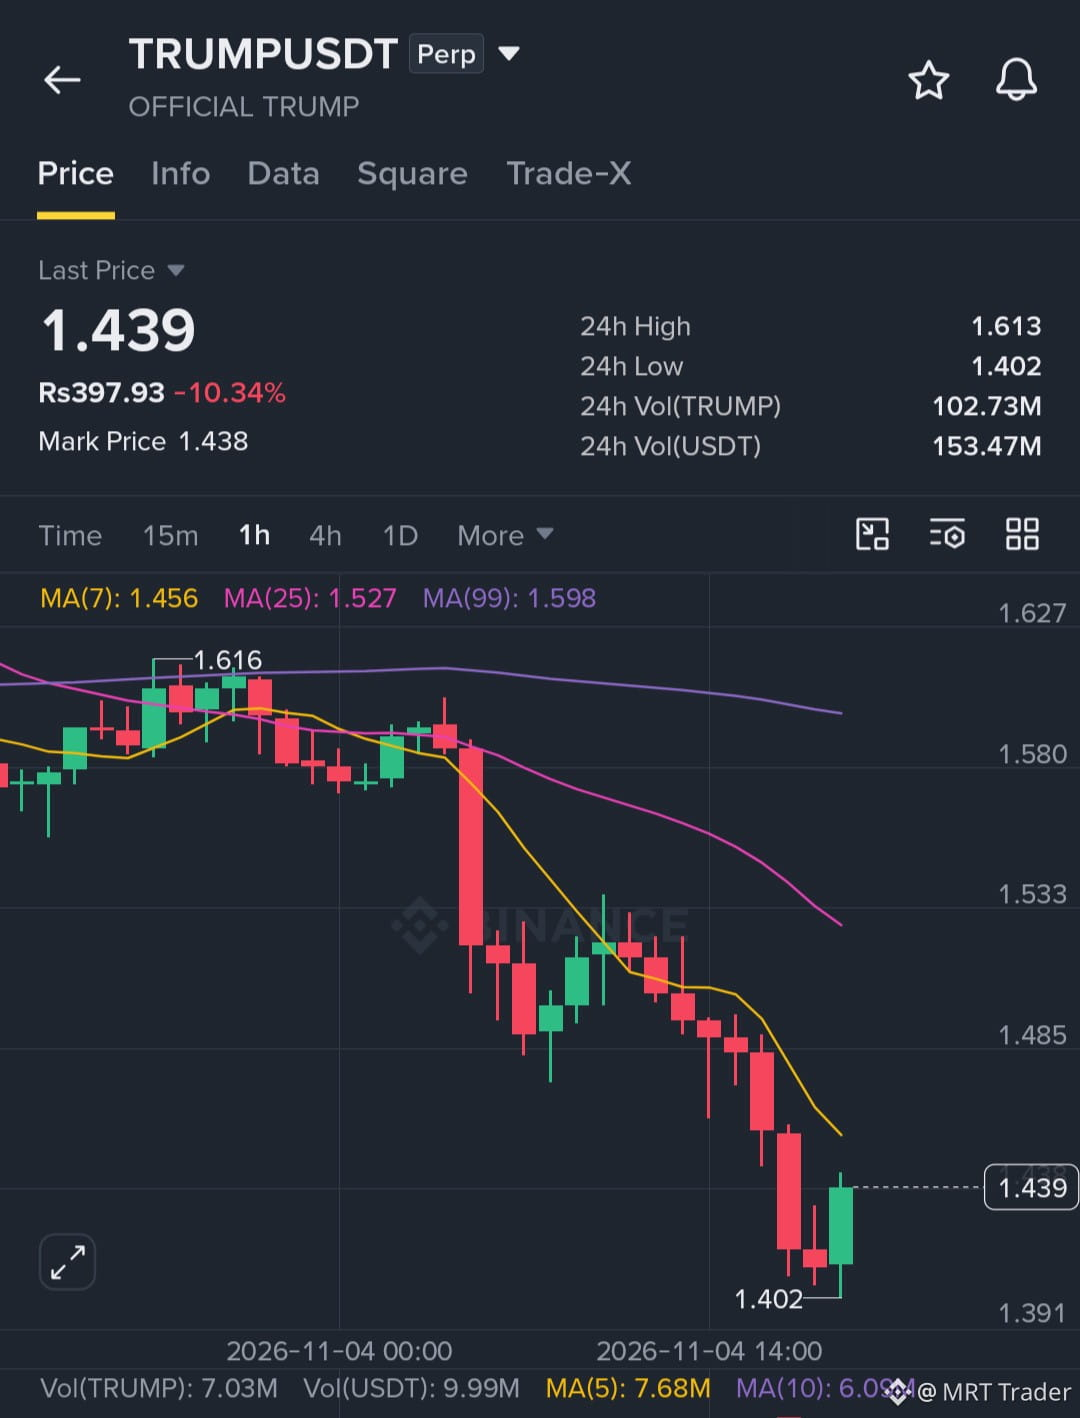
$TRUMP is stabilizing after a sharp pullback, and structure favors a rebound toward higher targets.
Key Level:
🟢 Bullish above: 1.455
Trade Setup (Long):
🟢 Entry Zone: 1.385 – 1.430
🎯 Targets: 1.495 / 1.560 / 1.630
⛔ Stop Loss: 1.305
Price is holding its ground. Enter on pullbacks and manage risk appropriately.
Click here to buy now 👉 $TRUMP
{future}(TRUMPUSDT)
#TRUMP #37thQuarterlyBNBBurnRemoves1.64MillionBNB #USOctoberNFP-AreRateCutsStillPossible
$TRUMP is stabilizing after a sharp pullback, and structure favors a rebound toward higher targets.
Key Level:
🟢 Bullish above: 1.455
Trade Setup (Long):
🟢 Entry Zone: 1.385 – 1.430
🎯 Targets: 1.495 / 1.560 / 1.630
⛔ Stop Loss: 1.305
Price is holding its ground. Enter on pullbacks and manage risk appropriately.
Click here to buy now 👉 $TRUMP
#TRUMP #37thQuarterlyBNBBurnRemoves1.64MillionBNB #USOctoberNFP-AreRateCutsStillPossible
Key Level:
🟢 Bullish above: 1.455
Trade Setup (Long):
🟢 Entry Zone: 1.385 – 1.430
🎯 Targets: 1.495 / 1.560 / 1.630
⛔ Stop Loss: 1.305
Price is holding its ground. Enter on pullbacks and manage risk appropriately.
Click here to buy now 👉 $TRUMP
#TRUMP #37thQuarterlyBNBBurnRemoves1.64MillionBNB #USOctoberNFP-AreRateCutsStillPossible
35
·
--
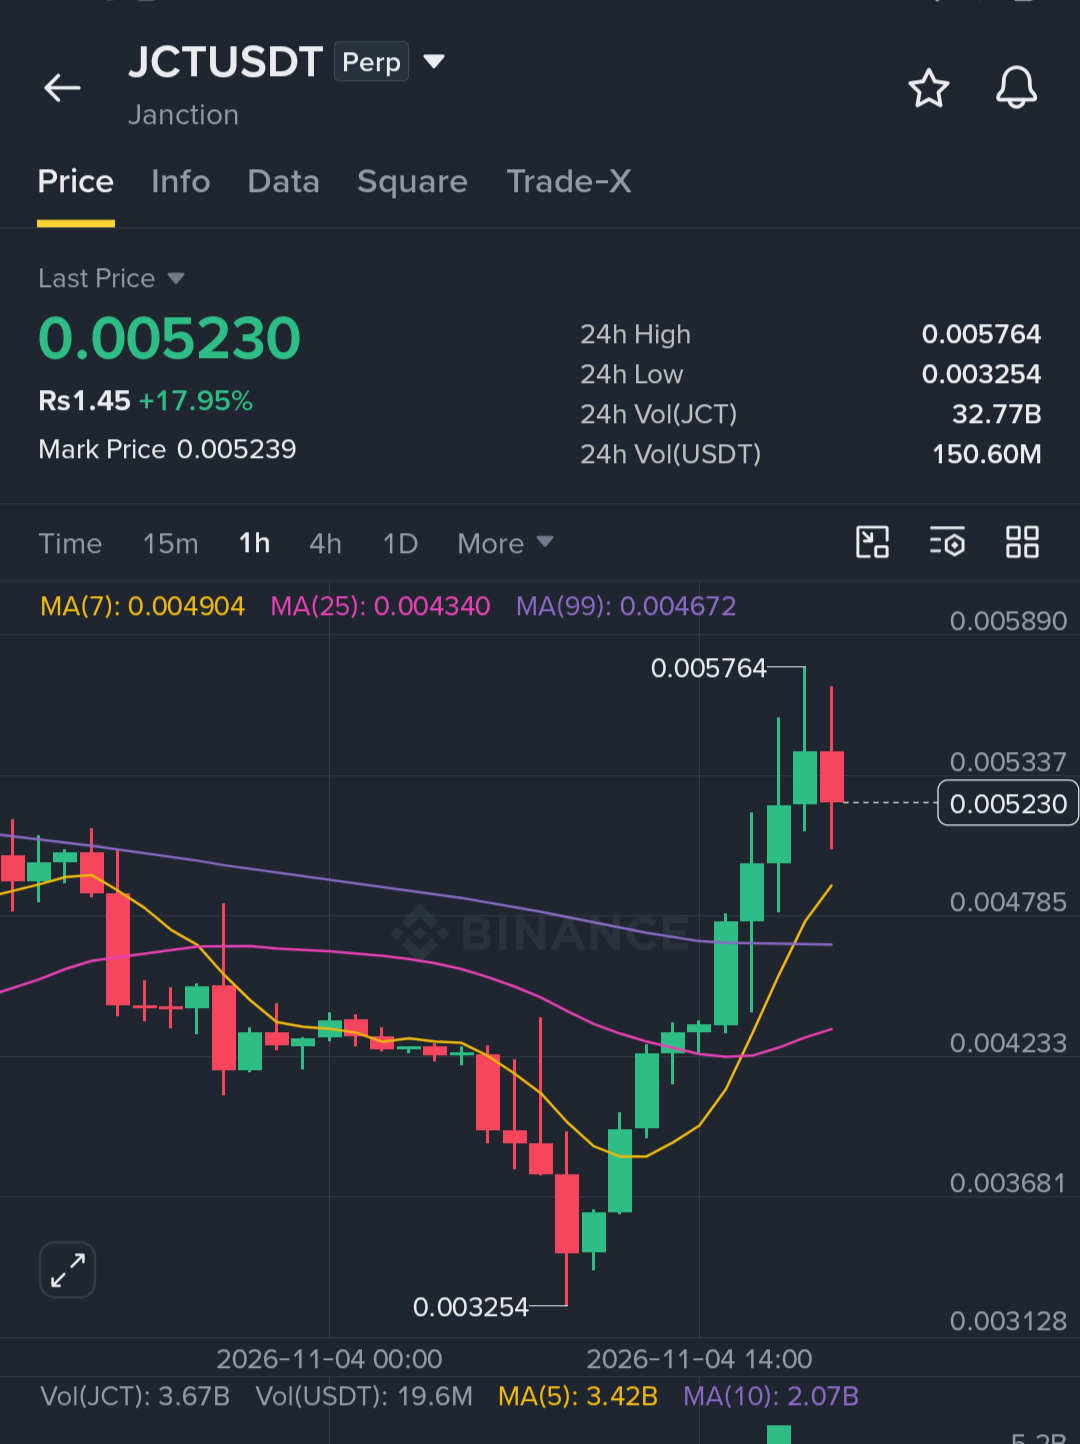
$JCT is holding firm after its recent move, and structure favors continuation toward higher targets.
Key Level:
🟢 Bullish above: 0.00540
Trade Setup (Long):
🟢 Entry Zone: 0.00502 – 0.00528
🎯 Targets: 0.00562 / 0.00590 / 0.00615
⛔ Stop Loss: 0.00443
Price is holding bullish strength. Enter on pullbacks and manage risk appropriately.
Click here to buy now 👉 $JCT
{future}(JCTUSDT)
#JCT #USOctoberNFP-AreRateCutsStillPossible
$JCT is holding firm after its recent move, and structure favors continuation toward higher targets.
Key Level:
🟢 Bullish above: 0.00540
Trade Setup (Long):
🟢 Entry Zone: 0.00502 – 0.00528
🎯 Targets: 0.00562 / 0.00590 / 0.00615
⛔ Stop Loss: 0.00443
Price is holding bullish strength. Enter on pullbacks and manage risk appropriately.
Click here to buy now 👉 $JCT
#JCT #USOctoberNFP-AreRateCutsStillPossible
Key Level:
🟢 Bullish above: 0.00540
Trade Setup (Long):
🟢 Entry Zone: 0.00502 – 0.00528
🎯 Targets: 0.00562 / 0.00590 / 0.00615
⛔ Stop Loss: 0.00443
Price is holding bullish strength. Enter on pullbacks and manage risk appropriately.
Click here to buy now 👉 $JCT
#JCT #USOctoberNFP-AreRateCutsStillPossible
26
·
--
Bearish
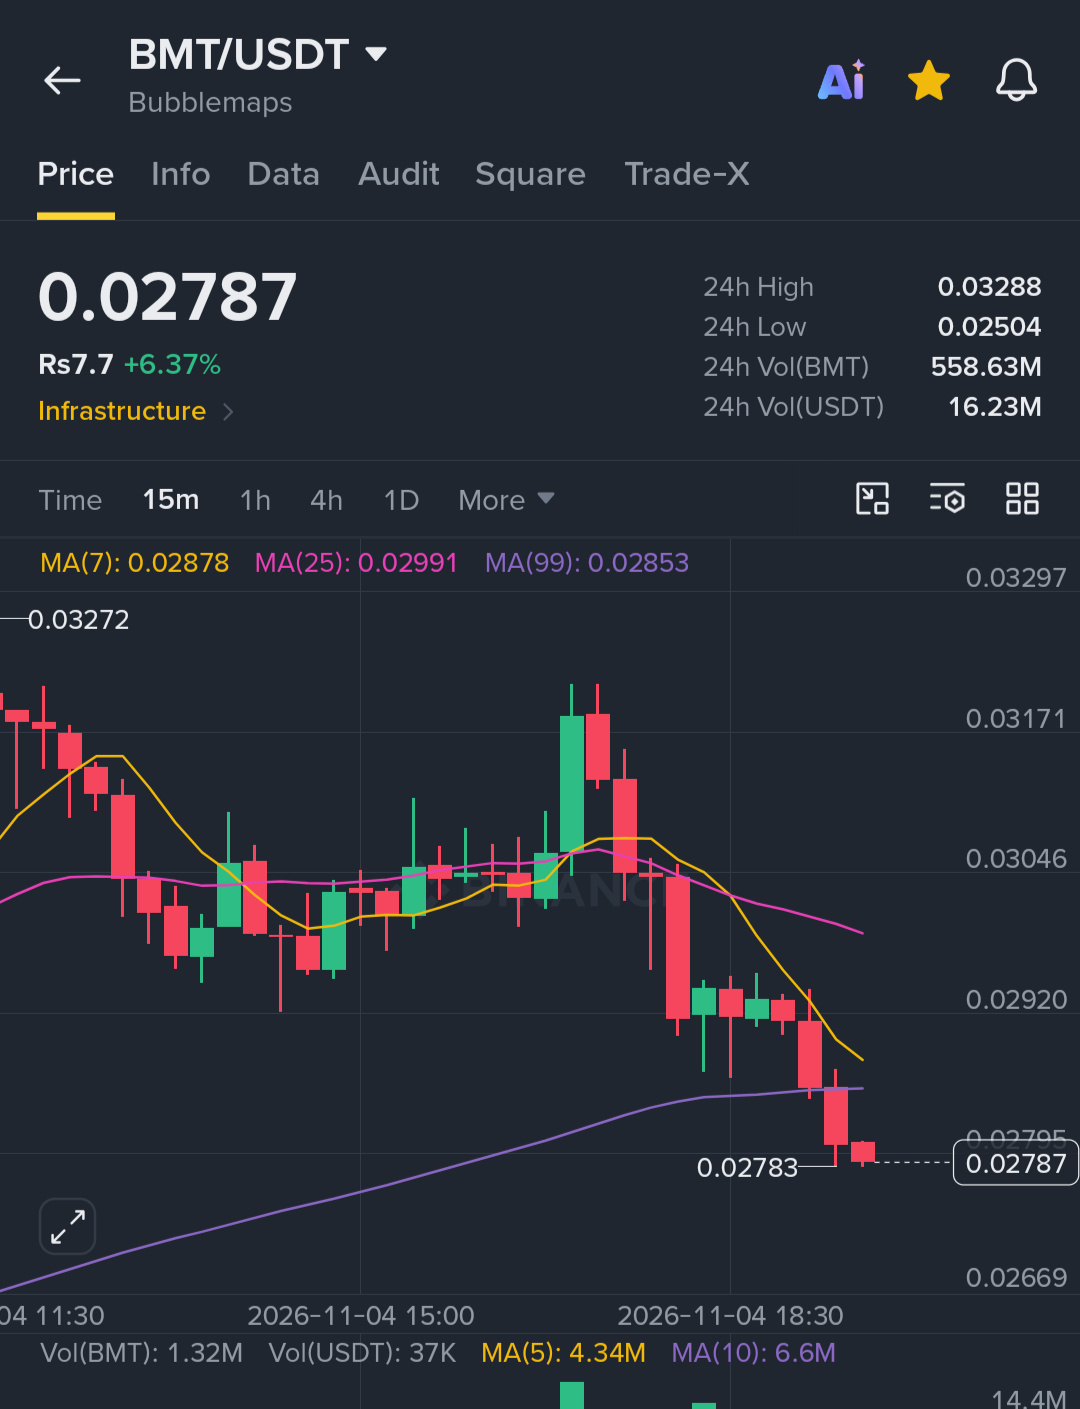
$BMT is struggling near current levels, and structure favors a move lower from this zone.
Key Level:
🔴 Bearish below: 0.02740
Trade Setup (Short):
🔴 Entry Zone: 0.02790 – 0.02825
🎯 Targets: 0.02715 / 0.02565 / 0.02415
⛔ Stop Loss: 0.03095
Price is showing weakness. Wait for a clear rejection, enter on bounces and manage risk appropriately.
Click here to short now 👉 $BMT
{future}(BMTUSDT)
#BMT #BinanceIncidentReport
$BMT is struggling near current levels, and structure favors a move lower from this zone.
Key Level:
🔴 Bearish below: 0.02740
Trade Setup (Short):
🔴 Entry Zone: 0.02790 – 0.02825
🎯 Targets: 0.02715 / 0.02565 / 0.02415
⛔ Stop Loss: 0.03095
Price is showing weakness. Wait for a clear rejection, enter on bounces and manage risk appropriately.
Click here to short now 👉 $BMT
#BMT #BinanceIncidentReport
Key Level:
🔴 Bearish below: 0.02740
Trade Setup (Short):
🔴 Entry Zone: 0.02790 – 0.02825
🎯 Targets: 0.02715 / 0.02565 / 0.02415
⛔ Stop Loss: 0.03095
Price is showing weakness. Wait for a clear rejection, enter on bounces and manage risk appropriately.
Click here to short now 👉 $BMT
#BMT #BinanceIncidentReport
28
Log in to explore more content
Join global crypto users on Binance Square
⚡️ Get latest and useful information about crypto.
💬 Trusted by the world’s largest crypto exchange.
👍 Discover real insights from verified creators.
Email / Phone number
Trending Topics
BTCRebounds80K
2,158 views
210 Discussing
#BTCRebounds80K 🚀 BTC RECLAIMS $80K AS ALTCOINS RALLY!
Bitcoin's recovery above $80,000 is boosting market sentiment, while three altcoins are showing strong momentum.
📊 TOP PERFORMERS
CLANKER: $19.89 | +70.88%
JCT: $0.005364 | +23.65%
ELSA: $0.07942 | +23.65%
🔥 Key Highlights:
CLANKER leads daily gains.
JCT dominates the 30-day performance with +220.18%.
ELSA shows steady growth but has comparatively lower trading volume.
🎯 Market Watch: BTC's next resistance zone is $82K–$84K.
⚠️ High volatility remains. Manage risk carefully.
Not financial advice. Always do your own research.
#BTCRebounds80K #CLANKER #JCT #ELSA #CryptoMarket
CHASEPA SULUXù
·0 Likes
·53 views
Binance98PercentReplenished
4,404 views
297 Discussing
USMidterms-WhatAreMarketsExpecting?
225,613 views
1,741 Discussing