

MetaCipher3
1.9k Posts

MetaCipher3
Report
Block User
Follow for more updates. God, family, and crypto.
Open Trade
High-Frequency Trader
1.2 Years
6 Following
80 Followers
1.5K+ Liked
Posts
Portfolio
All
Quotes
·
--
What exactly is the difference between cold wallets and hot wallets?
Your coins are always recorded on the blockchain; what a wallet actually holds is the private key that controls your assets.
A hot wallet is a wallet whose private keys are stored on an internet-connected device, such as a wallet app on your phone or a browser extension wallet.
The most important thing to keep in mind when managing your holdings: never import your hardware wallet’s recovery phrase into a mobile wallet. Create a separate one for the hot wallet you use regularly.
$BTC 80188.41(-1.52%)
#BTC
·
--
❗️ $BEAT broke through the 0.1 threshold
Current price: 0.1015, 24h +18.91%.
How do you interpret this?
#BEAT
❗️ $BEAT broke through the 0.1 threshold
Current price: 0.1015, 24h +18.91%.
How do you interpret this?
#BEAT
Current price: 0.1015, 24h +18.91%.
How do you interpret this?
#BEAT
·
--
⚠️ Trending topic: “Gold prices have fallen back to the 800s; some people are rushing straight to the counter to buy gold bars”
Add $PAXG , affected by gold, to your watchlist. When a topic is at its most popular, opinions are often most divided. Which do you trust more: popularity or price?
#PAXG
⚠️ Trending topic: “Gold prices have fallen back to the 800s; some people are rushing straight to the counter to buy gold bars”
Add $PAXG , affected by gold, to your watchlist. When a topic is at its most popular, opinions are often most divided. Which do you trust more: popularity or price?
#PAXG
Add $PAXG , affected by gold, to your watchlist. When a topic is at its most popular, opinions are often most divided. Which do you trust more: popularity or price?
#PAXG
12
·
--
A fact that's hard to laugh about: $AIN lost the 0.14 level.
They say that after falling enough, it will rise, but it seems never to have heard that saying.
Leave a little more room in leveraged positions; flash crashes never come at a convenient time.
#AIN
A fact that's hard to laugh about: $AIN lost the 0.14 level.
They say that after falling enough, it will rise, but it seems never to have heard that saying.
Leave a little more room in leveraged positions; flash crashes never come at a convenient time.
#AIN
They say that after falling enough, it will rise, but it seems never to have heard that saying.
Leave a little more room in leveraged positions; flash crashes never come at a convenient time.
#AIN
2
·
--
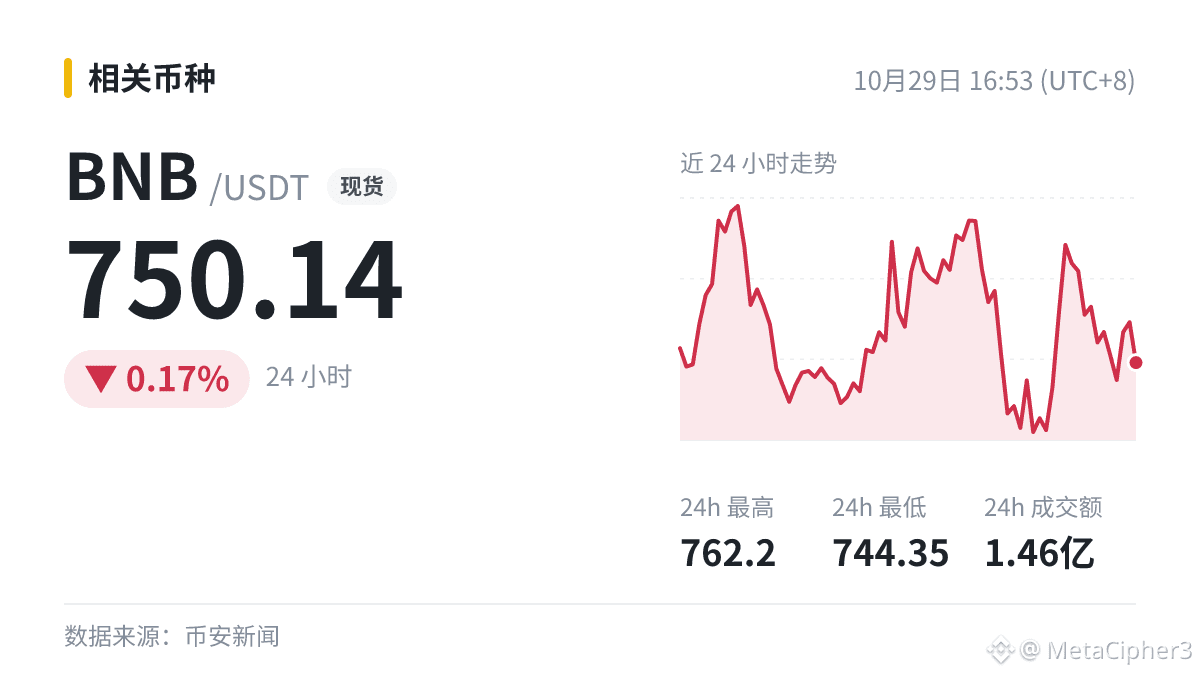
【Listing Update】Binance Futures will list six U-margined TradFi perpetual contracts
$BNB 24h -0.17%
Liquidity often improves after listing. The same news can have very different effects depending on where it appears. Observe first; there’s no need to rush.
#BNB
【Listing Update】Binance Futures will list six U-margined TradFi perpetual contracts
$BNB 24h -0.17%
Liquidity often improves after listing. The same news can have very different effects depending on where it appears. Observe first; there’s no need to rush.
#BNB
$BNB 24h -0.17%
Liquidity often improves after listing. The same news can have very different effects depending on where it appears. Observe first; there’s no need to rush.
#BNB
·
--
Many people think the higher the leverage, the faster they can make money, but overlook the other side of the equation.
With an isolated 10x long position, a price drop of less than 10% could trigger liquidation because maintenance margin is also deducted.
Before placing an order, do the math: if the price moves 5% against you, how much would this position lose, and could you withstand it?
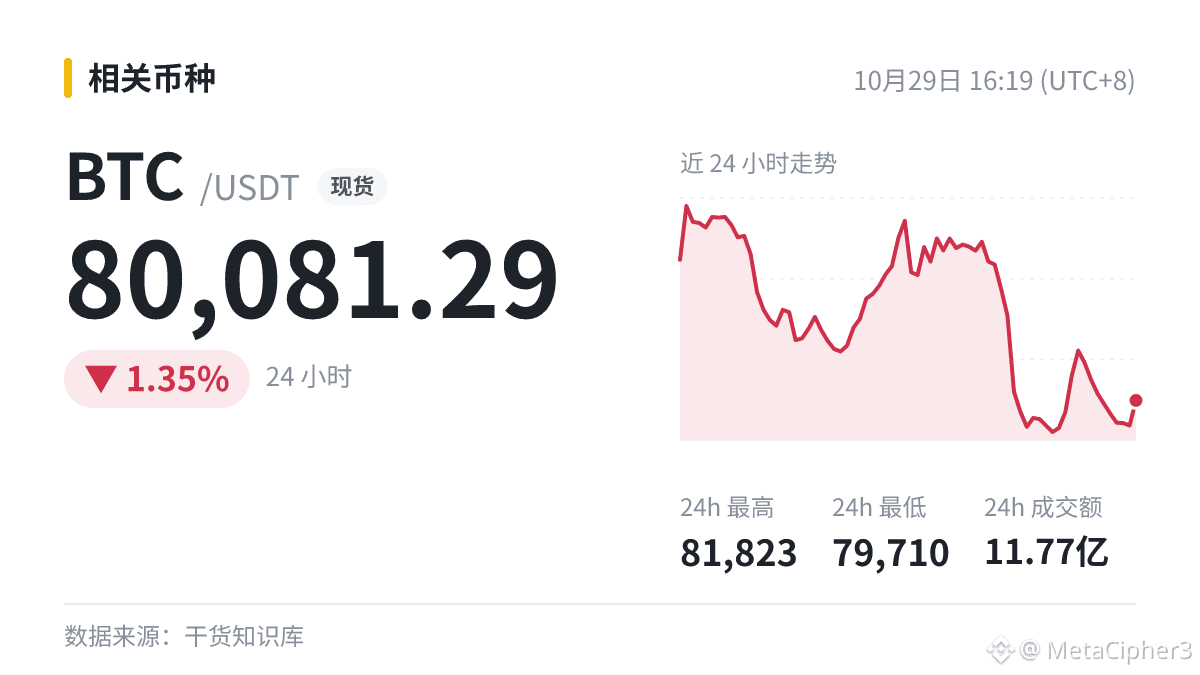
The coin mentioned above: $BTC is quoted at 80081.29 (24h -1.35%).
Did you know about this before?
·
--
$BTC (24h -1.27%): Am I trending today too?
Everyone online is talking about “Open Source Securities: The Fed may raise rates once more in 2026.” Whenever the Fed makes a move, it has to get nervous too.
The buzz is there—but will the price cooperate? Share your guess in the comments.
#美联储将于2027年起缩减议息会议 #BTC
Everyone online is talking about “Open Source Securities: The Fed may raise rates once more in 2026.” Whenever the Fed makes a move, it has to get nervous too.
The buzz is there—but will the price cooperate? Share your guess in the comments.
#美联储将于2027年起缩减议息会议 #BTC
1
·
--
Capital flows are often reflected in trading activity:
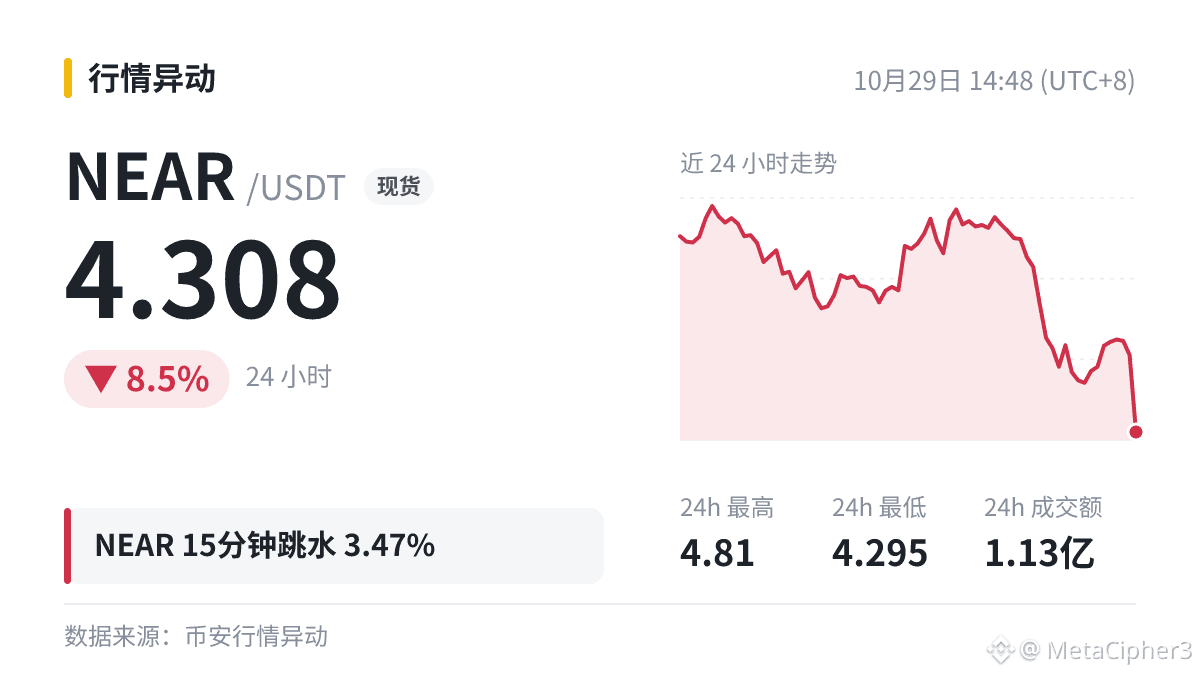
$NEAR plunged 3.47% in 15 minutes, with a current price of 4.308 and 24-hour trading volume of $113 million.
What does the capital flow picture tell us?
· The drop was concentrated in just 15 minutes, suggesting heavy, concentrated selling pressure
· The 24-hour change is also -8.5%, with holders broadly moving toward selling
· Next, watch for large buy orders absorbing the selling at lower levels; without them, the price could easily continue to fall
How would you interpret this?
·
--
Came across #谷歌将预览加密托管安全系统 trending again—saving this. $BTC 24h -0.93%; I’ll check back in a few days to see how much this topic has generated.
Came across #谷歌将预览加密托管安全系统 trending again—saving this. $BTC 24h -0.93%; I’ll check back in a few days to see how much this topic has generated.
·
--
A post I saw today: Ethereum clients Teku and Besu fixed a certificate vulnerability to prevent attackers from stealing ETH rewards.
On the face of it, this is a negative. How much of an impact it has on the market is up to the money flows to decide. I have a little habit: when news breaks, I save it first and check back at night to see how prices have moved.
$ETH I’ll wait and see.
On the face of it, this is a negative. How much of an impact it has on the market is up to the money flows to decide. I have a little habit: when news breaks, I save it first and check back at night to see how prices have moved.
$ETH I’ll wait and see.
1
·
--
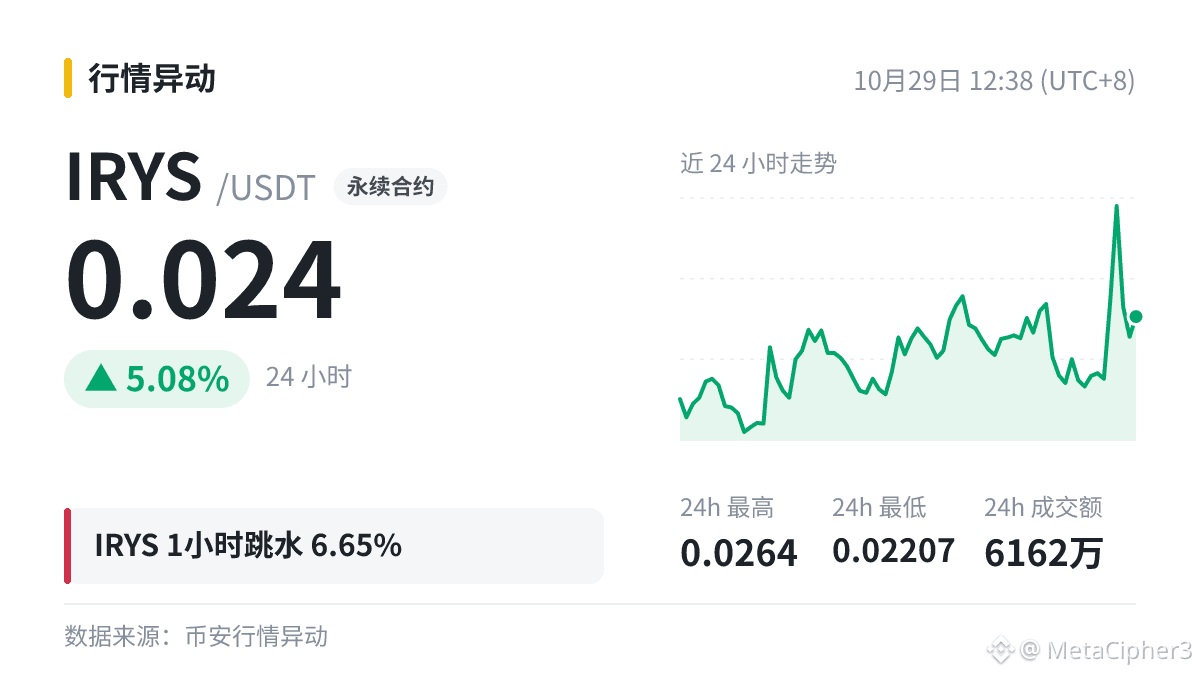
Just glanced at the market—it’s down 6.65% in $IRYS 1 hours.
A drop this sharp likely means leveraged positions are being forced out.
Just glanced at the market—it’s down 6.65% in $IRYS 1 hours.
A drop this sharp likely means leveraged positions are being forced out.
A drop this sharp likely means leveraged positions are being forced out.
·
--
Fell 11.52% over $IDOL 1 hours, to 0.01257, with a 24h range of 0.008253 ~ 0.01624.
Wait for the candlestick to close before making a judgment; an intraday spike doesn't count.
The selling pressure came on strong. Whether it continues will be clear from the volume of the next few candlesticks.
Fell 11.52% over $IDOL 1 hours, to 0.01257, with a 24h range of 0.008253 ~ 0.01624.
Wait for the candlestick to close before making a judgment; an intraday spike doesn't count.
The selling pressure came on strong. Whether it continues will be clear from the volume of the next few candlesticks.
Wait for the candlestick to close before making a judgment; an intraday spike doesn't count.
The selling pressure came on strong. Whether it continues will be clear from the volume of the next few candlesticks.
7
·
--
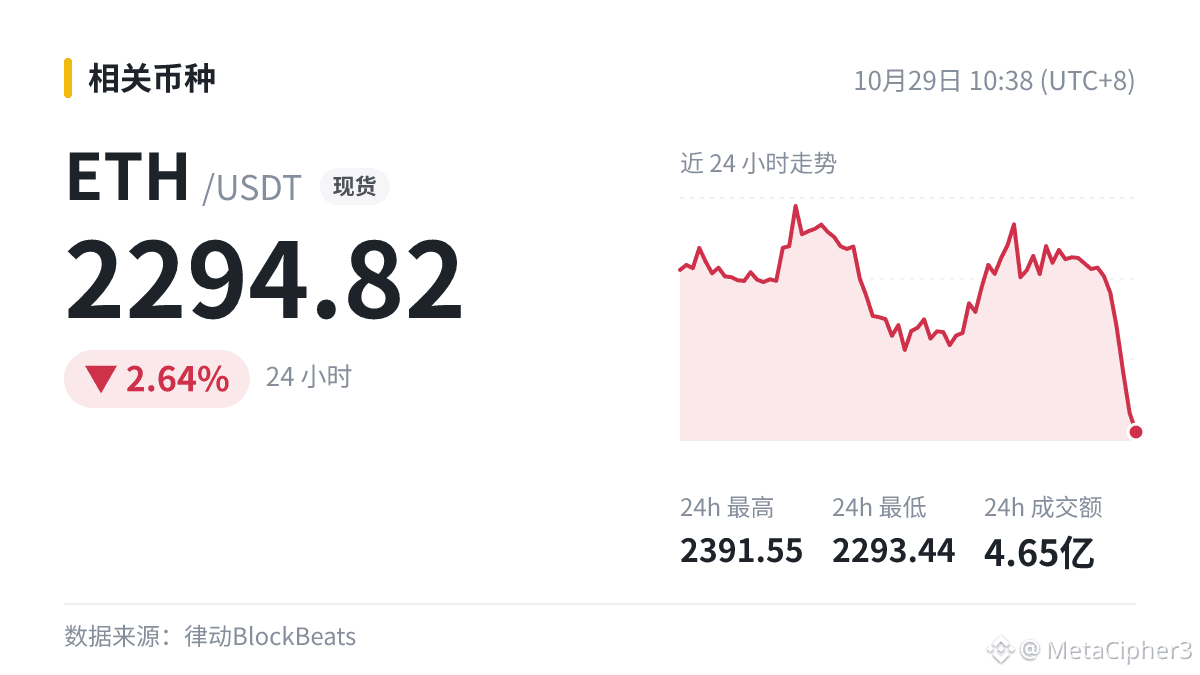
🐳 $ETH Market Snapshot | Ethereum briefly fell below $2,300, down 2.64% on the day
Bad news gave sellers a reason to act. Will they use the opportunity to exit? Watch the trading volume that follows.
🐳 $ETH Market Snapshot | Ethereum briefly fell below $2,300, down 2.64% on the day
Bad news gave sellers a reason to act. Will they use the opportunity to exit? Watch the trading volume that follows.
Bad news gave sellers a reason to act. Will they use the opportunity to exit? Watch the trading volume that follows.
41
·
--
Watch the money, not the news.
Data infrastructure provider Allium suffered unauthorized access; its core services are back online.
When good news breaks, the biggest thing to watch out for is large investors selling into the hype: if the candlestick chart rises but large orders don’t follow, be extra cautious.
$BTC 24h trading volume: $1.048 billion, 24h: -0.35%. What would you do?
55
·
--
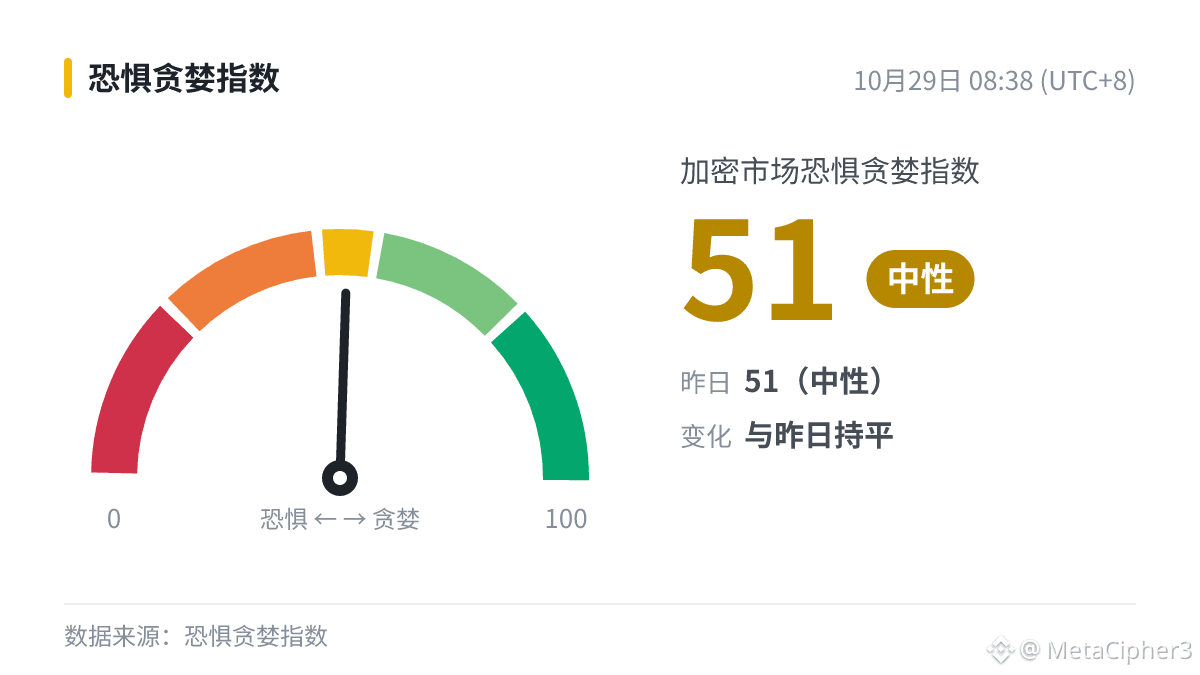
The market mini-show is back with an update: $BTC Market Sentiment Thermometer: Fear & Greed Index 51 (Neutral), unchanged from yesterday.
This index changes once a day; my emotions update by the second.
Seriously, the social media component measures the volume and pace of engagement in Bitcoin discussions. A noticeable increase in discussion is generally considered a sign of greater greed.
With leveraged positions, first think through whether you can withstand the worst-case scenario, then see what the indicators say.
36
·
--
$DOOD broke below the 0.0019 level.
Guys, how do key price levels come about? Here's the explanation in a nutshell 👇
The longer it's been since the price last reached this level, the more likely the holder structure around it has changed. Past support and resistance may no longer hold.
The first rebound after a break below is often seen as a litmus test: if the price is rejected below the level, that strengthens the case that support has turned into resistance.
Learning to read indicators is easy. The hard part is sticking to your plan when emotions are running high.
#DOOD
1
·
--
🗞️ Y Combinator releases a report on crypto startup trends, focusing on stablecoins, asset tokenization, and AI agents
$BTC latest: 80560.01. This is more useful for understanding industry changes and isn’t closely related to current market conditions.
Whether open interest is rising or falling can reveal how leveraged funds view the market.
$BTC latest: 80560.01. This is more useful for understanding industry changes and isn’t closely related to current market conditions.
Whether open interest is rising or falling can reveal how leveraged funds view the market.
4
·
--
Q: The U.S. Treasury sanctions 10 individuals and one entity in a crackdown on North Korean IT worker fraud networks. What impact will this have on the market?
A: After bad news breaks, whether selling pressure continues is more important than the headline itself. News can change the pace, but is less likely to change the trend; direction still depends on the candlestick charts.
$BTC .
A: After bad news breaks, whether selling pressure continues is more important than the headline itself. News can change the pace, but is less likely to change the trend; direction still depends on the candlestick charts.
$BTC .
1
·
--
First, the data: $BTC 80555.92 (24h +0.3%)
News: Circle submitted a comment letter to the SEC, recommending that compliant payment stablecoins be treated as “cash” and that the haircut for broker-dealer holdings be reduced to zero.
The impact is relatively neutral, and the price is still following its previous trend. Whether trading volume actually picked up around the news is the most direct way to assess its impact.
#BTC
4
·
--
🗂️ Data: $SPCXB |5-minute trading volume surged 17.1×|Price fell 0.71%
· Meaning: Every trade has both a buyer and a seller, so higher volume alone doesn’t mean there are more buyers or that money is flowing in; it only means trading has become more active.
· How to read it: Don’t chase a move just because you see a multiple. Volatility is usually highest when volume surges, so using less leverage is a safer approach.
Understanding an indicator is meant to keep you from being spooked by a single number, not to predict price movements precisely.
1
Log in to explore more content
Join global crypto users on Binance Square
⚡️ Get latest and useful information about crypto.
💬 Trusted by the world’s largest crypto exchange.
👍 Discover real insights from verified creators.
Email / Phone number