
空杯之心
13 Posts

空杯之心
Report
Block User
分享心得
Open Trade
High-Frequency Trader
9 Years
10 Following
9 Followers
2 Liked
Posts
Portfolio
PINNED
·
--
Big money is made by following the trend. In this bull market, I’m doing just three things:
1. Confirming that a new bull market cycle has begun (multiple indicators have confirmed the shift from bear to bull).
2. Finding assets with sustainable narratives that can keep rising along with the bull market.
3. Compounding on the daily chart: buying with 2–3x leverage, adding to my position during daily pullbacks, and keeping leverage at 2–3x.#BTC #HYPE
Big money is made by following the trend. In this bull market, I’m doing just three things:
1. Confirming that a new bull market cycle has begun (multiple indicators have confirmed the shift from bear to bull).
2. Finding assets with sustainable narratives that can keep rising along with the bull market.
3. Compounding on the daily chart: buying with 2–3x leverage, adding to my position during daily pullbacks, and keeping leverage at 2–3x.#BTC #HYPE
1. Confirming that a new bull market cycle has begun (multiple indicators have confirmed the shift from bear to bull).
2. Finding assets with sustainable narratives that can keep rising along with the bull market.
3. Compounding on the daily chart: buying with 2–3x leverage, adding to my position during daily pullbacks, and keeping leverage at 2–3x.#BTC #HYPE
2
200
·
--
Article
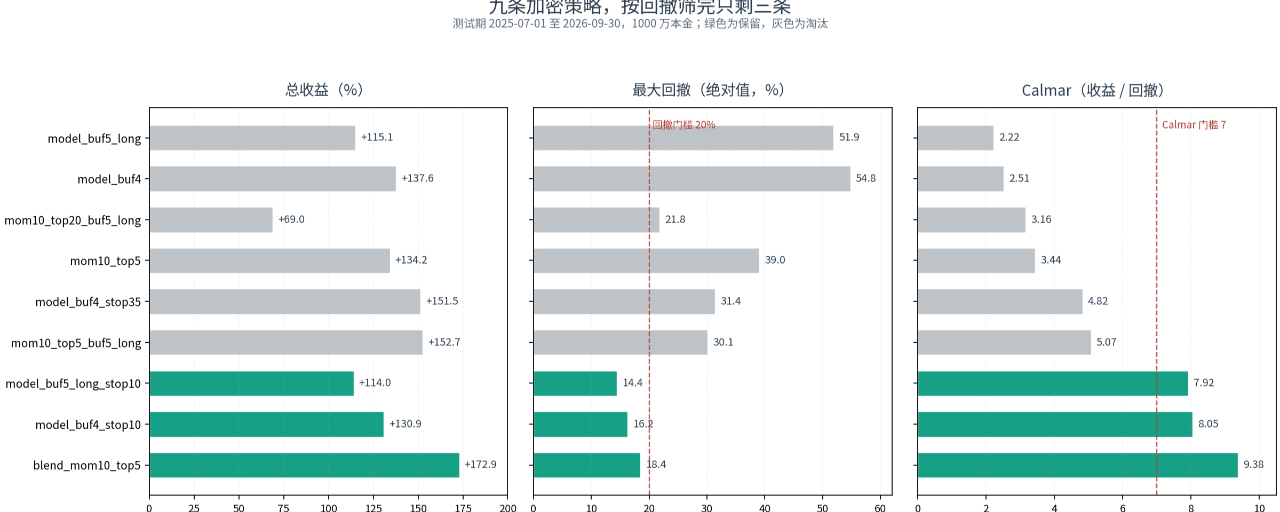
Cutting Nine Crypto Strategies Down to Three: If They Can’t Pass the Drawdown Test, They’re Out—No Matter How High the ReturnsAt the end of the previous installment, I wrote that the next one would cover three things: add a buffer and stop-loss to the fused signal, run the validation period, and then do a walk-forward test.
This installment didn’t follow that order.
After extending the data through October 21, I ran all nine strategies on the new forward window and reorganized the drawdown profiles for the test period. The decision after the runs: keep only three of the nine, and delete the other six, along with their strategy files and backtest results.
The six that were deleted weren’t unprofitable. Five had test-period returns above +115%, and the top performer returned +152.67%. But their maximum drawdowns ranged from -21.8% to -54.8%, and the longest time underwater was 232 trading days. Curves like these may look fine in a backtest, but in a live account, most people wouldn’t be able to hold on until they recovered.
Cutting Nine Crypto Strategies Down to Three: If They Can’t Pass the Drawdown Test, They’re Out—No Matter How High the Returns
At the end of the previous installment, I wrote that the next one would cover three things: add a buffer and stop-loss to the fused signal, run the validation period, and then do a walk-forward test.
This installment didn’t follow that order.
After extending the data through October 21, I ran all nine strategies on the new forward window and reorganized the drawdown profiles for the test period. The decision after the runs: keep only three of the nine, and delete the other six, along with their strategy files and backtest results.
The six that were deleted weren’t unprofitable. Five had test-period returns above +115%, and the top performer returned +152.67%. But their maximum drawdowns ranged from -21.8% to -54.8%, and the longest time underwater was 232 trading days. Curves like these may look fine in a backtest, but in a live account, most people wouldn’t be able to hold on until they recovered.
This installment didn’t follow that order.
After extending the data through October 21, I ran all nine strategies on the new forward window and reorganized the drawdown profiles for the test period. The decision after the runs: keep only three of the nine, and delete the other six, along with their strategy files and backtest results.
The six that were deleted weren’t unprofitable. Five had test-period returns above +115%, and the top performer returned +152.67%. But their maximum drawdowns ranged from -21.8% to -54.8%, and the longest time underwater was 232 trading days. Curves like these may look fine in a backtest, but in a live account, most people wouldn’t be able to hold on until they recovered.
402
·
--
# Nine Strategies, One Notebook: The +172.93% Backtest Must Be Reproducible with One ClickIn the previous episode, I combined the model score and momentum in equal parts. During the test period, it achieved a return of +172.93%, a drawdown of -18.44%, and a Sharpe ratio of 2.076. At the end, I said that next time I’d connect the blend to a buffer and stop-loss, then run it on the validation period.
Before actually getting started, I paused for a moment. The results for the nine better-performing strategies were scattered across different ablation scripts and cache directories. The parameters were in configuration dictionaries, and the signal files weren’t named consistently. If I switched machines, or came back to this in a couple of weeks, could I reproduce those nine figures exactly? The answer was no.
So this episode, instead of chasing returns further, I’m first turning the nine strategies into a directory that can be reproduced with one click. A backtest that can’t be reproduced is no different from making up a story.
# Nine Strategies, One Notebook: The +172.93% Backtest Must Be Reproducible with One Click
In the previous episode, I combined the model score and momentum in equal parts. During the test period, it achieved a return of +172.93%, a drawdown of -18.44%, and a Sharpe ratio of 2.076. At the end, I said that next time I’d connect the blend to a buffer and stop-loss, then run it on the validation period.
Before actually getting started, I paused for a moment. The results for the nine better-performing strategies were scattered across different ablation scripts and cache directories. The parameters were in configuration dictionaries, and the signal files weren’t named consistently. If I switched machines, or came back to this in a couple of weeks, could I reproduce those nine figures exactly? The answer was no.
So this episode, instead of chasing returns further, I’m first turning the nine strategies into a directory that can be reproduced with one click. A backtest that can’t be reproduced is no different from making up a story.
Before actually getting started, I paused for a moment. The results for the nine better-performing strategies were scattered across different ablation scripts and cache directories. The parameters were in configuration dictionaries, and the signal files weren’t named consistently. If I switched machines, or came back to this in a couple of weeks, could I reproduce those nine figures exactly? The answer was no.
So this episode, instead of chasing returns further, I’m first turning the nine strategies into a directory that can be reproduced with one click. A backtest that can’t be reproduced is no different from making up a story.
58
·
--
The baseline was still -5.5% last time. This time, I split the allocation evenly between the model and momentum and achieved +172.93%The baseline was still -5.5% last time. This time, I split the allocation evenly between the model and momentum and achieved +172.93%.
At the end of the last installment, I said I’d add funding fees and slippage in the next one. After finishing that piece, I paused for a moment because there was a more fundamental question I hadn’t answered: if the model’s daily IC is positive, why do I still lose money when I use it to select coins? Until I answer that, adding funding fees just means calculating the costs of a flawed strategy.
Let’s start by answering this question. The answer isn’t the model—it’s the coin-selection rules. After fixing the rules, I split the allocation evenly between the model and momentum and achieved a 172.93% return, an 18.44% drawdown, and a Sharpe ratio of 2.076 during the test period. But don’t celebrate just yet—I’ll explain how much of that number is smoke and mirrors later.
The baseline was still -5.5% last time. This time, I split the allocation evenly between the model and momentum and achieved +172.93%
The baseline was still -5.5% last time. This time, I split the allocation evenly between the model and momentum and achieved +172.93%.
At the end of the last installment, I said I’d add funding fees and slippage in the next one. After finishing that piece, I paused for a moment because there was a more fundamental question I hadn’t answered: if the model’s daily IC is positive, why do I still lose money when I use it to select coins? Until I answer that, adding funding fees just means calculating the costs of a flawed strategy.
Let’s start by answering this question. The answer isn’t the model—it’s the coin-selection rules. After fixing the rules, I split the allocation evenly between the model and momentum and achieved a 172.93% return, an 18.44% drawdown, and a Sharpe ratio of 2.076 during the test period. But don’t celebrate just yet—I’ll explain how much of that number is smoke and mirrors later.
At the end of the last installment, I said I’d add funding fees and slippage in the next one. After finishing that piece, I paused for a moment because there was a more fundamental question I hadn’t answered: if the model’s daily IC is positive, why do I still lose money when I use it to select coins? Until I answer that, adding funding fees just means calculating the costs of a flawed strategy.
Let’s start by answering this question. The answer isn’t the model—it’s the coin-selection rules. After fixing the rules, I split the allocation evenly between the model and momentum and achieved a 172.93% return, an 18.44% drawdown, and a Sharpe ratio of 2.076 during the test period. But don’t celebrate just yet—I’ll explain how much of that number is smoke and mirrors later.
172
·
--
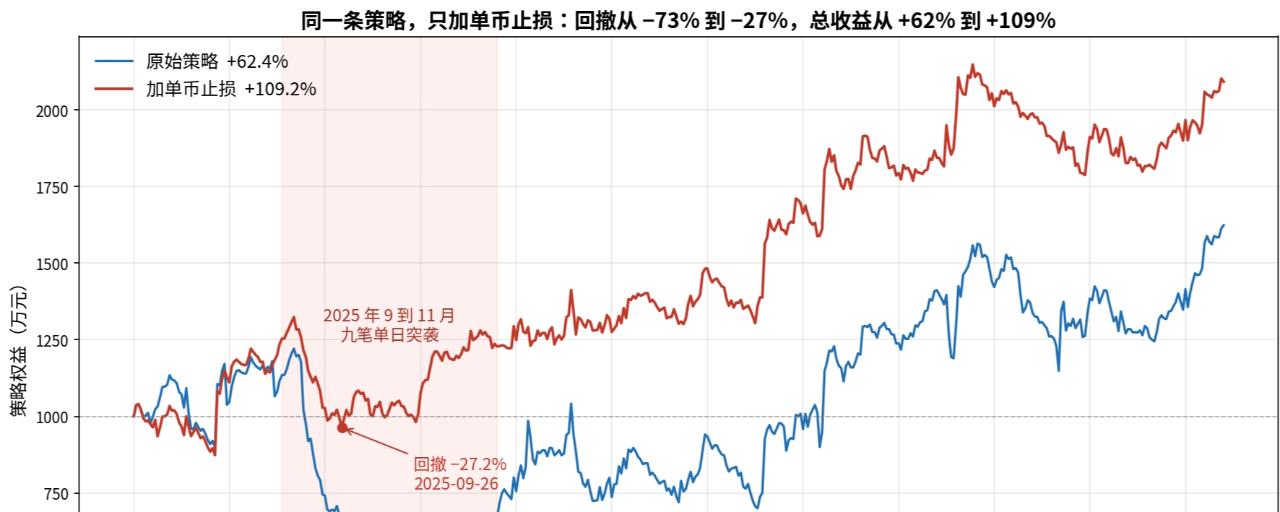
Last time I said 25% was the sweet spot for stop-losses. This time, I’m taking that back: the crypto pool includes AAPL, TSLA, and goldIn my last post, I reviewed a crypto perpetual risk-management strategy. It returned 62%, but had a maximum drawdown of 73%. After adding a 25% stop-loss for each individual coin, returns rose to 109% and the drawdown fell to 27%. My conclusion at the time was that 25% was the sweet spot for stop-loss width: less is more.
After publishing it, I didn’t jump straight into writing the next post. Instead, I went back to check what these contracts actually were. It turned out that Binance’s crypto perpetual pool includes tokenized U.S. stocks, ETFs, gold, crude oil, and stablecoins. AAPL, TSLA, NVDA, SPY, XAU, and USDC are all in there, trading 24/7, with daily chart structures no different from those of perpetuals.
Last time I said 25% was the sweet spot for stop-losses. This time, I’m taking that back: the crypto pool includes AAPL, TSLA, and gold
In my last post, I reviewed a crypto perpetual risk-management strategy. It returned 62%, but had a maximum drawdown of 73%. After adding a 25% stop-loss for each individual coin, returns rose to 109% and the drawdown fell to 27%. My conclusion at the time was that 25% was the sweet spot for stop-loss width: less is more.
After publishing it, I didn’t jump straight into writing the next post. Instead, I went back to check what these contracts actually were. It turned out that Binance’s crypto perpetual pool includes tokenized U.S. stocks, ETFs, gold, crude oil, and stablecoins. AAPL, TSLA, NVDA, SPY, XAU, and USDC are all in there, trading 24/7, with daily chart structures no different from those of perpetuals.
After publishing it, I didn’t jump straight into writing the next post. Instead, I went back to check what these contracts actually were. It turned out that Binance’s crypto perpetual pool includes tokenized U.S. stocks, ETFs, gold, crude oil, and stablecoins. AAPL, TSLA, NVDA, SPY, XAU, and USDC are all in there, trading 24/7, with daily chart structures no different from those of perpetuals.
275
·
--
Article
Backtest returns of 62%, drawdown of 73%. I added just one stop-loss, cut the drawdown to 27%, and doubled returns1. First, let’s see exactly how the money was lost
Over the past two weeks, I’ve been building a long-short strategy for crypto perpetuals, tested out of sample over 457 days with 10 million in simulated capital. The equity curve looks like a roller coaster, with both gains and losses wildly out of proportion.
I broke down and attributed the P&L for every coin on every day. The truth is highly concentrated. The drawdown didn’t happen gradually—it came from nine single-coin, single-day shocks. Eight losing trades added up to 8.73 million, more than the profits from the entire period. Five were shorts caught in vertical rallies; three were longs chasing parabolic moves. They were concentrated between September and November 2025, but the same pattern kept recurring in 2026. AKE, KAT, PLAY, DEXE, and ZKJ all showed the same pattern. This wasn’t a one-off incident.
Backtest returns of 62%, drawdown of 73%. I added just one stop-loss, cut the drawdown to 27%, and doubled returns
1. First, let’s see exactly how the money was lost
Over the past two weeks, I’ve been building a long-short strategy for crypto perpetuals, tested out of sample over 457 days with 10 million in simulated capital. The equity curve looks like a roller coaster, with both gains and losses wildly out of proportion.
I broke down and attributed the P&L for every coin on every day. The truth is highly concentrated. The drawdown didn’t happen gradually—it came from nine single-coin, single-day shocks. Eight losing trades added up to 8.73 million, more than the profits from the entire period. Five were shorts caught in vertical rallies; three were longs chasing parabolic moves. They were concentrated between September and November 2025, but the same pattern kept recurring in 2026. AKE, KAT, PLAY, DEXE, and ZKJ all showed the same pattern. This wasn’t a one-off incident.
Over the past two weeks, I’ve been building a long-short strategy for crypto perpetuals, tested out of sample over 457 days with 10 million in simulated capital. The equity curve looks like a roller coaster, with both gains and losses wildly out of proportion.
I broke down and attributed the P&L for every coin on every day. The truth is highly concentrated. The drawdown didn’t happen gradually—it came from nine single-coin, single-day shocks. Eight losing trades added up to 8.73 million, more than the profits from the entire period. Five were shorts caught in vertical rallies; three were longs chasing parabolic moves. They were concentrated between September and November 2025, but the same pattern kept recurring in 2026. AKE, KAT, PLAY, DEXE, and ZKJ all showed the same pattern. This wasn’t a one-off incident.
1.6k
·
--
$BTC
{spot}(BTCUSDT)
It briefly dipped below 80,000 before quickly bouncing back. Yesterday’s daily candle closed bullish, and the 80,000 support is still holding strong. This is a very good spot to add to your position.
$HYPE
{spot}(HYPEUSDT)
The $80 support is also very strong. Adding to your position between $76 and $80 is a good choice.
In a bull market, add to your position on daily-chart pullbacks, and use 3x leverage throughout the bull market!
$BTC
It briefly dipped below 80,000 before quickly bouncing back. Yesterday’s daily candle closed bullish, and the 80,000 support is still holding strong. This is a very good spot to add to your position.
$HYPE
The $80 support is also very strong. Adding to your position between $76 and $80 is a good choice.
In a bull market, add to your position on daily-chart pullbacks, and use 3x leverage throughout the bull market!
It briefly dipped below 80,000 before quickly bouncing back. Yesterday’s daily candle closed bullish, and the 80,000 support is still holding strong. This is a very good spot to add to your position.
$HYPE
The $80 support is also very strong. Adding to your position between $76 and $80 is a good choice.
In a bull market, add to your position on daily-chart pullbacks, and use 3x leverage throughout the bull market!
120
·
--
After reviewing 4,936 backtested trades, I found the real culprit behind the strategy’s 73% drawdown. It wasn’t BTC—the correlation with daily returns was only -0.02. It was seven trading days and seven small-cap coins. Those seven days lost 7.14 million, while the other 80-plus days netted 2.27 million. The root cause in a nutshell: a fixed 1 million position size combined with the wildest coins meant a single coin could wipe out 15% of the principal in one day. I’ve published the full post-mortem. Anyone trading futures should check they have a plan for when their strategy goes wrong. #量化选币 #中性策略 #量化交易
After reviewing 4,936 backtested trades, I found the real culprit behind the strategy’s 73% drawdown. It wasn’t BTC—the correlation with daily returns was only -0.02. It was seven trading days and seven small-cap coins. Those seven days lost 7.14 million, while the other 80-plus days netted 2.27 million. The root cause in a nutshell: a fixed 1 million position size combined with the wildest coins meant a single coin could wipe out 15% of the principal in one day. I’ve published the full post-mortem. Anyone trading futures should check they have a plan for when their strategy goes wrong. #量化选币 #中性策略 #量化交易
63
·
--
I went through 4,936 trade records: my market-neutral coin-selection strategy suffered a -73% drawdown—and the culprit wasn’t a market crashA crypto futures strategy with a total return of +62% over 15 months, but with a -73% maximum drawdown along the way: equity fell from a peak of 12.21 million to 3.25 million.
I initially thought BTC’s peak had dragged the strategy down. After breaking down all 4,936 trades one by one, the conclusion was surprising. The daily returns of the portfolio and BTC had a correlation of just -0.02. From the strategy’s peak on 9/6 to its deepest drawdown on 10/27, BTC actually gained 4% over the same period.
What really wrecked the account was seven trading days and seven obscure altcoins nobody had heard of. This article lays out every number.
When publishing, attach a trade-history card or a link to your live trading profile here. This is a backtest review; all data comes from Binance’s public historical archives and can be reproduced.
I went through 4,936 trade records: my market-neutral coin-selection strategy suffered a -73% drawdown—and the culprit wasn’t a market crash
A crypto futures strategy with a total return of +62% over 15 months, but with a -73% maximum drawdown along the way: equity fell from a peak of 12.21 million to 3.25 million.
I initially thought BTC’s peak had dragged the strategy down. After breaking down all 4,936 trades one by one, the conclusion was surprising. The daily returns of the portfolio and BTC had a correlation of just -0.02. From the strategy’s peak on 9/6 to its deepest drawdown on 10/27, BTC actually gained 4% over the same period.
What really wrecked the account was seven trading days and seven obscure altcoins nobody had heard of. This article lays out every number.
When publishing, attach a trade-history card or a link to your live trading profile here. This is a backtest review; all data comes from Binance’s public historical archives and can be reproduced.
I initially thought BTC’s peak had dragged the strategy down. After breaking down all 4,936 trades one by one, the conclusion was surprising. The daily returns of the portfolio and BTC had a correlation of just -0.02. From the strategy’s peak on 9/6 to its deepest drawdown on 10/27, BTC actually gained 4% over the same period.
What really wrecked the account was seven trading days and seven obscure altcoins nobody had heard of. This article lays out every number.
When publishing, attach a trade-history card or a link to your live trading profile here. This is a backtest review; all data comes from Binance’s public historical archives and can be reproduced.
332
·
--
BTC is holding very firmly around 80,000. After a high-volume drop on the 1-hour candle just now, it quickly rebounded and closed with a lower wick. If 80,000 holds, it should make a V-shaped recovery.
{future}(BTCUSDT)
BTC is holding very firmly around 80,000. After a high-volume drop on the 1-hour candle just now, it quickly rebounded and closed with a lower wick. If 80,000 holds, it should make a V-shaped recovery.
170
·
--
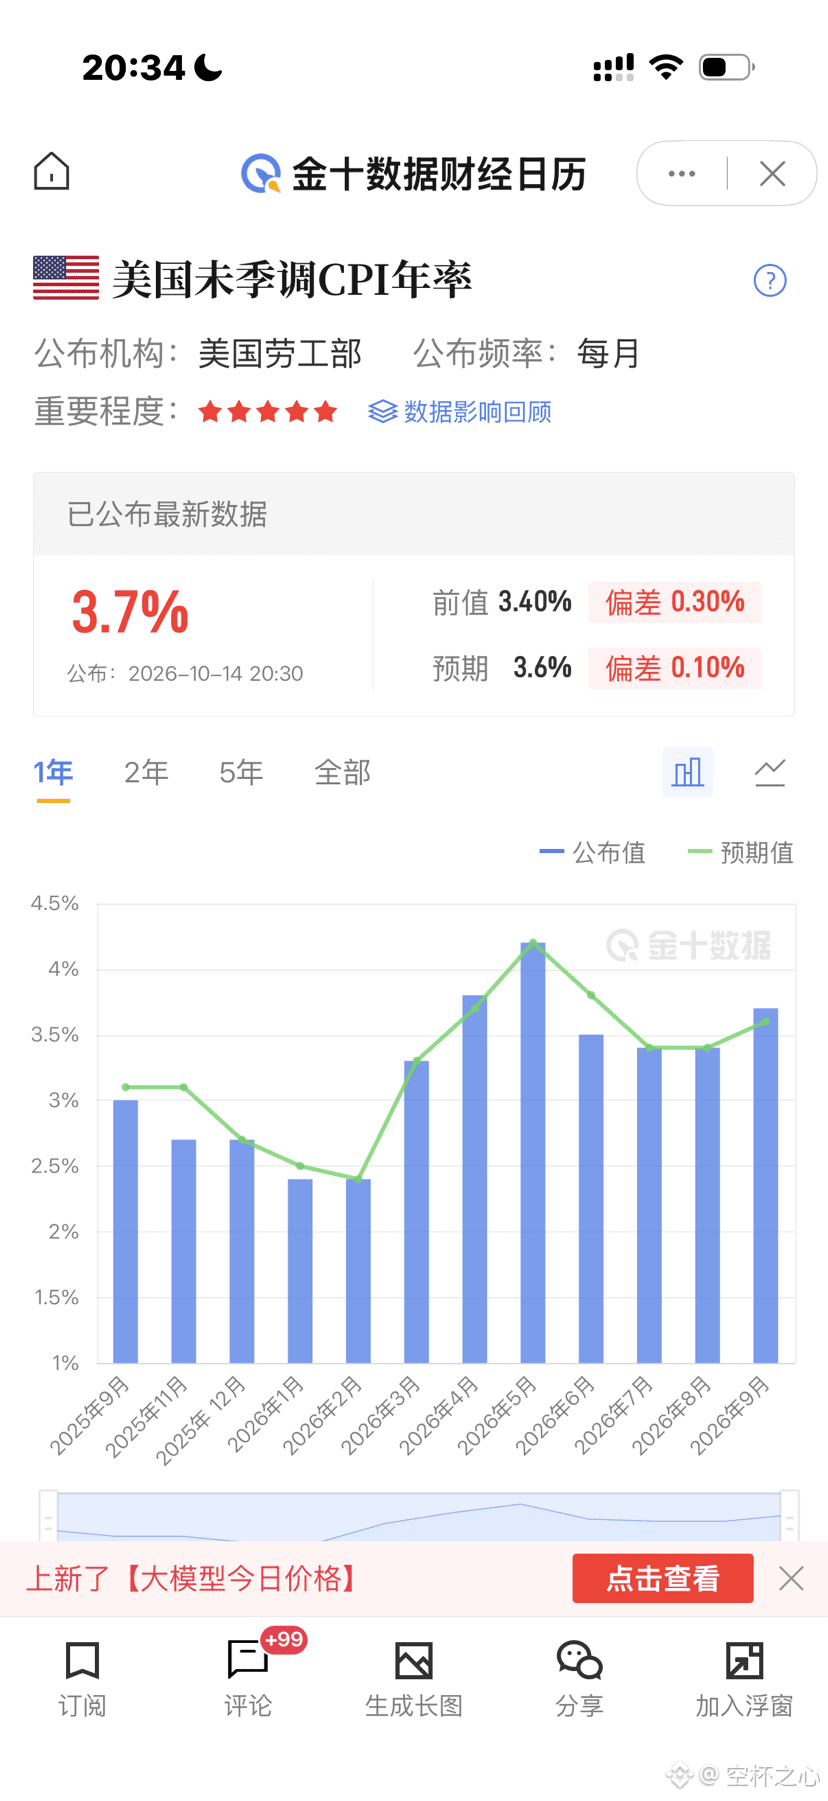
September CPI came in 0.1% higher than expected, pushing rate hike expectations up again, and BTC fell in response in the short term. Combined with Coinbase's recent sustained negative BTC premium and several major ETFs seeing net outflows for multiple consecutive days, this suggests the US market has been selling recently as it prices in rate hike expectations. However, BTC is still trading within the 82,000–84,000 range and hasn't entered a downtrend. Once the rate hike expectations have been mostly priced in, it will naturally rise. #BTC走势分析
September CPI came in 0.1% higher than expected, pushing rate hike expectations up again, and BTC fell in response in the short term. Combined with Coinbase's recent sustained negative BTC premium and several major ETFs seeing net outflows for multiple consecutive days, this suggests the US market has been selling recently as it prices in rate hike expectations. However, BTC is still trading within the 82,000–84,000 range and hasn't entered a downtrend. Once the rate hike expectations have been mostly priced in, it will naturally rise. #BTC走势分析
184
·
--
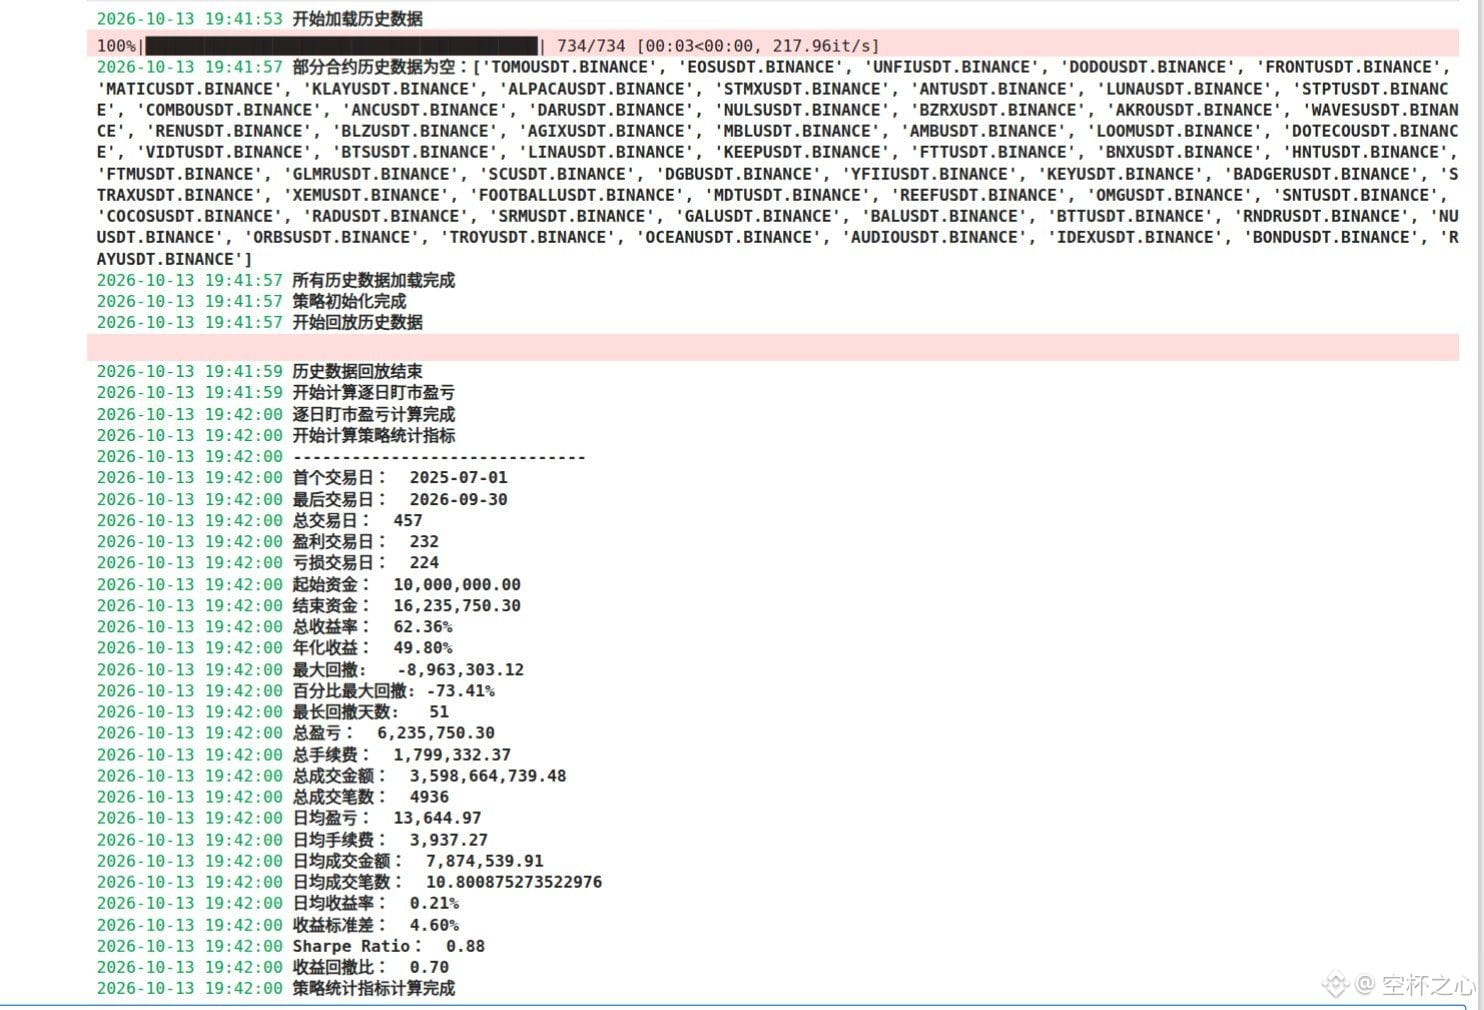
Yesterday I was tuning the backtest for a cross-sectional, multi-factor coin-selection strategy. When it finished, I took a look: return 0, Sharpe 0, maximum drawdown 0.
My first thought was that the strategy hadn’t traded at all.
Turns out the engine was playing dead: on 178 of the 457 days, the account balance was negative, triggering the liquidation protection and causing all the metrics to refuse to calculate.
Following that trail uncovered two bugs.
Bug #1: The minimum price increment was set to 0.01.
Order prices had to be rounded to that increment.
A lot of coins in the pool were priced below $0.005, so the limit price (closing price + 1%) rounded straight down to 0.
The result: buy orders priced at 0 would never fill, while sell orders would always fill. We couldn’t get into longs or close shorts, and the books went from roughly 50/50 to 3.7 longs versus 9.7 shorts—in other words, we were effectively naked short every day.
Before fixing it, I checked the data: the pool had 829 coins, prices needed up to 8 decimal places, and the cheapest trade was $0.0000034.
So I set the price increment to 1e-9 (9 decimal places), leaving an extra order of magnitude as a buffer.
After the change, the order fill rate went back to 100%, and there were no more orders with prices rounded to zero.
Bug #2: Leverage.
The strategy parameters were copied straight from a futures example, with a default notional exposure of 3x.
Crypto is volatile, and at 3x the account balance hovered around zero every day, constantly triggering the liquidation protection.
I lowered it to 1x, and it hasn’t happened since.
After fixing both issues, the backtest finally produced some numbers:
Total return over 15 months: +62%; annualized return: about 50%; Sharpe: 0.88.
But don’t get excited yet: maximum drawdown was -73%, and fees alone came to 1.8 million.
Plus, funding costs and liquidations still haven’t been modeled, so this only shows that the pipeline is working. We’re still a long way from “a strategy you can actually use.”
I also upgraded the model: changed the stock-selection label from “rank purely by return” to “rank by return ÷ volatility,” and changed training early stopping to monitor daily prediction correlation.
My biggest takeaway yesterday: the most time-consuming part isn’t writing the strategy—it’s realizing your own backtest has fooled you.
Today I’ll add funding costs and run it again. I’ll share the results 😤
#AIHarness投研工程 #量化交易员 #选币策略
Yesterday I was tuning the backtest for a cross-sectional, multi-factor coin-selection strategy. When it finished, I took a look: return 0, Sharpe 0, maximum drawdown 0.
My first thought was that the strategy hadn’t traded at all.
Turns out the engine was playing dead: on 178 of the 457 days, the account balance was negative, triggering the liquidation protection and causing all the metrics to refuse to calculate.
Following that trail uncovered two bugs.
Bug #1: The minimum price increment was set to 0.01.
Order prices had to be rounded to that increment.
A lot of coins in the pool were priced below $0.005, so the limit price (closing price + 1%) rounded straight down to 0.
The result: buy orders priced at 0 would never fill, while sell orders would always fill. We couldn’t get into longs or close shorts, and the books went from roughly 50/50 to 3.7 longs versus 9.7 shorts—in other words, we were effectively naked short every day.
Before fixing it, I checked the data: the pool had 829 coins, prices needed up to 8 decimal places, and the cheapest trade was $0.0000034.
So I set the price increment to 1e-9 (9 decimal places), leaving an extra order of magnitude as a buffer.
After the change, the order fill rate went back to 100%, and there were no more orders with prices rounded to zero.
Bug #2: Leverage.
The strategy parameters were copied straight from a futures example, with a default notional exposure of 3x.
Crypto is volatile, and at 3x the account balance hovered around zero every day, constantly triggering the liquidation protection.
I lowered it to 1x, and it hasn’t happened since.
After fixing both issues, the backtest finally produced some numbers:
Total return over 15 months: +62%; annualized return: about 50%; Sharpe: 0.88.
But don’t get excited yet: maximum drawdown was -73%, and fees alone came to 1.8 million.
Plus, funding costs and liquidations still haven’t been modeled, so this only shows that the pipeline is working. We’re still a long way from “a strategy you can actually use.”
I also upgraded the model: changed the stock-selection label from “rank purely by return” to “rank by return ÷ volatility,” and changed training early stopping to monitor daily prediction correlation.
My biggest takeaway yesterday: the most time-consuming part isn’t writing the strategy—it’s realizing your own backtest has fooled you.
Today I’ll add funding costs and run it again. I’ll share the results 😤
#AIHarness投研工程 #量化交易员 #选币策略
My first thought was that the strategy hadn’t traded at all.
Turns out the engine was playing dead: on 178 of the 457 days, the account balance was negative, triggering the liquidation protection and causing all the metrics to refuse to calculate.
Following that trail uncovered two bugs.
Bug #1: The minimum price increment was set to 0.01.
Order prices had to be rounded to that increment.
A lot of coins in the pool were priced below $0.005, so the limit price (closing price + 1%) rounded straight down to 0.
The result: buy orders priced at 0 would never fill, while sell orders would always fill. We couldn’t get into longs or close shorts, and the books went from roughly 50/50 to 3.7 longs versus 9.7 shorts—in other words, we were effectively naked short every day.
Before fixing it, I checked the data: the pool had 829 coins, prices needed up to 8 decimal places, and the cheapest trade was $0.0000034.
So I set the price increment to 1e-9 (9 decimal places), leaving an extra order of magnitude as a buffer.
After the change, the order fill rate went back to 100%, and there were no more orders with prices rounded to zero.
Bug #2: Leverage.
The strategy parameters were copied straight from a futures example, with a default notional exposure of 3x.
Crypto is volatile, and at 3x the account balance hovered around zero every day, constantly triggering the liquidation protection.
I lowered it to 1x, and it hasn’t happened since.
After fixing both issues, the backtest finally produced some numbers:
Total return over 15 months: +62%; annualized return: about 50%; Sharpe: 0.88.
But don’t get excited yet: maximum drawdown was -73%, and fees alone came to 1.8 million.
Plus, funding costs and liquidations still haven’t been modeled, so this only shows that the pipeline is working. We’re still a long way from “a strategy you can actually use.”
I also upgraded the model: changed the stock-selection label from “rank purely by return” to “rank by return ÷ volatility,” and changed training early stopping to monitor daily prediction correlation.
My biggest takeaway yesterday: the most time-consuming part isn’t writing the strategy—it’s realizing your own backtest has fooled you.
Today I’ll add funding costs and run it again. I’ll share the results 😤
#AIHarness投研工程 #量化交易员 #选币策略
162
·
--
After quite a bit of work, I adapted the research workflow I used for commodity futures to Binance perpetuals and put together a coin-selection strategy.
The approach is simple: every day, have the model rank a few hundred coins by expected gains and losses, then go long the top 5 and short the bottom 5. The model takes 96 price-and-volume indicators plus funding rates as input and predicts which coins will rise or fall over the next two days. The list of coins was reconstructed from the exchange’s official archives, including delisted coins. Otherwise, counting only coins that survived until today would just be fooling myself.
A few days ago, I finally finished my first full backtest.
Liquidated.
After taking a moment to recover, I went through the details and found that the liquidation actually made quite a bit of sense.
There’s no ceiling on how high crypto can rise. During the year or so covered by the backtest, several coins I had shorted doubled in a single day. The biggest gainer rose more than 3x. The most you can make on a short is 100%, but there’s no limit to how much you can lose—and my shorts were all caught in the middle of it.
Also, the model really likes shorting new coins. Nearly half the coins it thinks will fall have been listed for less than two months. But new coins often rally soon after listing, and the model kept getting burned by applying patterns from established coins to new ones.
What’s interesting is that the model’s rankings are useful and have some predictive power; it isn’t just guessing. But ranking accurately and making money are two different things, especially in a market where prices can surge dramatically, while a coin can only fall as far as zero.
In the next version, I’ll add risk controls for the short positions—at the very least, stop specifically shorting new coins.
Still early days. I’ll take it slowly. Just documenting this—don’t copy my trades. #选币策略 #AI #量化交易员
After quite a bit of work, I adapted the research workflow I used for commodity futures to Binance perpetuals and put together a coin-selection strategy.
The approach is simple: every day, have the model rank a few hundred coins by expected gains and losses, then go long the top 5 and short the bottom 5. The model takes 96 price-and-volume indicators plus funding rates as input and predicts which coins will rise or fall over the next two days. The list of coins was reconstructed from the exchange’s official archives, including delisted coins. Otherwise, counting only coins that survived until today would just be fooling myself.
A few days ago, I finally finished my first full backtest.
Liquidated.
After taking a moment to recover, I went through the details and found that the liquidation actually made quite a bit of sense.
There’s no ceiling on how high crypto can rise. During the year or so covered by the backtest, several coins I had shorted doubled in a single day. The biggest gainer rose more than 3x. The most you can make on a short is 100%, but there’s no limit to how much you can lose—and my shorts were all caught in the middle of it.
Also, the model really likes shorting new coins. Nearly half the coins it thinks will fall have been listed for less than two months. But new coins often rally soon after listing, and the model kept getting burned by applying patterns from established coins to new ones.
What’s interesting is that the model’s rankings are useful and have some predictive power; it isn’t just guessing. But ranking accurately and making money are two different things, especially in a market where prices can surge dramatically, while a coin can only fall as far as zero.
In the next version, I’ll add risk controls for the short positions—at the very least, stop specifically shorting new coins.
Still early days. I’ll take it slowly. Just documenting this—don’t copy my trades. #选币策略 #AI #量化交易员
The approach is simple: every day, have the model rank a few hundred coins by expected gains and losses, then go long the top 5 and short the bottom 5. The model takes 96 price-and-volume indicators plus funding rates as input and predicts which coins will rise or fall over the next two days. The list of coins was reconstructed from the exchange’s official archives, including delisted coins. Otherwise, counting only coins that survived until today would just be fooling myself.
A few days ago, I finally finished my first full backtest.
Liquidated.
After taking a moment to recover, I went through the details and found that the liquidation actually made quite a bit of sense.
There’s no ceiling on how high crypto can rise. During the year or so covered by the backtest, several coins I had shorted doubled in a single day. The biggest gainer rose more than 3x. The most you can make on a short is 100%, but there’s no limit to how much you can lose—and my shorts were all caught in the middle of it.
Also, the model really likes shorting new coins. Nearly half the coins it thinks will fall have been listed for less than two months. But new coins often rally soon after listing, and the model kept getting burned by applying patterns from established coins to new ones.
What’s interesting is that the model’s rankings are useful and have some predictive power; it isn’t just guessing. But ranking accurately and making money are two different things, especially in a market where prices can surge dramatically, while a coin can only fall as far as zero.
In the next version, I’ll add risk controls for the short positions—at the very least, stop specifically shorting new coins.
Still early days. I’ll take it slowly. Just documenting this—don’t copy my trades. #选币策略 #AI #量化交易员
1
265
Log in to explore more content
Join global crypto users on Binance Square
⚡️ Get latest and useful information about crypto.
💬 Trusted by the world’s largest crypto exchange.
👍 Discover real insights from verified creators.
Email / Phone number
Trending Topics
NvidiaBeatsEstimatesWith$130BQ4Outlook
52,752 views
273 Discussing
Nvidia Beats With $115.8 Billion in Revenue, Guides to $130 Billion and Adds $150 Billion Buyback
Binance News
·73 Likes
·48.4k views
AnthropicIPOPriceCouldExceed$80
53,785 views
233 Discussing
RussiaCentralBankAddsAlfaBankToCryptoExchangeRegister
3,034 views
43 Discussing