

At the end of the previous installment, I wrote that the next one would cover three things: add a buffer and stop-loss to the fused signal, run the validation period, and then do a walk-forward test.
This installment didn’t follow that order.
After extending the data through October 21, I ran all nine strategies on the new forward window and reorganized the drawdown profiles for the test period. The decision after the runs: keep only three of the nine, and delete the other six, along with their strategy files and backtest results.
The six that were deleted weren’t unprofitable. Five had test-period returns above +115%, and the top performer returned +152.67%. But their maximum drawdowns ranged from -21.8% to -54.8%, and the longest time underwater was 232 trading days. Curves like these may look fine in a backtest, but in a live account, most people wouldn’t be able to hold on until they recovered.
So this time, I'm starting by narrowing things down. Below, I'll explain four things: why the plan changed, the criteria used to cut strategies, what remains, and one issue that is still unresolved.
I. Why I Changed Last Issue's Plan First
Last issue delivered a “one-click reproducible directory of nine strategies”: nine strategy files, six signal files, and one notebook, with all 9/9 item-by-item reconciliations passing. The goal then was to make the numbers trustworthy, not to decide which strategy should be used.
That's where the problem lies. The directory presents all nine strategies side by side, making it easy for readers to assume they're all candidates. In reality, some had drawdowns around -50%, and their equity curves went half a year without reaching a new high. They remained in the directory because the task at the time was reproduction, not selection.
Continuing to add a stop-loss to the ensemble and run walk-forward tests in this state would mean adding features to a collection of strategies that aren't ready to use. The more features we layer on, the harder it will be to tell whether a problem comes from the signal, risk controls, or execution.
Another change is the data. Data for October 1 to 21 has arrived. This is the first period after the test period that wasn't involved in any selection. Although it's only 21 days, it's enough for a health check.
The order of work therefore changed: first screen using the test period's risk profile and cut down to three strategies; then use October for forward validation; only after that return to adding a stop-loss to the ensemble and running walk-forward tests. The number of strategies to maintain has gone from nine to three, which will actually make the work ahead faster.
We didn't run the validation period this time either. VALID was used for early stopping, so it can only be considered partially in-sample; in terms of cleanliness, it's inferior to these 21 days in October. Once the stop10 execution issue is resolved, I'll add the validation period and walk-forward tests together.
II. Two Calmar Calculations—Let's Get Them Straight
Last issue, the Calmar reported for the ensemble was 7.49; this issue's selection table says 9.38. Same strategy, two numbers—let me explain.
Both are correct; they use different calculations. 7.49 is annualized: the total return over 457 days is annualized using 365/457, then divided by maximum drawdown. 9.38 uses the full-period figure: the total return over 457 days is divided directly by maximum drawdown. Since the test period is longer than a year, annualizing reduces the numerator, so 7.49 is lower than 9.38.
The thresholds this issue use the full-period calculation, so 9.38 is the figure to compare with the threshold of 7. The three retained strategies have annualized Calmar ratios of 7.49, 6.43, and 6.33, respectively.
Whenever you see Calmar, first ask which calculation is being used. Comparing them indiscriminately can lead to the wrong strategy ranking.
III. Four Thresholds: Drawdown First, Then Returns
The screening uses only the test period, from July 1, 2025, to September 30, 2026: 457 days, with 10 million in starting capital. The four thresholds are:
- Maximum drawdown no greater than 20%
- Calmar (total return over the full period divided by maximum drawdown) of at least 7
- Ulcer index no greater than 8
- No more than 110 trading days underwater
Why these four? Drawdown determines whether you can stick with a strategy; Calmar considers returns and drawdown together; Ulcer measures not only the deepest drawdown but also how long it lasts and how often it recurs; underwater days are the most intuitive measure—how many days the account takes to recover after falling from a peak. All four metrics address the same question: Can a person stay the course with this equity curve?
Return ranking isn't one of the thresholds. The reason is simple: a strategy with high returns but a -50% drawdown usually won't survive long enough in live trading to realize those returns.
October's data isn't used for screening. With only 21 days, using it to choose strategies would be like making the referee a competitor. October is for validation, not selection.
One point needs to be stated honestly: I set these four thresholds after looking at the nine results. They are post hoc criteria, not rules written in advance. They help me make consistent trade-offs, but they are not proof in a statistical sense.
IV. Scorecard for the Nine Strategies
Ranked by Calmar, highest to lowest:
| Strategy | Return | Maximum drawdown | Calmar | Sharpe | Ulcer | Underwater days | Decision |
|---|---:|---:|---:|---:|---:|---:|---|
| Ensemble top5 | +172.93% | -18.44% | 9.38 | 2.076 | 7.59 | 107 | Keep |
| Model buf4 stop-loss 10 | +130.86% | -16.25% | 8.05 | 1.906 | 6.10 | 96 | Keep |
| Model long buf5 stop-loss 10 | +114.01% | -14.39% | 7.92 | 1.846 | 4.84 | 75 | Keep |
| mom10 top5 long buf5 | +152.67% | -30.13% | 5.07 | 1.577 | 13.48 | 171 | Eliminate |
| Model buf4 stop-loss 35 | +151.47% | -31.42% | 4.82 | 1.635 | 11.90 | 123 | Eliminate |
| mom10 top5 | +134.22% | -39.03% | 3.44 | 1.385 | 13.93 | 171 | Eliminate |
| mom10 top20 long buf5 | +68.98% | -21.81% | 3.16 | 1.563 | 6.92 | 109 | Eliminate |
| Model buf4 | +137.55% | -54.80% | 2.51 | 1.368 | 22.31 | 219 | Eliminate |
| Model long buf5 | +115.08% | -51.89% | 2.22 | 1.174 | 25.96 | 232 | Eliminate |
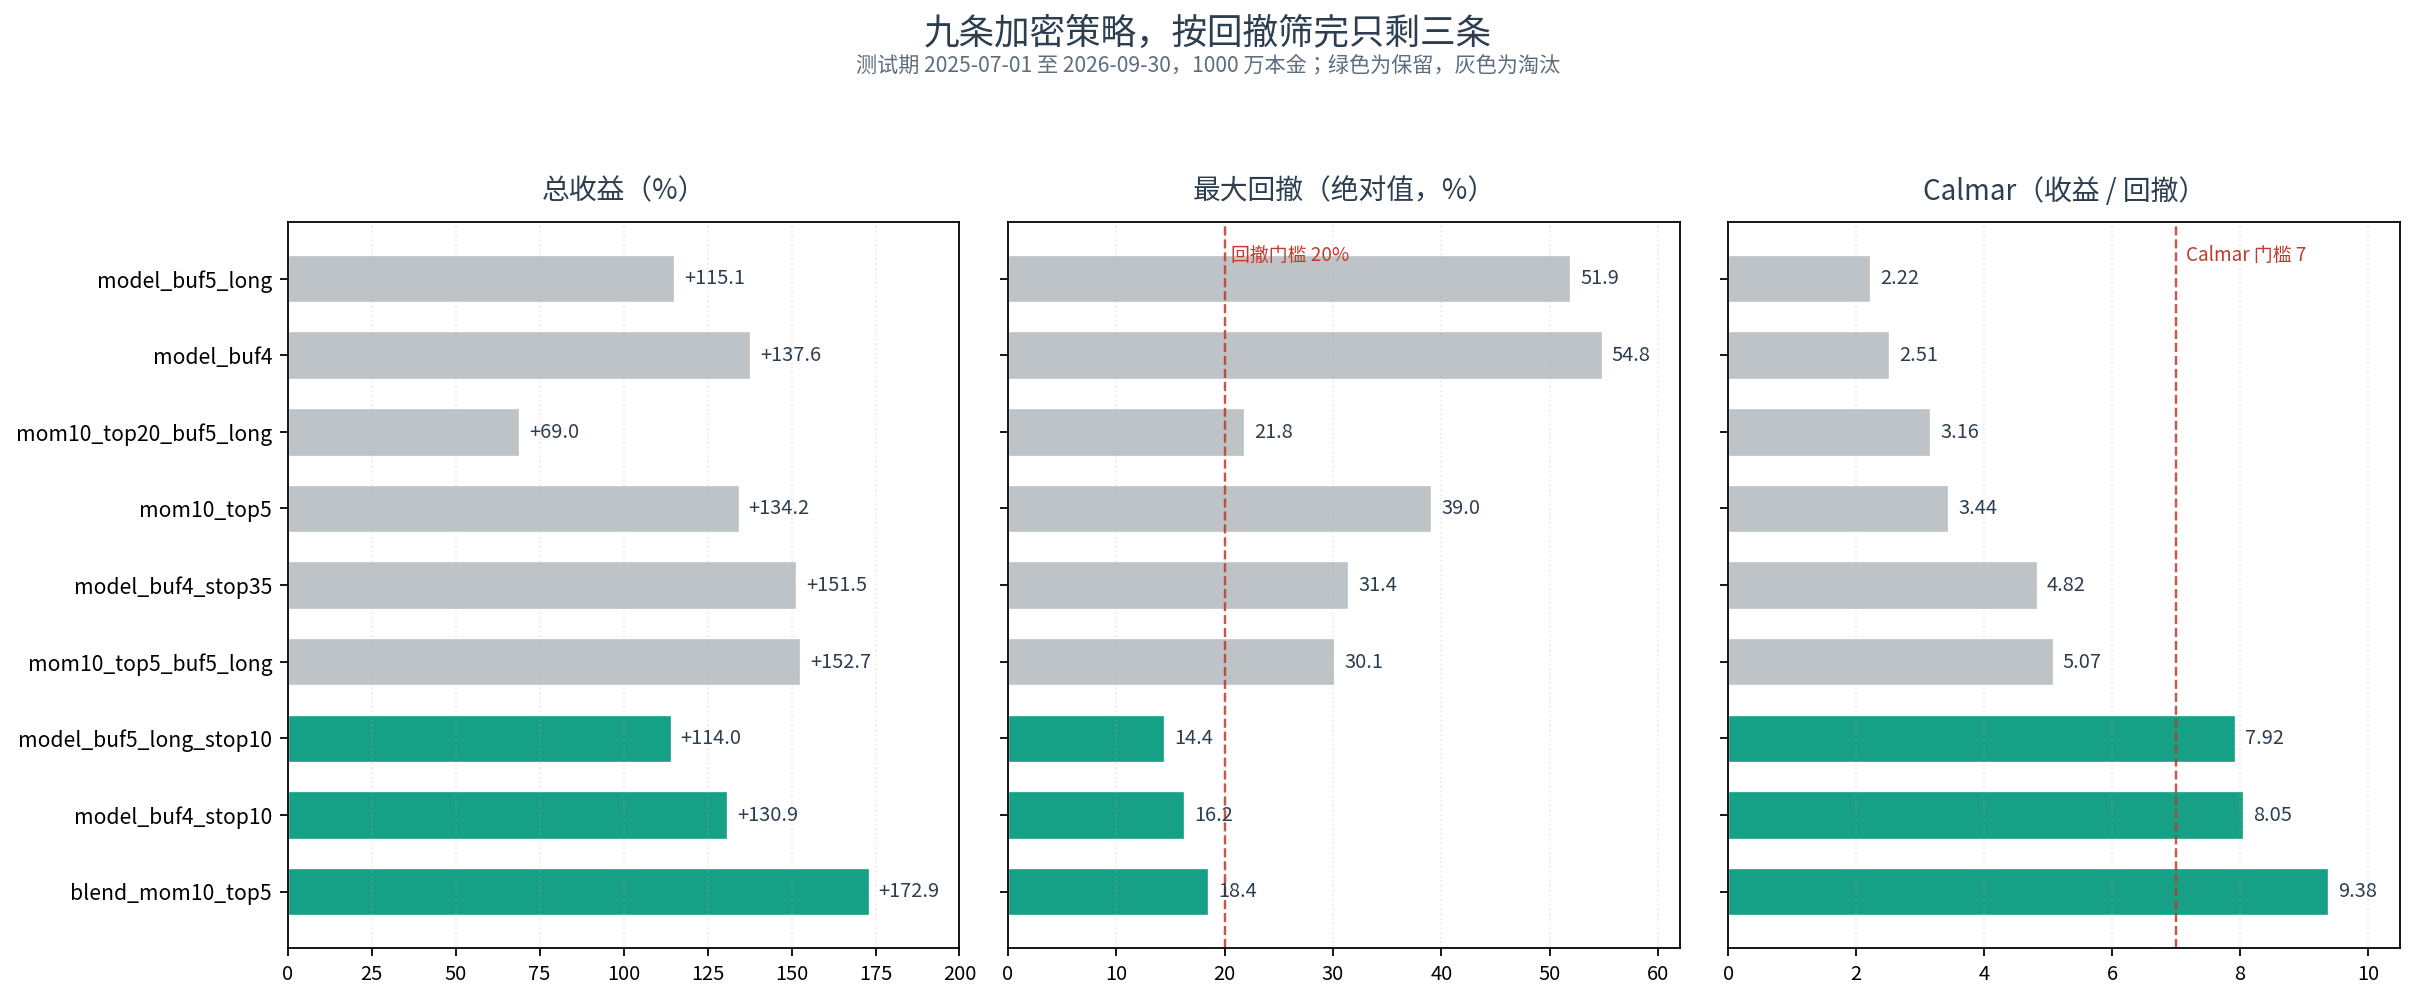
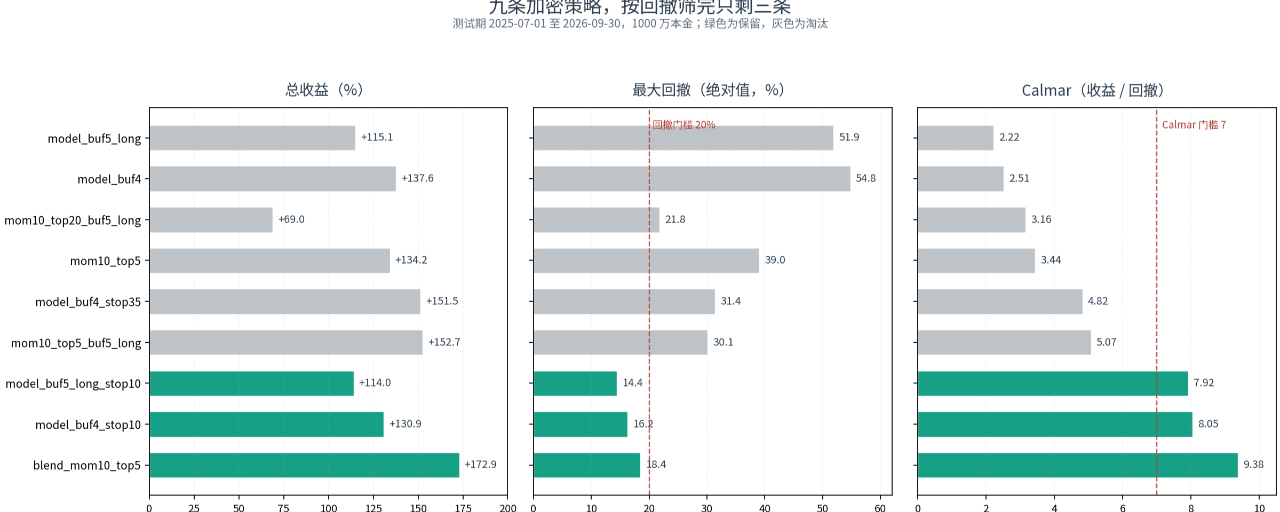
Figure 1: Returns on the left, maximum drawdown in the middle, and Calmar on the right. Green means keep; gray means eliminate. The dashed lines mark the thresholds of 20% drawdown and Calmar 7.
The dividing line is clear. All three retained strategies have a Calmar above 7.9, an Ulcer no higher than 7.6, and no more than 107 underwater days. Among the six eliminated strategies, the highest Calmar is 5.07 and the lowest Ulcer is 6.92.
Note the mom10 top20 strategy. Its drawdown is -21.81%, only 1.8 percentage points beyond the threshold; its Ulcer is 6.92, below 8; and it was underwater for 109 days, just within the 110-day limit. Looking only at those three metrics, it comes close to qualifying. But its Calmar is just 3.16: returns have been diluted too much, so it still doesn't make the cut.
V. Why the Six Strategies Were Cut
Let's go through them one by one.
Model buf4, +137.55%, drawdown -54.80%. This is the version with model signals and a two-sided buffer4. The buffer turned returns from negative to +137%, but drawdown remained at -54.80%; adjusting the buffer level barely changed the drawdown. This strategy best illustrates why buffer alone can't serve as risk control: it improves turnover and ranking stability, but can't contain the tail risk.
Model long buf5, +115.08%, drawdown -51.89%. Setting the long-side buffer to 5, with no buffer on the short side, shifted the drawdown only from -54.80% to -51.89%. Its Ulcer of 25.96 and 232 underwater days were both the worst among the nine strategies.
Model buf4 stop-loss 35, +151.47%, drawdown -31.42%. It ranks third in returns, so it might sound like a keeper. But its drawdown exceeds 30%, its Calmar is 4.82, and it spent 123 days underwater. A 35% stop-loss on a single coin is far too loose for an asset as volatile as crypto; by the time it triggers, the loss is already substantial.
mom10 top5 long buf5, +152.67%, drawdown -30.13%. This was the second-highest-returning strategy of the nine, and the top earner among the six that were cut. The problem is the same: 30% drawdown and 171 underwater days. Second place in returns still isn't enough to pass the drawdown test.
mom10 top5, +134.22%, drawdown -39.03%. Pure momentum top5, with no buffer and no stop-loss. Momentum factors naturally have heavy tails; the worst single day was -13.10%.
mom10 top20 long buf5, +68.98%, drawdown -21.81%. This had the shallowest drawdown among the six eliminated strategies. But its Calmar was only 3.16, with returns diluted by half. It demonstrates a different point: spreading positions more thinly doesn't make a strategy better; it just makes it smaller.
VI. Three Takeaways
First, stop-losses are the primary lever for controlling drawdown; buffers aren't.
Using the same family of model signals, I fixed the symmetric buffer at 4 and ran three comparisons. No additions: +137.55% return, -54.80% drawdown. Add a 35% single-coin stop-loss: +151.47% return, -31.42% drawdown. Add a 10% single-coin stop-loss: +130.86% return, -16.25% drawdown. Then switch the buffer to 5 for longs and 0 for shorts, with no stop-loss: drawdown is -51.89%, barely changed.
Put the four curves together and the conclusion is unambiguous. To reduce drawdown, add a stop-loss first; buffers mainly manage turnover and ranking stability, and can't contain tail risk.
Second, fewer triggers don't mean less risk.
The 35% stop-loss triggered 121 times during the test period, compared with 646 triggers for the 10% stop-loss. The 35% stop may look less demanding, but drawdown was -31.42% versus -16.25%. The reason is simple: it triggers less often because each position must lose 35% before being cut, so each loss is larger; it triggers more often when the threshold is 10%, but each loss is smaller. To evaluate a stop-loss, don't just count triggers. Consider the loss per trigger multiplied by how many times it might trigger consecutively during a period of stress.
First estimate how many consecutive triggers could occur during a period of stress, then set the threshold. A 10% stop cuts losses early; a 35% stop is more like a psychological stop-loss—it lets you tell yourself, “I've set a stop,” but by the time it triggers, the account has already taken a serious hit.
Third, diversification only scales everything down proportionally; it doesn't improve risk-adjusted efficiency.
Switching mom10 top5 to top20 and adding a long-side buffer of 5 lowered annualized volatility from 63.1% to 29.6% and drawdown from -39.03% to -21.81%. It looks like risk was cut in half. But returns fell from 134.22% to 68.98%, and Calmar dropped from 3.44 to 3.16. Returns and risk both shrank, but efficiency got worse.
If the goal is to reduce risk, simply lowering leverage is cleaner. Diversification is useful for addressing “too much exposure to a single coin,” but not as a tool for improving Sharpe.
There's another, more basic lesson: return rankings can mislead. Ranked by returns, stop35 comes third and mom10 long buf5 comes second, so both would seem worth keeping. Ranked by Calmar and drawdown, neither even passes the thresholds. When choosing a strategy, first ask whether you can stick with it; then ask how much it can earn.
VII. The Three Retained Strategies Represent Three Risk Levels
| Strategy | Role | Return | Maximum drawdown | Calmar | Sharpe | Ulcer | Underwater days |
|---|---|---:|---:|---:|---:|---:|---:|
| Ensemble top5 | Highest returns, no stop-loss | +172.93% | -18.44% | 9.38 | 2.076 | 7.59 | 107 |
| Model buf4 stop-loss 10 | Balanced return and drawdown | +130.86% | -16.25% | 8.05 | 1.906 | 6.10 | 96 |
| Model long buf5 stop-loss 10 | Lowest drawdown, smoothest curve | +114.01% | -14.39% | 7.92 | 1.846 | 4.84 | 75 |
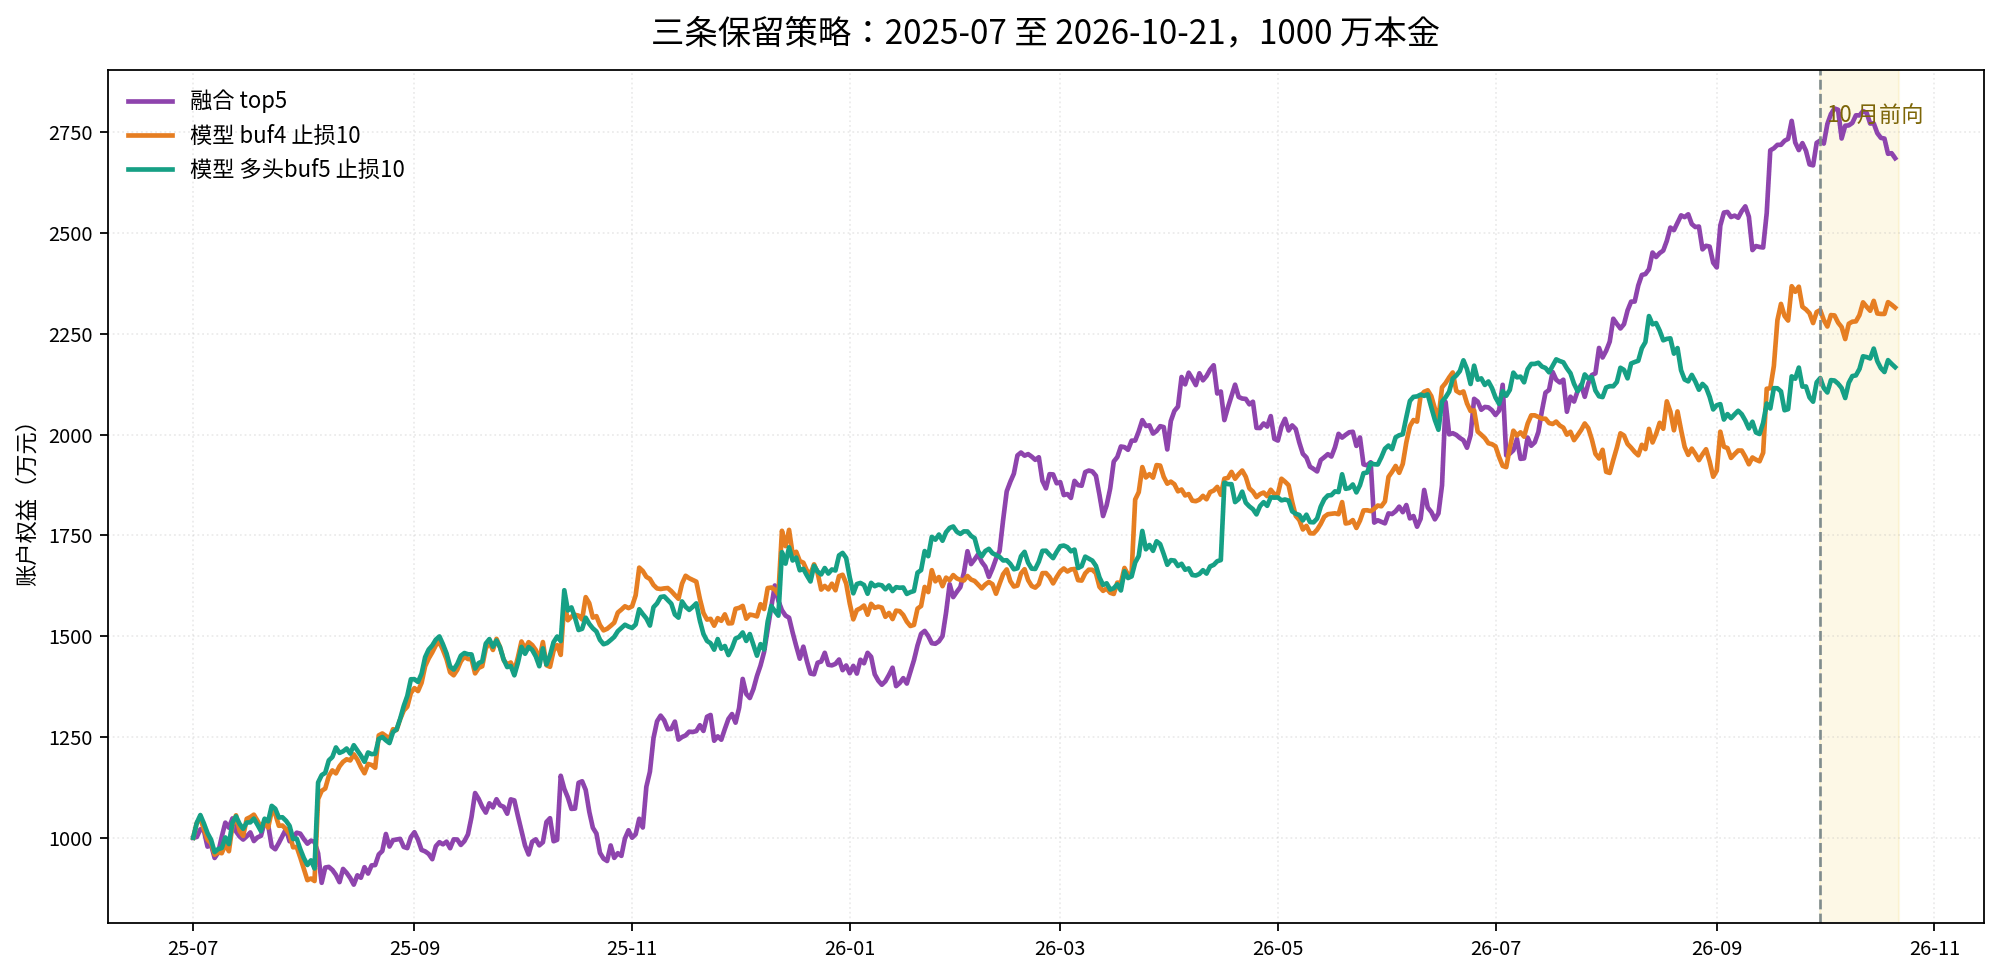
Figure 2: Results for the three strategies from July 2025 through October 21, 2026, with 10 million in starting capital. The period to the right of the dashed line is the October forward test.
These aren't “the three best strategies of the same kind.” They represent three different risk levels.
Ensemble top5 has the highest returns and the best risk-adjusted performance, but it has no stop-loss. In October's down month, it had the deepest drawdown of the three, for that very reason. Last issue, I said I would add a stop-loss to the ensemble; I didn't do it this time. I'll explain why later.
Model buf4 stop-loss 10 is the middle-risk option. It combines a two-sided buffer4 with a 10% single-coin stop-loss, balancing returns and drawdown.
Model long buf5 stop-loss 10 is the defensive option. It uses a long-side buffer of 5, no buffer on the short side, and a 10% stop-loss. It has the lowest drawdown, an Ulcer of 4.84, only 75 underwater days, and the smoothest curve—but also the lowest returns.
If you can choose only one, consider your capital and drawdown tolerance. If you can withstand a -20% drawdown and want returns, choose the ensemble; for a smoother ride, choose long buf5 stop-loss 10; for something in between, choose buf4 stop-loss 10. This is a trade-off, not a ranking.
## VIII. October Forward Test: Stop-Losses Made a Difference on Forward Data for the First Time
The model is frozen. After retraining, `best_iteration` remained 290, and the maximum difference between predictions for the test segment and the file published last issue was 0.0. October's signals were not retuned.
From October 1 to 21, the 122-contract signal pool, equally weighted, fell 8.57%; the median decline was 9.82%. $BTC rose 0.57%, $ETH fell 7.89%, and $SOL fell 9.45%. Altcoins broadly declined while BTC traded sideways.
Results for the three strategies:
| Strategy | October P&L | vs. 9/30 equity | vs. 10 million | Maximum drawdown | Stop-loss triggers | Long/short |
|---|---:|---:|---:|---:|---:|---:|
| Model long buf5 stop-loss 10 | +271,000 | +1.26% | +2.71% | -2.63% | 24 | +255,000 / +15,000 |
| Model buf4 stop-loss 10 | +61,000 | +0.27% | +0.61% | -3.11% | 22 | +61,000 / +1,000 |
| Ensemble top5 | -439,000 | -1.61% | -4.39% | -4.39% | 0 | -537,000 / +98,000 |
Two return measures are shown. Returns versus 9/30 equity are included because the strategies had compounded during the test period, leaving their equity between 21.4 million and 27.29 million. Returns versus 10 million are included because each strategy's order size was kept at 10 million rather than compounded with equity. The former is the account's actual rate of return; the latter is closer to the strategy's underlying earning power. Don't annualize the 21-day figures proportionally.
In a down month, both stop10 strategies held on to positive returns. The ensemble had no stop-loss; its long leg lost 537,000, with a worst day of -712,000, and those losses flowed directly into net asset value. That's the direct reason the three strategies diverged, and the first time stop-losses have demonstrated their value on forward data.
But 21 days is too short to say anything about the long run. And this positive result has several caveats that need to be stripped away.
First, returns were highly concentrated. The two stop10 strategies had substantial overlap in their holdings. GTC alone made 603,000, MAGMA made 229,000, and AKE made 201,000. Buf4's best day made 379,000, or 21.9% of all positive returns; its three best days accounted for 56.9%. The daily win rate was just 38.1%, and the median daily loss was 11,000. In other words, positive returns came from a few big up days and a few contracts; they can't be extrapolated as “average daily earnings.”
Second, positions weren't fully deployed. Each strategy had one dead position among its 10 slots: the two stop10 strategies had a short in OMNI, and the ensemble had a short in VANRY. After these contracts were delisted, the positions were never closed, tying up 1 million in notional exposure without generating P&L. The two model strategies averaged only 6.47 to 6.57 million in active notional exposure during October, while the ensemble averaged 9.97 million. The stop10 strategies made positive returns with only about 65% of their capital deployed. This is a known issue with the backtest engine, not a result of this data update, and has been added to the list of fixes.
Third, funding fees aren't included in the main backtest. Estimated after the fact from end-of-day positions, the ensemble received 72,000, while the two stop10 strategies each paid 88,000 to 89,000—less than one percentage point of 10 million in either case. The direction is clear, but these aren't precise cost estimates.
Fourth, a strong IC doesn't mean the model can profit from tail moves. The forward 20-day mean IC was 0.0760, positive on 90% of trading days, and at the 91.1st percentile of the rolling test-period window. But when the same scores were used to rank raw two-day returns, the October cross-section wasn't monotonic: using the strategies' actual coin-selection rules, the top-five p5 longs averaged -3.59% over two days, the bottom-five p0 shorts -0.49%, and the long-short spread was -3.10%, with a t-statistic of -2.07. The model ranks a volatility-normalized two-day return label, which isn't the same as predicting raw-return tails. The October p5 long tail was mainly dragged down by the crashes on October 4 and October 19; buffers, stop-losses, the short leg, and a handful of winners pulled the strategy results back up. The tail-risk diagnosis covers only 19 signal days, too short a sample to conclude more than “keep observing.” It doesn't justify concluding that the model has failed, much less increasing leverage.
## IX. The Most Uncomfortable Result: 2% Stop-Loss Slippage
The backtest assumes stop-loss orders execute near the stop price. I reran it with 2% stop-loss slippage:
| Strategy | Baseline P&L | P&L with 2% slippage | Baseline equity return | Equity return with 2% slippage | Baseline drawdown | Drawdown with 2% slippage |
|---|---:|---:|---:|---:|---:|---:|
| Model buf4 stop-loss 10 | +61,000 | -385,000 | +0.27% | -3.80% | -3.11% | -8.85% |
| Model long buf5 stop-loss 10 | +271,000 | -219,000 | +1.26% | -2.65% | -2.63% | -7.93% |
The positive returns disappear entirely.
The result can be explained arithmetically. Each stop-loss trigger corresponds to a 1 million position, so 2% slippage costs 20,000 per trigger. With 22 to 24 triggers in October, that's a total of 440,000 to 480,000—enough to turn +61,000 and +271,000 into losses.
Conversely, this shows that stop10's returns don't come from “picking coins more accurately,” but from “cutting losses early.” If execution quality deteriorates, that advantage disappears quickly.
2% is a stress test, not a prediction. Actual slippage could be lower or higher, depending on the coin's liquidity, the type of stop order, and market conditions at the time. But until it's validated against real order books and trading volumes, the stop10 strategies' positive returns exist only on paper.
That's also why I didn't add a stop-loss to the ensemble this issue. As noted last issue, stop-loss strategies currently support only p5/p0 coin selection; ensemble selection requires extracting the score interface first. More importantly, if stop10 execution quality hasn't been validated, applying the same execution-dependent stop-loss to the ensemble would just replicate the same problem. Fix execution first, then add features.
X. Cleanup, Limitations, and Next Issue
The files and backtest results for the six strategies have been deleted: 6 strategy .py files, 6 test-period backtests, 6 October backtests, and 6 backtest results from the root directory—24 files in total. Before deletion, they were backed up to the temporary directory `/tmp/eliminated_strategies_2026-10-22/`, which will be lost if the machine restarts. The long-term record is `策略筛选记录.md` in the repository. Daily equity parquet files were not backed up separately.
Why not keep them? Because files left behind continue to exist as “candidate strategies.” Two weeks later, it's easy to see nine strategies and start tuning one that has already proved its drawdown is too high. Deletion is a governance measure, not tidiness for its own sake.
Other cleanup done at the same time: the notebook was cut from nine strategies to three and rerun successfully; the test-period and forward summaries now each have 3 rows; the October detail CSV also has 3 rows; the report was rewritten for the three-strategy version; and the selection log records the elimination figures and reasons for each strategy.
The limitations also need to be clear. The selection criteria were set post hoc; the test period was already used for parameter selection, so the 457 days aren't a clean out-of-sample sample; October covers only 21 days; the main backtest uses daily data and excludes funding fees, liquidation, margin, and real slippage; and stop-losses are an approximation based on daily data, applied after the fact. These limitations don't disappear just because the results look good.
Next issue, I'll work through three things in order. First, address stop10 execution quality: real order books, tiered slippage, and stop-order types, with at least a credible slippage range. Second, fix the dead-position issue and rerun October to see how the results change once effective exposure is restored. Third, return to adding a stop-loss to the ensemble and running walk-forward tests. If stop10 execution quality doesn't pass muster, the retained strategies from both models will need to be redesigned; they can't rely on backtest stop prices to survive. There's also a possible false positive in the exclusion list to review: GRAM was excluded by a static non-crypto list, but it's actually a crypto perpetual.
This article is a backtesting research log, not a trading signal or investment advice. This quantitative lab will continue to share its work, from data and factors to risk controls. If you find it useful, feel free to bookmark it. See you next issue.