
Eman098
3.2k Posts

Eman098
Report
Block User
KITE-497168
High-Frequency Trader
2.8 Years
674 Following
9.9K+ Followers
10.6K+ Liked
Posts
All
Quotes
Live
PINNED
·
--
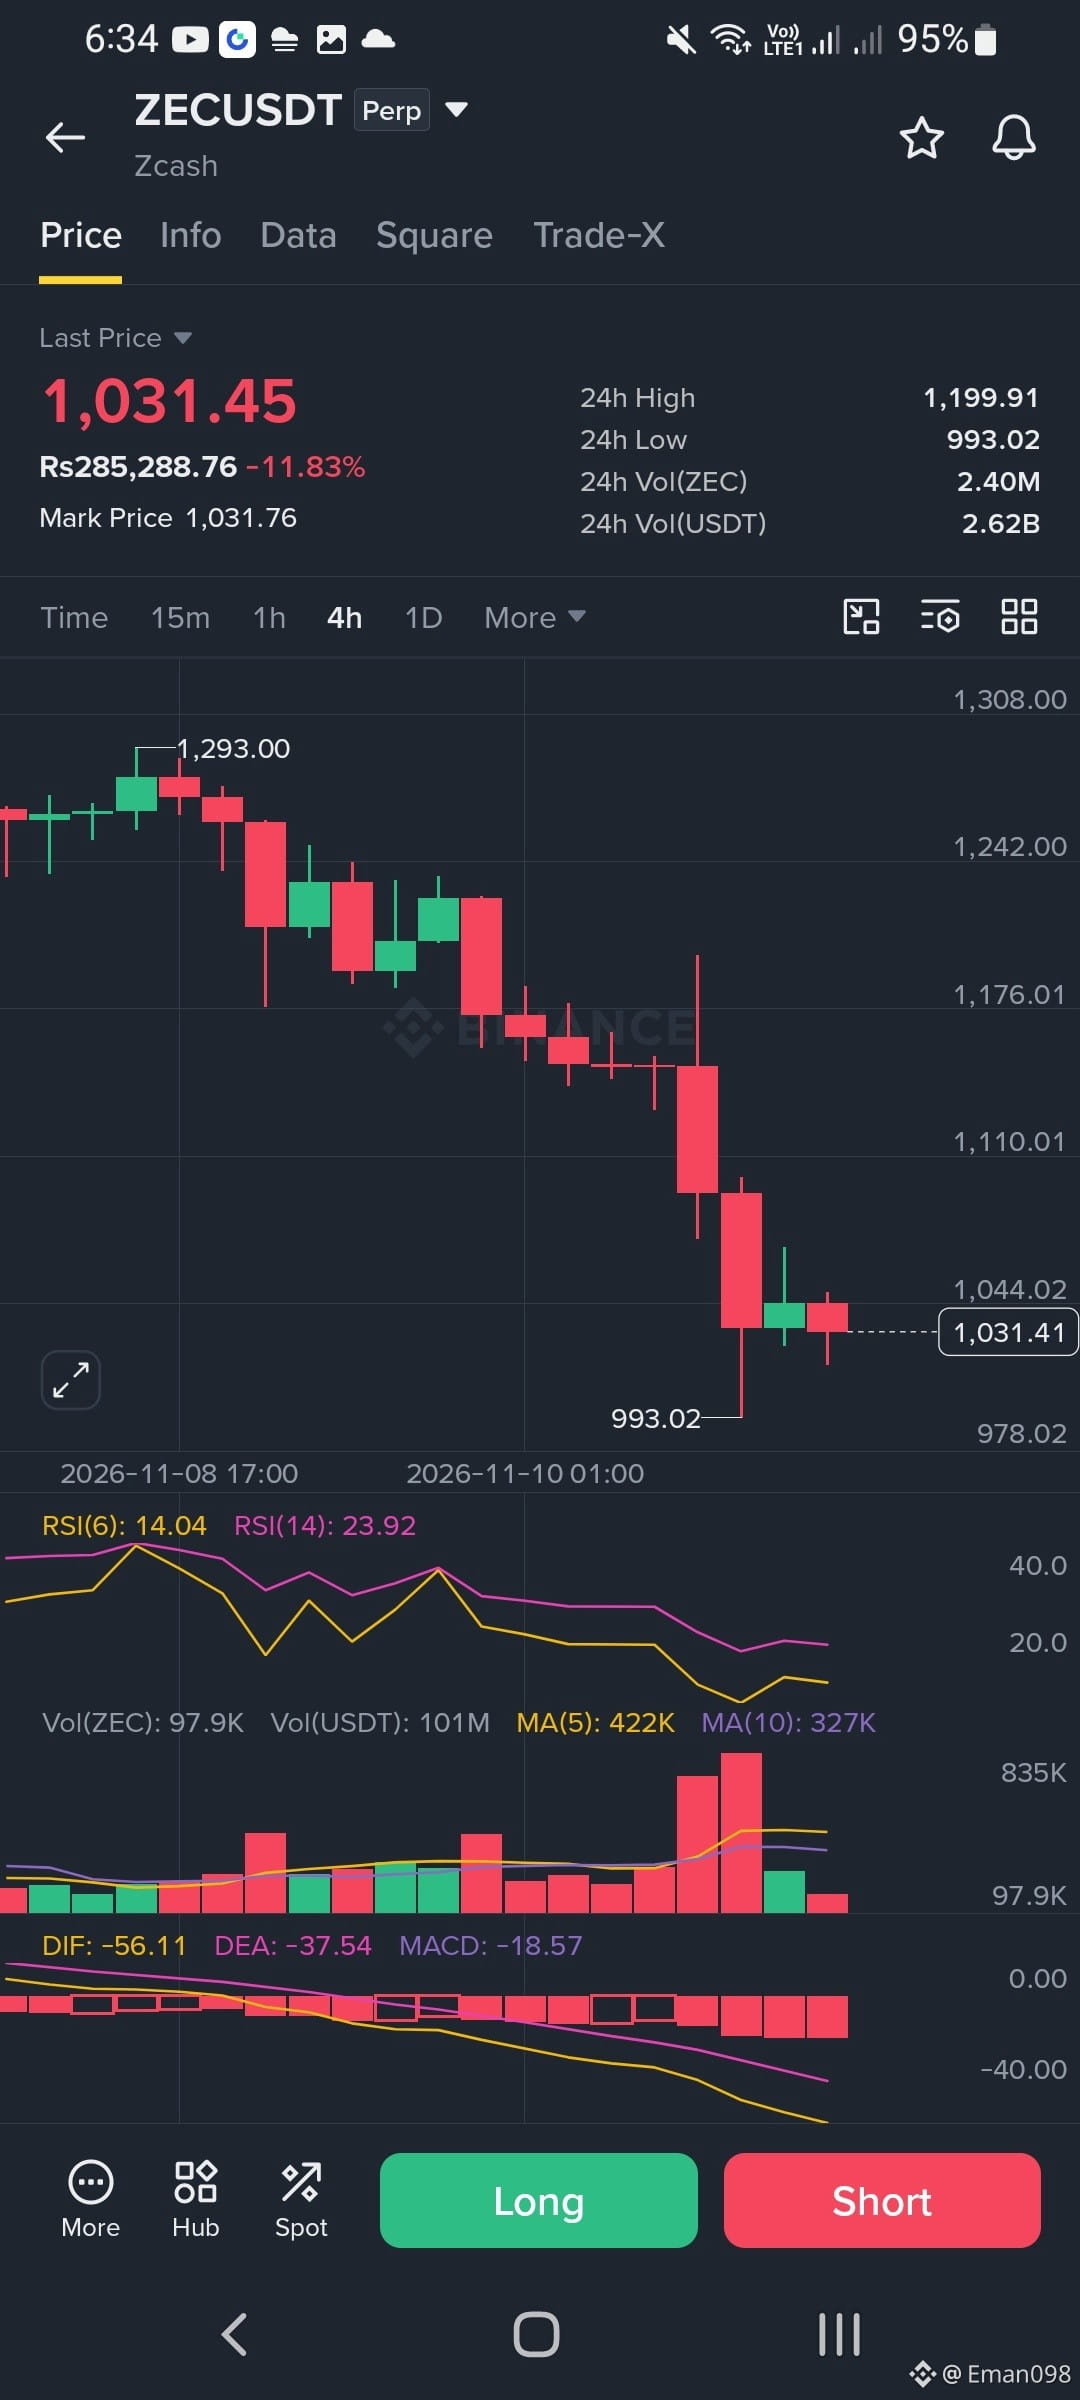
$ZEC Down 11.83% in 24h: Is the Dump Over or Just Starting? 👀
ZEC is bleeding hard on the 4H chart. Price is around 1,031, sitting near the day's low after a sharp drop from 1,199 (24h high). Sellers are in control for now.
🔹 RSI:
RSI(6) is at 14.04 and RSI(14) at 23.92. Both are deep in oversold territory. This means a bounce is possible, but oversold can stay oversold in a strong downtrend.
🔹 MACD:
DIF (-56.11) is below DEA (-37.54), and the histogram is red and getting bigger. Bearish momentum is still active with no bullish cross yet.
🔹 Volume:
The big red candles came with heavy volume, which shows real selling pressure. The latest candles have lower volume, so panic may be slowing down, but buyers haven't stepped in strongly yet.
🔹 Price action:
Lower highs and lower lows since the 1,293 top. The drop to 993 got bought up with a long wick, but the bounce is weak and small. No clear reversal candle yet.
Key Levels
- Support: 993 (24h low), then 978
- Resistance: 1,044, then 1,110, and 1,176 as a bigger zone
My Plan 🎯
I'm not catching this falling knife. I'll wait for confirmation first: a 4H candle closing above 1,044 with rising volume or a clean hold above 993 with a higher low. If price breaks below 993 and holds under it I'll stay out and let it settle. Patience is better than guessing the bottom.
⚠️ Risk Warning:
Futures are high risk and leverage can wipe out your account fast. After an 11%+ drop volatility is extreme. Use a stop loss, keep position size small and never risk more than you can afford to lose.
💬 Are you buying this dip or waiting for confirmation? Drop your levels below 👇
#Zcash #ZECUSDT #BinanceSquare #Futures
#TechnicalAnalysis
Not financial advice.$ZEC
{future}(ZECUSDT)
$ZEC Down 11.83% in 24h: Is the Dump Over or Just Starting? 👀
ZEC is bleeding hard on the 4H chart. Price is around 1,031, sitting near the day's low after a sharp drop from 1,199 (24h high). Sellers are in control for now.
🔹 RSI:
RSI(6) is at 14.04 and RSI(14) at 23.92. Both are deep in oversold territory. This means a bounce is possible, but oversold can stay oversold in a strong downtrend.
🔹 MACD:
DIF (-56.11) is below DEA (-37.54), and the histogram is red and getting bigger. Bearish momentum is still active with no bullish cross yet.
🔹 Volume:
The big red candles came with heavy volume, which shows real selling pressure. The latest candles have lower volume, so panic may be slowing down, but buyers haven't stepped in strongly yet.
🔹 Price action:
Lower highs and lower lows since the 1,293 top. The drop to 993 got bought up with a long wick, but the bounce is weak and small. No clear reversal candle yet.
Key Levels
- Support: 993 (24h low), then 978
- Resistance: 1,044, then 1,110, and 1,176 as a bigger zone
My Plan 🎯
I'm not catching this falling knife. I'll wait for confirmation first: a 4H candle closing above 1,044 with rising volume or a clean hold above 993 with a higher low. If price breaks below 993 and holds under it I'll stay out and let it settle. Patience is better than guessing the bottom.
⚠️ Risk Warning:
Futures are high risk and leverage can wipe out your account fast. After an 11%+ drop volatility is extreme. Use a stop loss, keep position size small and never risk more than you can afford to lose.
💬 Are you buying this dip or waiting for confirmation? Drop your levels below 👇
#Zcash #ZECUSDT #BinanceSquare #Futures
#TechnicalAnalysis
Not financial advice.$ZEC
ZEC is bleeding hard on the 4H chart. Price is around 1,031, sitting near the day's low after a sharp drop from 1,199 (24h high). Sellers are in control for now.
🔹 RSI:
RSI(6) is at 14.04 and RSI(14) at 23.92. Both are deep in oversold territory. This means a bounce is possible, but oversold can stay oversold in a strong downtrend.
🔹 MACD:
DIF (-56.11) is below DEA (-37.54), and the histogram is red and getting bigger. Bearish momentum is still active with no bullish cross yet.
🔹 Volume:
The big red candles came with heavy volume, which shows real selling pressure. The latest candles have lower volume, so panic may be slowing down, but buyers haven't stepped in strongly yet.
🔹 Price action:
Lower highs and lower lows since the 1,293 top. The drop to 993 got bought up with a long wick, but the bounce is weak and small. No clear reversal candle yet.
Key Levels
- Support: 993 (24h low), then 978
- Resistance: 1,044, then 1,110, and 1,176 as a bigger zone
My Plan 🎯
I'm not catching this falling knife. I'll wait for confirmation first: a 4H candle closing above 1,044 with rising volume or a clean hold above 993 with a higher low. If price breaks below 993 and holds under it I'll stay out and let it settle. Patience is better than guessing the bottom.
⚠️ Risk Warning:
Futures are high risk and leverage can wipe out your account fast. After an 11%+ drop volatility is extreme. Use a stop loss, keep position size small and never risk more than you can afford to lose.
💬 Are you buying this dip or waiting for confirmation? Drop your levels below 👇
#Zcash #ZECUSDT #BinanceSquare #Futures
#TechnicalAnalysis
Not financial advice.$ZEC
2
716
·
--
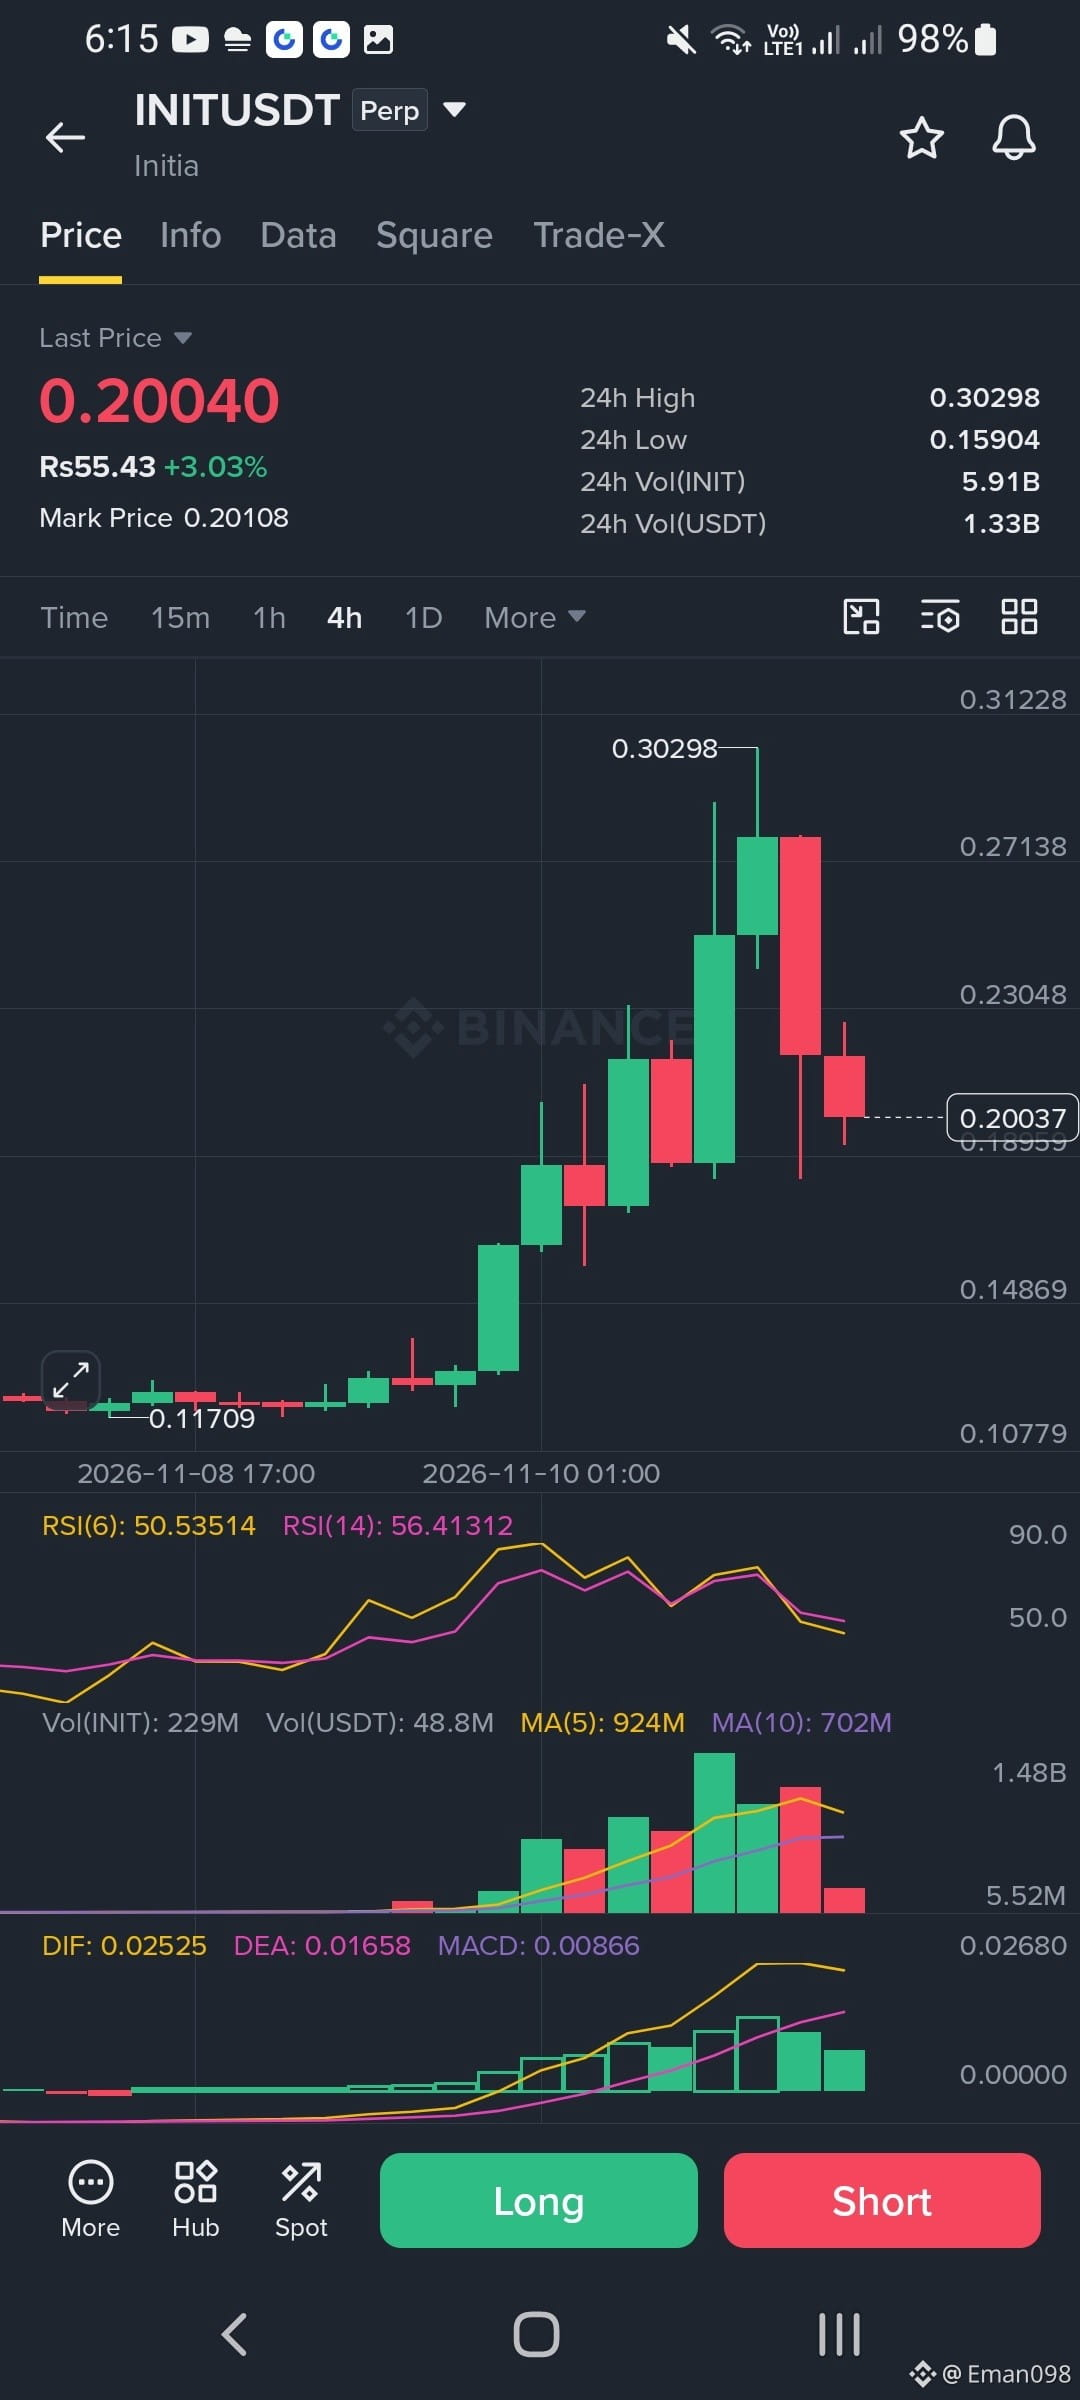
INIT looks like it is cooling off after a big pump. Price ran from about 0.117 to a high of 0.303 and has since dropped back to 0.200. The last two red candles show sellers taking control, and volume is fading, which tells me the buyers are getting tired.
RSI sits near 50, so the heat is gone and there is room to move either way. MACD is still above zero, but the bars are shrinking, which means momentum is slowing down.
Best levels to watch:
Support 1 is 0.190, where price may bounce.
Support 2 is 0.159, the 24h low and a strong floor.
Support 3 is 0.148, the next solid zone below.
Resistance 1 is 0.230, the first hurdle on any bounce.
Resistance 2 is 0.271, a heavy selling area.
Resistance 3 is 0.303, the top of the pump.
If price holds 0.190, a bounce to 0.230 is possible. If it breaks below 0.190 on a 4h close, expect a drop toward 0.159. I would wait for a clear candle before entering. This is not financial advice, so use a small size and a stop loss.
$INIT
{future}(INITUSDT)
INIT looks like it is cooling off after a big pump. Price ran from about 0.117 to a high of 0.303 and has since dropped back to 0.200. The last two red candles show sellers taking control, and volume is fading, which tells me the buyers are getting tired.
RSI sits near 50, so the heat is gone and there is room to move either way. MACD is still above zero, but the bars are shrinking, which means momentum is slowing down.
Best levels to watch:
Support 1 is 0.190, where price may bounce.
Support 2 is 0.159, the 24h low and a strong floor.
Support 3 is 0.148, the next solid zone below.
Resistance 1 is 0.230, the first hurdle on any bounce.
Resistance 2 is 0.271, a heavy selling area.
Resistance 3 is 0.303, the top of the pump.
If price holds 0.190, a bounce to 0.230 is possible. If it breaks below 0.190 on a 4h close, expect a drop toward 0.159. I would wait for a clear candle before entering. This is not financial advice, so use a small size and a stop loss.
$INIT
RSI sits near 50, so the heat is gone and there is room to move either way. MACD is still above zero, but the bars are shrinking, which means momentum is slowing down.
Best levels to watch:
Support 1 is 0.190, where price may bounce.
Support 2 is 0.159, the 24h low and a strong floor.
Support 3 is 0.148, the next solid zone below.
Resistance 1 is 0.230, the first hurdle on any bounce.
Resistance 2 is 0.271, a heavy selling area.
Resistance 3 is 0.303, the top of the pump.
If price holds 0.190, a bounce to 0.230 is possible. If it breaks below 0.190 on a 4h close, expect a drop toward 0.159. I would wait for a clear candle before entering. This is not financial advice, so use a small size and a stop loss.
$INIT
1
627
·
--
Bearish
$JCT : 33% Dump in 24h. Capitulation or Just the Start? 📉
JCT fell from 0.011768 to 0.005320 in a single day, almost a straight line of red 1h candles. Here is how I'm reading it:
🔹 RSI(6) at 28: oversold and curling up, which suggests selling exhaustion, not a confirmed reversal
🔹 MACD: still below zero, but the histogram is shrinking, so bearish momentum is fading
🔹 Volume: spiked on the dump, now drying up
🔹 Price action: small candles with long wicks around 0.0053–0.0060, so sellers are losing steam
Levels I'm watching:
Support: 0.005320 (a close below means continuation)
Resistance: 0.006416, then 0.007835
My plan: I'm not catching the falling knife. I wait for a higher low or a 1h close above 0.0064 before considering a long. If 0.0053 breaks I stay out.
⚠️ After a 33% move volatility is extreme. Small size fixed stop and never risk more than you can afford to lose.
What's your read: bounce or more downside?
👇
#BinanceLiveFutures #JCT #Futures #TradingAnalysis
Not financial advice.
$JCT : 33% Dump in 24h. Capitulation or Just the Start? 📉
JCT fell from 0.011768 to 0.005320 in a single day, almost a straight line of red 1h candles. Here is how I'm reading it:
🔹 RSI(6) at 28: oversold and curling up, which suggests selling exhaustion, not a confirmed reversal
🔹 MACD: still below zero, but the histogram is shrinking, so bearish momentum is fading
🔹 Volume: spiked on the dump, now drying up
🔹 Price action: small candles with long wicks around 0.0053–0.0060, so sellers are losing steam
Levels I'm watching:
Support: 0.005320 (a close below means continuation)
Resistance: 0.006416, then 0.007835
My plan: I'm not catching the falling knife. I wait for a higher low or a 1h close above 0.0064 before considering a long. If 0.0053 breaks I stay out.
⚠️ After a 33% move volatility is extreme. Small size fixed stop and never risk more than you can afford to lose.
What's your read: bounce or more downside?
👇
#BinanceLiveFutures #JCT #Futures #TradingAnalysis
Not financial advice.
JCT fell from 0.011768 to 0.005320 in a single day, almost a straight line of red 1h candles. Here is how I'm reading it:
🔹 RSI(6) at 28: oversold and curling up, which suggests selling exhaustion, not a confirmed reversal
🔹 MACD: still below zero, but the histogram is shrinking, so bearish momentum is fading
🔹 Volume: spiked on the dump, now drying up
🔹 Price action: small candles with long wicks around 0.0053–0.0060, so sellers are losing steam
Levels I'm watching:
Support: 0.005320 (a close below means continuation)
Resistance: 0.006416, then 0.007835
My plan: I'm not catching the falling knife. I wait for a higher low or a 1h close above 0.0064 before considering a long. If 0.0053 breaks I stay out.
⚠️ After a 33% move volatility is extreme. Small size fixed stop and never risk more than you can afford to lose.
What's your read: bounce or more downside?
👇
#BinanceLiveFutures #JCT #Futures #TradingAnalysis
Not financial advice.
2
466
·
--
$HOT
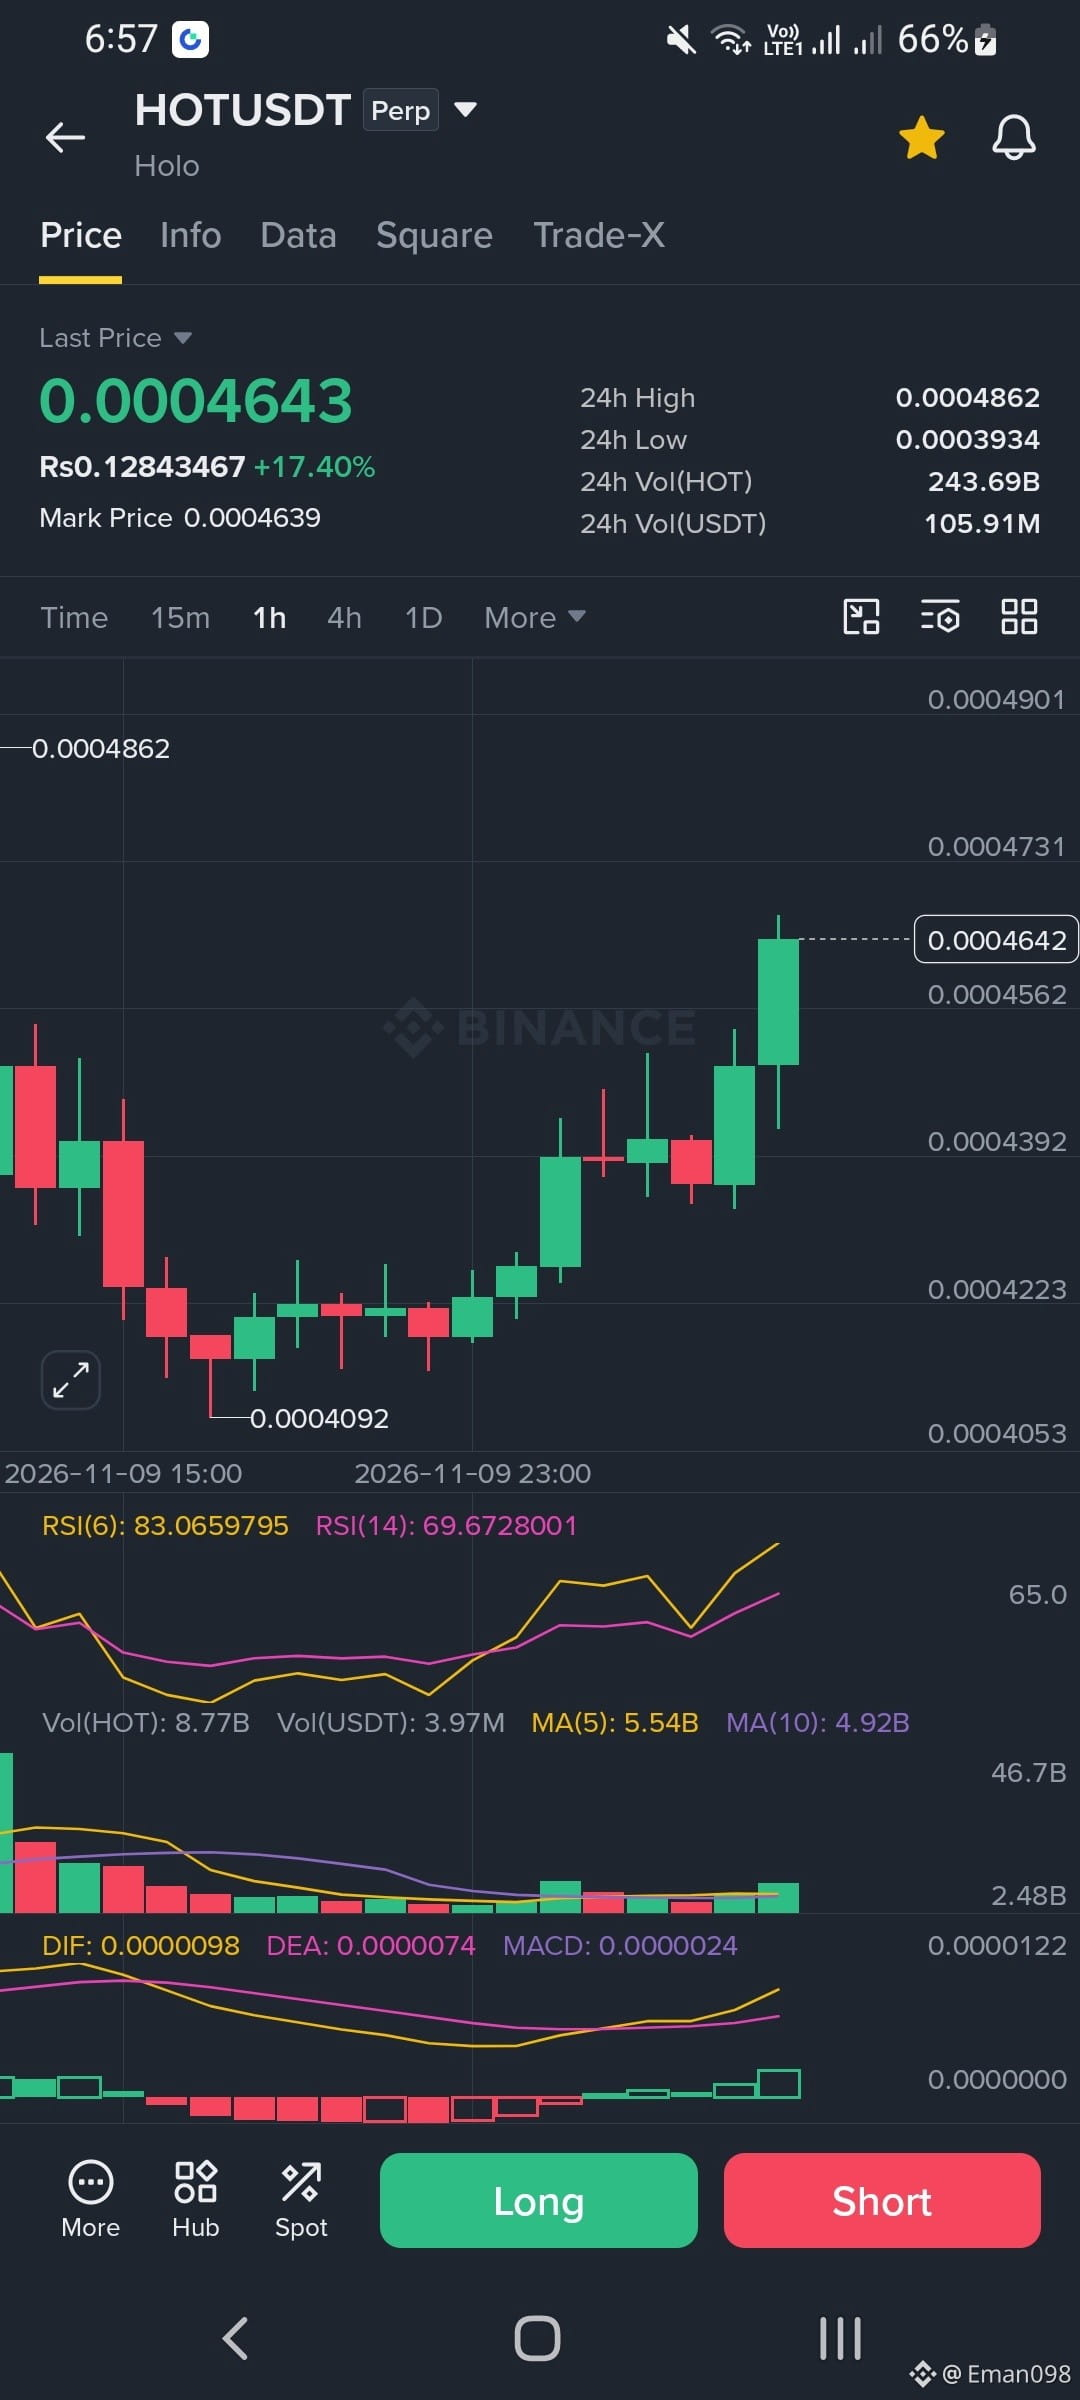
is bouncing hard right now. Price sits near 0.000464 and it is up 17 percent on the day. The last few green candles are strong and the 1h chart shows a clean recovery from the low at 0.000409. MACD just flipped bullish and volume is picking up a little. But RSI(6) is above 83 so the move looks stretched. A small pullback would not surprise me.
Support levels
First support is 0.000456. Next is 0.000439 where price broke out earlier. The big one is 0.000409 which is the recent low.
Resistance levels
First resistance is 0.000473. Then 0.000486 which is the 24h high. A close above that opens the way higher.
My view is simple. Trend is up but do not chase this candle. Wait for a dip to support or a clean break above the high. Keep your stop tight. This is not financial advice. Stay safe.
#CPITestsDecemberRateOutlook #AIChipSlumpNasdaq #PriceActionAnalysis
$HOT
is bouncing hard right now. Price sits near 0.000464 and it is up 17 percent on the day. The last few green candles are strong and the 1h chart shows a clean recovery from the low at 0.000409. MACD just flipped bullish and volume is picking up a little. But RSI(6) is above 83 so the move looks stretched. A small pullback would not surprise me.
Support levels
First support is 0.000456. Next is 0.000439 where price broke out earlier. The big one is 0.000409 which is the recent low.
Resistance levels
First resistance is 0.000473. Then 0.000486 which is the 24h high. A close above that opens the way higher.
My view is simple. Trend is up but do not chase this candle. Wait for a dip to support or a clean break above the high. Keep your stop tight. This is not financial advice. Stay safe.
#CPITestsDecemberRateOutlook #AIChipSlumpNasdaq #PriceActionAnalysis
is bouncing hard right now. Price sits near 0.000464 and it is up 17 percent on the day. The last few green candles are strong and the 1h chart shows a clean recovery from the low at 0.000409. MACD just flipped bullish and volume is picking up a little. But RSI(6) is above 83 so the move looks stretched. A small pullback would not surprise me.
Support levels
First support is 0.000456. Next is 0.000439 where price broke out earlier. The big one is 0.000409 which is the recent low.
Resistance levels
First resistance is 0.000473. Then 0.000486 which is the 24h high. A close above that opens the way higher.
My view is simple. Trend is up but do not chase this candle. Wait for a dip to support or a clean break above the high. Keep your stop tight. This is not financial advice. Stay safe.
#CPITestsDecemberRateOutlook #AIChipSlumpNasdaq #PriceActionAnalysis
3
222
·
--
JCT is cooling off after that wild pump. Price sits near 0.0098 and the last candle is red again. Buyers look tired because volume keeps dropping and the MACD bars get smaller every candle. RSI is slipping too which tells me momentum is fading.
Support levels
First support is 0.0095. If that breaks the next stop is 0.0074 which is the 24h low. Below that the big one is 0.0057.
Resistance levels
First resistance is 0.0105. Then 0.0124 which is the 24h high. Only a strong close above 0.0124 makes the bulls look serious.
My view is simple. Price is weak but not broken yet. Wait for a clear break or a bounce at support. Keep your stop tight because this coin moves fast. This is not financial advice. Stay safe.
$JCT
JCT is cooling off after that wild pump. Price sits near 0.0098 and the last candle is red again. Buyers look tired because volume keeps dropping and the MACD bars get smaller every candle. RSI is slipping too which tells me momentum is fading.
Support levels
First support is 0.0095. If that breaks the next stop is 0.0074 which is the 24h low. Below that the big one is 0.0057.
Resistance levels
First resistance is 0.0105. Then 0.0124 which is the 24h high. Only a strong close above 0.0124 makes the bulls look serious.
My view is simple. Price is weak but not broken yet. Wait for a clear break or a bounce at support. Keep your stop tight because this coin moves fast. This is not financial advice. Stay safe.
$JCT
Support levels
First support is 0.0095. If that breaks the next stop is 0.0074 which is the 24h low. Below that the big one is 0.0057.
Resistance levels
First resistance is 0.0105. Then 0.0124 which is the 24h high. Only a strong close above 0.0124 makes the bulls look serious.
My view is simple. Price is weak but not broken yet. Wait for a clear break or a bounce at support. Keep your stop tight because this coin moves fast. This is not financial advice. Stay safe.
$JCT
2
3
826
·
--
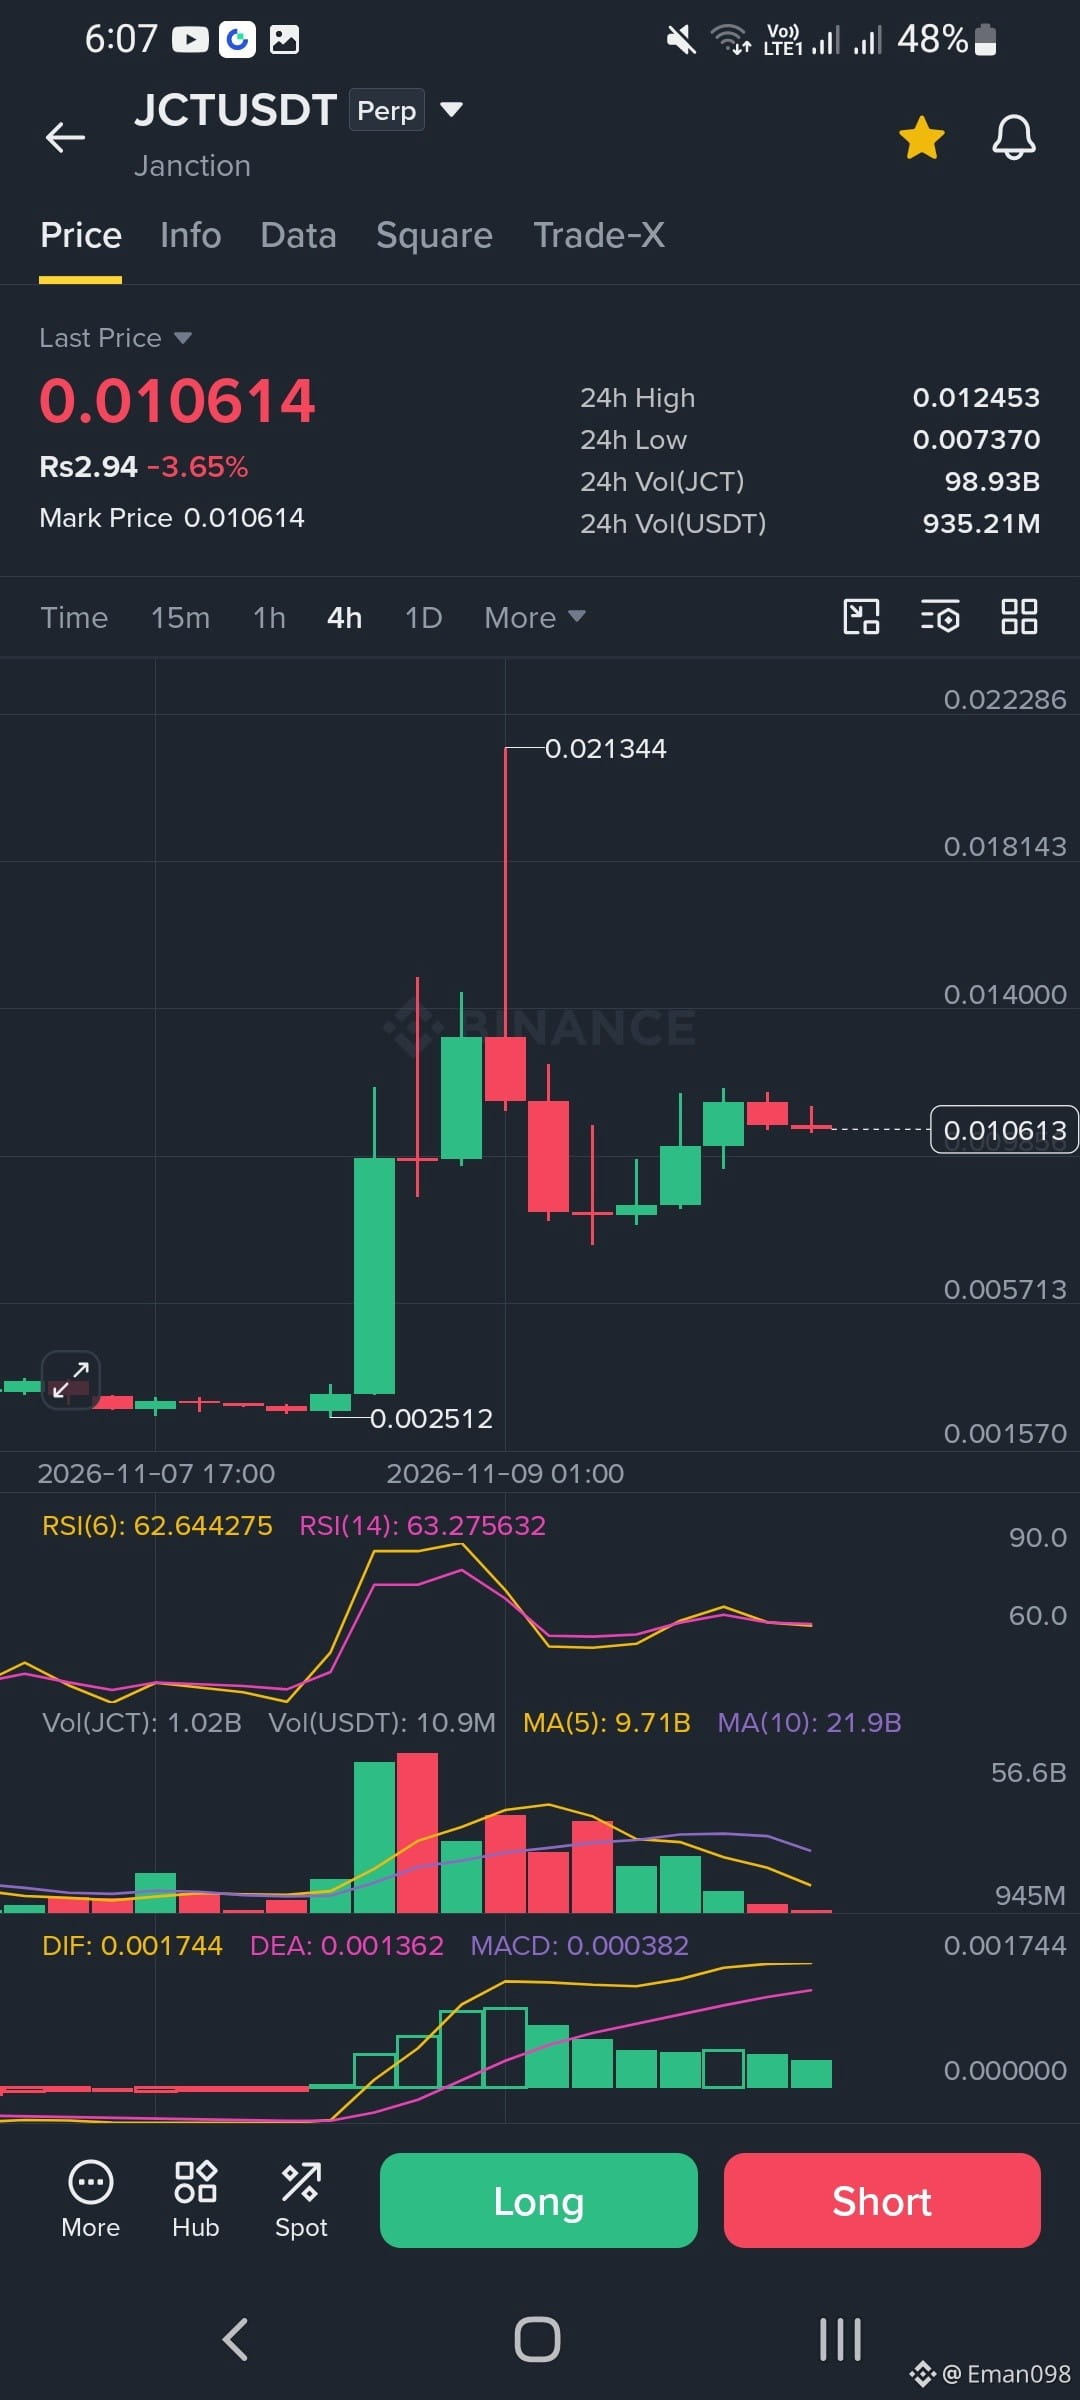
JCT is in a wild spot right now. It sat quiet near 0.0025 for days, then exploded to a high of 0.021344 and is now at 0.008775. That is a gain of over 215 percent in one day, so the move is very stretched and risky.
The last two 4h candles are red. Price dropped hard from the top, and a long wick shows sellers rejected the spike. RSI is cooling from near 80 down to about 57, which means momentum is fading. Volume was huge on the pump and is now shrinking.
Best levels to watch:
Support 1: 0.0057
Support 2: 0.0025
Resistance 1: 0.0098
Resistance 2: 0.0140
Resistance 3: 0.0213
If price holds above 0.0087 and reclaims 0.0098, buyers may return. A break below 0.0057 could send it back toward the old base.
This is not financial advice. Use a small size and a strict stop loss because pumped coins can fall very fast.
JCT is in a wild spot right now. It sat quiet near 0.0025 for days, then exploded to a high of 0.021344 and is now at 0.008775. That is a gain of over 215 percent in one day, so the move is very stretched and risky.
The last two 4h candles are red. Price dropped hard from the top, and a long wick shows sellers rejected the spike. RSI is cooling from near 80 down to about 57, which means momentum is fading. Volume was huge on the pump and is now shrinking.
Best levels to watch:
Support 1: 0.0057
Support 2: 0.0025
Resistance 1: 0.0098
Resistance 2: 0.0140
Resistance 3: 0.0213
If price holds above 0.0087 and reclaims 0.0098, buyers may return. A break below 0.0057 could send it back toward the old base.
This is not financial advice. Use a small size and a strict stop loss because pumped coins can fall very fast.
The last two 4h candles are red. Price dropped hard from the top, and a long wick shows sellers rejected the spike. RSI is cooling from near 80 down to about 57, which means momentum is fading. Volume was huge on the pump and is now shrinking.
Best levels to watch:
Support 1: 0.0057
Support 2: 0.0025
Resistance 1: 0.0098
Resistance 2: 0.0140
Resistance 3: 0.0213
If price holds above 0.0087 and reclaims 0.0098, buyers may return. A break below 0.0057 could send it back toward the old base.
This is not financial advice. Use a small size and a strict stop loss because pumped coins can fall very fast.
2
638
·
--
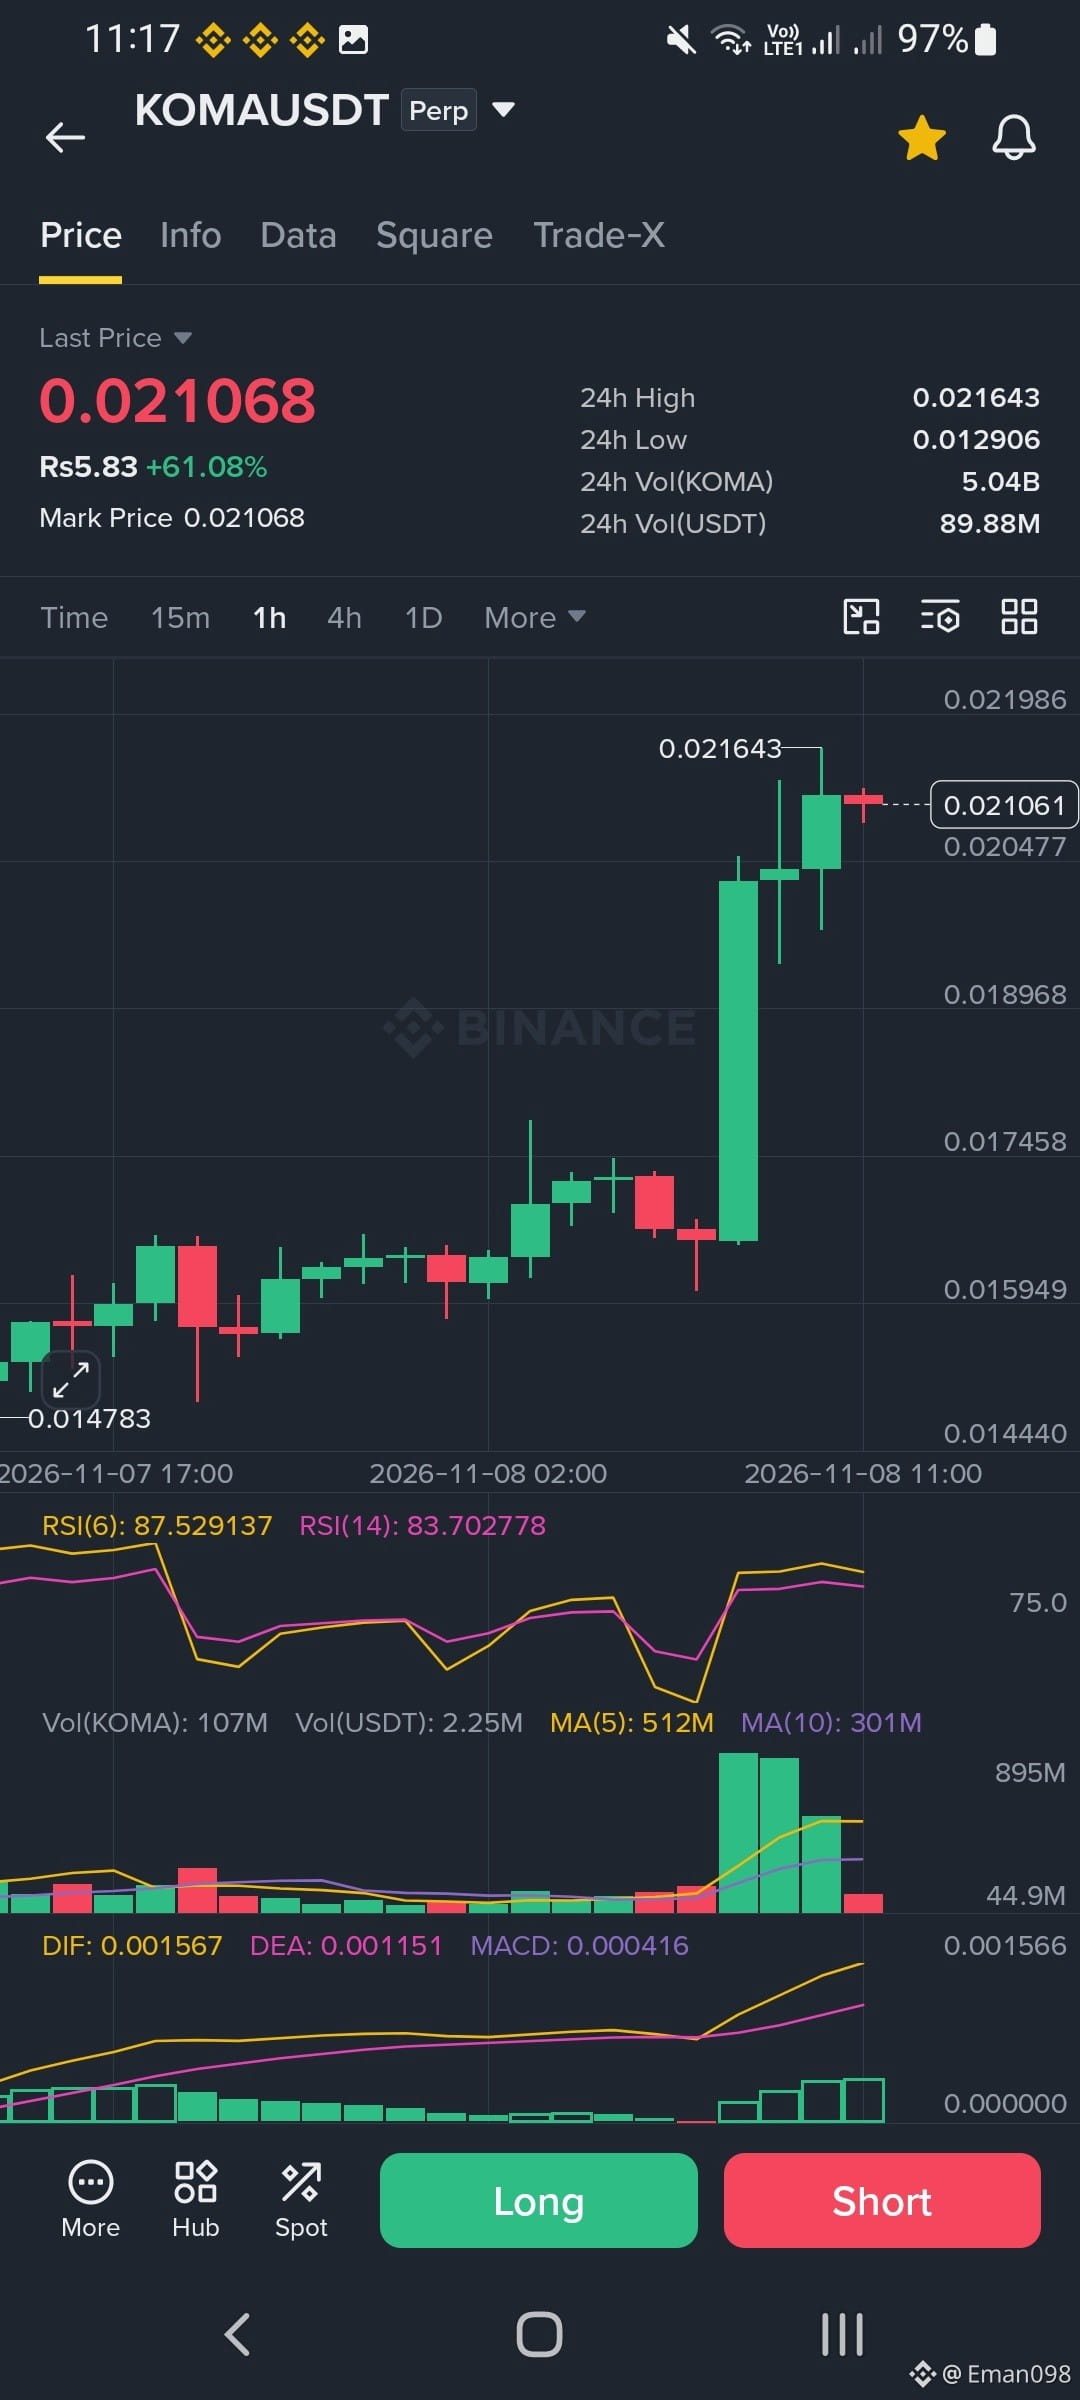
KOMA just made a huge move. Price is 0.021068 and up 61 percent in 24 hours. Two big green candles on high volume pushed it from 0.016 to 0.0216, and the latest candle is red with a small body. That tells me buyers are getting tired near the top.
RSI is at 87 on the 6 period and 83 on the 14 period. That is very overbought. After a pump like this a pullback is normal. MACD is still bullish but the gap is stretching fast.
Resistance is at 0.021643, the 24h high. If price breaks and holds above it, the next target is around 0.0225.
Support levels are 0.020477 first, then 0.018968, which is the middle of the big candle. Strong support sits at 0.017458. If that breaks, the whole pump is in danger.
Best plan is to avoid chasing here. A safer long entry is a pullback near 0.0190 to 0.0185 with a stop below 0.0174. Short traders should wait for a clear rejection at 0.0216.
This is not financial advice. Always use a stop loss.
$KOMA
#CPITestsDecemberRateOutlook #PriceActionAlwaysWin #Market_Update
KOMA just made a huge move. Price is 0.021068 and up 61 percent in 24 hours. Two big green candles on high volume pushed it from 0.016 to 0.0216, and the latest candle is red with a small body. That tells me buyers are getting tired near the top.
RSI is at 87 on the 6 period and 83 on the 14 period. That is very overbought. After a pump like this a pullback is normal. MACD is still bullish but the gap is stretching fast.
Resistance is at 0.021643, the 24h high. If price breaks and holds above it, the next target is around 0.0225.
Support levels are 0.020477 first, then 0.018968, which is the middle of the big candle. Strong support sits at 0.017458. If that breaks, the whole pump is in danger.
Best plan is to avoid chasing here. A safer long entry is a pullback near 0.0190 to 0.0185 with a stop below 0.0174. Short traders should wait for a clear rejection at 0.0216.
This is not financial advice. Always use a stop loss.
$KOMA
#CPITestsDecemberRateOutlook #PriceActionAlwaysWin #Market_Update
RSI is at 87 on the 6 period and 83 on the 14 period. That is very overbought. After a pump like this a pullback is normal. MACD is still bullish but the gap is stretching fast.
Resistance is at 0.021643, the 24h high. If price breaks and holds above it, the next target is around 0.0225.
Support levels are 0.020477 first, then 0.018968, which is the middle of the big candle. Strong support sits at 0.017458. If that breaks, the whole pump is in danger.
Best plan is to avoid chasing here. A safer long entry is a pullback near 0.0190 to 0.0185 with a stop below 0.0174. Short traders should wait for a clear rejection at 0.0216.
This is not financial advice. Always use a stop loss.
$KOMA
#CPITestsDecemberRateOutlook #PriceActionAlwaysWin #Market_Update
3
382
·
--
$XFS
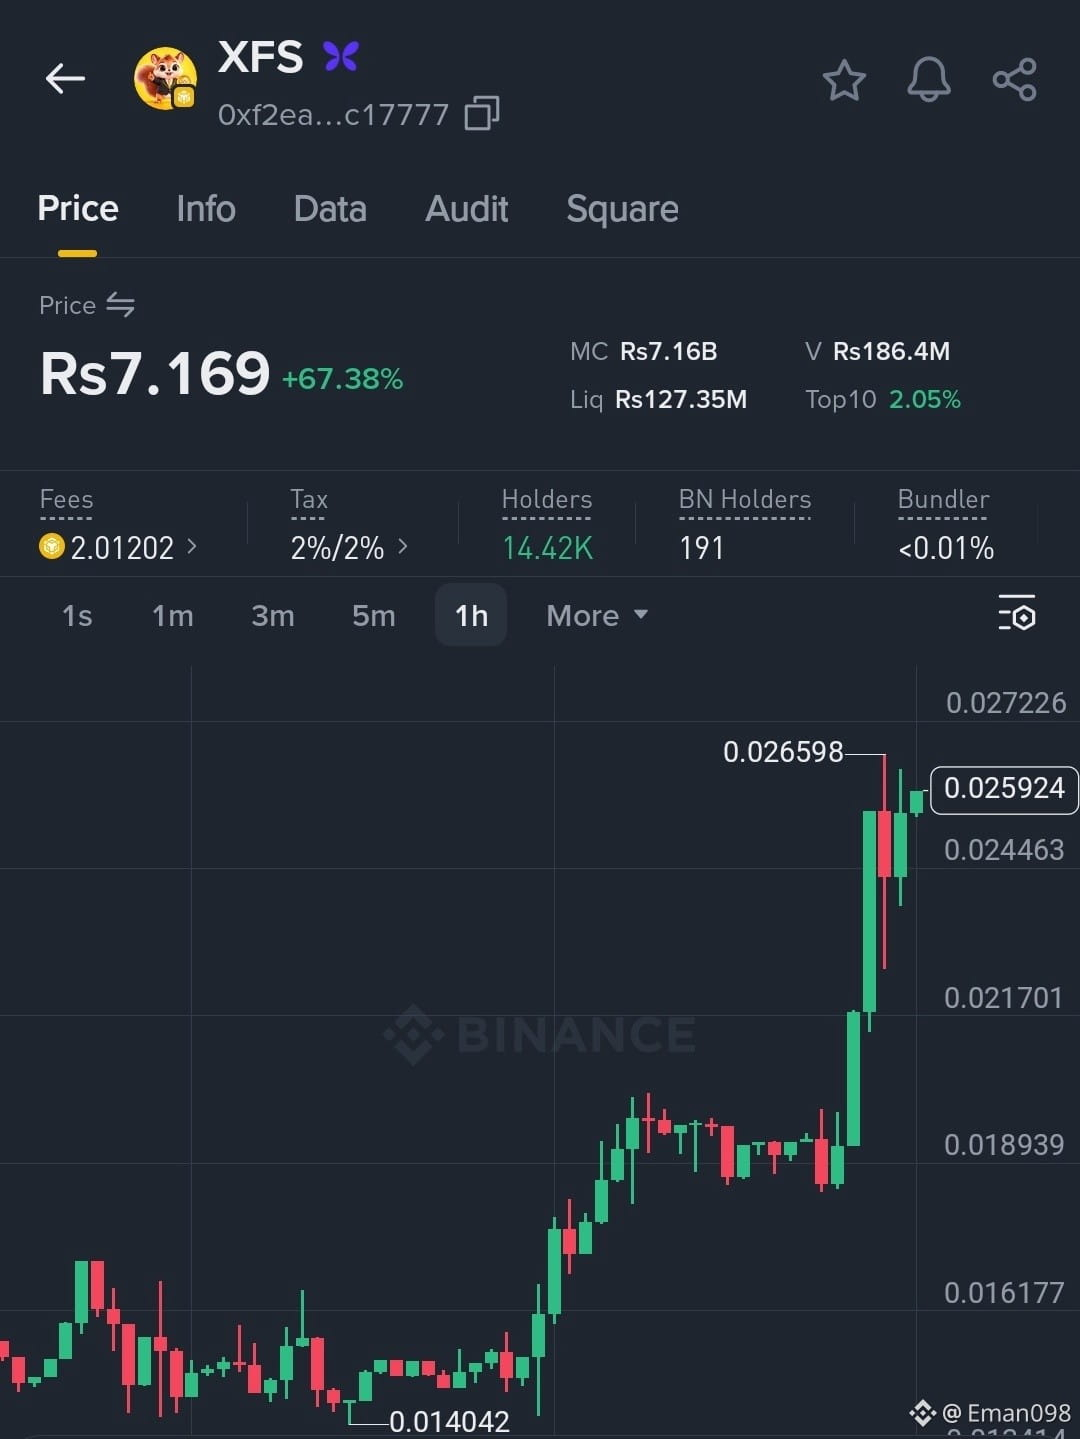
is showing real strength on the 1h chart right now. Price jumped 67% and sits near 0.0259 after a clean breakout from the 0.019 zone. Buyers stepped in with strong green candles and volume is solid at Rs186M.
What I like is the base. Holders are 14.42K and top 10 wallets hold only 2.05%. Bundler is under 0.01% so supply looks well spread. Tax is 2% buy and 2% sell. Liquidity stands at Rs127M.
This is my view and not financial advice. Always do your own research.
buy flying Squirrel in web3 wallet
token address 👇👇
XFS
0xf2eabb404d6c7a10deb524a74bbd4b2018c17777
@Square-Creator-69f4b95f93b7f
$XFS
is showing real strength on the 1h chart right now. Price jumped 67% and sits near 0.0259 after a clean breakout from the 0.019 zone. Buyers stepped in with strong green candles and volume is solid at Rs186M.
What I like is the base. Holders are 14.42K and top 10 wallets hold only 2.05%. Bundler is under 0.01% so supply looks well spread. Tax is 2% buy and 2% sell. Liquidity stands at Rs127M.
This is my view and not financial advice. Always do your own research.
buy flying Squirrel in web3 wallet
token address 👇👇
XFS
0xf2eabb404d6c7a10deb524a74bbd4b2018c17777
@火星公会-灵汐
is showing real strength on the 1h chart right now. Price jumped 67% and sits near 0.0259 after a clean breakout from the 0.019 zone. Buyers stepped in with strong green candles and volume is solid at Rs186M.
What I like is the base. Holders are 14.42K and top 10 wallets hold only 2.05%. Bundler is under 0.01% so supply looks well spread. Tax is 2% buy and 2% sell. Liquidity stands at Rs127M.
This is my view and not financial advice. Always do your own research.
buy flying Squirrel in web3 wallet
token address 👇👇
XFS
0xf2eabb404d6c7a10deb524a74bbd4b2018c17777
@火星公会-灵汐
458
4
35
458
·
--
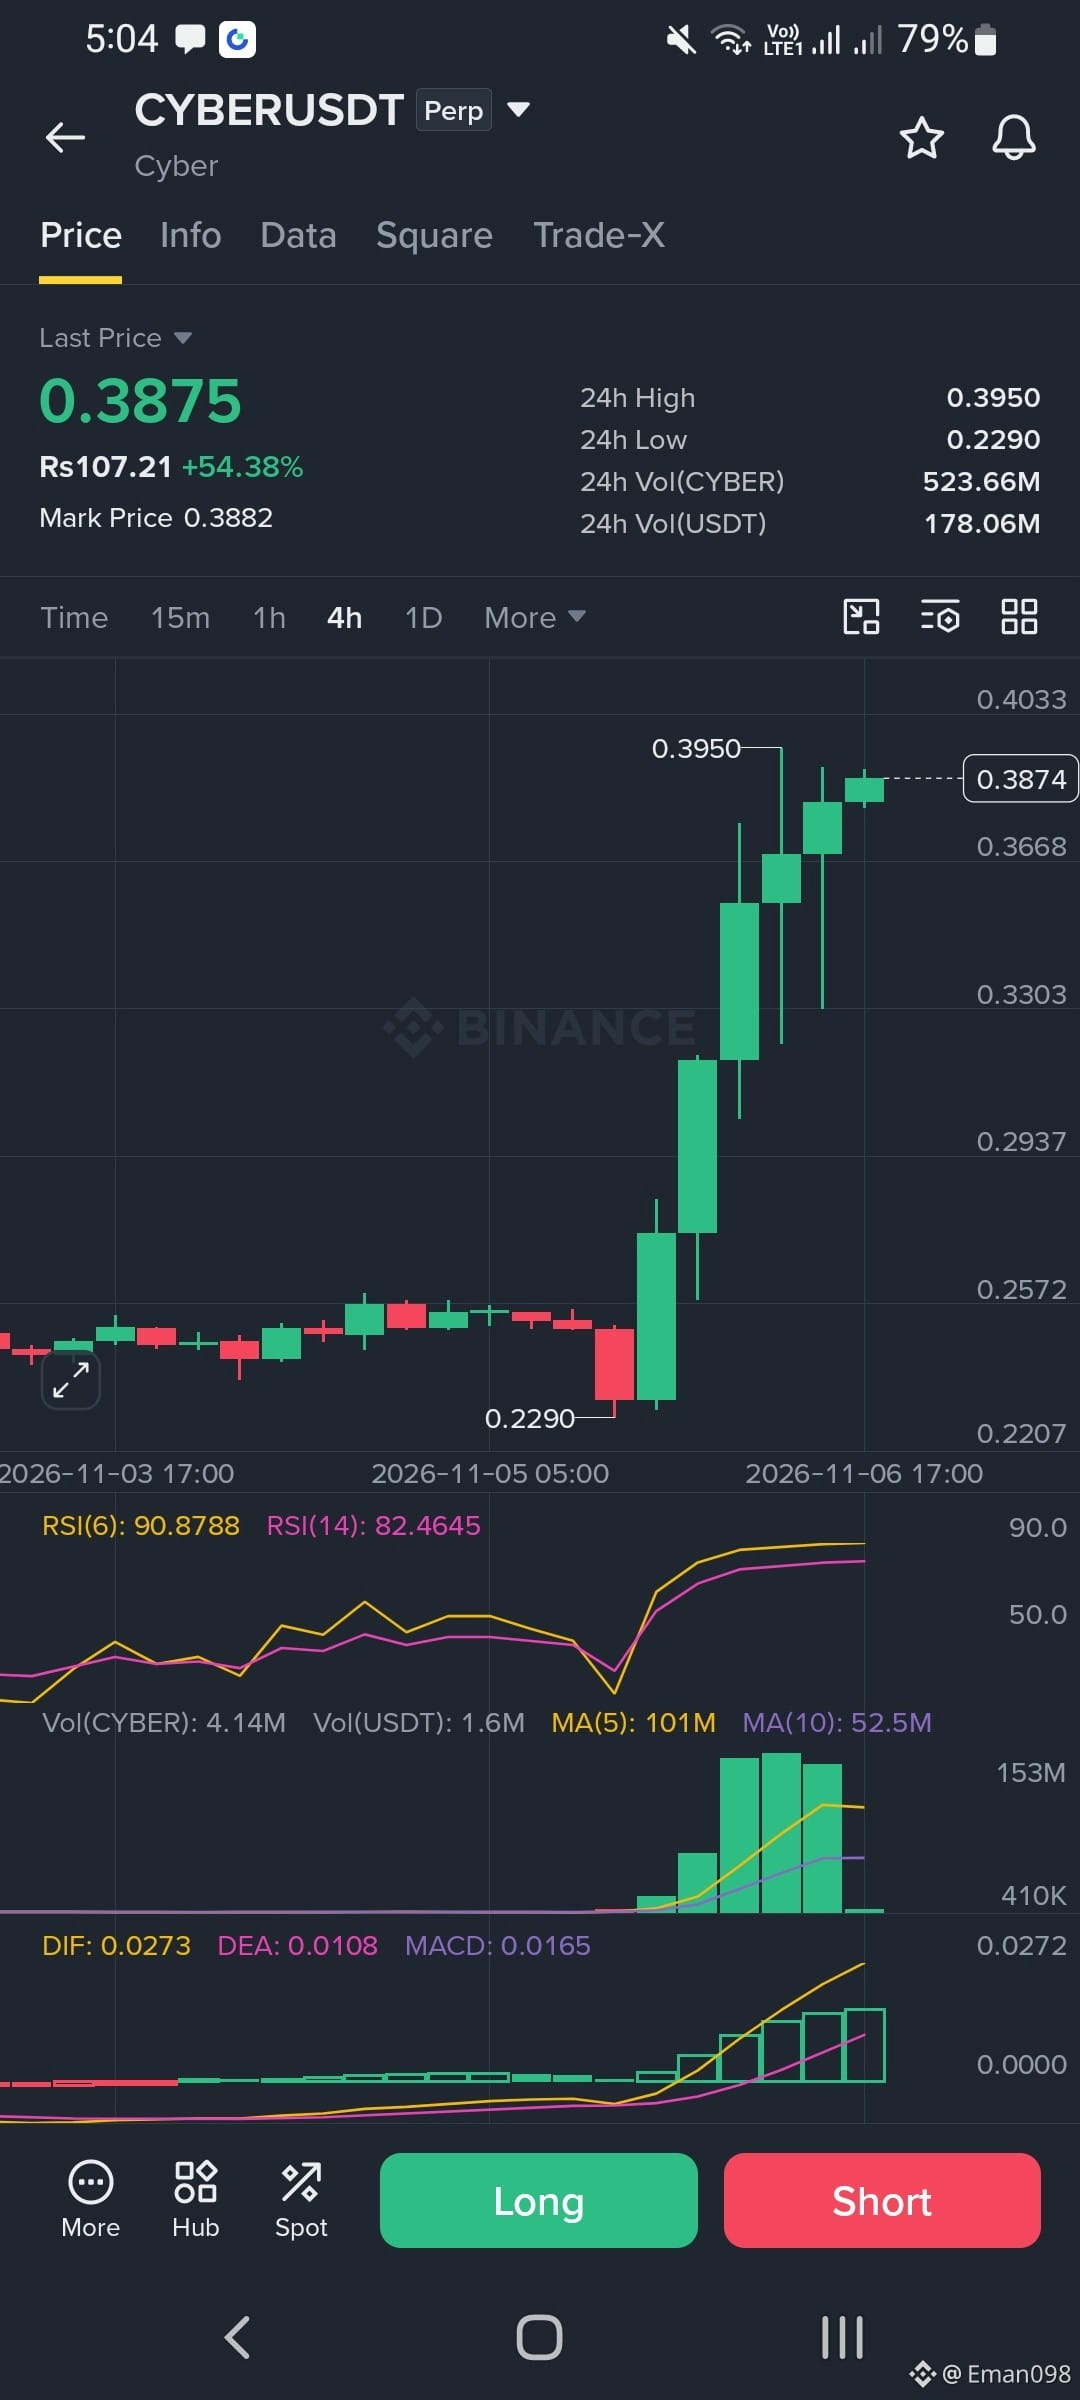
$CYBER has jumped hard, up 54 percent in one day, going from 0.2290 to a high of 0.3950. Price now sits near 0.3875, just under that top. The 4h candles are all green with strong volume, so buyers are clearly in control. But RSI is above 90 on the short line, which means the move is very stretched. MACD is still rising, so momentum is alive. A pullback would be normal after such a fast pump. Chasing here is risky.
Best levels:
Resistance is 0.3950 and then 0.4033.
Support is 0.3668 first, then 0.3303.
Strong support is 0.2937.
Safer entry is a dip near 0.3668 or 0.3303. A close above 0.3950 can push price higher. Always use a stop loss.
$CYBER has jumped hard, up 54 percent in one day, going from 0.2290 to a high of 0.3950. Price now sits near 0.3875, just under that top. The 4h candles are all green with strong volume, so buyers are clearly in control. But RSI is above 90 on the short line, which means the move is very stretched. MACD is still rising, so momentum is alive. A pullback would be normal after such a fast pump. Chasing here is risky.
Best levels:
Resistance is 0.3950 and then 0.4033.
Support is 0.3668 first, then 0.3303.
Strong support is 0.2937.
Safer entry is a dip near 0.3668 or 0.3303. A close above 0.3950 can push price higher. Always use a stop loss.
Best levels:
Resistance is 0.3950 and then 0.4033.
Support is 0.3668 first, then 0.3303.
Strong support is 0.2937.
Safer entry is a dip near 0.3668 or 0.3303. A close above 0.3950 can push price higher. Always use a stop loss.
4
290

·
--
30D trade $NIL 2.2K USDT
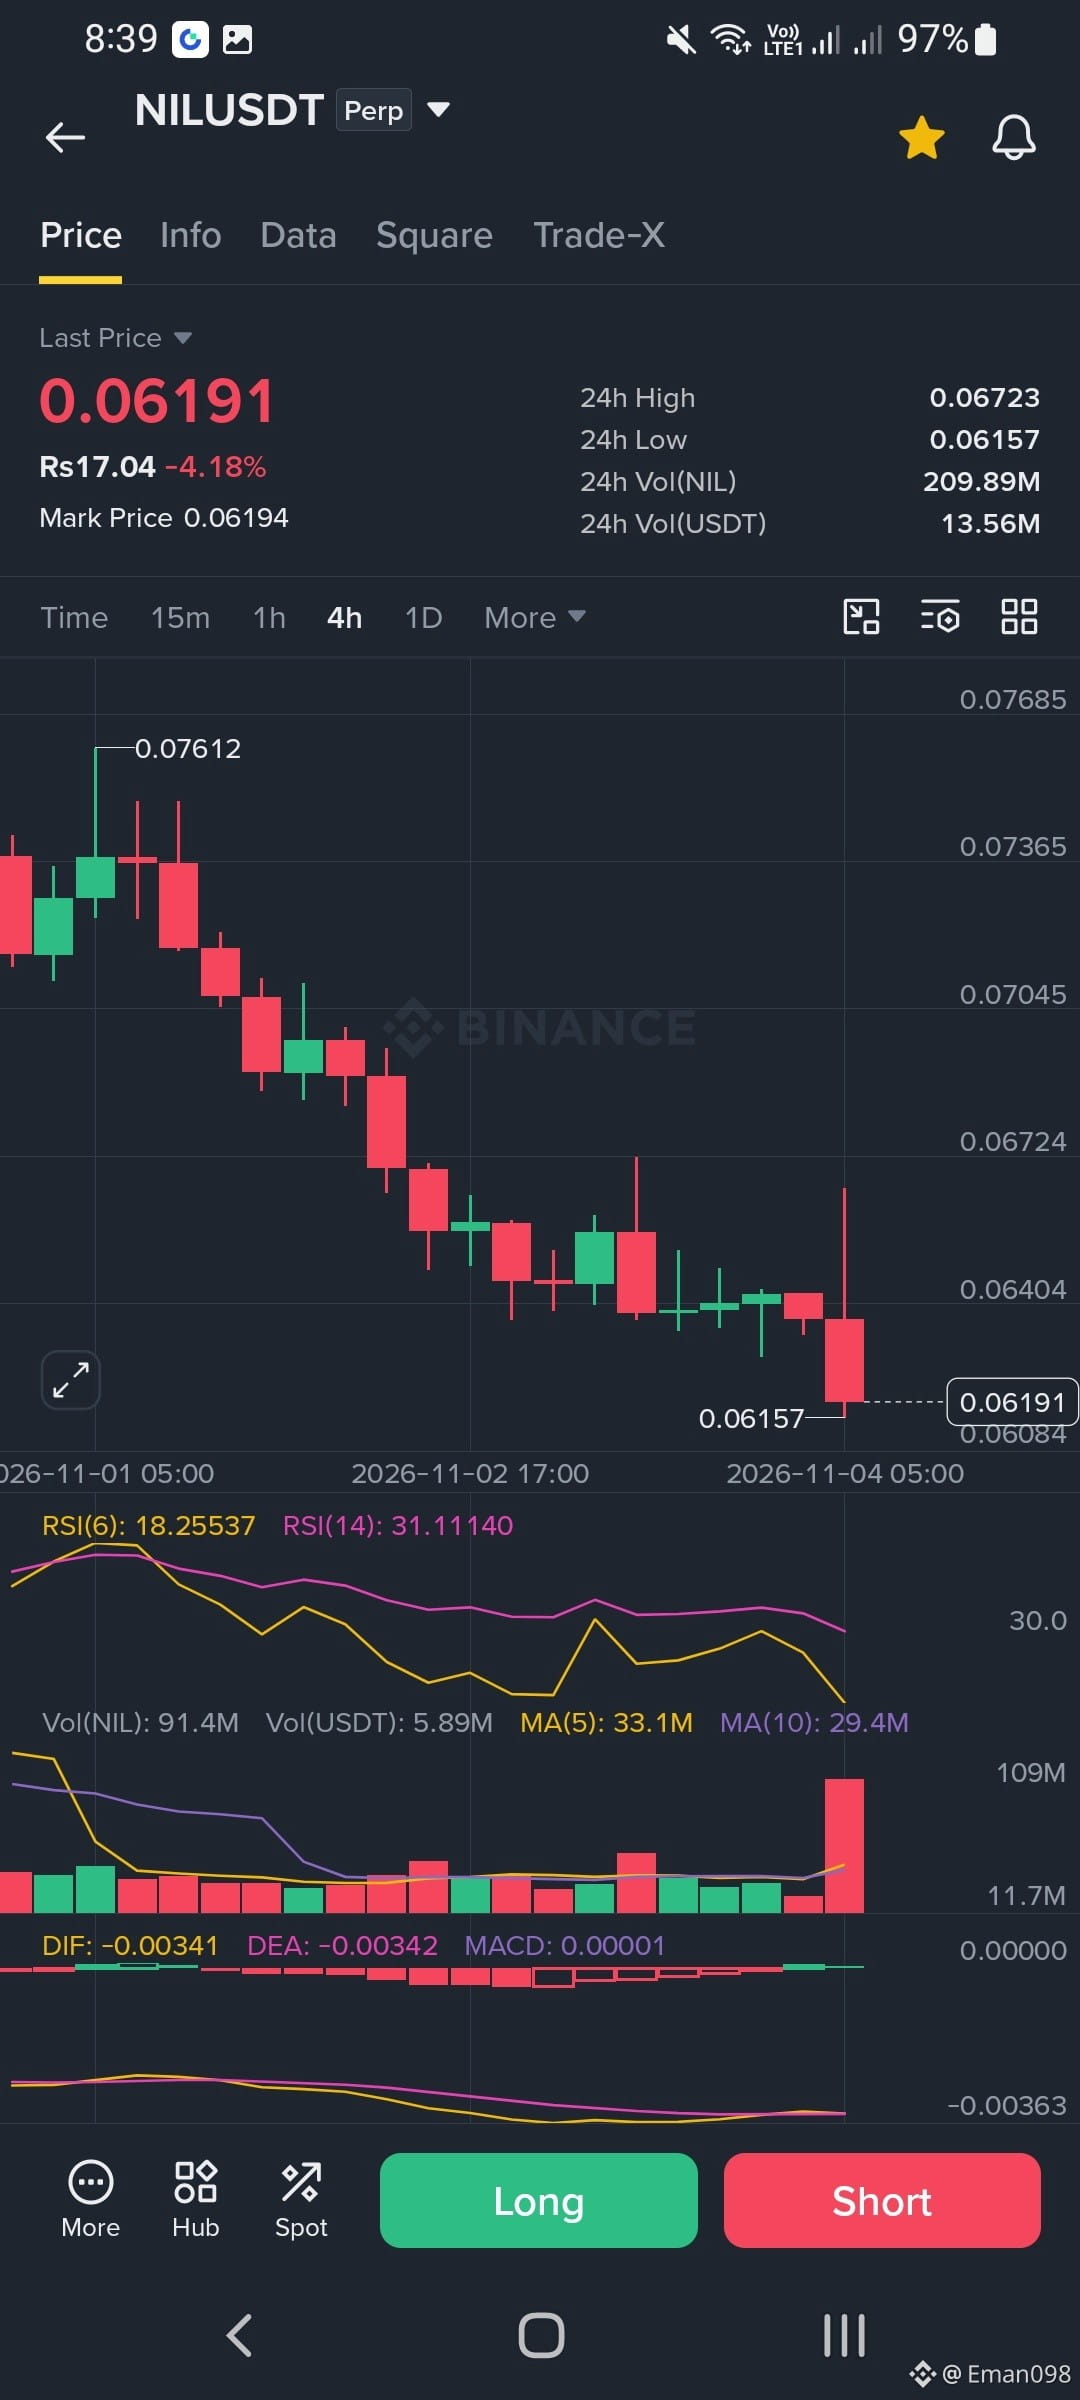
NILUSDT is in a clear downtrend on the 4h chart. Price fell from 0.07612 to 0.06191 with mostly red candles and lower highs. The latest candle is a big red one with strong volume, and the long wick above shows sellers pushed price down hard.
RSI(6) is at 18 and RSI(14) is near 31, so the coin is oversold. A small bounce can happen, but I would not call it a reversal yet. MACD is flat below zero, which means momentum is still weak.
Best levels:
Support is 0.06157 first, then 0.06084 below it.
Resistance is 0.06404 first, then 0.06724.
A long needs a 4h close above 0.06404. A short looks better only if price closes under 0.06157. Keep your stop loss tight because this is a risky perp trade.
$NIL
#PriceActionAnalysis #Market_Update
NILUSDT is in a clear downtrend on the 4h chart. Price fell from 0.07612 to 0.06191 with mostly red candles and lower highs. The latest candle is a big red one with strong volume, and the long wick above shows sellers pushed price down hard.
RSI(6) is at 18 and RSI(14) is near 31, so the coin is oversold. A small bounce can happen, but I would not call it a reversal yet. MACD is flat below zero, which means momentum is still weak.
Best levels:
Support is 0.06157 first, then 0.06084 below it.
Resistance is 0.06404 first, then 0.06724.
A long needs a 4h close above 0.06404. A short looks better only if price closes under 0.06157. Keep your stop loss tight because this is a risky perp trade.
$NIL
#PriceActionAnalysis #Market_Update
RSI(6) is at 18 and RSI(14) is near 31, so the coin is oversold. A small bounce can happen, but I would not call it a reversal yet. MACD is flat below zero, which means momentum is still weak.
Best levels:
Support is 0.06157 first, then 0.06084 below it.
Resistance is 0.06404 first, then 0.06724.
A long needs a 4h close above 0.06404. A short looks better only if price closes under 0.06157. Keep your stop loss tight because this is a risky perp trade.
$NIL
#PriceActionAnalysis #Market_Update
5
410
·
--
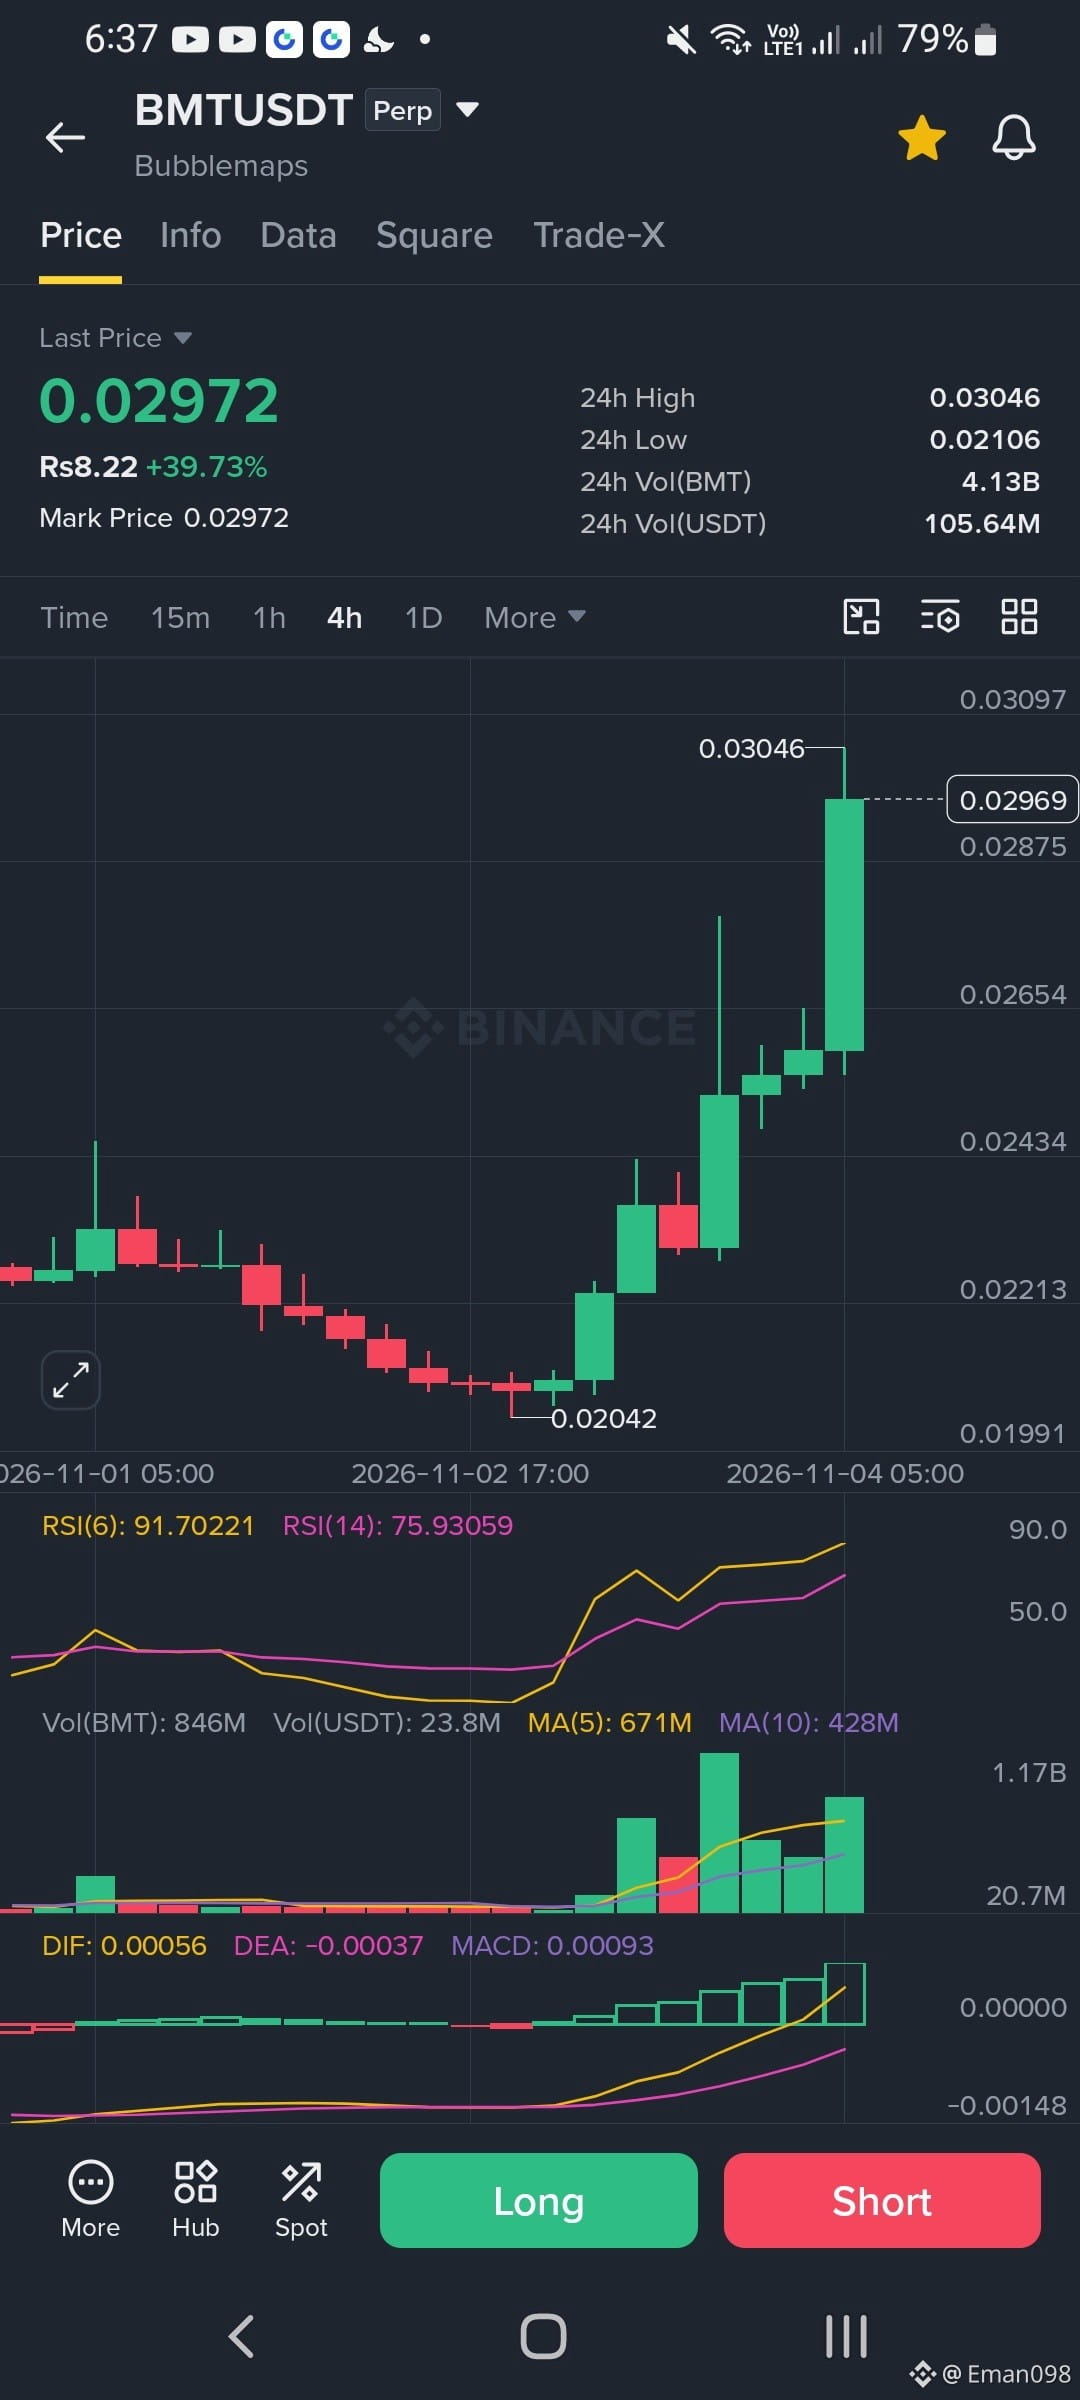
BMT is pumping hard right now. Price jumped almost 40 percent today and the last 4h candle is a big green one with very high volume. RSI is above 90 on the fast line so the coin is overbought and a pullback can come any time. MACD is still rising so momentum is strong.
Support levels are 0.02654 and 0.02434. Strong support sits near 0.02213.
Resistance is 0.03046 then 0.03097. Do not chase this candle. Wait for a dip and keep a stop loss. This is not financial advice.
$BMT
{future}(BMTUSDT)
#BinanceIncidentReport #Market_Update #BMT
BMT is pumping hard right now. Price jumped almost 40 percent today and the last 4h candle is a big green one with very high volume. RSI is above 90 on the fast line so the coin is overbought and a pullback can come any time. MACD is still rising so momentum is strong.
Support levels are 0.02654 and 0.02434. Strong support sits near 0.02213.
Resistance is 0.03046 then 0.03097. Do not chase this candle. Wait for a dip and keep a stop loss. This is not financial advice.
$BMT
#BinanceIncidentReport #Market_Update #BMT
Support levels are 0.02654 and 0.02434. Strong support sits near 0.02213.
Resistance is 0.03046 then 0.03097. Do not chase this candle. Wait for a dip and keep a stop loss. This is not financial advice.
$BMT
#BinanceIncidentReport #Market_Update #BMT
5
316
·
--
$AGT 👇👇👇👇
{future}(AGTUSDT)
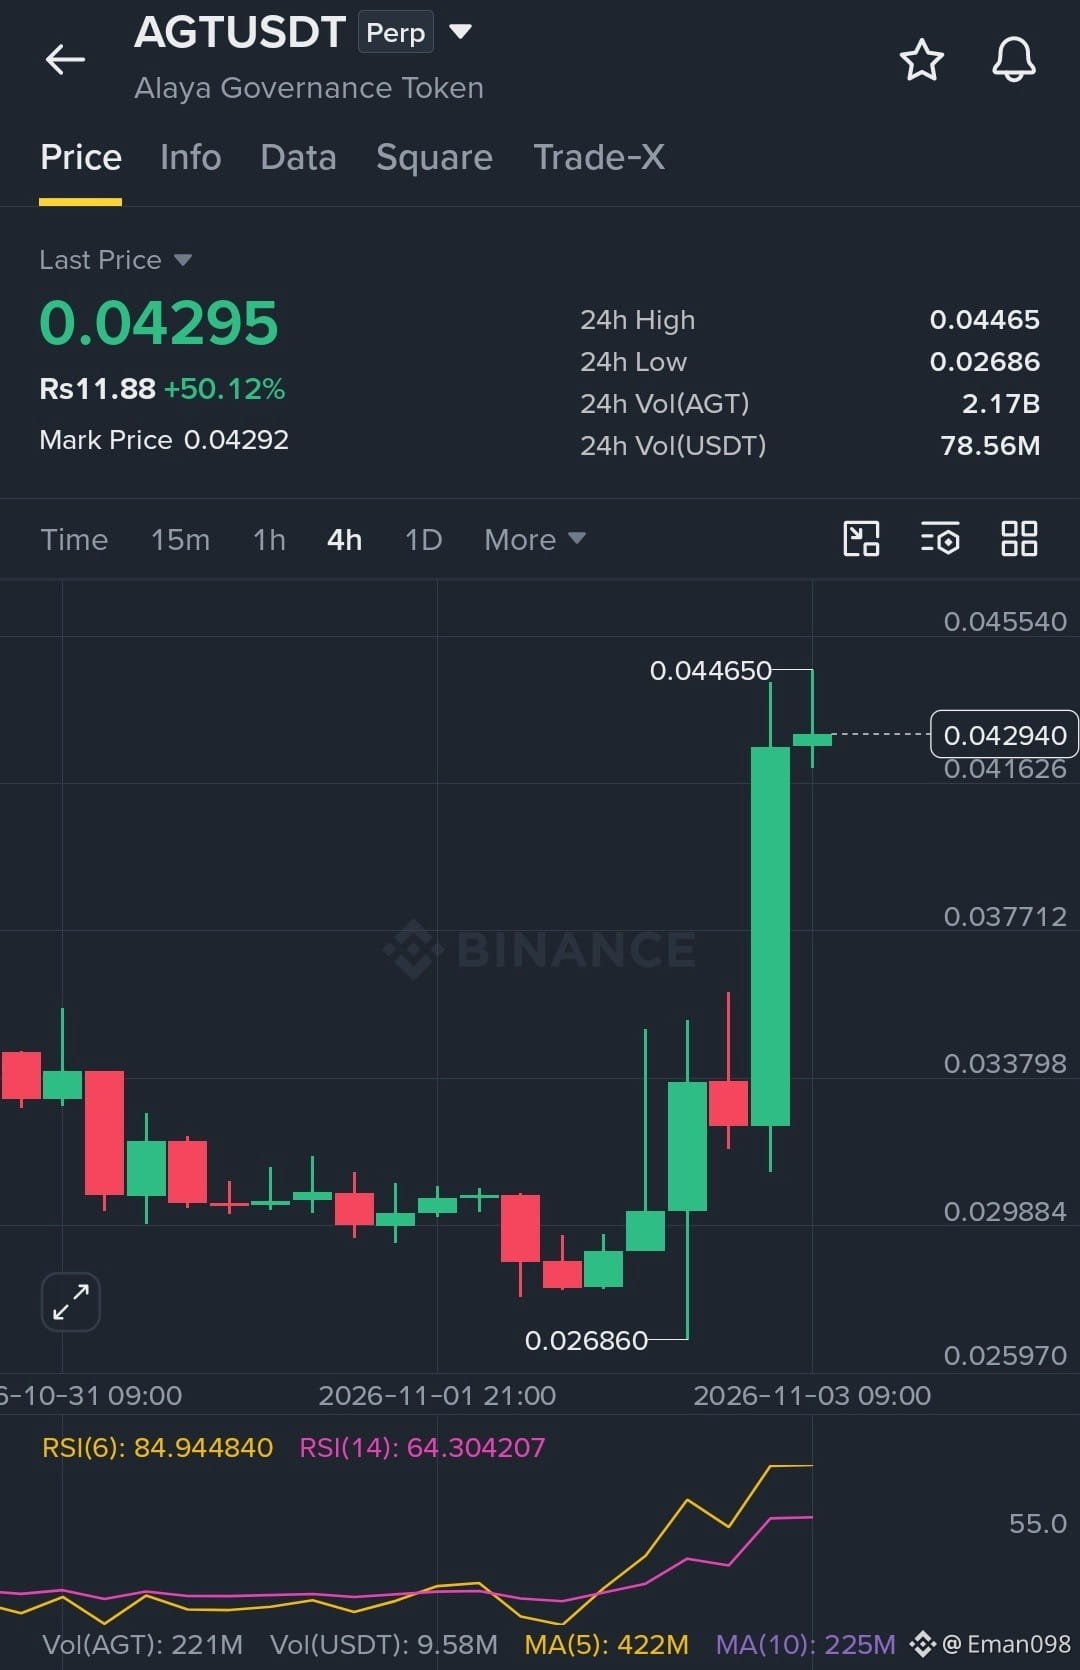
is on fire right now. It jumped over fifty percent today and printed a huge green 4h candle. Price sits at 0.04295 after tapping 0.04465 and getting rejected a bit. RSI is near 85 on the short line so it looks very hot. Best support is 0.0377 then 0.0338. Resistance is 0.04465 first and then 0.0455. I would not chase here. Wait for a pullback to support. Risk warning: this pump can reverse fast so use a tight stop.
#PriceCorrection #Market_Update
$AGT 👇👇👇👇
is on fire right now. It jumped over fifty percent today and printed a huge green 4h candle. Price sits at 0.04295 after tapping 0.04465 and getting rejected a bit. RSI is near 85 on the short line so it looks very hot. Best support is 0.0377 then 0.0338. Resistance is 0.04465 first and then 0.0455. I would not chase here. Wait for a pullback to support. Risk warning: this pump can reverse fast so use a tight stop.
#PriceCorrection #Market_Update
is on fire right now. It jumped over fifty percent today and printed a huge green 4h candle. Price sits at 0.04295 after tapping 0.04465 and getting rejected a bit. RSI is near 85 on the short line so it looks very hot. Best support is 0.0377 then 0.0338. Resistance is 0.04465 first and then 0.0455. I would not chase here. Wait for a pullback to support. Risk warning: this pump can reverse fast so use a tight stop.
#PriceCorrection #Market_Update
6
299
·
--
$AIN USDT (4h) – Bearish short-term, cooling off after a spike
Trend:
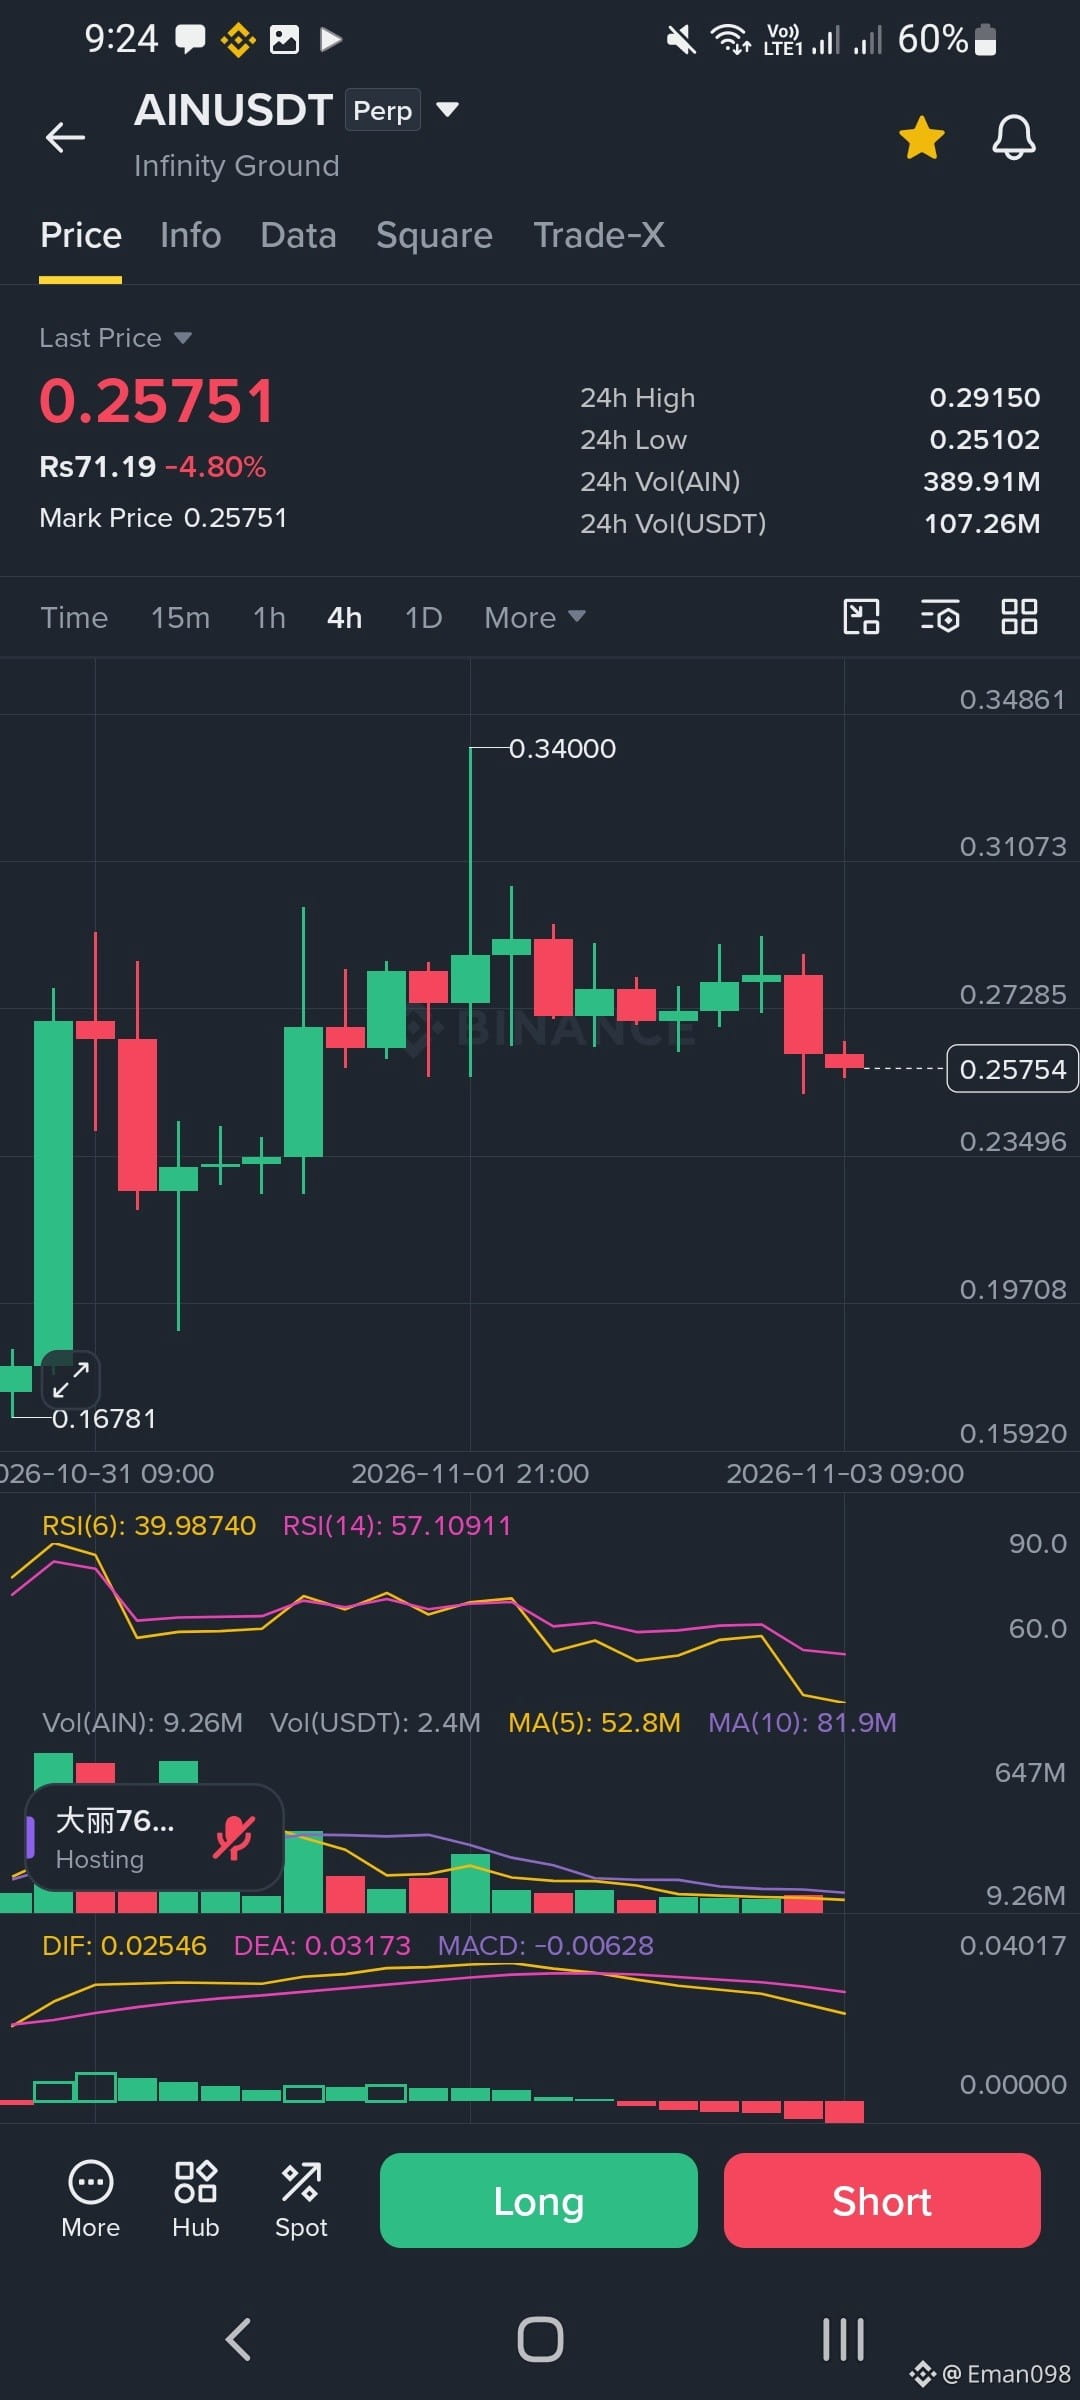
Price is 0.2575 (-4.8%), after a pump to 0.34 and a failed hold above 0.27–0.29. The last 3 candles are red with lower highs, so momentum has shifted down.
Indicators
- RSI(6) 39.99 / RSI(14) 57.1:** Short RSI is weak and rolling over; the 14 is still neutral but falling. Not oversold yet, so there's room to drop.
- MACD:
DIF (0.0255) has crossed below DEA (0.0317), and the histogram is red and growing. This is a bearish cross.
- Volume:
Falling well below the MA(5) and MA(10). The pump had no sustained buying, and the sell-off isn't heavy either, so it's a fading move rather than panic.
Key levels
- Resistance:
0.270–0.273, then 0.29 (24h high), then 0.34 (wick top)
- **Support:** 0.251 (24h low), then 0.235, then 0.197
Outlook:
The bias is bearish while price stays under ~0.27. A break below 0.251 likely targets 0.235, and then 0.197. A bullish reversal would need a 4h close back above 0.273 with rising volume.
This is technical analysis only, not financial advice. I'm not a financial advisor, so please do your own research.
$AIN
{future}(AINUSDT)
$AIN USDT (4h) – Bearish short-term, cooling off after a spike
Trend:
Price is 0.2575 (-4.8%), after a pump to 0.34 and a failed hold above 0.27–0.29. The last 3 candles are red with lower highs, so momentum has shifted down.
Indicators
- RSI(6) 39.99 / RSI(14) 57.1:** Short RSI is weak and rolling over; the 14 is still neutral but falling. Not oversold yet, so there's room to drop.
- MACD:
DIF (0.0255) has crossed below DEA (0.0317), and the histogram is red and growing. This is a bearish cross.
- Volume:
Falling well below the MA(5) and MA(10). The pump had no sustained buying, and the sell-off isn't heavy either, so it's a fading move rather than panic.
Key levels
- Resistance:
0.270–0.273, then 0.29 (24h high), then 0.34 (wick top)
- **Support:** 0.251 (24h low), then 0.235, then 0.197
Outlook:
The bias is bearish while price stays under ~0.27. A break below 0.251 likely targets 0.235, and then 0.197. A bullish reversal would need a 4h close back above 0.273 with rising volume.
This is technical analysis only, not financial advice. I'm not a financial advisor, so please do your own research.
$AIN
Trend:
Price is 0.2575 (-4.8%), after a pump to 0.34 and a failed hold above 0.27–0.29. The last 3 candles are red with lower highs, so momentum has shifted down.
Indicators
- RSI(6) 39.99 / RSI(14) 57.1:** Short RSI is weak and rolling over; the 14 is still neutral but falling. Not oversold yet, so there's room to drop.
- MACD:
DIF (0.0255) has crossed below DEA (0.0317), and the histogram is red and growing. This is a bearish cross.
- Volume:
Falling well below the MA(5) and MA(10). The pump had no sustained buying, and the sell-off isn't heavy either, so it's a fading move rather than panic.
Key levels
- Resistance:
0.270–0.273, then 0.29 (24h high), then 0.34 (wick top)
- **Support:** 0.251 (24h low), then 0.235, then 0.197
Outlook:
The bias is bearish while price stays under ~0.27. A break below 0.251 likely targets 0.235, and then 0.197. A bullish reversal would need a 4h close back above 0.273 with rising volume.
This is technical analysis only, not financial advice. I'm not a financial advisor, so please do your own research.
$AIN
7
567
·
--
IDOLUSDT Perp, 4h chart: neutral-to-cautious right now
Price action:
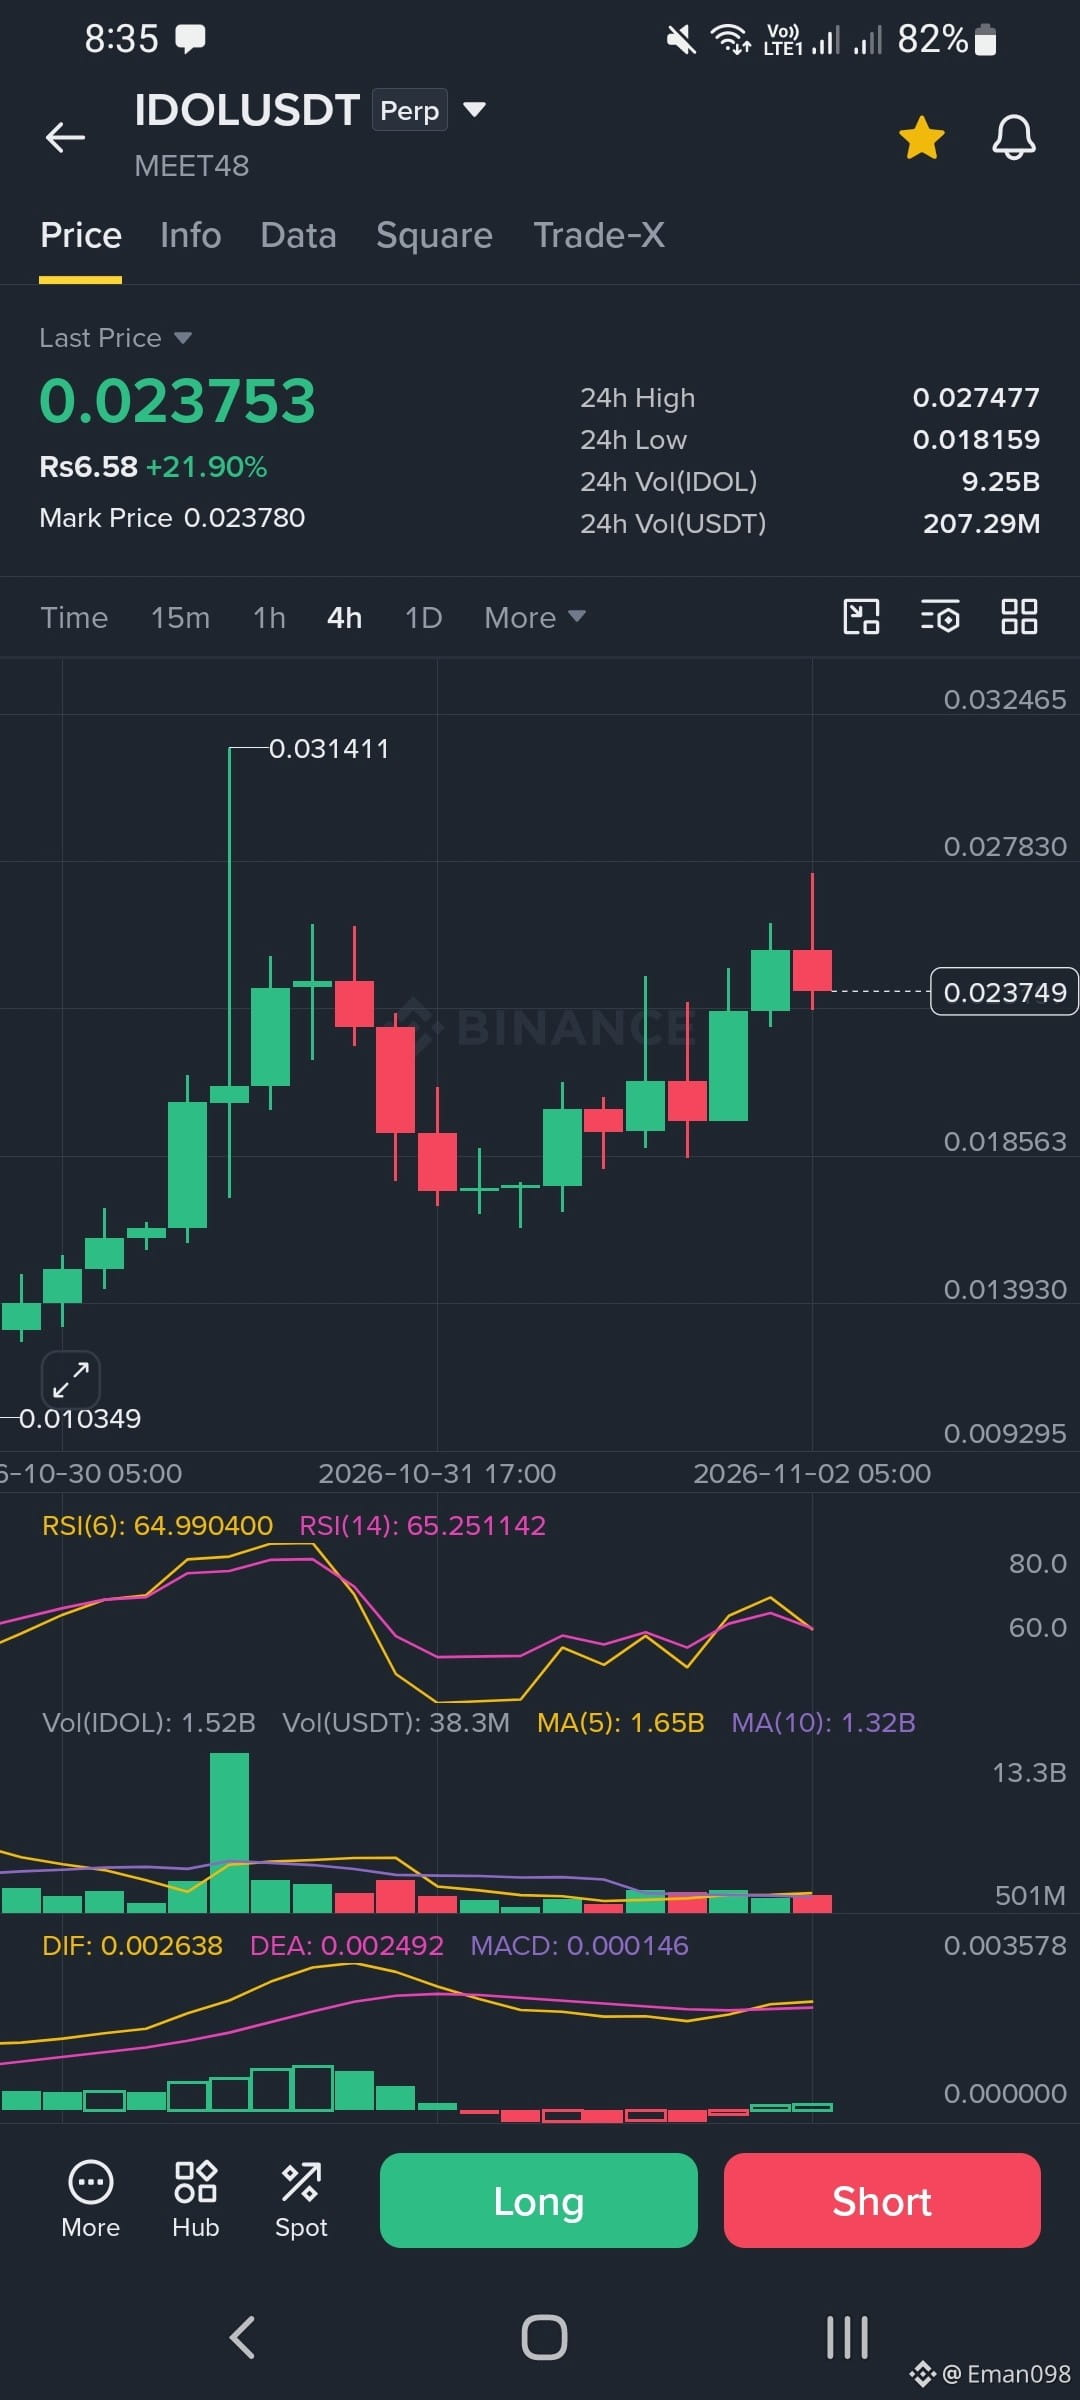
It's up about 22% on the day at 0.023753. After the spike to 0.0314 and a pullback to roughly 0.0155–0.016, it formed a higher low and recovered. The latest 4h candle is red with a long upper wick (rejection near 0.027). That suggests sellers are defending the 0.026–0.027 area, which is also the 24h high.
Key levels:
- Resistance: 0.0275 (24h high), then 0.0314 (spike high)
- Support: 0.0215–0.022 (recent candle bodies), then 0.018–0.0185 (24h low zone)
Indicators:
- RSI (6/14): about 65, with RSI(6) turning down from its peak. Momentum is positive but cooling, and it isn't overbought.
- MACD: DIF is barely above DEA and the histogram has shrunk to almost zero. A bullish cross has only just formed, so it's weak and could flip back easily.
- Volume: the current bar (1.52B) is far below the big spike earlier, and below the MA(5). The rally is not backed by strong buying.
Scenarios
- Bullish:
a 4h close above 0.0275 with rising volume could target 0.031.
- Bearish:
a drop below 0.022 would confirm the rejection and could send it back to 0.0185.
Takeaways:
The structure is recovering, but momentum is fading right at resistance on weak volume. Chasing a long here carries poor risk/reward. Waiting for a pullback to support or a confirmed breakout is the safer approach. Shorts are tempting but risky too, since this coin has shown violent spikes (the wick to 0.031). If you trade it, keep leverage low and use a defined stop.
This is technical analysis only, not financial advice. Perps on volatile small caps can liquidate quickly.
#PriceActionAlwaysWin
IDOLUSDT Perp, 4h chart: neutral-to-cautious right now
Price action:
It's up about 22% on the day at 0.023753. After the spike to 0.0314 and a pullback to roughly 0.0155–0.016, it formed a higher low and recovered. The latest 4h candle is red with a long upper wick (rejection near 0.027). That suggests sellers are defending the 0.026–0.027 area, which is also the 24h high.
Key levels:
- Resistance: 0.0275 (24h high), then 0.0314 (spike high)
- Support: 0.0215–0.022 (recent candle bodies), then 0.018–0.0185 (24h low zone)
Indicators:
- RSI (6/14): about 65, with RSI(6) turning down from its peak. Momentum is positive but cooling, and it isn't overbought.
- MACD: DIF is barely above DEA and the histogram has shrunk to almost zero. A bullish cross has only just formed, so it's weak and could flip back easily.
- Volume: the current bar (1.52B) is far below the big spike earlier, and below the MA(5). The rally is not backed by strong buying.
Scenarios
- Bullish:
a 4h close above 0.0275 with rising volume could target 0.031.
- Bearish:
a drop below 0.022 would confirm the rejection and could send it back to 0.0185.
Takeaways:
The structure is recovering, but momentum is fading right at resistance on weak volume. Chasing a long here carries poor risk/reward. Waiting for a pullback to support or a confirmed breakout is the safer approach. Shorts are tempting but risky too, since this coin has shown violent spikes (the wick to 0.031). If you trade it, keep leverage low and use a defined stop.
This is technical analysis only, not financial advice. Perps on volatile small caps can liquidate quickly.
#PriceActionAlwaysWin
Price action:
It's up about 22% on the day at 0.023753. After the spike to 0.0314 and a pullback to roughly 0.0155–0.016, it formed a higher low and recovered. The latest 4h candle is red with a long upper wick (rejection near 0.027). That suggests sellers are defending the 0.026–0.027 area, which is also the 24h high.
Key levels:
- Resistance: 0.0275 (24h high), then 0.0314 (spike high)
- Support: 0.0215–0.022 (recent candle bodies), then 0.018–0.0185 (24h low zone)
Indicators:
- RSI (6/14): about 65, with RSI(6) turning down from its peak. Momentum is positive but cooling, and it isn't overbought.
- MACD: DIF is barely above DEA and the histogram has shrunk to almost zero. A bullish cross has only just formed, so it's weak and could flip back easily.
- Volume: the current bar (1.52B) is far below the big spike earlier, and below the MA(5). The rally is not backed by strong buying.
Scenarios
- Bullish:
a 4h close above 0.0275 with rising volume could target 0.031.
- Bearish:
a drop below 0.022 would confirm the rejection and could send it back to 0.0185.
Takeaways:
The structure is recovering, but momentum is fading right at resistance on weak volume. Chasing a long here carries poor risk/reward. Waiting for a pullback to support or a confirmed breakout is the safer approach. Shorts are tempting but risky too, since this coin has shown violent spikes (the wick to 0.031). If you trade it, keep leverage low and use a defined stop.
This is technical analysis only, not financial advice. Perps on volatile small caps can liquidate quickly.
#PriceActionAlwaysWin
7
425
·
--
$BIRB
{future}(BIRBUSDT)
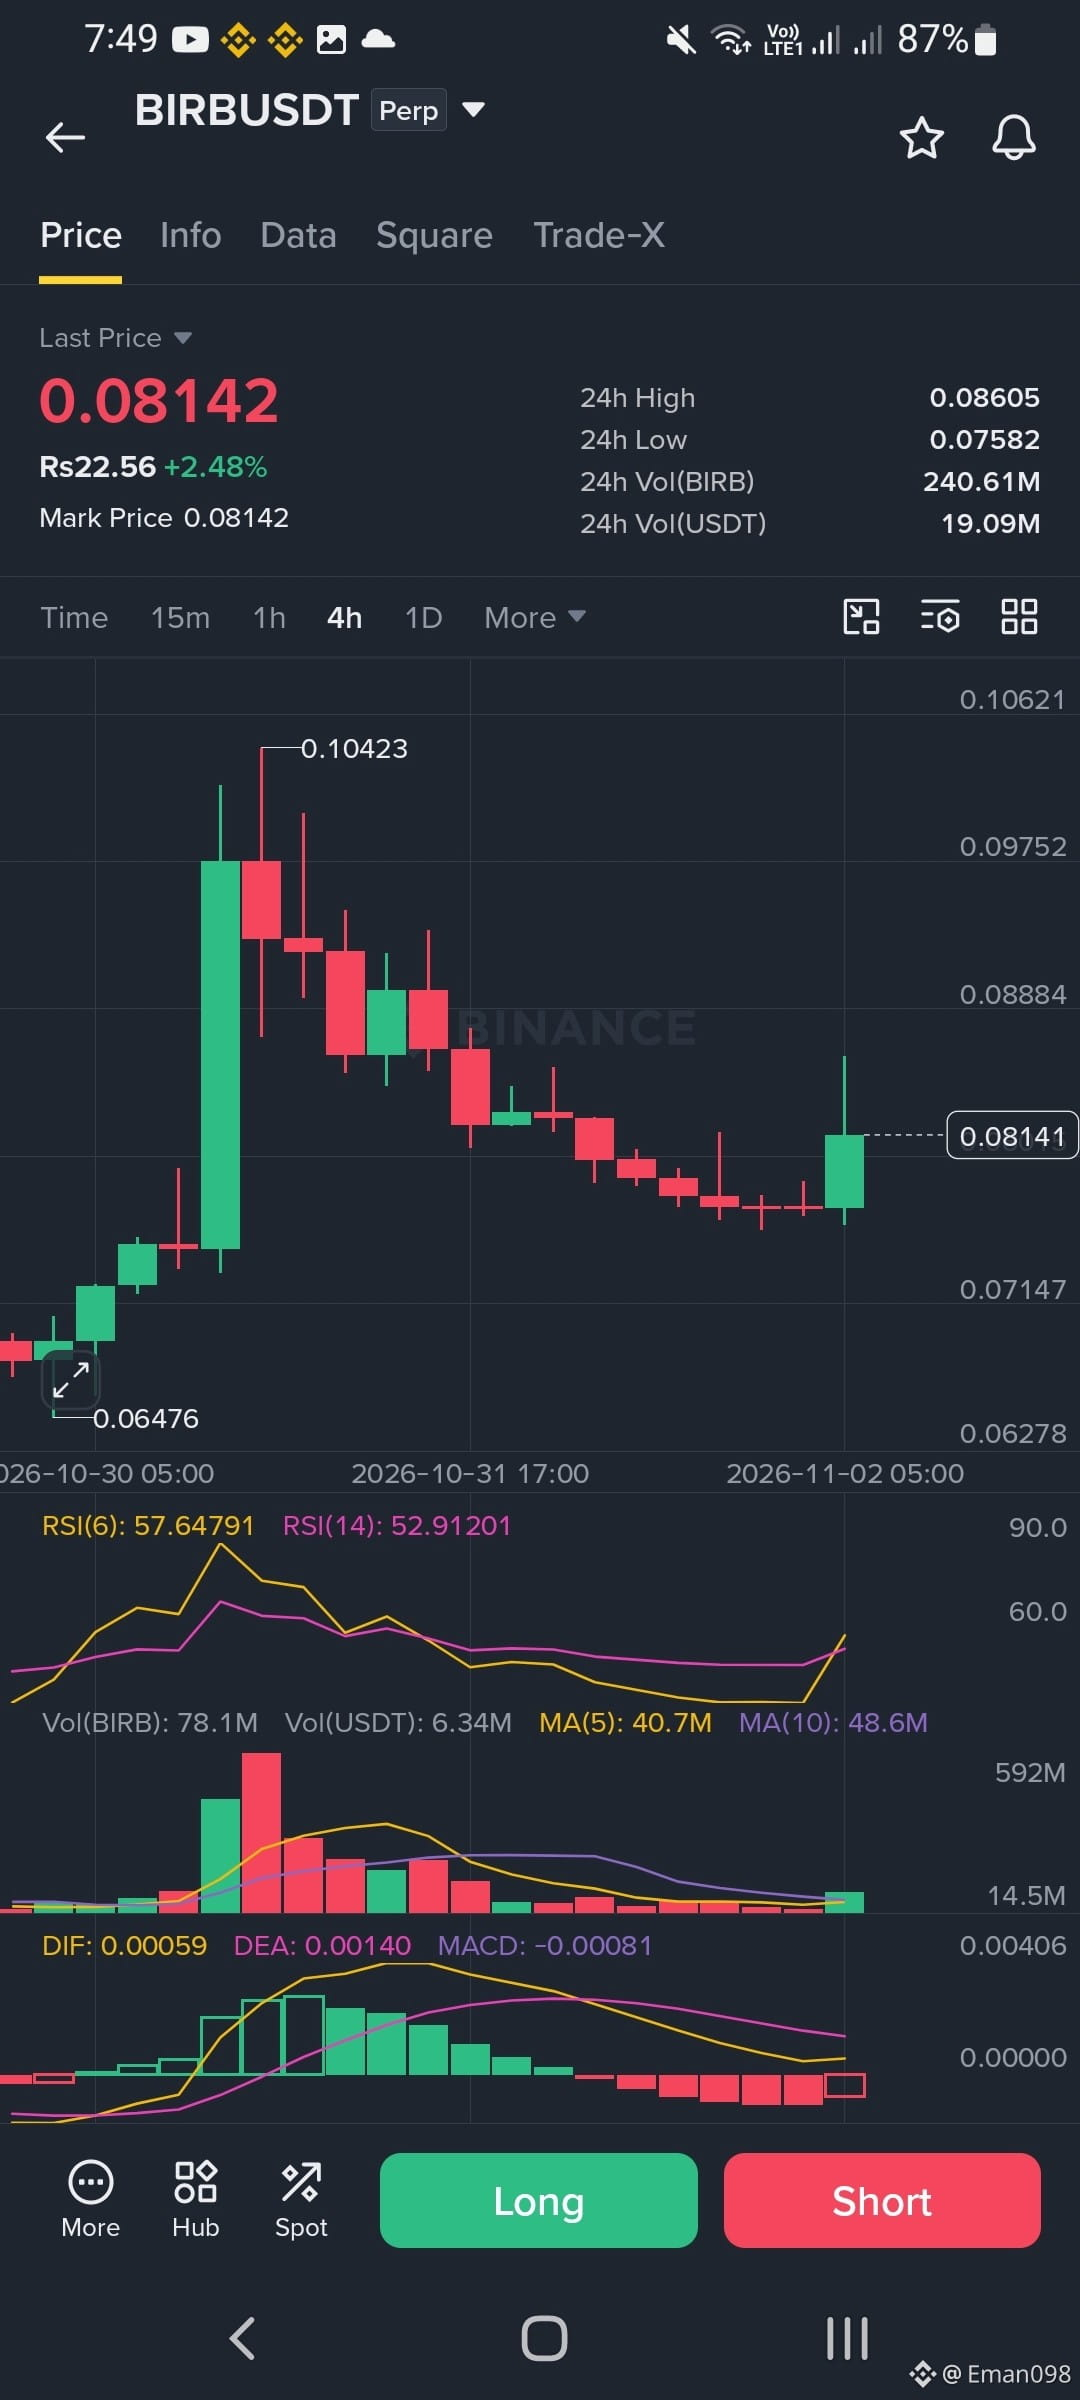
is finally waking up. It sits at 0.08142 after a nice green 4h candle. RSI is near 57 so momentum is turning up. MACD is still a bit weak though. Best support is 0.07582 and then 0.07147 below it. First resistance is 0.08605 and the bigger one is 0.08884. I would wait for a close above 0.08605 before buying. The big dump from 0.10423 was ugly so be patient. Fake pumps happen often so use a stop loss.
#BinanceUpdatesProofofReservesAddresses #AnalyseCrypto
$BIRB
is finally waking up. It sits at 0.08142 after a nice green 4h candle. RSI is near 57 so momentum is turning up. MACD is still a bit weak though. Best support is 0.07582 and then 0.07147 below it. First resistance is 0.08605 and the bigger one is 0.08884. I would wait for a close above 0.08605 before buying. The big dump from 0.10423 was ugly so be patient. Fake pumps happen often so use a stop loss.
#BinanceUpdatesProofofReservesAddresses #AnalyseCrypto
is finally waking up. It sits at 0.08142 after a nice green 4h candle. RSI is near 57 so momentum is turning up. MACD is still a bit weak though. Best support is 0.07582 and then 0.07147 below it. First resistance is 0.08605 and the bigger one is 0.08884. I would wait for a close above 0.08605 before buying. The big dump from 0.10423 was ugly so be patient. Fake pumps happen often so use a stop loss.
#BinanceUpdatesProofofReservesAddresses #AnalyseCrypto
6
633
·
--
Bullish
$UAI
{future}(UAIUSDT)
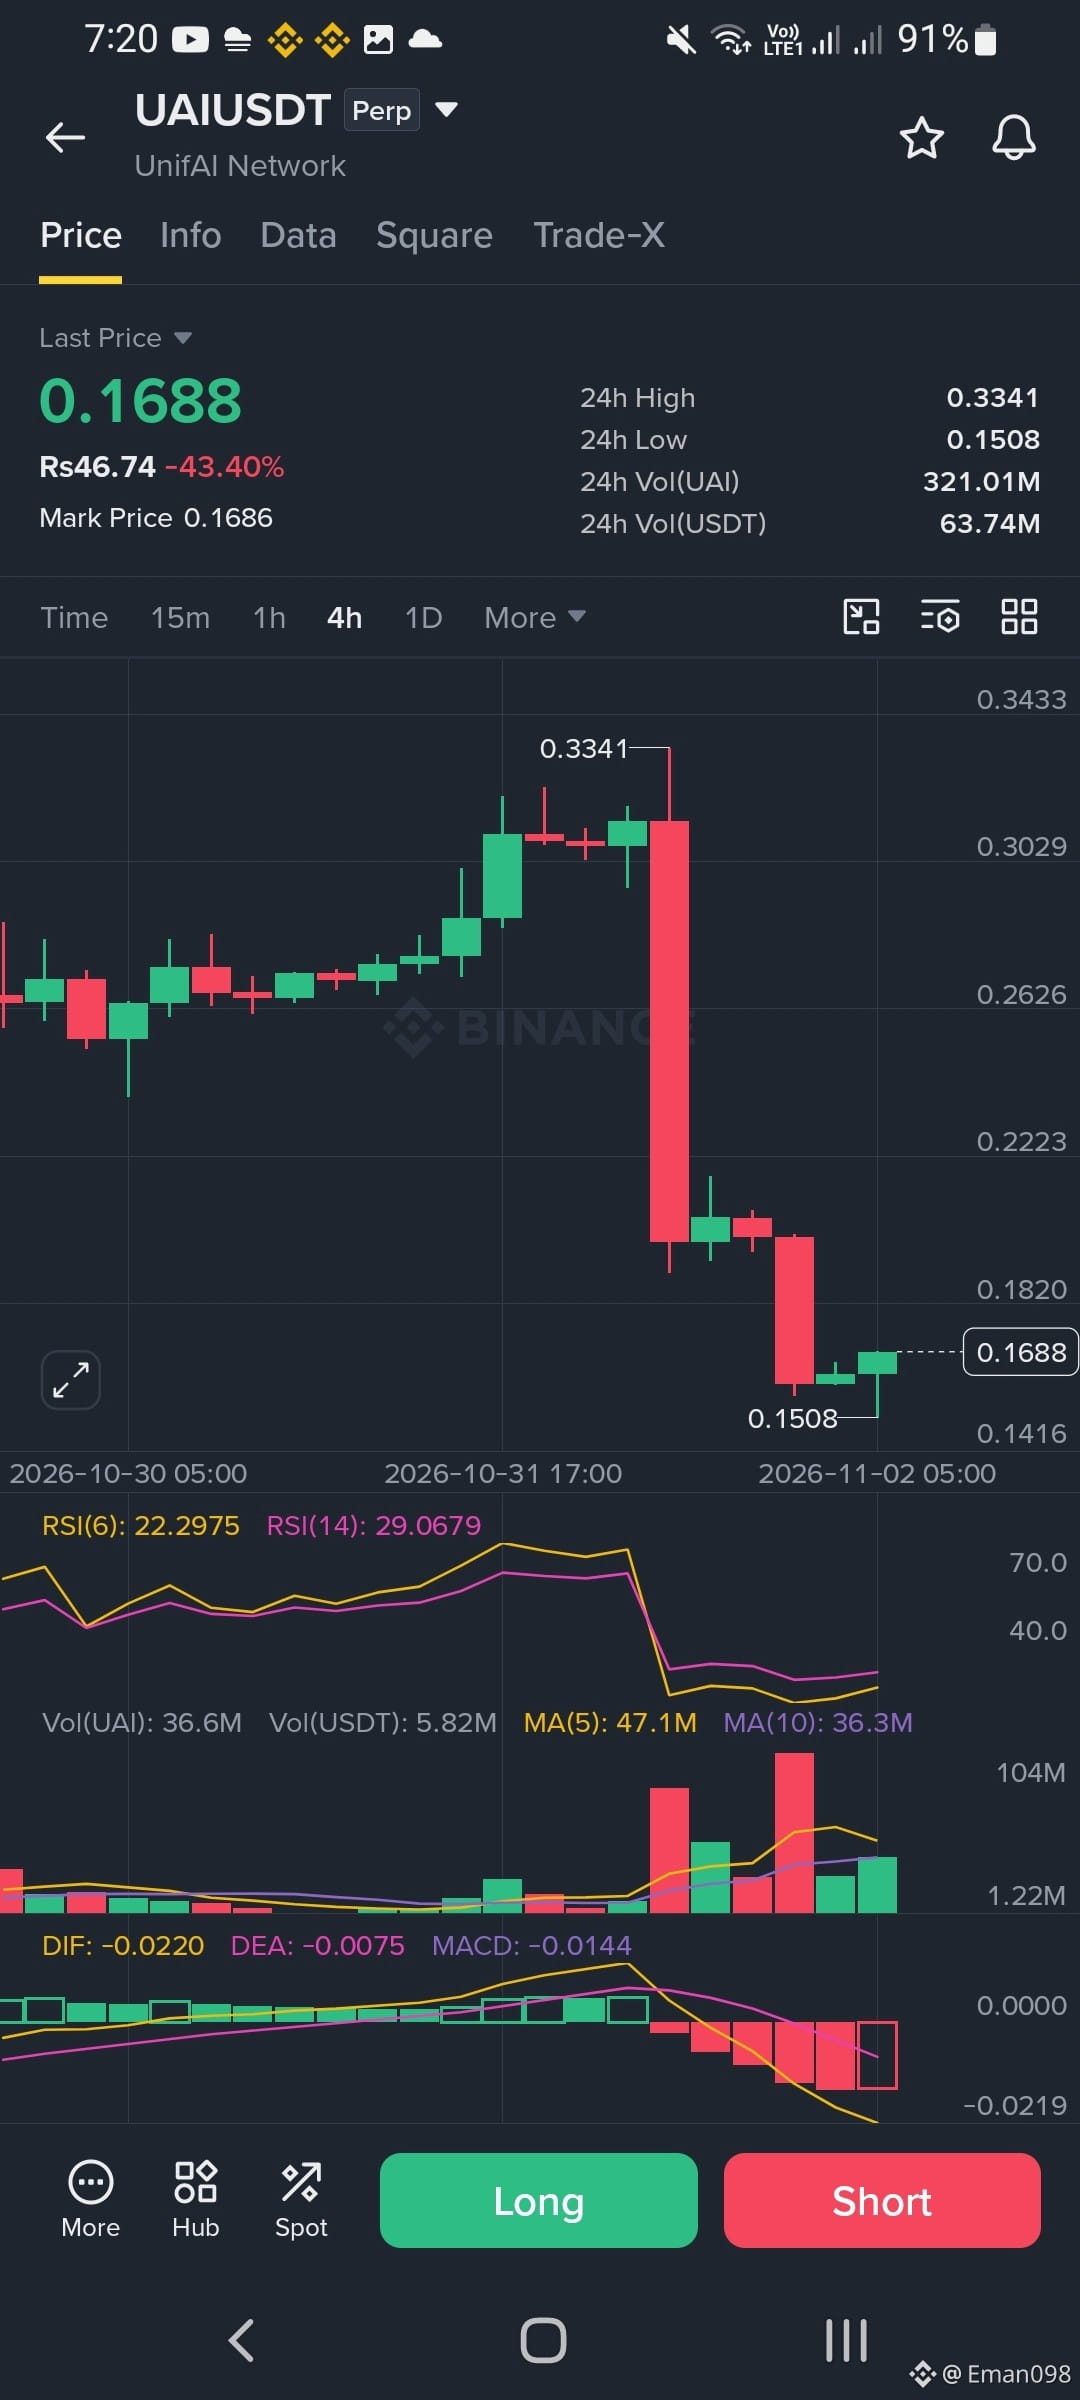
It dumped 43 percent in one day and now sits at 0.1688 after wicking down to 0.1508. That huge red 4h candle came right after the 0.3341 top. RSI is around 22 so it is oversold and a bounce is possible. MACD still points down though. Best support is 0.1508 and then 0.1416 below it. First resistance is 0.1820 and the bigger one is 0.2223. I would wait for a close above 0.1820 before getting excited. Falling knives cut hands so keep your size small and use a stop loss.
$UAI
It dumped 43 percent in one day and now sits at 0.1688 after wicking down to 0.1508. That huge red 4h candle came right after the 0.3341 top. RSI is around 22 so it is oversold and a bounce is possible. MACD still points down though. Best support is 0.1508 and then 0.1416 below it. First resistance is 0.1820 and the bigger one is 0.2223. I would wait for a close above 0.1820 before getting excited. Falling knives cut hands so keep your size small and use a stop loss.
It dumped 43 percent in one day and now sits at 0.1688 after wicking down to 0.1508. That huge red 4h candle came right after the 0.3341 top. RSI is around 22 so it is oversold and a bounce is possible. MACD still points down though. Best support is 0.1508 and then 0.1416 below it. First resistance is 0.1820 and the bigger one is 0.2223. I would wait for a close above 0.1820 before getting excited. Falling knives cut hands so keep your size small and use a stop loss.
3
518
·
--
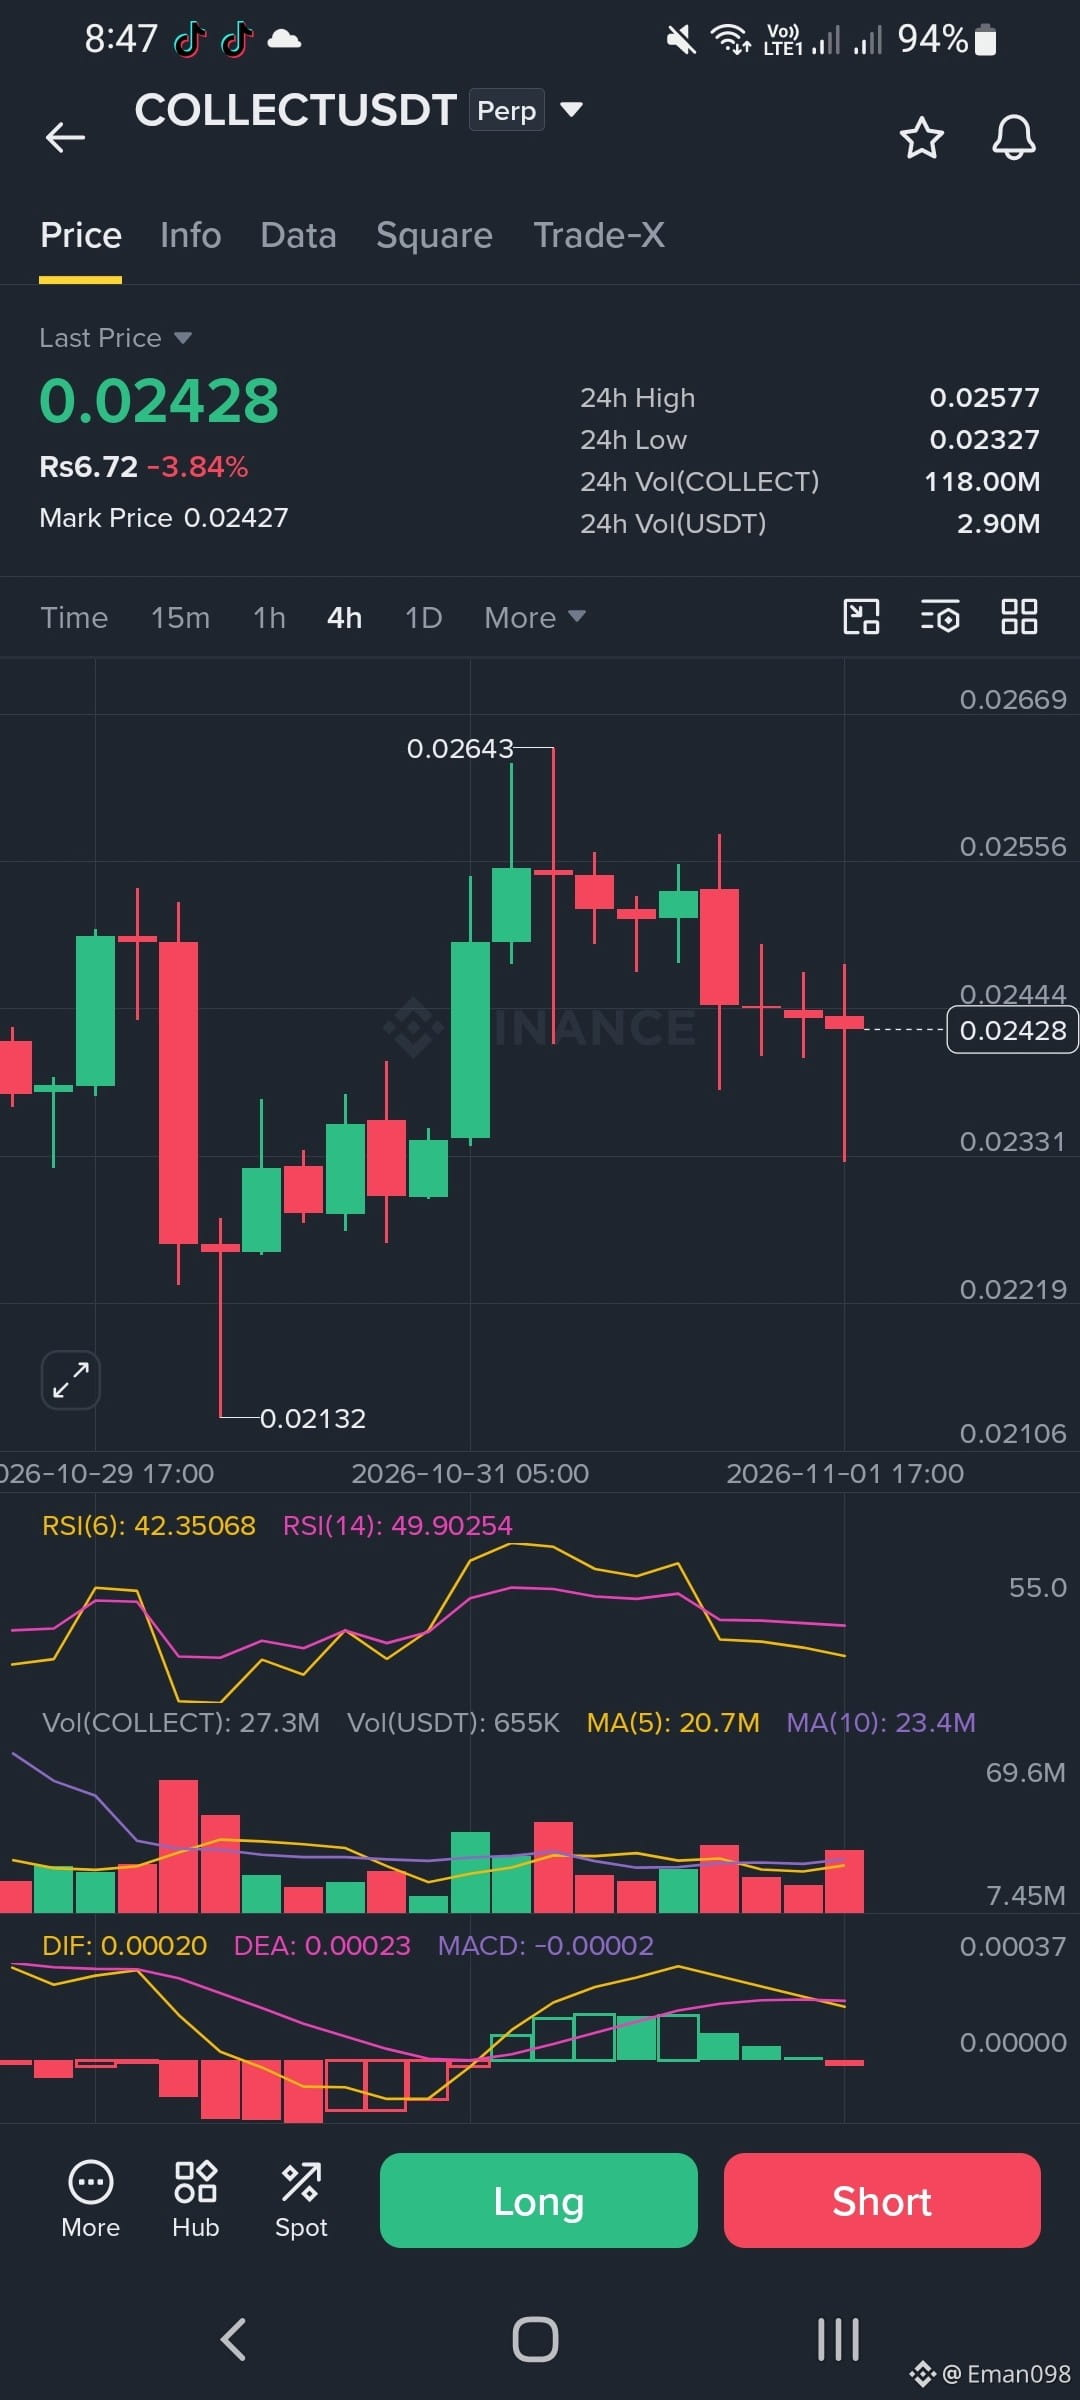
Okay so COLLECT on the 4h looks tired now. Price sits at 0.02428 after sliding from the 0.02643 top. RSI is around 42 and MACD turned red so sellers have a bit of control. Nearest support is 0.02327 and if that breaks I would watch 0.02132 as the big floor. Resistance sits at 0.02556 first then 0.02643 above it. I would not chase anything here. Wait for a clean bounce or a breakdown. Trading perps can wipe your account fast.
$COLLECT
{future}(COLLECTUSDT)
Okay so COLLECT on the 4h looks tired now. Price sits at 0.02428 after sliding from the 0.02643 top. RSI is around 42 and MACD turned red so sellers have a bit of control. Nearest support is 0.02327 and if that breaks I would watch 0.02132 as the big floor. Resistance sits at 0.02556 first then 0.02643 above it. I would not chase anything here. Wait for a clean bounce or a breakdown. Trading perps can wipe your account fast.
$COLLECT
$COLLECT
6
938
·
--
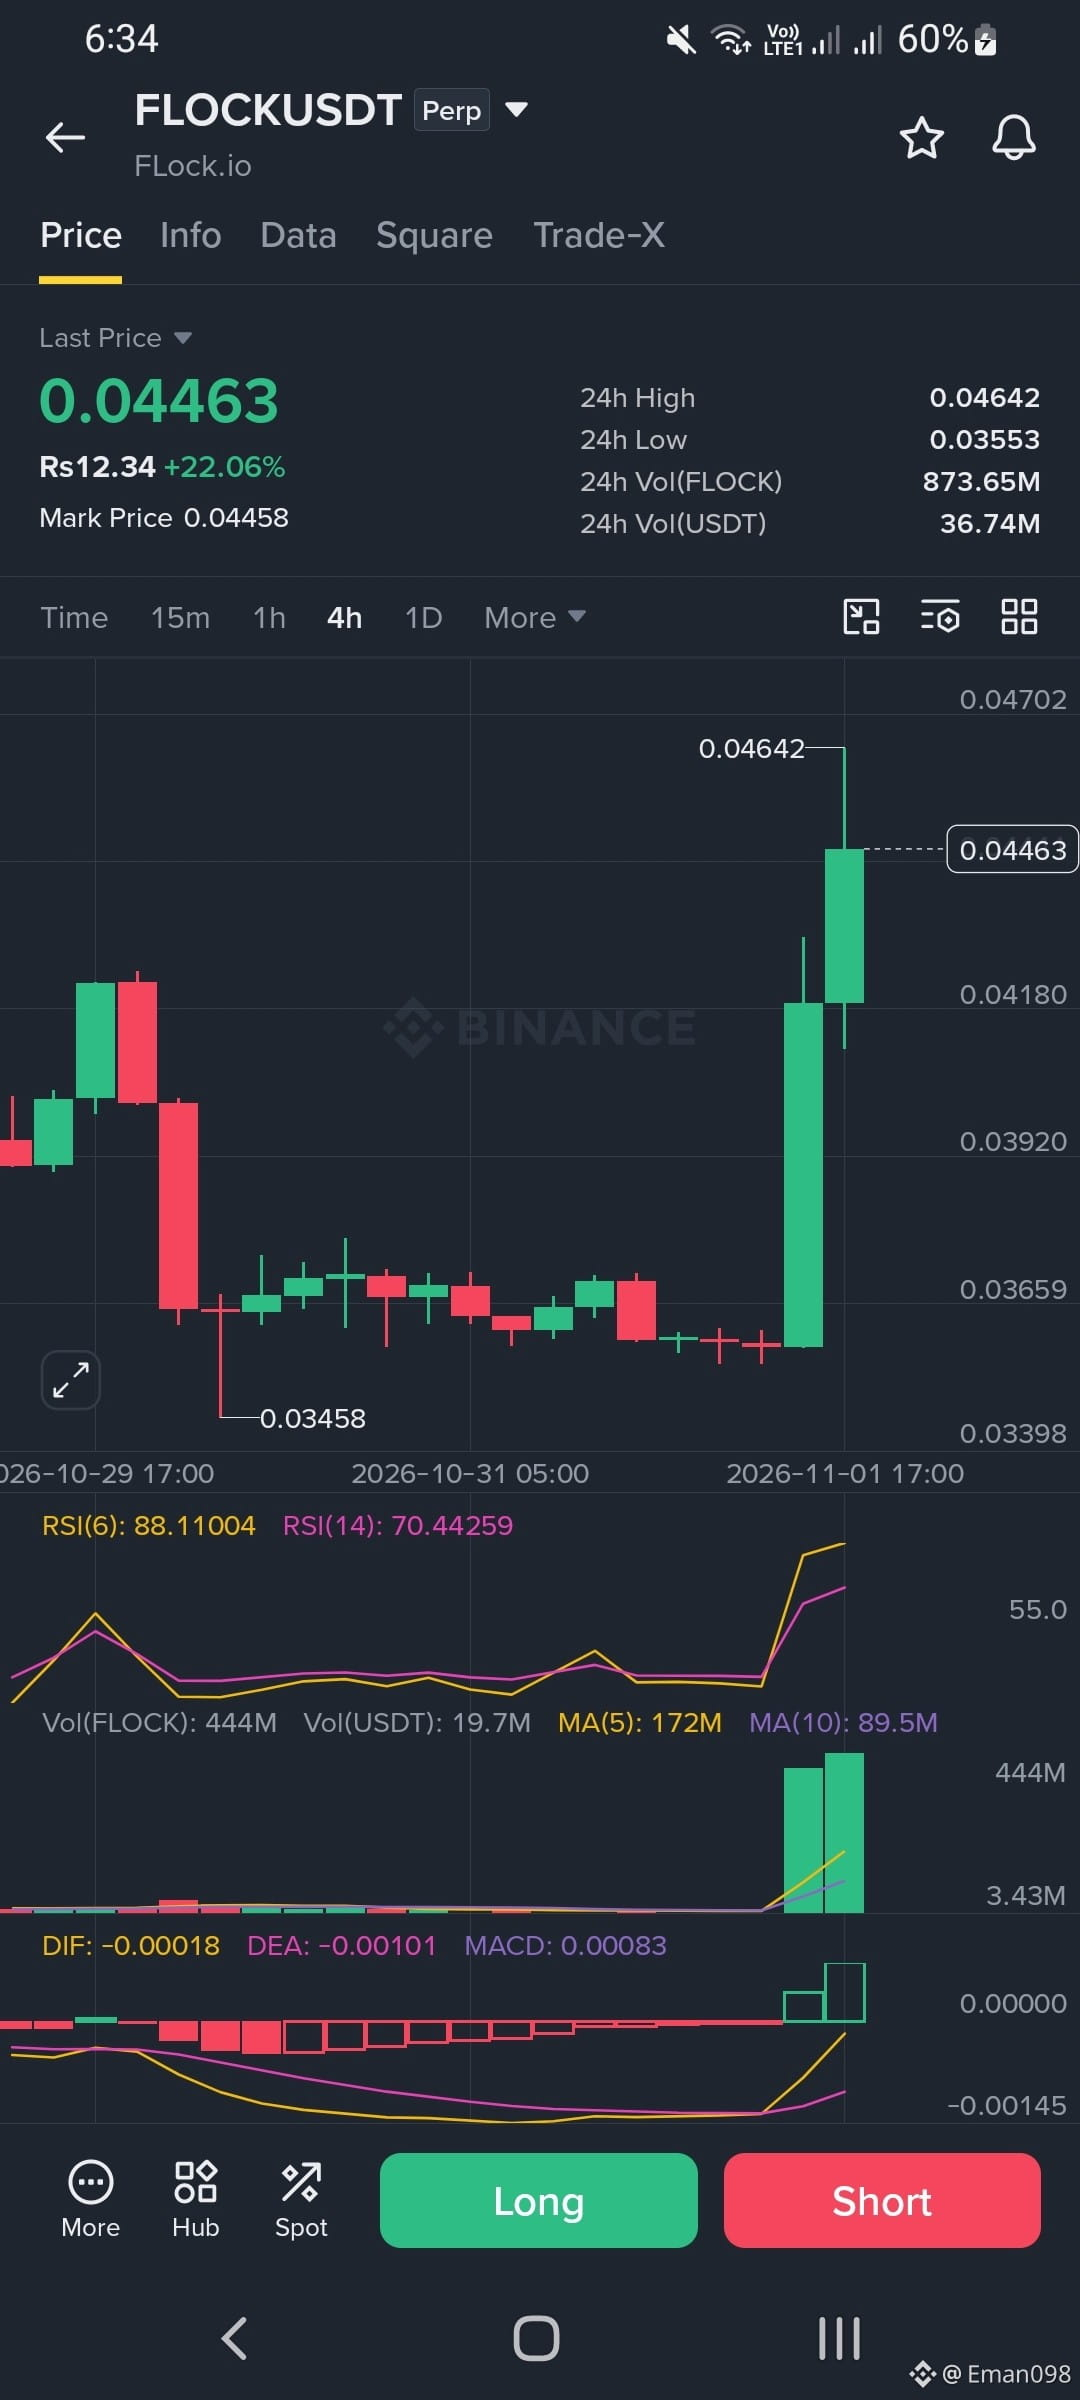
$FLOCK just ripped about 22 percent on the 4h chart and honestly it looks hot. Price sits at 0.04463 after a huge green candle with big volume behind it. RSI is 88 on the fast line so it is stretched. Best support is 0.04180 and then 0.03920 if it dumps. Resistance is 0.04642 which is the recent high and a clean break opens 0.04702. I would not chase here. Wait for a small pullback toward 0.04180 and watch how it reacts. Pumps like this can reverse fast so use a tight stop.
$FLOCK
#AnalyseCrypto
$FLOCK just ripped about 22 percent on the 4h chart and honestly it looks hot. Price sits at 0.04463 after a huge green candle with big volume behind it. RSI is 88 on the fast line so it is stretched. Best support is 0.04180 and then 0.03920 if it dumps. Resistance is 0.04642 which is the recent high and a clean break opens 0.04702. I would not chase here. Wait for a small pullback toward 0.04180 and watch how it reacts. Pumps like this can reverse fast so use a tight stop.
$FLOCK
#AnalyseCrypto
$FLOCK
#AnalyseCrypto
5
489
Log in to explore more content
Join global crypto users on Binance Square
⚡️ Get latest and useful information about crypto.
💬 Trusted by the world’s largest crypto exchange.
👍 Discover real insights from verified creators.
Email / Phone number
Trending Topics
HotCPIDecemberHikePriced
99,947 views
1,181 Discussing
CPI Market Watch | US CPI Rises 0.4% in October, Hotter Than 0.3% Forecast
Binance News
·27 Likes
·41.5k views
AnthropicRejectsIPODelayValuationinQuestion
224,520 views
1,871 Discussing
CanNvidiaEarningsEaseMarketConcerns?
37,556 views
544 Discussing