

CryptoPrime
1.2k Posts

CryptoPrime
Report
Block User
CryptoPrime. Trading company.

Level 1 Creator

BTC Holder
Occasional Trader
6.5 Years
7 Following
15.0K+ Followers
30.9K+ Liked
1 Badges
Posts
All
Videos
·
--
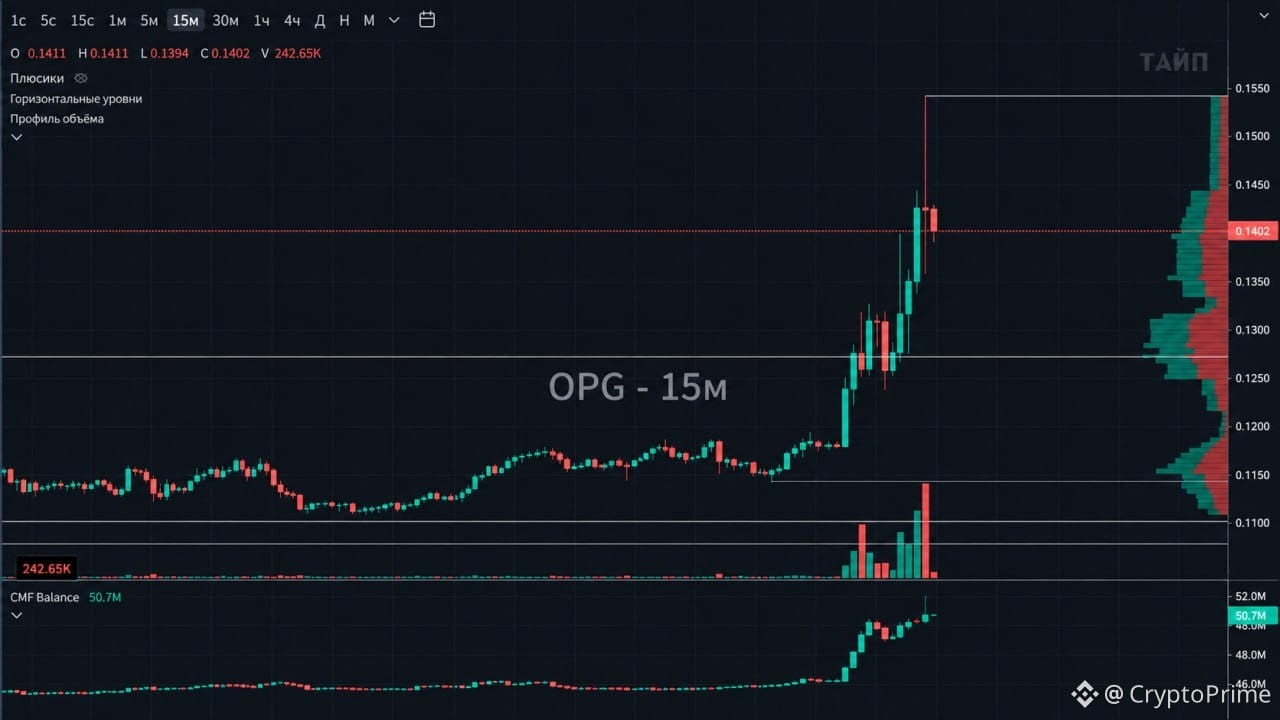
⚡️ COIN IN THE GAME: #opgusdt 🟢
#opgusdt on 15M right now fully lives up to its name — a real CryptoPrime organized crime group 😄
After a strong impulse, volatility has spiked sharply. Large, dense orders regularly appear in the order book: sometimes they support the price, and sometimes they start pushing it in the opposite direction.
So here it’s more interesting not to try to predict a big move, but to trade based on the price reaction in the moment.
What we see:
— price around 0.140
— a strong impulse from the 0.118 area
— open interest has increased noticeably
— in the order book, large liquidity levels are actively appearing and being moved around
📈 With this kind of volatility, individual moves can deliver around 3–4%. One working approach is to look for a reaction from a liquidity level, with a short stop just beyond it.
That’s exactly the kind of situations the guys analyze in practice: order book → liquidity level → reaction → trade, without trying to guess in advance where the coin will fly next.
⚠️ Liquidity levels can be removed and rearranged quickly, so chasing an impulse that already happened here is especially dangerous.
This is not a signal. Entry point, stop, and volume are determined by each person’s own system.
More breakdowns, coins in the game, and live market situations — in our Discord and in the practice group
{future}(OPGUSDT)
⚡️ COIN IN THE GAME: #opgusdt 🟢
#opgusdt on 15M right now fully lives up to its name — a real CryptoPrime organized crime group 😄
After a strong impulse, volatility has spiked sharply. Large, dense orders regularly appear in the order book: sometimes they support the price, and sometimes they start pushing it in the opposite direction.
So here it’s more interesting not to try to predict a big move, but to trade based on the price reaction in the moment.
What we see:
— price around 0.140
— a strong impulse from the 0.118 area
— open interest has increased noticeably
— in the order book, large liquidity levels are actively appearing and being moved around
📈 With this kind of volatility, individual moves can deliver around 3–4%. One working approach is to look for a reaction from a liquidity level, with a short stop just beyond it.
That’s exactly the kind of situations the guys analyze in practice: order book → liquidity level → reaction → trade, without trying to guess in advance where the coin will fly next.
⚠️ Liquidity levels can be removed and rearranged quickly, so chasing an impulse that already happened here is especially dangerous.
This is not a signal. Entry point, stop, and volume are determined by each person’s own system.
More breakdowns, coins in the game, and live market situations — in our Discord and in the practice group
#opgusdt on 15M right now fully lives up to its name — a real CryptoPrime organized crime group 😄
After a strong impulse, volatility has spiked sharply. Large, dense orders regularly appear in the order book: sometimes they support the price, and sometimes they start pushing it in the opposite direction.
So here it’s more interesting not to try to predict a big move, but to trade based on the price reaction in the moment.
What we see:
— price around 0.140
— a strong impulse from the 0.118 area
— open interest has increased noticeably
— in the order book, large liquidity levels are actively appearing and being moved around
📈 With this kind of volatility, individual moves can deliver around 3–4%. One working approach is to look for a reaction from a liquidity level, with a short stop just beyond it.
That’s exactly the kind of situations the guys analyze in practice: order book → liquidity level → reaction → trade, without trying to guess in advance where the coin will fly next.
⚠️ Liquidity levels can be removed and rearranged quickly, so chasing an impulse that already happened here is especially dangerous.
This is not a signal. Entry point, stop, and volume are determined by each person’s own system.
More breakdowns, coins in the game, and live market situations — in our Discord and in the practice group
1
581
·
--
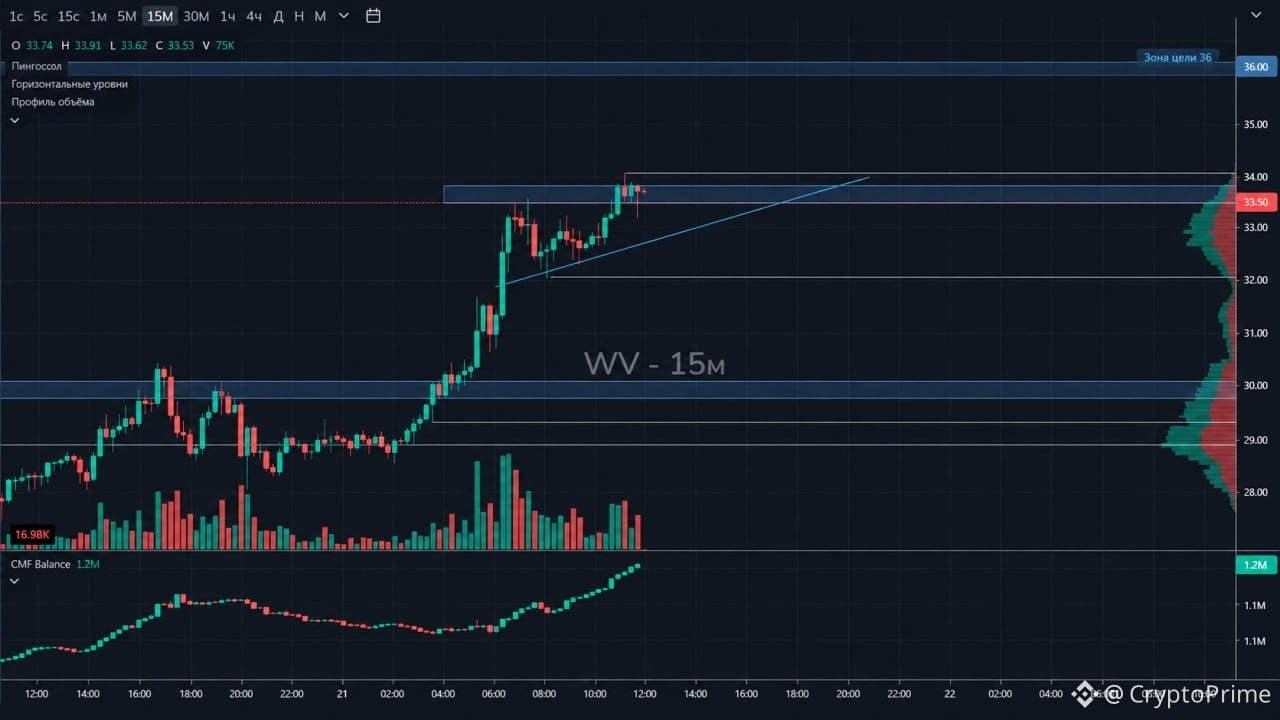
⚡️ COIN IN THE GAME: #VVVUSDT 🟢
With #VVVUSDT on 15M, after a strong impulse the price almost didn’t retrace and is now pressing up against resistance.
On the bottom, an ascending diagonal is holding; on top, a local boundary is forming—the structure looks like an ascending triangle.
At the same time, open interest is increasing. Now the key question is whether volumes will show up on the breakout.
What to look at:
— current price: around 33.5
— target on breakout: 36–37 — +7.5–10.4%
— support: 31.8–32.2 — −3.9–5.1%
📈 Scenario:
holding the structure → increase in volume → breakout of 33.6–34.0 → confirmation → 36–37.
Plus right now is that there hasn’t been a strong dump from the ATH, and open interest keeps rising.
⚠️ Losing the diagonal and dropping below 31.8–32.2 will noticeably weaken the long scenario.
This is not a signal. Entry point, stop-loss, and volume are defined by each person’s own system.
More breakdowns, coins in the game, and real market situations—in our Discord and in the practice group
{future}(VVVUSDT)
⚡️ COIN IN THE GAME: #VVVUSDT 🟢
With #VVVUSDT on 15M, after a strong impulse the price almost didn’t retrace and is now pressing up against resistance.
On the bottom, an ascending diagonal is holding; on top, a local boundary is forming—the structure looks like an ascending triangle.
At the same time, open interest is increasing. Now the key question is whether volumes will show up on the breakout.
What to look at:
— current price: around 33.5
— target on breakout: 36–37 — +7.5–10.4%
— support: 31.8–32.2 — −3.9–5.1%
📈 Scenario:
holding the structure → increase in volume → breakout of 33.6–34.0 → confirmation → 36–37.
Plus right now is that there hasn’t been a strong dump from the ATH, and open interest keeps rising.
⚠️ Losing the diagonal and dropping below 31.8–32.2 will noticeably weaken the long scenario.
This is not a signal. Entry point, stop-loss, and volume are defined by each person’s own system.
More breakdowns, coins in the game, and real market situations—in our Discord and in the practice group
With #VVVUSDT on 15M, after a strong impulse the price almost didn’t retrace and is now pressing up against resistance.
On the bottom, an ascending diagonal is holding; on top, a local boundary is forming—the structure looks like an ascending triangle.
At the same time, open interest is increasing. Now the key question is whether volumes will show up on the breakout.
What to look at:
— current price: around 33.5
— target on breakout: 36–37 — +7.5–10.4%
— support: 31.8–32.2 — −3.9–5.1%
📈 Scenario:
holding the structure → increase in volume → breakout of 33.6–34.0 → confirmation → 36–37.
Plus right now is that there hasn’t been a strong dump from the ATH, and open interest keeps rising.
⚠️ Losing the diagonal and dropping below 31.8–32.2 will noticeably weaken the long scenario.
This is not a signal. Entry point, stop-loss, and volume are defined by each person’s own system.
More breakdowns, coins in the game, and real market situations—in our Discord and in the practice group
730
·
--
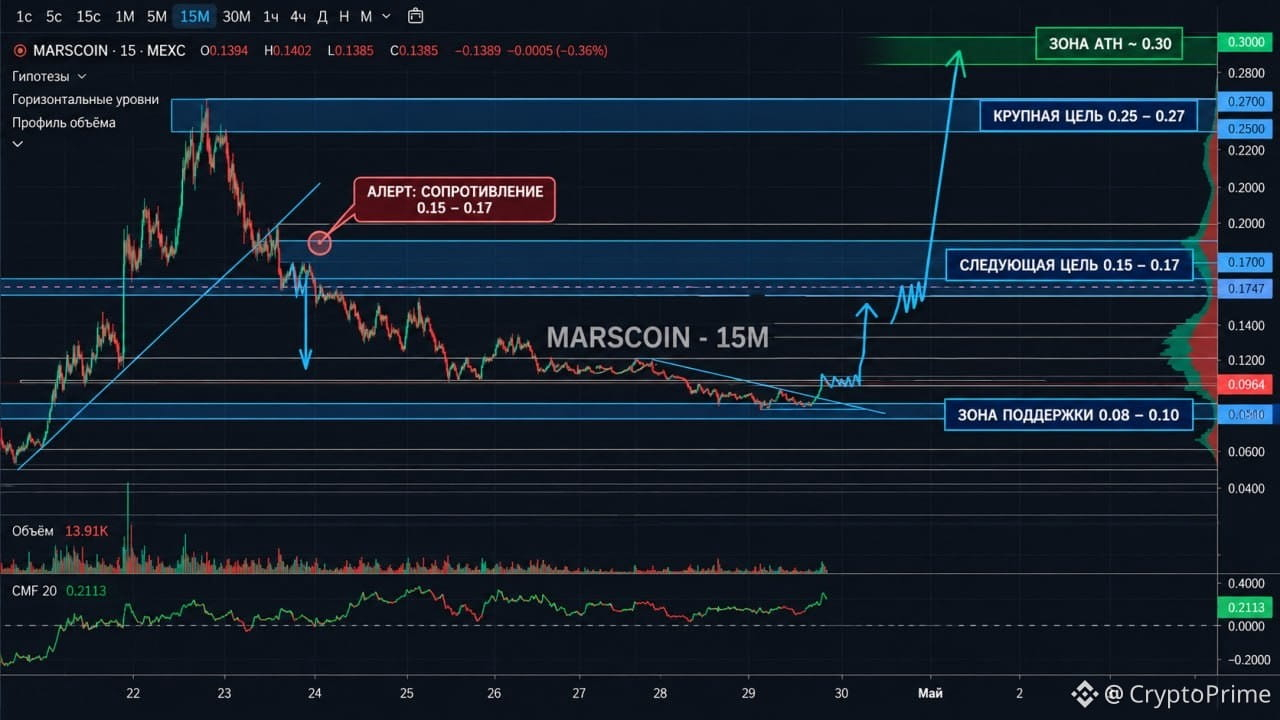
⚡️ COIN IN THE GAME: #marscoin 🟢
According to MARSCOIN, the long scenario on 15M looks more interesting right now.
Price is gradually squeezing up toward local resistance, while support is coming from a slanted line underneath. Here, you’d like to see not a sharp spike, but a normal accumulation/trading range under the level, followed by a consolidation above it.
What to look at:
— current zone: approximately 0.095–0.10
— next area: 0.15–0.17 — about +54–74% from the current zone
— major upper zone: 0.25–0.27 — about +156–177%
— potential move toward the ATH around 0.30 — roughly +208%
Main scenario:
squeeze → accumulation/range → breakout of resistance → consolidation above.
If the overall market is positive, then after breaking the current structure could continue the move toward the next zone.
⚠️ But today there’s an important risk — the meeting on the key interest rate.
On such events, even a good technical setup may not play out: volatility spikes, levels get pierced, and the direction can change quickly.
So today the main thing is not to guess the move in advance, but to wait for confirmation.
This is not a signal. The entry point, stop, and volume are defined by each person’s own system.
{future}(MARSCOINUSDT)
⚡️ COIN IN THE GAME: #marscoin 🟢
According to MARSCOIN, the long scenario on 15M looks more interesting right now.
Price is gradually squeezing up toward local resistance, while support is coming from a slanted line underneath. Here, you’d like to see not a sharp spike, but a normal accumulation/trading range under the level, followed by a consolidation above it.
What to look at:
— current zone: approximately 0.095–0.10
— next area: 0.15–0.17 — about +54–74% from the current zone
— major upper zone: 0.25–0.27 — about +156–177%
— potential move toward the ATH around 0.30 — roughly +208%
Main scenario:
squeeze → accumulation/range → breakout of resistance → consolidation above.
If the overall market is positive, then after breaking the current structure could continue the move toward the next zone.
⚠️ But today there’s an important risk — the meeting on the key interest rate.
On such events, even a good technical setup may not play out: volatility spikes, levels get pierced, and the direction can change quickly.
So today the main thing is not to guess the move in advance, but to wait for confirmation.
This is not a signal. The entry point, stop, and volume are defined by each person’s own system.
According to MARSCOIN, the long scenario on 15M looks more interesting right now.
Price is gradually squeezing up toward local resistance, while support is coming from a slanted line underneath. Here, you’d like to see not a sharp spike, but a normal accumulation/trading range under the level, followed by a consolidation above it.
What to look at:
— current zone: approximately 0.095–0.10
— next area: 0.15–0.17 — about +54–74% from the current zone
— major upper zone: 0.25–0.27 — about +156–177%
— potential move toward the ATH around 0.30 — roughly +208%
Main scenario:
squeeze → accumulation/range → breakout of resistance → consolidation above.
If the overall market is positive, then after breaking the current structure could continue the move toward the next zone.
⚠️ But today there’s an important risk — the meeting on the key interest rate.
On such events, even a good technical setup may not play out: volatility spikes, levels get pierced, and the direction can change quickly.
So today the main thing is not to guess the move in advance, but to wait for confirmation.
This is not a signal. The entry point, stop, and volume are defined by each person’s own system.
1k
·
--
⚡️ COIN IN THE GAME: #哈基米USDT 🟢
For Hakimi, the price has sliced through the descending diagonal and is now pressing against the nearest resistance level on the 5M timeframe. Under the level, local trading activity is gradually forming, but there are still not enough volumes to continue the move. Open interest is slowly increasing.
What we’re looking at:
— current price: about 0.039
— nearest resistance: roughly 0.0435–0.044 — about +11–13%
— the next important zone: about 0.055–0.057 — about +41–46%
— above that there is resistance around 0.069–0.071 — about +76–82%
— nearest support below: roughly 0.029–0.031
Main scenario:
holding the current local trading activity → breakout and consolidation above 0.0435–0.044 → movement toward the next resistance zone around 0.055–0.057.
After that, we’ll assess based on what actually happens. Near the second level, the price may either form new trading activity and continue moving, or dip down (“whipsaw”).
If trading activity appears already above the 0.055–0.057 zone, the next reference point will be the 0.069–0.071 area.
The scenario weakens if the price fails to hold the current structure and returns below the trading activity.
This is not a signal. Each person defines their own entry point using their own system.
Market situation breakdowns are in our Discord and in practice.
{future}(哈基米USDT)
⚡️ COIN IN THE GAME: #哈基米USDT 🟢
For Hakimi, the price has sliced through the descending diagonal and is now pressing against the nearest resistance level on the 5M timeframe. Under the level, local trading activity is gradually forming, but there are still not enough volumes to continue the move. Open interest is slowly increasing.
What we’re looking at:
— current price: about 0.039
— nearest resistance: roughly 0.0435–0.044 — about +11–13%
— the next important zone: about 0.055–0.057 — about +41–46%
— above that there is resistance around 0.069–0.071 — about +76–82%
— nearest support below: roughly 0.029–0.031
Main scenario:
holding the current local trading activity → breakout and consolidation above 0.0435–0.044 → movement toward the next resistance zone around 0.055–0.057.
After that, we’ll assess based on what actually happens. Near the second level, the price may either form new trading activity and continue moving, or dip down (“whipsaw”).
If trading activity appears already above the 0.055–0.057 zone, the next reference point will be the 0.069–0.071 area.
The scenario weakens if the price fails to hold the current structure and returns below the trading activity.
This is not a signal. Each person defines their own entry point using their own system.
Market situation breakdowns are in our Discord and in practice.
For Hakimi, the price has sliced through the descending diagonal and is now pressing against the nearest resistance level on the 5M timeframe. Under the level, local trading activity is gradually forming, but there are still not enough volumes to continue the move. Open interest is slowly increasing.
What we’re looking at:
— current price: about 0.039
— nearest resistance: roughly 0.0435–0.044 — about +11–13%
— the next important zone: about 0.055–0.057 — about +41–46%
— above that there is resistance around 0.069–0.071 — about +76–82%
— nearest support below: roughly 0.029–0.031
Main scenario:
holding the current local trading activity → breakout and consolidation above 0.0435–0.044 → movement toward the next resistance zone around 0.055–0.057.
After that, we’ll assess based on what actually happens. Near the second level, the price may either form new trading activity and continue moving, or dip down (“whipsaw”).
If trading activity appears already above the 0.055–0.057 zone, the next reference point will be the 0.069–0.071 area.
The scenario weakens if the price fails to hold the current structure and returns below the trading activity.
This is not a signal. Each person defines their own entry point using their own system.
Market situation breakdowns are in our Discord and in practice.

2
1.1k
·
--
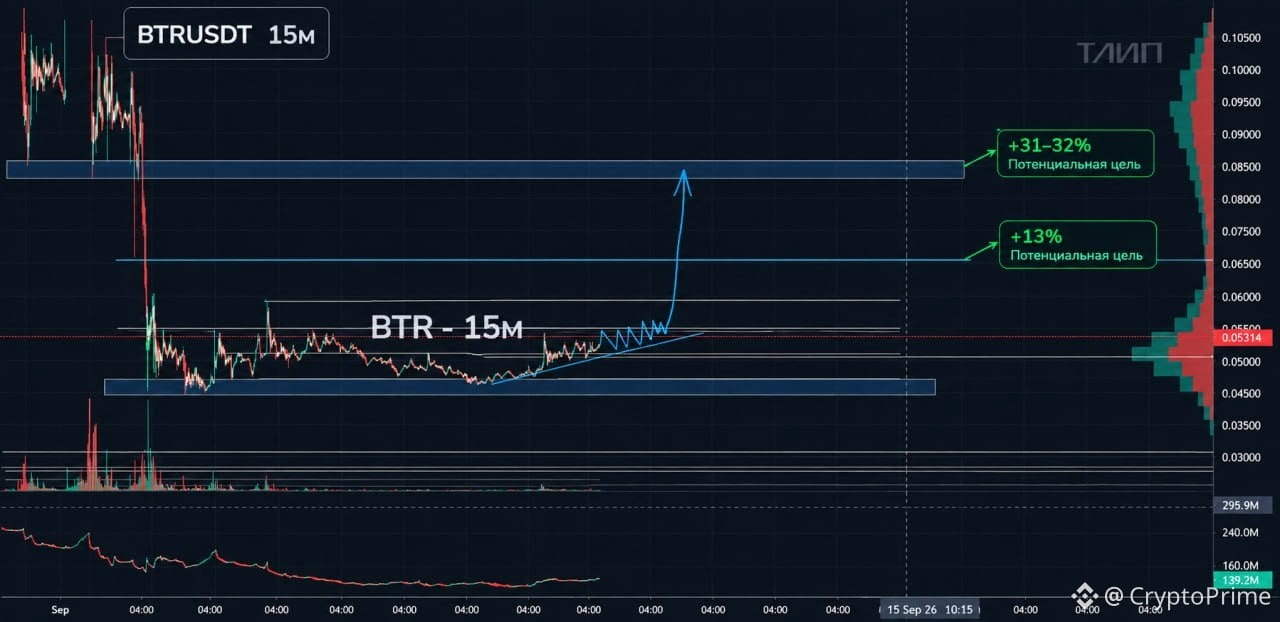
⚡️ COIN IN THE GAME: #BTRusdt 🟢
On BTR, orderflow is currently forming near the nearest resistance on the 15M timeframe, while from below the price is gradually being squeezed by an ascending diagonal. In terms of structure, this looks like a classic ascending triangle.
What to look for:
— current price: around 0.0531
— nearest upper boundary: about 0.0545–0.0550 — roughly +2.5–3.5%
— above that there’s a zone around 0.060 — about +13%
— separately, the level 0.06999 is interesting — potentially around +31–32% from the current price
— from below, the ascending diagonal and a local zone at 0.049–0.050 are working
Main scenario:
holding the diagonal → further squeeze under resistance → breakout and consolidation above it → movement toward 0.060.
If the impulse is strong and the price keeps pushing higher, then you can further look at the overlap of the zone around 0.07.
If the diagonal is lost and the price returns below the current orderflow area, the long scenario will weaken significantly. The next important support is around 0.043–0.044.
This is not a signal. The entry point, stop, and volume—everyone determines them according to their own system.
More breakdowns, coins in the game, and real market situations—on our Discord and in the group with practice.
{future}(BTRUSDT)
⚡️ COIN IN THE GAME: #BTRusdt 🟢
On BTR, orderflow is currently forming near the nearest resistance on the 15M timeframe, while from below the price is gradually being squeezed by an ascending diagonal. In terms of structure, this looks like a classic ascending triangle.
What to look for:
— current price: around 0.0531
— nearest upper boundary: about 0.0545–0.0550 — roughly +2.5–3.5%
— above that there’s a zone around 0.060 — about +13%
— separately, the level 0.06999 is interesting — potentially around +31–32% from the current price
— from below, the ascending diagonal and a local zone at 0.049–0.050 are working
Main scenario:
holding the diagonal → further squeeze under resistance → breakout and consolidation above it → movement toward 0.060.
If the impulse is strong and the price keeps pushing higher, then you can further look at the overlap of the zone around 0.07.
If the diagonal is lost and the price returns below the current orderflow area, the long scenario will weaken significantly. The next important support is around 0.043–0.044.
This is not a signal. The entry point, stop, and volume—everyone determines them according to their own system.
More breakdowns, coins in the game, and real market situations—on our Discord and in the group with practice.
On BTR, orderflow is currently forming near the nearest resistance on the 15M timeframe, while from below the price is gradually being squeezed by an ascending diagonal. In terms of structure, this looks like a classic ascending triangle.
What to look for:
— current price: around 0.0531
— nearest upper boundary: about 0.0545–0.0550 — roughly +2.5–3.5%
— above that there’s a zone around 0.060 — about +13%
— separately, the level 0.06999 is interesting — potentially around +31–32% from the current price
— from below, the ascending diagonal and a local zone at 0.049–0.050 are working
Main scenario:
holding the diagonal → further squeeze under resistance → breakout and consolidation above it → movement toward 0.060.
If the impulse is strong and the price keeps pushing higher, then you can further look at the overlap of the zone around 0.07.
If the diagonal is lost and the price returns below the current orderflow area, the long scenario will weaken significantly. The next important support is around 0.043–0.044.
This is not a signal. The entry point, stop, and volume—everyone determines them according to their own system.
More breakdowns, coins in the game, and real market situations—on our Discord and in the group with practice.
1
1k
·
--
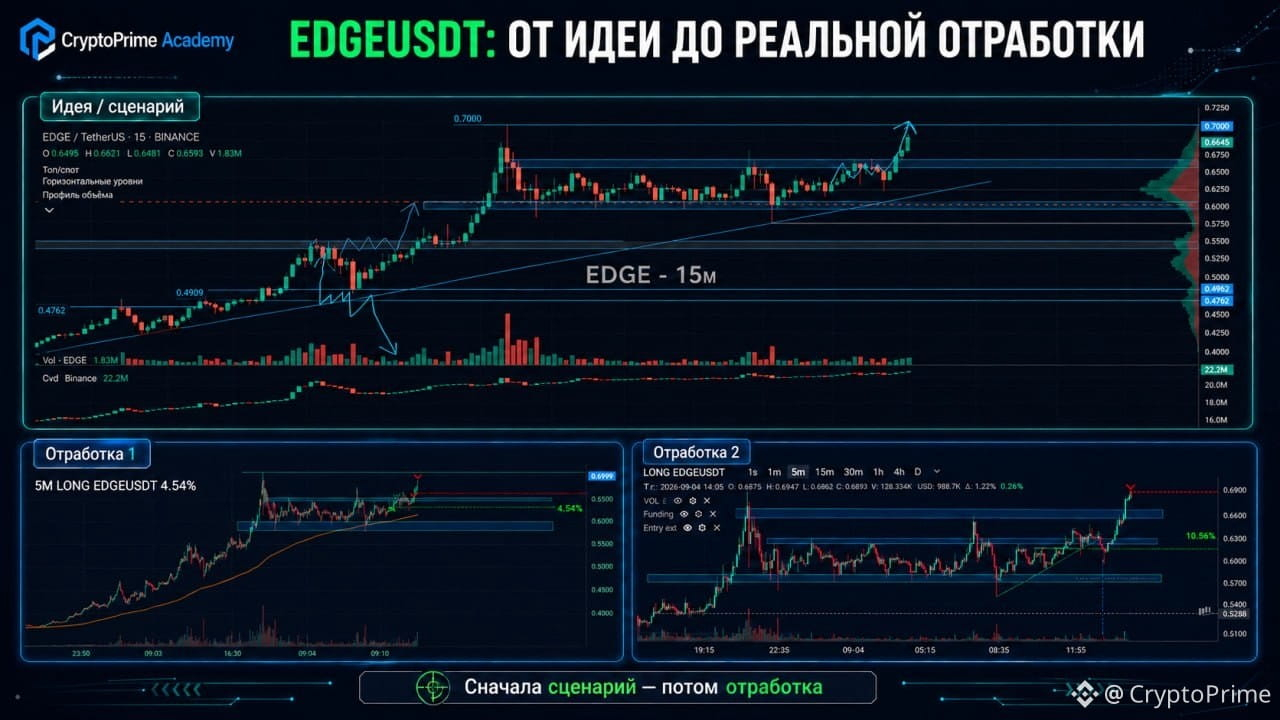
EDGE: FROM IDEA TO REAL HANDS-ON PRACTICE 🟢
Guys, we try to make sure that everything we talk about in the channel remains more than just theory.
In Practice, the core team—together with the guys—trades online: we hold briefings in Discord, we look at interesting situations in advance, we discuss scenarios, and only then we work them out on the market.
Today’s a good example—#EDGEUSDT .
First, the coin was flagged in advance and we observed its structure. Then the real practice started: in the screenshots above—trades made by the core team guys and Practice participants.
One of the guys managed to work the move out almost up to the local high. In other examples, you can also see how the same instrument can be taken from your own point and your own scenario.
And that’s exactly the essence of our approach:
we spotted the situation → made a plan → waited for the conditions → traded it ourselves.
For the most part, it’s about practicing trading, not endless graph studying in theory.
More details on how Practice is set up, briefings, and joint trading are in our tg channel.
{future}(EDGEUSDT)
EDGE: FROM IDEA TO REAL HANDS-ON PRACTICE 🟢
Guys, we try to make sure that everything we talk about in the channel remains more than just theory.
In Practice, the core team—together with the guys—trades online: we hold briefings in Discord, we look at interesting situations in advance, we discuss scenarios, and only then we work them out on the market.
Today’s a good example—#EDGEUSDT .
First, the coin was flagged in advance and we observed its structure. Then the real practice started: in the screenshots above—trades made by the core team guys and Practice participants.
One of the guys managed to work the move out almost up to the local high. In other examples, you can also see how the same instrument can be taken from your own point and your own scenario.
And that’s exactly the essence of our approach:
we spotted the situation → made a plan → waited for the conditions → traded it ourselves.
For the most part, it’s about practicing trading, not endless graph studying in theory.
More details on how Practice is set up, briefings, and joint trading are in our tg channel.
Guys, we try to make sure that everything we talk about in the channel remains more than just theory.
In Practice, the core team—together with the guys—trades online: we hold briefings in Discord, we look at interesting situations in advance, we discuss scenarios, and only then we work them out on the market.
Today’s a good example—#EDGEUSDT .
First, the coin was flagged in advance and we observed its structure. Then the real practice started: in the screenshots above—trades made by the core team guys and Practice participants.
One of the guys managed to work the move out almost up to the local high. In other examples, you can also see how the same instrument can be taken from your own point and your own scenario.
And that’s exactly the essence of our approach:
we spotted the situation → made a plan → waited for the conditions → traded it ourselves.
For the most part, it’s about practicing trading, not endless graph studying in theory.
More details on how Practice is set up, briefings, and joint trading are in our tg channel.
1
760
·
--
⚡️ COIN IN THE GAME: $ 🟢
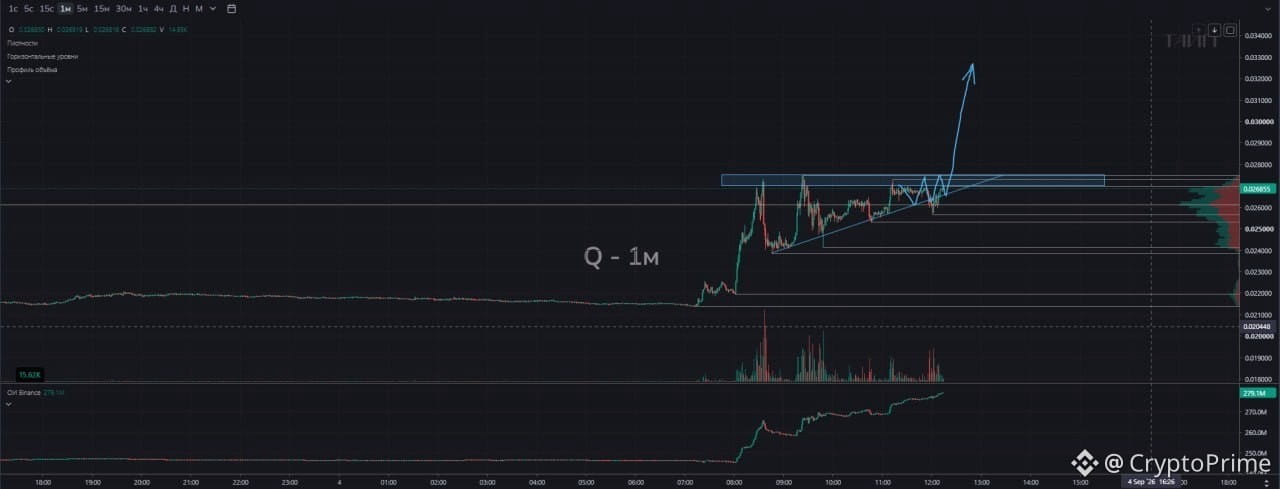
Right now on Q an ascending triangle is being formed on the 1M timeframe. Before that, there was a small stop-hunt move, after which the price was pushed back into the structure.
What to look at:
— current price: around 0.0268–0.0269
— resistance: 0.0273–0.0276 — roughly +1.7–2.8%
— an upward slanted channel is working from below
— structure: accumulation → squeeze toward local highs
— potential upper zone: 0.032–0.033 — roughly +19–23% from the current price
Main scenario:
holding the slanted line → further squeeze → breakout of resistance and consolidation above.
In terms of volume, the situation is still weak, so what’s more interesting here is a possible quick spike if additional activity appears.
Keep in mind the timeframe: it’s 1 minute, so the situation can change literally within a few candles. And even if the farther zone offers about +20%, on such a timeframe you should not count on it being reliably worked out.
If the slanted line is lost and the price drops back below the current accumulation area, the scenario will weaken.
This is not a signal. The entry point, stop, and volume are determined by each person’s own system.
More analyses, coins in the game, and live market situations — in our Discord and TG channel.
⚡️ COIN IN THE GAME: $ 🟢
Right now on Q an ascending triangle is being formed on the 1M timeframe. Before that, there was a small stop-hunt move, after which the price was pushed back into the structure.
What to look at:
— current price: around 0.0268–0.0269
— resistance: 0.0273–0.0276 — roughly +1.7–2.8%
— an upward slanted channel is working from below
— structure: accumulation → squeeze toward local highs
— potential upper zone: 0.032–0.033 — roughly +19–23% from the current price
Main scenario:
holding the slanted line → further squeeze → breakout of resistance and consolidation above.
In terms of volume, the situation is still weak, so what’s more interesting here is a possible quick spike if additional activity appears.
Keep in mind the timeframe: it’s 1 minute, so the situation can change literally within a few candles. And even if the farther zone offers about +20%, on such a timeframe you should not count on it being reliably worked out.
If the slanted line is lost and the price drops back below the current accumulation area, the scenario will weaken.
This is not a signal. The entry point, stop, and volume are determined by each person’s own system.
More analyses, coins in the game, and live market situations — in our Discord and TG channel.
Right now on Q an ascending triangle is being formed on the 1M timeframe. Before that, there was a small stop-hunt move, after which the price was pushed back into the structure.
What to look at:
— current price: around 0.0268–0.0269
— resistance: 0.0273–0.0276 — roughly +1.7–2.8%
— an upward slanted channel is working from below
— structure: accumulation → squeeze toward local highs
— potential upper zone: 0.032–0.033 — roughly +19–23% from the current price
Main scenario:
holding the slanted line → further squeeze → breakout of resistance and consolidation above.
In terms of volume, the situation is still weak, so what’s more interesting here is a possible quick spike if additional activity appears.
Keep in mind the timeframe: it’s 1 minute, so the situation can change literally within a few candles. And even if the farther zone offers about +20%, on such a timeframe you should not count on it being reliably worked out.
If the slanted line is lost and the price drops back below the current accumulation area, the scenario will weaken.
This is not a signal. The entry point, stop, and volume are determined by each person’s own system.
More analyses, coins in the game, and live market situations — in our Discord and TG channel.
1
342
·
--
⚡️ COIN IN THE GAME: UAIUSDT 🟢
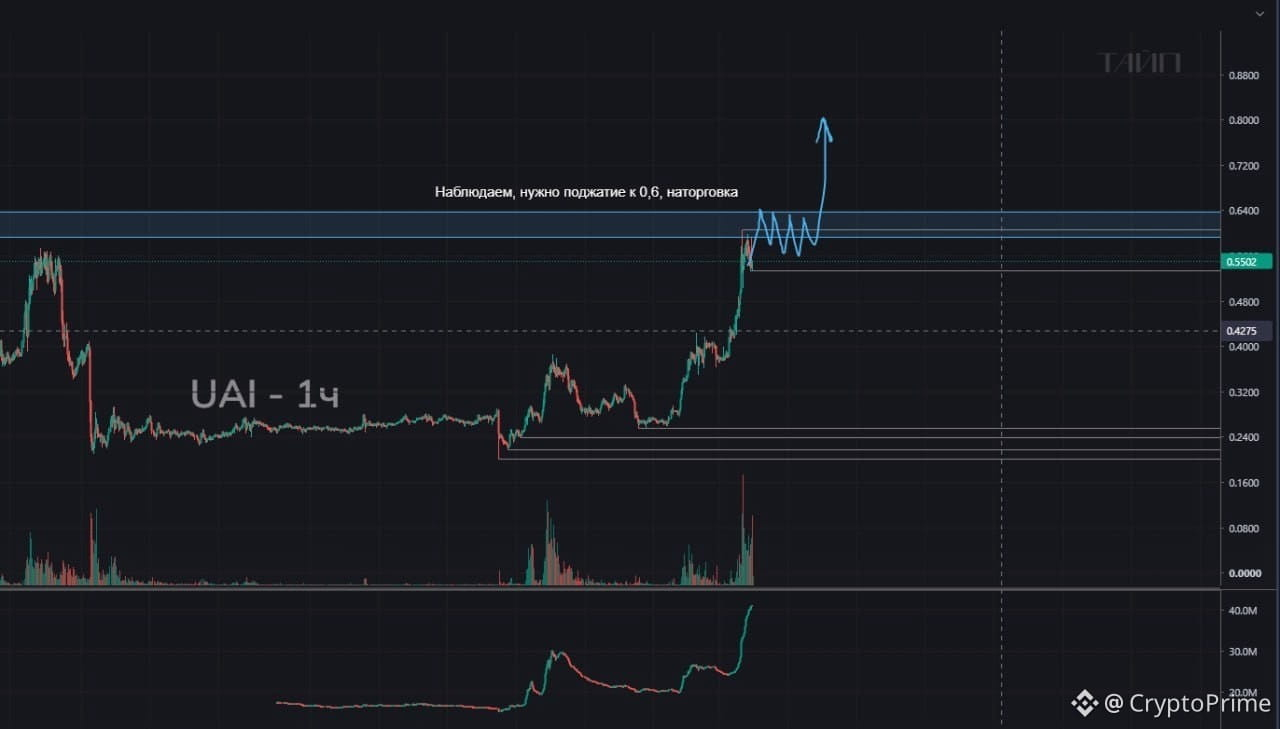
UAI has already given a strong push and has approached an important resistance zone. Right now, it’s more interesting not to chase the move, but to see whether the price can squeeze down to 0.60 and form a range under the level.
What to look at:
— current price: about 0.55
— resistance: 0.60–0.64
— local support: 0.52–0.54
— potential target: 0.78–0.80
— OI rose sharply along with the impulse
Main scenario:
hold → squeeze to 0.60 → range/trading consolidation → breakout and closing above.
If resistance can be broken, the next major area of interest is 0.78–0.80, about +30% from the 0.60 zone.
After such a quick rise, it’s important to see a normal consolidation—not to enter right after the impulse.
If the price loses the current area, the scenario will have to be reconsidered.
This is not a signal. Entry point, stop, and volume are determined by each person’s own system.
More analyses, coins in the game, and live market situations—in our Discord and in the group with practical sessions
$UAI
{future}(UAIUSDT)
⚡️ COIN IN THE GAME: UAIUSDT 🟢
UAI has already given a strong push and has approached an important resistance zone. Right now, it’s more interesting not to chase the move, but to see whether the price can squeeze down to 0.60 and form a range under the level.
What to look at:
— current price: about 0.55
— resistance: 0.60–0.64
— local support: 0.52–0.54
— potential target: 0.78–0.80
— OI rose sharply along with the impulse
Main scenario:
hold → squeeze to 0.60 → range/trading consolidation → breakout and closing above.
If resistance can be broken, the next major area of interest is 0.78–0.80, about +30% from the 0.60 zone.
After such a quick rise, it’s important to see a normal consolidation—not to enter right after the impulse.
If the price loses the current area, the scenario will have to be reconsidered.
This is not a signal. Entry point, stop, and volume are determined by each person’s own system.
More analyses, coins in the game, and live market situations—in our Discord and in the group with practical sessions
$UAI
UAI has already given a strong push and has approached an important resistance zone. Right now, it’s more interesting not to chase the move, but to see whether the price can squeeze down to 0.60 and form a range under the level.
What to look at:
— current price: about 0.55
— resistance: 0.60–0.64
— local support: 0.52–0.54
— potential target: 0.78–0.80
— OI rose sharply along with the impulse
Main scenario:
hold → squeeze to 0.60 → range/trading consolidation → breakout and closing above.
If resistance can be broken, the next major area of interest is 0.78–0.80, about +30% from the 0.60 zone.
After such a quick rise, it’s important to see a normal consolidation—not to enter right after the impulse.
If the price loses the current area, the scenario will have to be reconsidered.
This is not a signal. Entry point, stop, and volume are determined by each person’s own system.
More analyses, coins in the game, and live market situations—in our Discord and in the group with practical sessions
$UAI
680
·
--
⚡️ COIN IN THE GAME: MAGMAUSDT 🟢
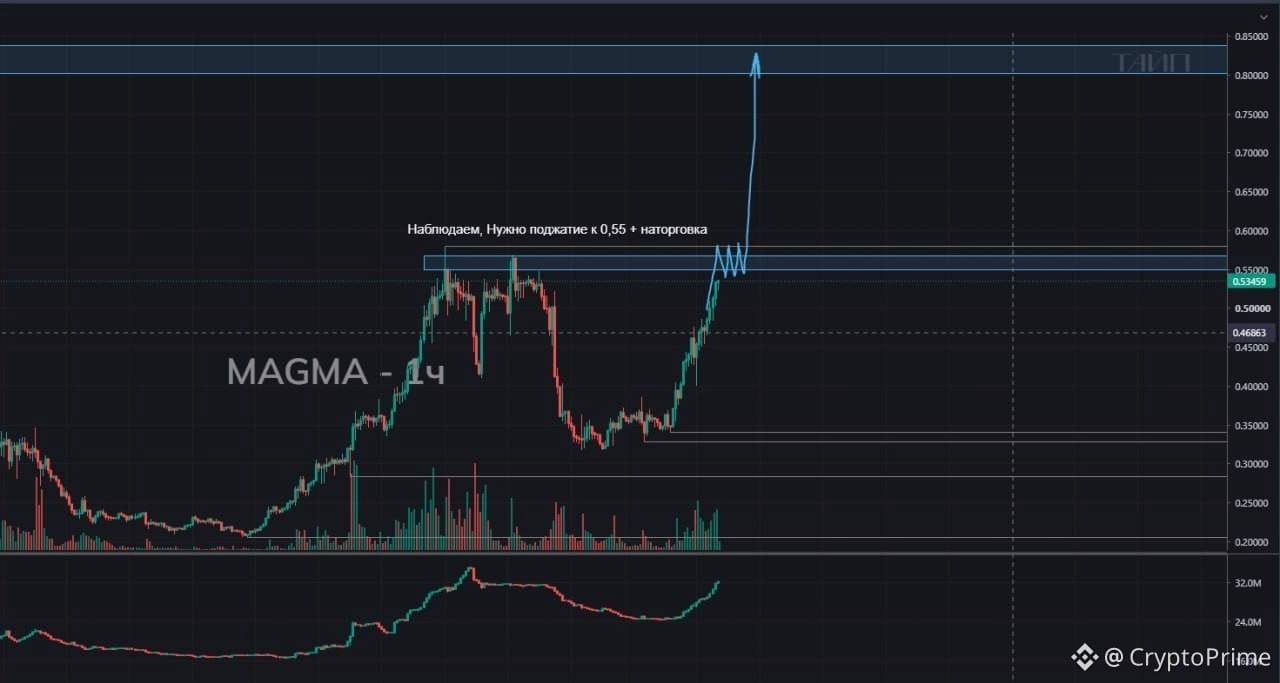
After a strong rebound, MAGMA has once again approached an important zone at 0.55–0.58. Right now, the most interesting thing is to see whether the price can squeeze up to resistance and form a proper trading range.
What we’re looking at:
— current price: around 0.53–0.54
— resistance zone: 0.55–0.58
— nearest support: 0.46–0.47 area
— deeper support: 0.33–0.35
— potential higher target: 0.80–0.84
— open interest is noticeably growing again
The most interesting scenario:
Squeeze to 0.55 → range trade under the level → breakout and consolidation above.
If this structure forms and resistance can be broken, the next major zone of interest becomes 0.80–0.84 — about +45% to +53% from the breakout area at 0.55.
For now, the key point isn’t the rise itself, but how the price behaves around 0.55–0.58. We need stability under the level, not just a single impulse.
If the price can’t hold near the current zone and starts to move back below, the scenario will have to be reconsidered.
This is not a signal. Entry point, stop-loss, and volume are defined by your own system.
More breakdowns, coins in the game, and real-time market situations — in our Discord and in the group with practice
$MAGMA
{future}(MAGMAUSDT)
⚡️ COIN IN THE GAME: MAGMAUSDT 🟢
After a strong rebound, MAGMA has once again approached an important zone at 0.55–0.58. Right now, the most interesting thing is to see whether the price can squeeze up to resistance and form a proper trading range.
What we’re looking at:
— current price: around 0.53–0.54
— resistance zone: 0.55–0.58
— nearest support: 0.46–0.47 area
— deeper support: 0.33–0.35
— potential higher target: 0.80–0.84
— open interest is noticeably growing again
The most interesting scenario:
Squeeze to 0.55 → range trade under the level → breakout and consolidation above.
If this structure forms and resistance can be broken, the next major zone of interest becomes 0.80–0.84 — about +45% to +53% from the breakout area at 0.55.
For now, the key point isn’t the rise itself, but how the price behaves around 0.55–0.58. We need stability under the level, not just a single impulse.
If the price can’t hold near the current zone and starts to move back below, the scenario will have to be reconsidered.
This is not a signal. Entry point, stop-loss, and volume are defined by your own system.
More breakdowns, coins in the game, and real-time market situations — in our Discord and in the group with practice
$MAGMA
After a strong rebound, MAGMA has once again approached an important zone at 0.55–0.58. Right now, the most interesting thing is to see whether the price can squeeze up to resistance and form a proper trading range.
What we’re looking at:
— current price: around 0.53–0.54
— resistance zone: 0.55–0.58
— nearest support: 0.46–0.47 area
— deeper support: 0.33–0.35
— potential higher target: 0.80–0.84
— open interest is noticeably growing again
The most interesting scenario:
Squeeze to 0.55 → range trade under the level → breakout and consolidation above.
If this structure forms and resistance can be broken, the next major zone of interest becomes 0.80–0.84 — about +45% to +53% from the breakout area at 0.55.
For now, the key point isn’t the rise itself, but how the price behaves around 0.55–0.58. We need stability under the level, not just a single impulse.
If the price can’t hold near the current zone and starts to move back below, the scenario will have to be reconsidered.
This is not a signal. Entry point, stop-loss, and volume are defined by your own system.
More breakdowns, coins in the game, and real-time market situations — in our Discord and in the group with practice
$MAGMA
1
591
·
--
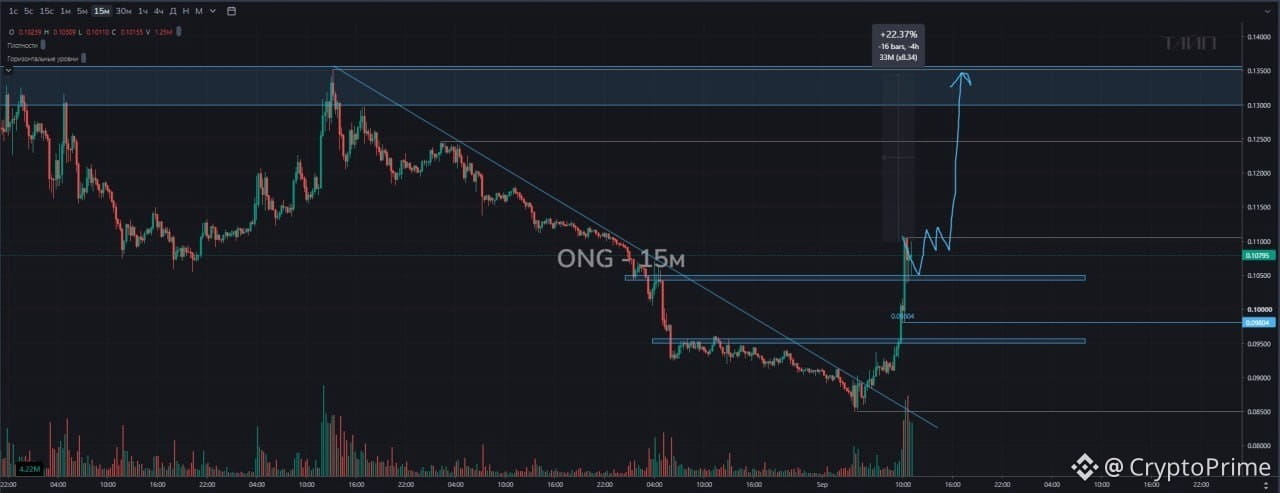
⚡️ MONETA IN THE GAME: ONGUSDT 🟢
#ONG has already delivered a strong impulse upward, so now it’s more interesting not to chase the price, but to see where it can hold and form a new structure.
What to look at:
— current price: around 0.107–0.108
— first support: 0.104–0.106
— second support: 0.095–0.097
— nearest resistance: 0.110
— upside targets: 0.130–0.135
The most interesting scenario is holding 0.104–0.106 and further trading/accumulation under the local highs.
Ideally:
correction → hold → squeeze toward 0.110 → break out above.
Then the next major zone of interest is 0.130–0.135, roughly +18–23% from the potential breakout.
If they don’t hold the upper support, we look at the reaction at 0.095–0.097. Losing that zone as well would weaken the scenario.
Right now the key thing is not to rush and wait for a clear trading range/accumulation.
This is not a signal. The entry point, stop loss, and volume—each person sets them according to their own system.
More breakdowns, coins in play, and real-time market situations—in our Discord and in the group with practice
{future}(ONGUSDT)
⚡️ MONETA IN THE GAME: ONGUSDT 🟢
#ONG has already delivered a strong impulse upward, so now it’s more interesting not to chase the price, but to see where it can hold and form a new structure.
What to look at:
— current price: around 0.107–0.108
— first support: 0.104–0.106
— second support: 0.095–0.097
— nearest resistance: 0.110
— upside targets: 0.130–0.135
The most interesting scenario is holding 0.104–0.106 and further trading/accumulation under the local highs.
Ideally:
correction → hold → squeeze toward 0.110 → break out above.
Then the next major zone of interest is 0.130–0.135, roughly +18–23% from the potential breakout.
If they don’t hold the upper support, we look at the reaction at 0.095–0.097. Losing that zone as well would weaken the scenario.
Right now the key thing is not to rush and wait for a clear trading range/accumulation.
This is not a signal. The entry point, stop loss, and volume—each person sets them according to their own system.
More breakdowns, coins in play, and real-time market situations—in our Discord and in the group with practice
#ONG has already delivered a strong impulse upward, so now it’s more interesting not to chase the price, but to see where it can hold and form a new structure.
What to look at:
— current price: around 0.107–0.108
— first support: 0.104–0.106
— second support: 0.095–0.097
— nearest resistance: 0.110
— upside targets: 0.130–0.135
The most interesting scenario is holding 0.104–0.106 and further trading/accumulation under the local highs.
Ideally:
correction → hold → squeeze toward 0.110 → break out above.
Then the next major zone of interest is 0.130–0.135, roughly +18–23% from the potential breakout.
If they don’t hold the upper support, we look at the reaction at 0.095–0.097. Losing that zone as well would weaken the scenario.
Right now the key thing is not to rush and wait for a clear trading range/accumulation.
This is not a signal. The entry point, stop loss, and volume—each person sets them according to their own system.
More breakdowns, coins in play, and real-time market situations—in our Discord and in the group with practice
852
·
--
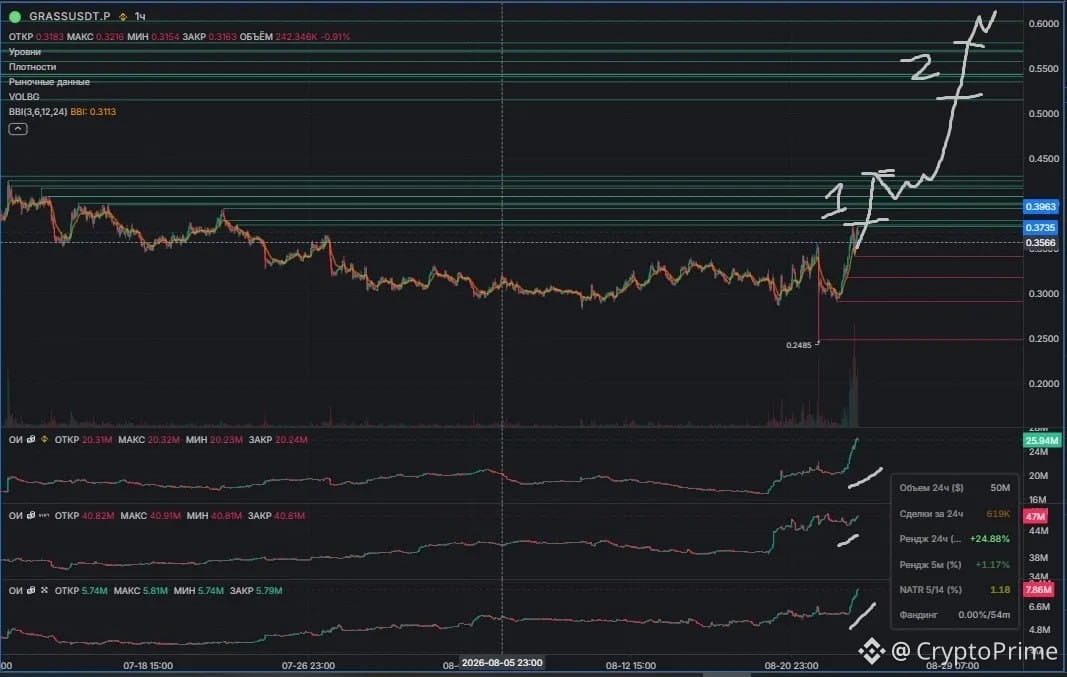
⚡️ COIN IN THE GAME: GRASSUSDT 🟢
On GRASS there’s an interesting setup: a spike followed by a move out of a long accumulation.
The move is accompanied by a noticeable rise in open interest across several exchanges at once—participants’ attention to the instrument has clearly increased.
Now we’ll see whether GRASS can continue the breakout and move through the next zones step by step.
What to look at:
— timeframe: 1H
— current zone: 0.31–0.32
— first area: 0.3735–0.3963 *(+18–25%)*
— next: 0.40–0.43 *(+26–36%)*
— next major zone: 0.52–0.56 *(+64–77%)*
— if the move continues — 0.60 *(around +90%)*
Scenario #1: continuation out of accumulation to 0.37–0.40 *(+18–26%)*.
Scenario #2: if this area is reached and they consolidate above it, the next reference point becomes 0.52–0.56 *(+64–77%)*.
We also specifically track OI. Its growth confirms increased interest, but by itself it is not an entry point.
It’s important to see how price reacts at the marked levels, and only then work according to your model.
This is not a signal. Entry point, stop, and volume are determined by each person’s own system.
More breakdowns, coins in the game, and live market situations—on our Diskord and in the group with practice
$GRASS
{future}(GRASSUSDT)
⚡️ COIN IN THE GAME: GRASSUSDT 🟢
On GRASS there’s an interesting setup: a spike followed by a move out of a long accumulation.
The move is accompanied by a noticeable rise in open interest across several exchanges at once—participants’ attention to the instrument has clearly increased.
Now we’ll see whether GRASS can continue the breakout and move through the next zones step by step.
What to look at:
— timeframe: 1H
— current zone: 0.31–0.32
— first area: 0.3735–0.3963 *(+18–25%)*
— next: 0.40–0.43 *(+26–36%)*
— next major zone: 0.52–0.56 *(+64–77%)*
— if the move continues — 0.60 *(around +90%)*
Scenario #1: continuation out of accumulation to 0.37–0.40 *(+18–26%)*.
Scenario #2: if this area is reached and they consolidate above it, the next reference point becomes 0.52–0.56 *(+64–77%)*.
We also specifically track OI. Its growth confirms increased interest, but by itself it is not an entry point.
It’s important to see how price reacts at the marked levels, and only then work according to your model.
This is not a signal. Entry point, stop, and volume are determined by each person’s own system.
More breakdowns, coins in the game, and live market situations—on our Diskord and in the group with practice
$GRASS
On GRASS there’s an interesting setup: a spike followed by a move out of a long accumulation.
The move is accompanied by a noticeable rise in open interest across several exchanges at once—participants’ attention to the instrument has clearly increased.
Now we’ll see whether GRASS can continue the breakout and move through the next zones step by step.
What to look at:
— timeframe: 1H
— current zone: 0.31–0.32
— first area: 0.3735–0.3963 *(+18–25%)*
— next: 0.40–0.43 *(+26–36%)*
— next major zone: 0.52–0.56 *(+64–77%)*
— if the move continues — 0.60 *(around +90%)*
Scenario #1: continuation out of accumulation to 0.37–0.40 *(+18–26%)*.
Scenario #2: if this area is reached and they consolidate above it, the next reference point becomes 0.52–0.56 *(+64–77%)*.
We also specifically track OI. Its growth confirms increased interest, but by itself it is not an entry point.
It’s important to see how price reacts at the marked levels, and only then work according to your model.
This is not a signal. Entry point, stop, and volume are determined by each person’s own system.
More breakdowns, coins in the game, and live market situations—on our Diskord and in the group with practice
$GRASS
1
909
·
--
Bullish
⚡️ COIN IN THE GAME:
{future}(ONUSDT)
#ONUSDT 🟢
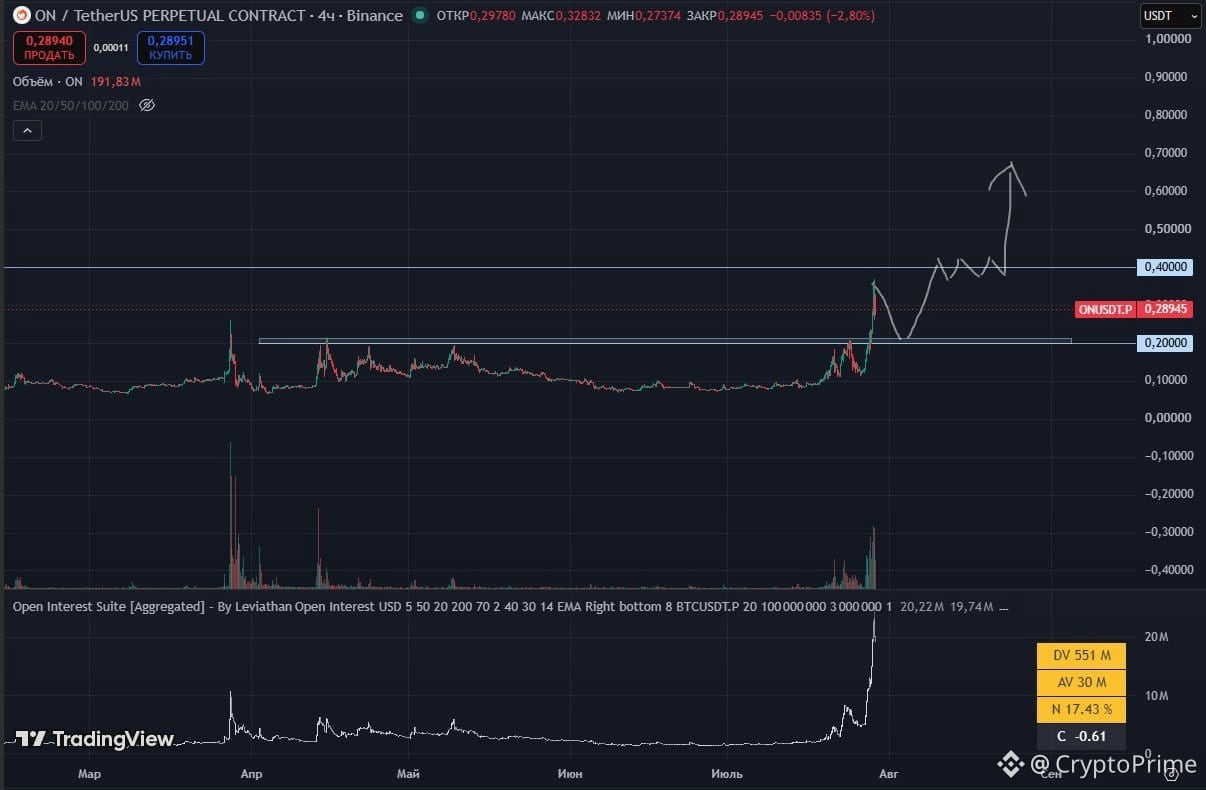
WHAT WE CHECK ON IT:
— coin: ON
— timeframes: 1D and 4H
— scenario: long
— current area at the time of analysis: approximately 0.289
— key zone for a retest: around 0.20
— first target: the high around 0.40
— potential from the current area to 0.40 — about 38%
— potential from a 0.20 retest to 0.40 — about 100%
— next scenario: squeeze under 0.40 and break out to update the high
WHY THE COIN IS INTERESTING:
For a long time, ON traded below the 0.20 level and formed a large range/consolidation.
Then the price moved above this area on increased volumes, and open interest rose noticeably. This indicates that market participants have become interested in the coin.
Now, after a strong impulse, a correction has started. Here it’s important not to chase the move, but to wait for a clear price reaction.
The key level we watch is — 0.20.
THE LOGIC FOLLOWS 👇
We wait for a pullback to the 0.20 area and see whether the former resistance can turn into support.
The main confirmation will be holding the level, the appearance of a buyer, and the formation of a new upward move.
If the scenario plays out, the first target will be the 0.40 area — the region of the previous high.
$ON
⚡️ COIN IN THE GAME:
#ONUSDT 🟢
WHAT WE CHECK ON IT:
— coin: ON
— timeframes: 1D and 4H
— scenario: long
— current area at the time of analysis: approximately 0.289
— key zone for a retest: around 0.20
— first target: the high around 0.40
— potential from the current area to 0.40 — about 38%
— potential from a 0.20 retest to 0.40 — about 100%
— next scenario: squeeze under 0.40 and break out to update the high
WHY THE COIN IS INTERESTING:
For a long time, ON traded below the 0.20 level and formed a large range/consolidation.
Then the price moved above this area on increased volumes, and open interest rose noticeably. This indicates that market participants have become interested in the coin.
Now, after a strong impulse, a correction has started. Here it’s important not to chase the move, but to wait for a clear price reaction.
The key level we watch is — 0.20.
THE LOGIC FOLLOWS 👇
We wait for a pullback to the 0.20 area and see whether the former resistance can turn into support.
The main confirmation will be holding the level, the appearance of a buyer, and the formation of a new upward move.
If the scenario plays out, the first target will be the 0.40 area — the region of the previous high.
$ON
#ONUSDT 🟢
WHAT WE CHECK ON IT:
— coin: ON
— timeframes: 1D and 4H
— scenario: long
— current area at the time of analysis: approximately 0.289
— key zone for a retest: around 0.20
— first target: the high around 0.40
— potential from the current area to 0.40 — about 38%
— potential from a 0.20 retest to 0.40 — about 100%
— next scenario: squeeze under 0.40 and break out to update the high
WHY THE COIN IS INTERESTING:
For a long time, ON traded below the 0.20 level and formed a large range/consolidation.
Then the price moved above this area on increased volumes, and open interest rose noticeably. This indicates that market participants have become interested in the coin.
Now, after a strong impulse, a correction has started. Here it’s important not to chase the move, but to wait for a clear price reaction.
The key level we watch is — 0.20.
THE LOGIC FOLLOWS 👇
We wait for a pullback to the 0.20 area and see whether the former resistance can turn into support.
The main confirmation will be holding the level, the appearance of a buyer, and the formation of a new upward move.
If the scenario plays out, the first target will be the 0.40 area — the region of the previous high.
$ON
2
2
661
·
--
GROWTH OR A TRAP?
#BTC has settled above $62,000, which became the first positive signal. But the main test is still ahead—the $64,500–65,000 zone. If buyers can hold above it, the way will open to $68,000–70,000.
At the same time, the market remains cautious: US inflation data is ahead, and Strategy has recently sold part of its BTC. For now, support is $62,000. Losing it could lead to a pullback to $61,000 and below.
More details in the video. Enjoy watching.
GROWTH OR A TRAP?
#BTC has settled above $62,000, which became the first positive signal. But the main test is still ahead—the $64,500–65,000 zone. If buyers can hold above it, the way will open to $68,000–70,000.
At the same time, the market remains cautious: US inflation data is ahead, and Strategy has recently sold part of its BTC. For now, support is $62,000. Losing it could lead to a pullback to $61,000 and below.
More details in the video. Enjoy watching.
#BTC has settled above $62,000, which became the first positive signal. But the main test is still ahead—the $64,500–65,000 zone. If buyers can hold above it, the way will open to $68,000–70,000.
At the same time, the market remains cautious: US inflation data is ahead, and Strategy has recently sold part of its BTC. For now, support is $62,000. Losing it could lead to a pullback to $61,000 and below.
More details in the video. Enjoy watching.
1
5
37.6k
·
--
#BTC is still correcting within the global downtrend that started last autumn. After a failed attempt to hold above 80,000 (21MA 1D), the price has once again dipped under selling pressure and is approaching key support around 71K.
Holding this zone could provide a bounce back to 76–78K, but losing support will open the path to 66–68K into the ROS zone. The external environment remains negative: macroeconomic pressures, geopolitics, and outflows from #etf continue to weigh on the market.
#BTC is still correcting within the global downtrend that started last autumn. After a failed attempt to hold above 80,000 (21MA 1D), the price has once again dipped under selling pressure and is approaching key support around 71K.
Holding this zone could provide a bounce back to 76–78K, but losing support will open the path to 66–68K into the ROS zone. The external environment remains negative: macroeconomic pressures, geopolitics, and outflows from #etf continue to weigh on the market.
Holding this zone could provide a bounce back to 76–78K, but losing support will open the path to 66–68K into the ROS zone. The external environment remains negative: macroeconomic pressures, geopolitics, and outflows from #etf continue to weigh on the market.
1
8
14k
·
--
#BTC after consolidation broke above $80K, but the momentum is weak — there's still potential for liquidity accumulation up to ~$82K and closing the CME gap. Locally, there's a risk of a correction from the diagonal support aiming for ~$70K.
The three-month accumulation provides fuel for movement in both directions, but liquidity is greater on the downside — the priority remains for a downtrend. Dominance #BTC is hitting new highs, altcoins are weak — interest is selective. As long as BTC.D is rising, it’s wise to keep an eye on top altcoins for the long haul.
#BTC after consolidation broke above $80K, but the momentum is weak — there's still potential for liquidity accumulation up to ~$82K and closing the CME gap. Locally, there's a risk of a correction from the diagonal support aiming for ~$70K.
The three-month accumulation provides fuel for movement in both directions, but liquidity is greater on the downside — the priority remains for a downtrend. Dominance #BTC is hitting new highs, altcoins are weak — interest is selective. As long as BTC.D is rising, it’s wise to keep an eye on top altcoins for the long haul.
The three-month accumulation provides fuel for movement in both directions, but liquidity is greater on the downside — the priority remains for a downtrend. Dominance #BTC is hitting new highs, altcoins are weak — interest is selective. As long as BTC.D is rising, it’s wise to keep an eye on top altcoins for the long haul.
8
17k
·
--
HERE WILL SOON BE MOVEMENT
#BTC and #ETH have been in a sideways trend for two months. For BTC, the priority scenario is a decline: I am watching the decrease in volumes below the ascending slope and a possible test from below. The alternative (unlikely) is holding the range and rising to $85K. Globally, I expect a continuation of the decline.
For ETH, if BTC breaks below $60K — the target is around $1500. Work while adhering to risks and avoiding emotions.
HERE WILL SOON BE MOVEMENT
#BTC and #ETH have been in a sideways trend for two months. For BTC, the priority scenario is a decline: I am watching the decrease in volumes below the ascending slope and a possible test from below. The alternative (unlikely) is holding the range and rising to $85K. Globally, I expect a continuation of the decline.
For ETH, if BTC breaks below $60K — the target is around $1500. Work while adhering to risks and avoiding emotions.
#BTC and #ETH have been in a sideways trend for two months. For BTC, the priority scenario is a decline: I am watching the decrease in volumes below the ascending slope and a possible test from below. The alternative (unlikely) is holding the range and rising to $85K. Globally, I expect a continuation of the decline.
For ETH, if BTC breaks below $60K — the target is around $1500. Work while adhering to risks and avoiding emotions.
1
9
15.2k
·
--
STRUCTURE OF GUIDES: WHERE TO EXPECT PRICE REACTION?
#BTC , is likely completing the correction and preparing for further decline. After breaking the key support, I expect movement to $55–57K with a local reaction and then a continuation of the drop to the $44–45K zone (0.5 Fibonacci). Below the $60K level, liquidity has accumulated, which increases the likelihood of a decline.
#ETH has not yet reached support — I am waiting for a breakout with a retest and a decline to $1500. It is critical to hold above $1385: a breakout will break the structure and open the way to $900–1000.
STRUCTURE OF GUIDES: WHERE TO EXPECT PRICE REACTION?
#BTC , is likely completing the correction and preparing for further decline. After breaking the key support, I expect movement to $55–57K with a local reaction and then a continuation of the drop to the $44–45K zone (0.5 Fibonacci). Below the $60K level, liquidity has accumulated, which increases the likelihood of a decline.
#ETH has not yet reached support — I am waiting for a breakout with a retest and a decline to $1500. It is critical to hold above $1385: a breakout will break the structure and open the way to $900–1000.
#BTC , is likely completing the correction and preparing for further decline. After breaking the key support, I expect movement to $55–57K with a local reaction and then a continuation of the drop to the $44–45K zone (0.5 Fibonacci). Below the $60K level, liquidity has accumulated, which increases the likelihood of a decline.
#ETH has not yet reached support — I am waiting for a breakout with a retest and a decline to $1500. It is critical to hold above $1385: a breakout will break the structure and open the way to $900–1000.
4
15.6k
·
--
Alts on the radar.
Key levels and scenarios.
#xrp remains in a sideways movement and tests support at 1.32. If it breaks and holds below, targets are 1.27 and 1.12, with a possible stop in the zone of 0.95–1.00.
#LTC completes the correction, a movement towards $40 is expected; entry points are after breaking and retesting $51–52.
#ADA is trading in the range of $0.2–0.3 and may stay there for another 2–3 months; exiting the sideways movement will require new volumes.
Alts on the radar.
Key levels and scenarios.
#xrp remains in a sideways movement and tests support at 1.32. If it breaks and holds below, targets are 1.27 and 1.12, with a possible stop in the zone of 0.95–1.00.
#LTC completes the correction, a movement towards $40 is expected; entry points are after breaking and retesting $51–52.
#ADA is trading in the range of $0.2–0.3 and may stay there for another 2–3 months; exiting the sideways movement will require new volumes.
Key levels and scenarios.
#xrp remains in a sideways movement and tests support at 1.32. If it breaks and holds below, targets are 1.27 and 1.12, with a possible stop in the zone of 0.95–1.00.
#LTC completes the correction, a movement towards $40 is expected; entry points are after breaking and retesting $51–52.
#ADA is trading in the range of $0.2–0.3 and may stay there for another 2–3 months; exiting the sideways movement will require new volumes.
6
11.6k
·
--
ILLUSION OF GROWTH
#BTC has surpassed the April level, but without the expected quick return. Two scenarios are considered: the main one — a liquidity buildup, a trap for buyers, and further decline to $55–57K; the alternative (less likely) — breaking the descending resistance with a consolidation above $75–80K and rising to $97–98K.
#ETH may reach $2400–2500, test the slope, and then decline to $1650–1700.
ILLUSION OF GROWTH
#BTC has surpassed the April level, but without the expected quick return. Two scenarios are considered: the main one — a liquidity buildup, a trap for buyers, and further decline to $55–57K; the alternative (less likely) — breaking the descending resistance with a consolidation above $75–80K and rising to $97–98K.
#ETH may reach $2400–2500, test the slope, and then decline to $1650–1700.
#BTC has surpassed the April level, but without the expected quick return. Two scenarios are considered: the main one — a liquidity buildup, a trap for buyers, and further decline to $55–57K; the alternative (less likely) — breaking the descending resistance with a consolidation above $75–80K and rising to $97–98K.
#ETH may reach $2400–2500, test the slope, and then decline to $1650–1700.
4
2
10
19k
·
--
#BTC received a bearish reaction after retesting the April low. A repeated approach to the zone without a breakout is now possible. In the near future, I expect a continuation of the decline to $55K–57K. The longer the price stays in the current range, the higher the risk of a more significant drop. I expect the strongest reaction from buyers in the $45K–47K zone.
For #ETH , the scenario of a decline within the global support level also remains intact. A breakout and consolidation above $2115 is needed for confident growth.
#BTC received a bearish reaction after retesting the April low. A repeated approach to the zone without a breakout is now possible. In the near future, I expect a continuation of the decline to $55K–57K. The longer the price stays in the current range, the higher the risk of a more significant drop. I expect the strongest reaction from buyers in the $45K–47K zone.
For #ETH , the scenario of a decline within the global support level also remains intact. A breakout and consolidation above $2115 is needed for confident growth.
For #ETH , the scenario of a decline within the global support level also remains intact. A breakout and consolidation above $2115 is needed for confident growth.
1
12
21.7k
Log in to explore more content
Join global crypto users on Binance Square
⚡️ Get latest and useful information about crypto.
💬 Trusted by the world’s largest crypto exchange.
👍 Discover real insights from verified creators.
Email / Phone number