Binance Square
灯塔说
1.1k Posts

灯塔说

Square Verified
老牌交易员,专注二级交易|投研,严谨计划交易,严格交易计划!合作|推特:@Cryptodengta
原创之星

原创之星
PALU Holder
PALU Holder
Occasional Trader
6.8 Years
63 Following
13.1K+ Followers
19.1K+ Liked
1 Badges
Posts
PINNED
·
--
Important Announcement: The market analysis and investment recommendations provided in this plaza are based solely on publicly available information and professional judgment, and do not constitute any guarantee of returns or assurance of principal safety. Investing involves risk; decisions should be made carefully. Please assess your own risk tolerance and financial situation prudently, and assume responsibility for any related investment risks. Note: All content on this plaza is for reference only and does not constitute any investment advice. ——Lighthouse Says. For business cooperation (copy-trading), please DM.
Important Announcement:
The market analysis and investment recommendations provided in this plaza are based solely on publicly available information and professional judgment, and do not constitute any guarantee of returns or assurance of principal safety.
Investing involves risk; decisions should be made carefully. Please assess your own risk tolerance and financial situation prudently, and assume responsibility for any related investment risks.
Note: All content on this plaza is for reference only and does not constitute any investment advice.
——Lighthouse Says. For business cooperation (copy-trading), please DM.
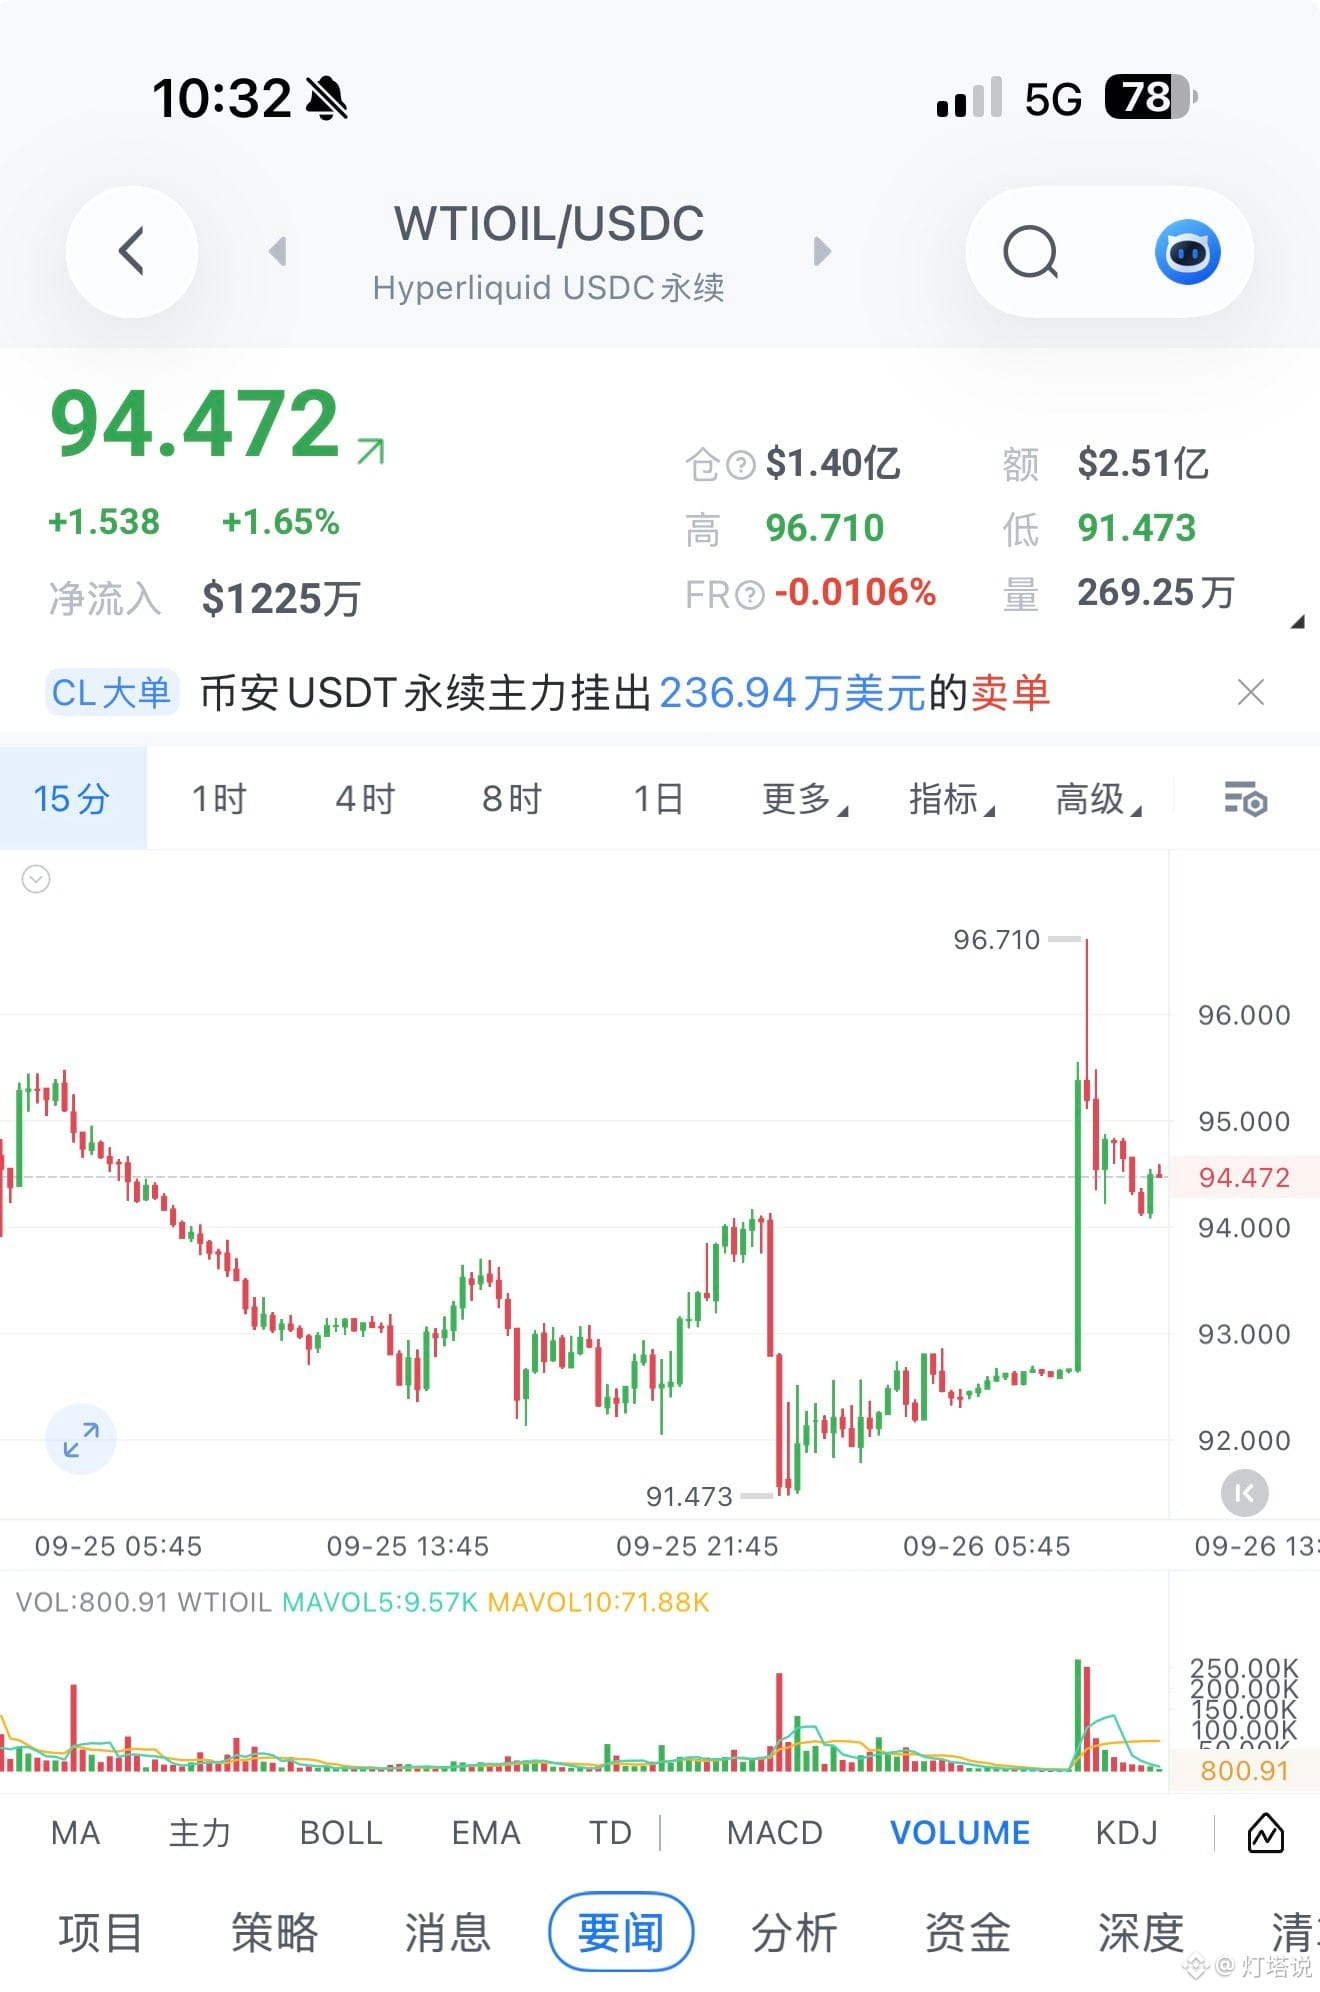
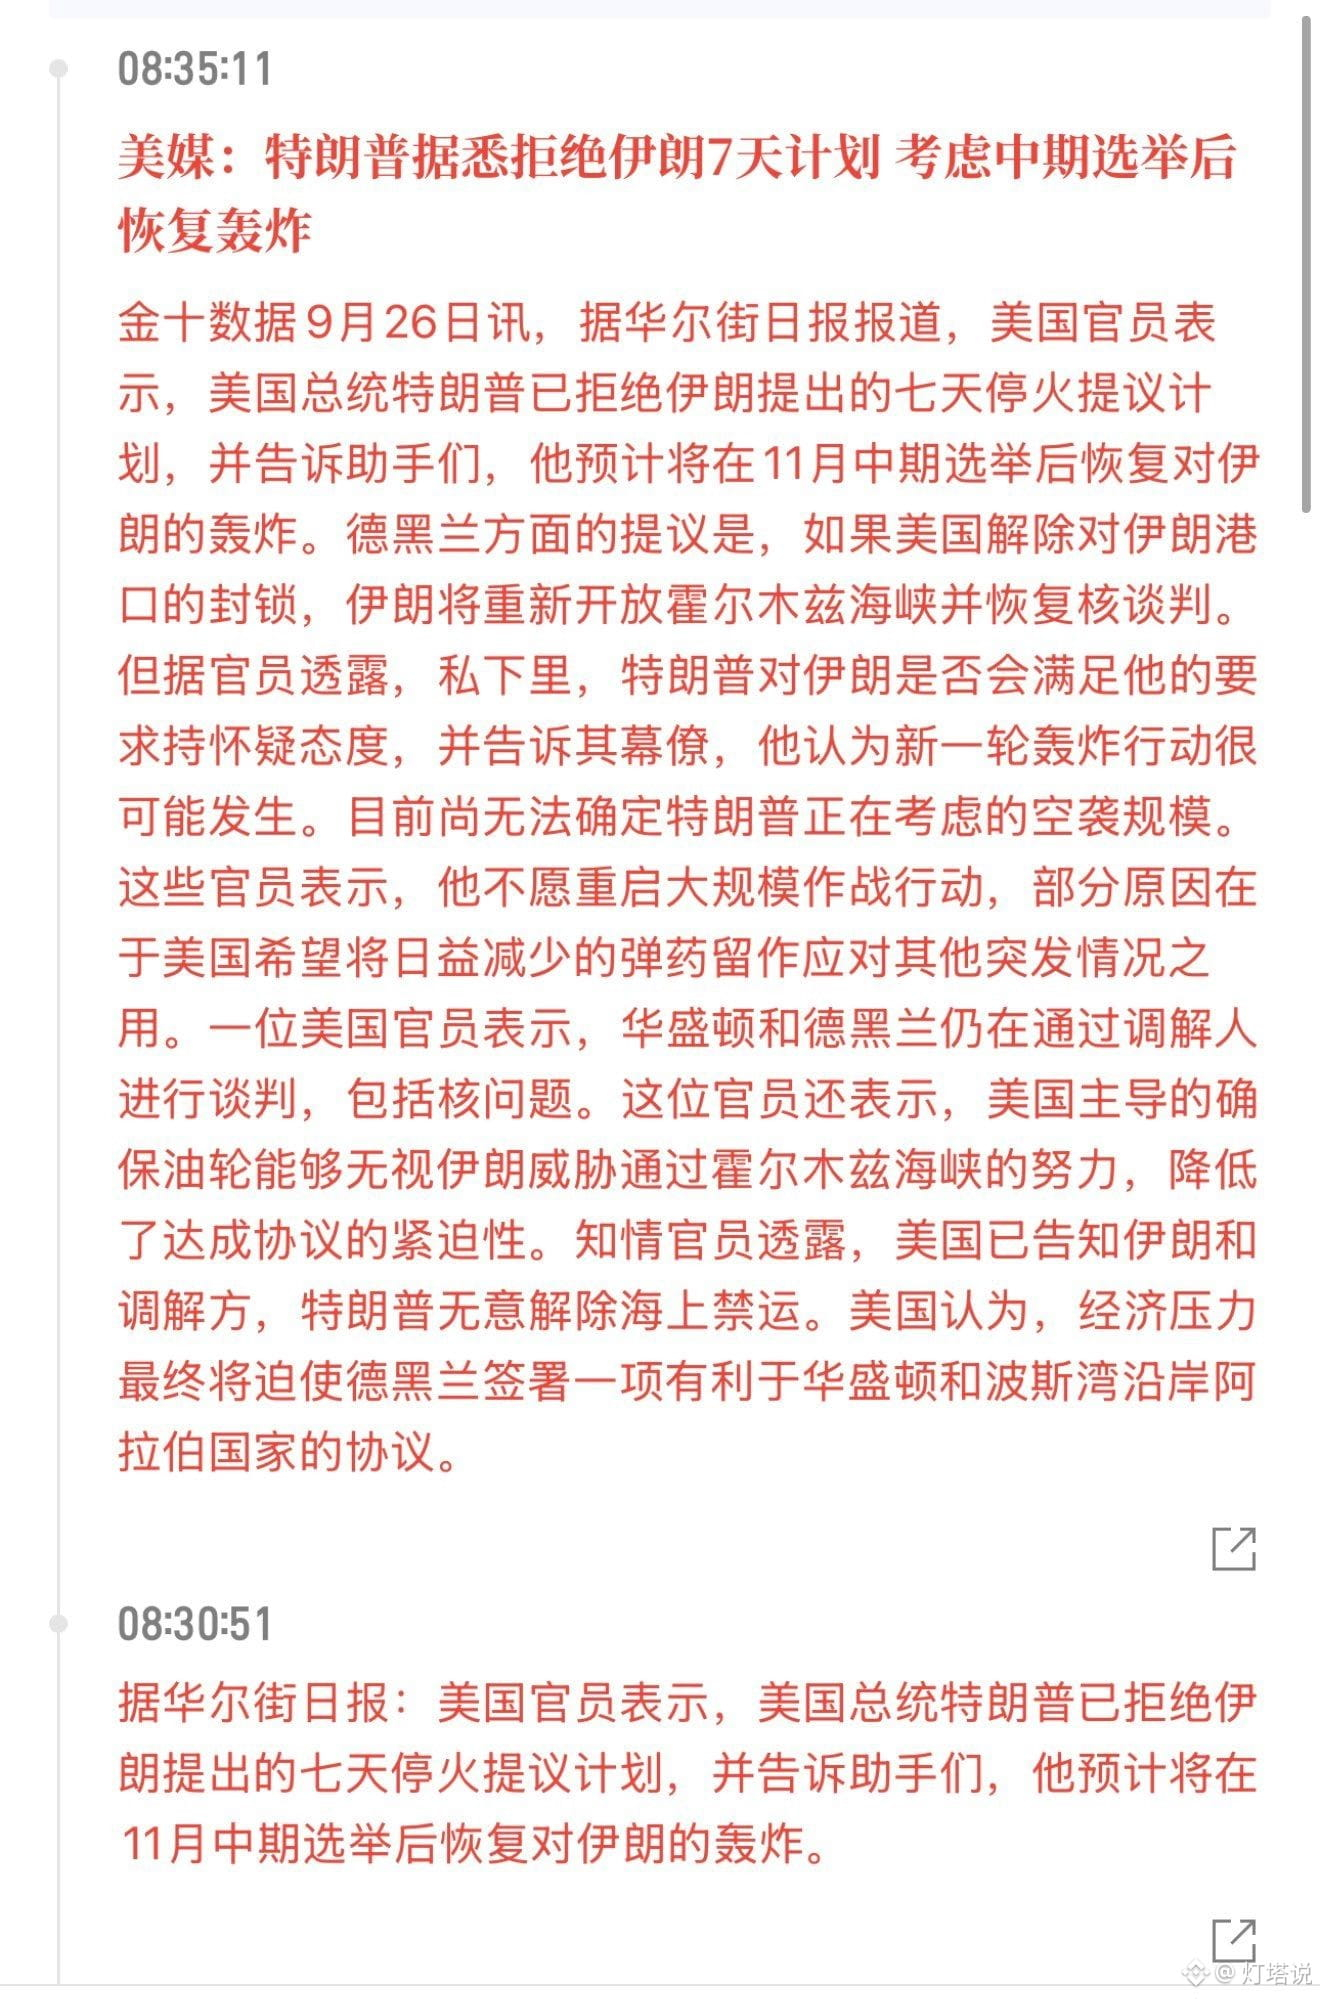
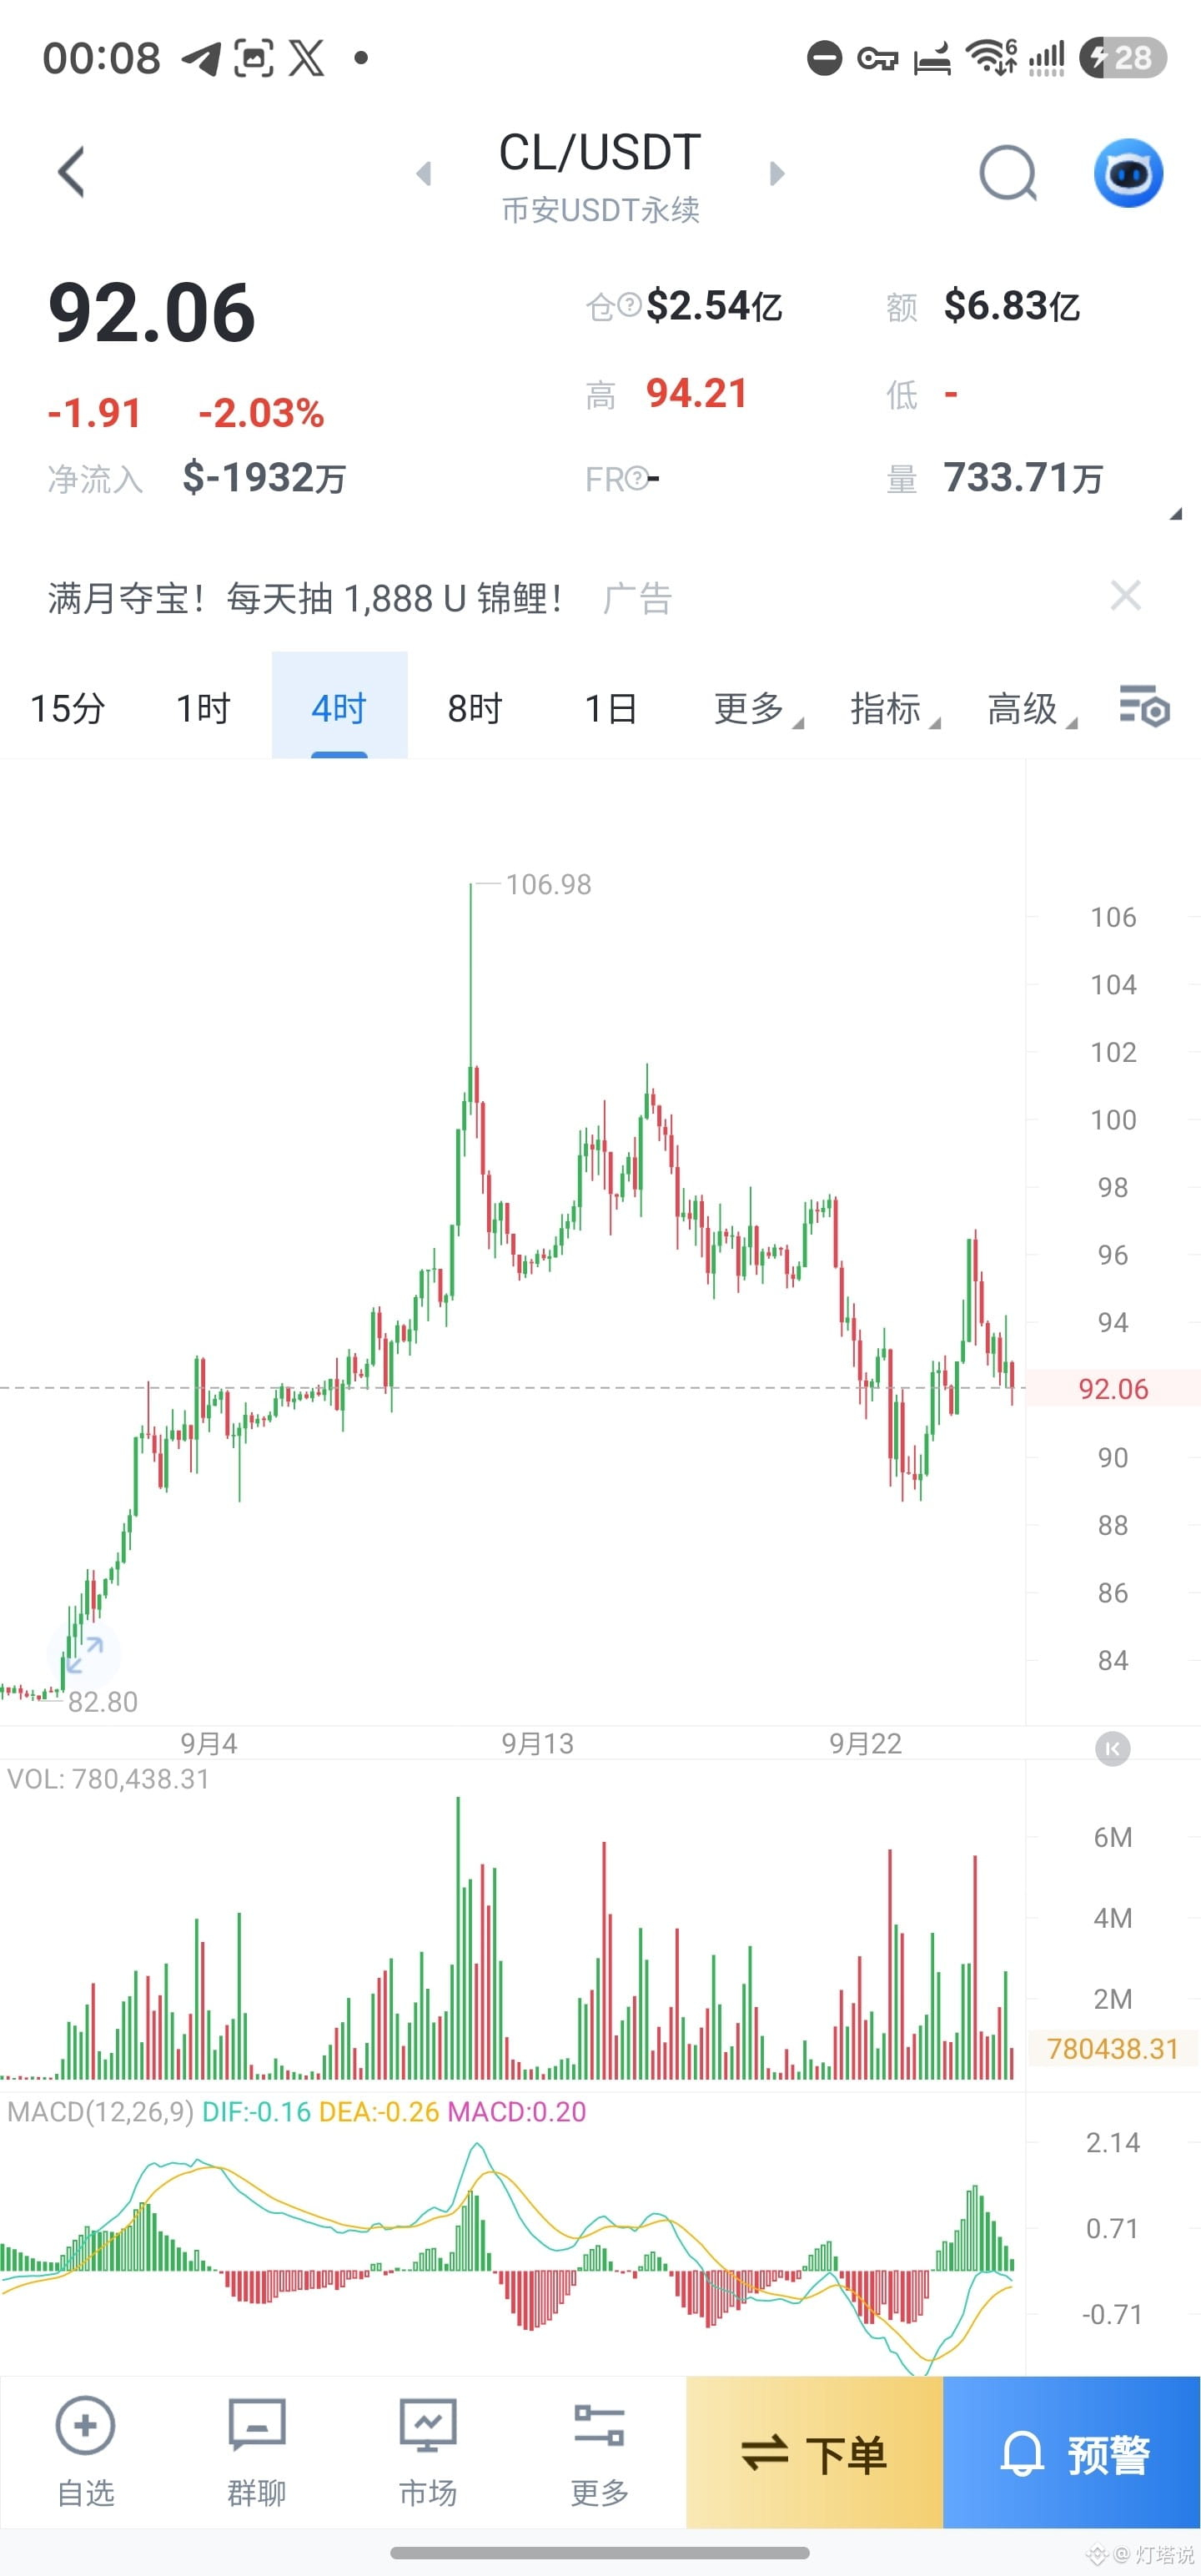
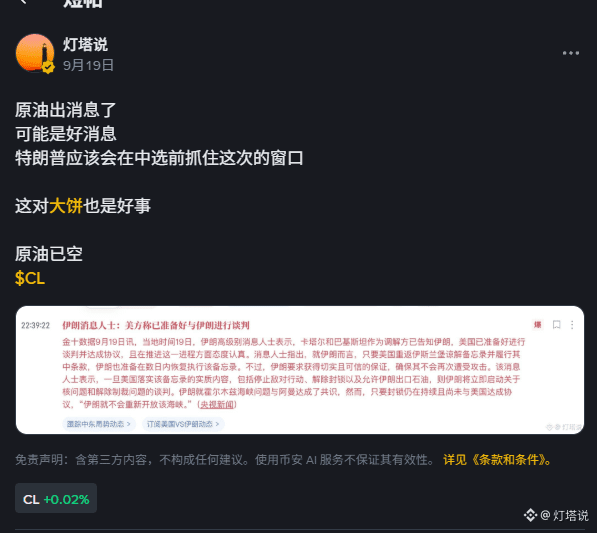
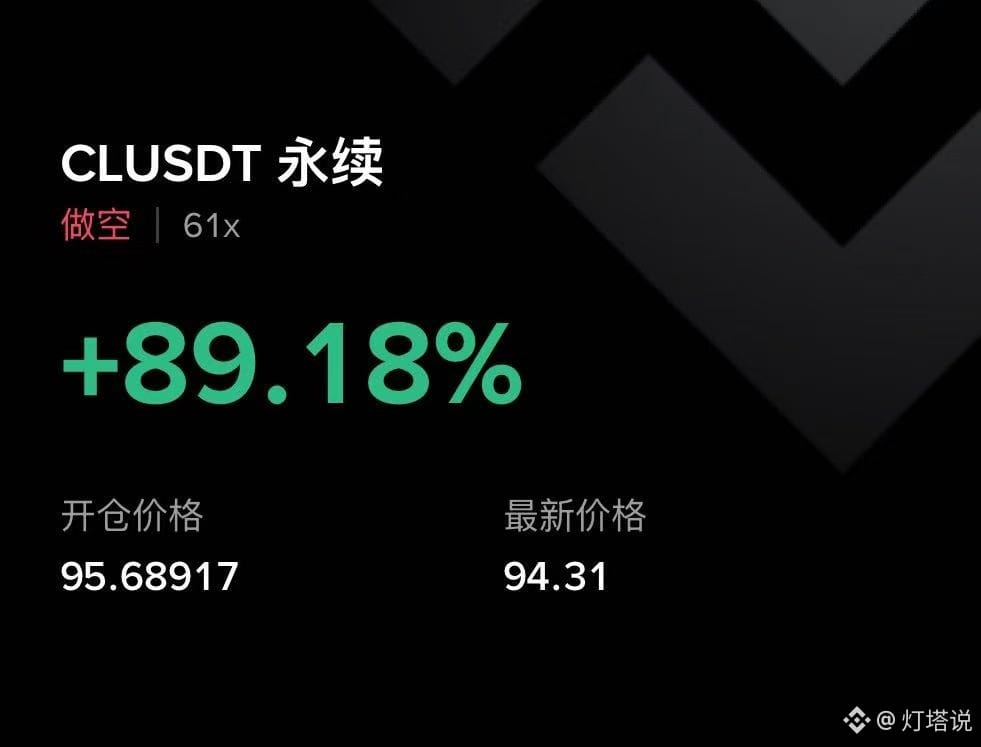
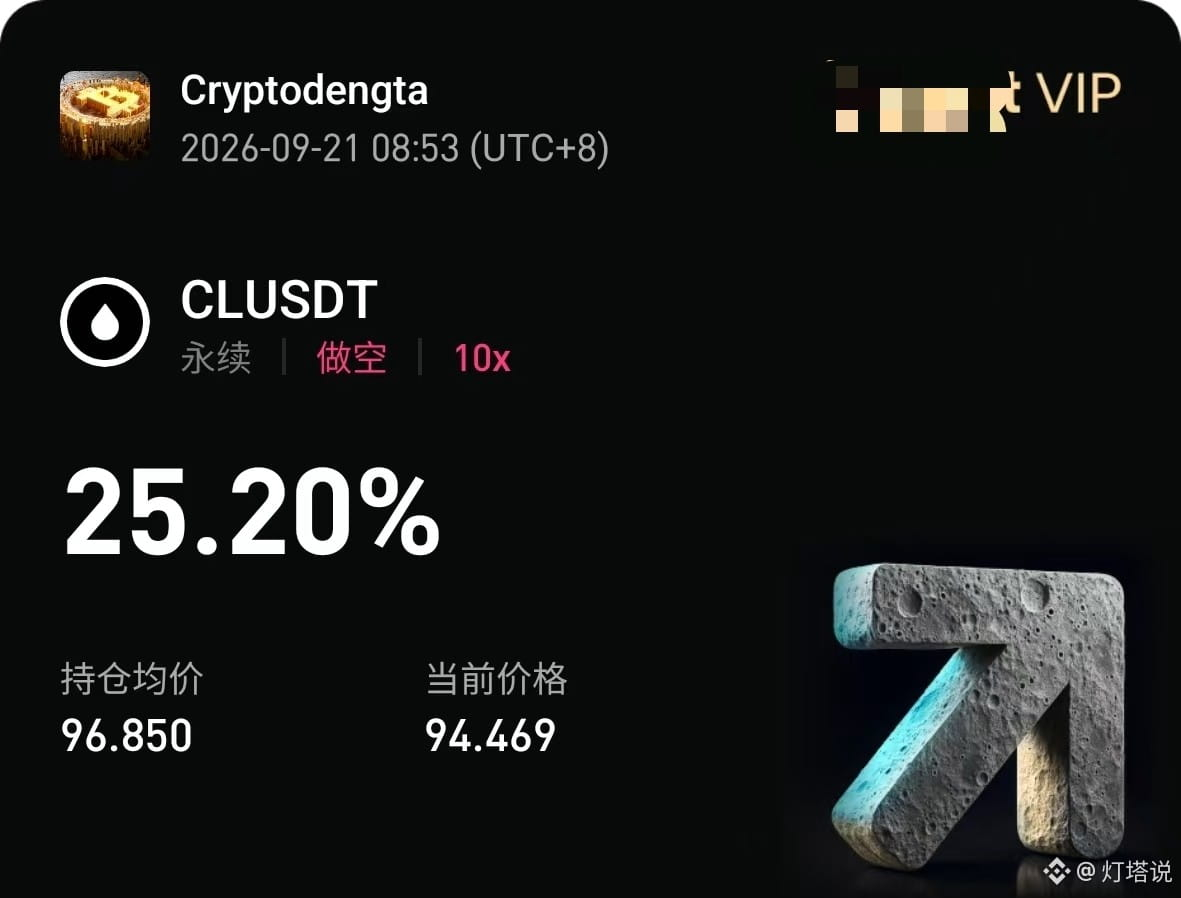
#原油期货涨超4% Didn’t expect this time both Iran and Trump are being this tough not holding back at all The current macro environment is arriving faster and bigger than expected and is clearly unfavorable for risk assets As of now: The U.S. Dollar Index has risen to about 101.45, near the three-week high; U.S. 10-year Treasury yields have risen to about 4.71%, with the 30-year above 5.1%. Oil prices have broken back above $100; Middle East shipping risks and America’s next round of tariffs are jointly pushing up inflation expectations. For BTC, gold, and tech stocks, this means triple pressure from real interest rates, the U.S. dollar, and risk premium. And this hasn’t even reached August— we’ve already started being suppressed into a pullback. The most crucial thing this month is: the status of the U.S.-Iran situation and what happens around the Fed’s policy meeting on the 28th–29th.$XAU $CL $BTC {future}(CLUSDT)
#原油期货涨超4%
Didn’t expect this time
both Iran and Trump are being this tough
not holding back at all

The current macro environment is arriving
faster and bigger than expected
and is clearly unfavorable for risk assets

As of now:
The U.S. Dollar Index has risen to about 101.45,
near the three-week high;
U.S. 10-year Treasury yields have risen to about 4.71%,
with the 30-year above 5.1%.
Oil prices have broken back above $100;
Middle East shipping risks and America’s next round of tariffs
are jointly pushing up inflation expectations.

For BTC, gold, and tech stocks,
this means triple pressure from
real interest rates, the U.S. dollar, and risk premium.

And this hasn’t even reached August—
we’ve already started being suppressed into a pullback.

The most crucial thing this month is:
the status of the U.S.-Iran situation
and what happens around the Fed’s policy meeting on the 28th–29th.$XAU
$CL $BTC
Today’s Trading Recap (Continuing from the previous macro fundamental analysis): The high-cycle rebound has not ended yet, while the low-cycle has already moved into a correction. BTC’s 4-hour upward structure remains intact, but the 1-hour and 15-minute timeframes have already formed a sequence of lower highs and lower lows, and price is currently searching downward for liquidity. ETH’s 4-hour structure is stronger than BTC’s, but it has entered the daily supply zone. Moreover, the short-term new bearish signals are more pronounced than BTC’s, so ETH may first dip lower and then decide whether to squeeze shorts. The 659–656 support range mentioned yesterday did not lead to new highs. Meanwhile, fundamentals show crude oil continuing to rise and major tech leaders’ earnings cooling off, so today the market keeps searching for new support points. $BTC — On the 15-minute timeframe, watch support at 655–653. If it breaks, pay attention to the hour chart’s key support at 645–640 for going long. Until price has reclaimed and held above 663–666, continue to maintain the hour-chart internal consolidation/adjustment. In simple terms, today’s plan is to watch the 15-minute support on the short term, wait for long entries at 645–640 on the hour chart, first rebound near 662 for short entries. $ETH — For ETH short-term: short on rebounds at 1935–1948, or short around 1955–1962. Continuously watch developments in the Iran–Israel situation. If a mediation/truce window appears, stop placing short (kong) trades. $XAU (Gold): The 4-hour rebound structure is good. The 1-hour timeframe is in a correction. Today, continue waiting to go long at 4090–4080. The target is still 4180–4200. 【Risk Warning: Sharing only personal trading records; not investment advice】
Today’s Trading Recap (Continuing from the previous macro fundamental analysis):

The high-cycle rebound has not ended yet, while the low-cycle has already moved into a correction.

BTC’s 4-hour upward structure remains intact, but the 1-hour and 15-minute timeframes have already formed a sequence of lower highs and lower lows, and price is currently searching downward for liquidity.

ETH’s 4-hour structure is stronger than BTC’s, but it has entered the daily supply zone. Moreover, the short-term new bearish signals are more pronounced than BTC’s, so ETH may first dip lower and then decide whether to squeeze shorts.

The 659–656 support range mentioned yesterday did not lead to new highs. Meanwhile, fundamentals show crude oil continuing to rise and major tech leaders’ earnings cooling off, so today the market keeps searching for new support points.

$BTC — On the 15-minute timeframe, watch support at 655–653. If it breaks, pay attention to the hour chart’s key support at 645–640 for going long. Until price has reclaimed and held above 663–666, continue to maintain the hour-chart internal consolidation/adjustment.

In simple terms, today’s plan is to watch the 15-minute support on the short term, wait for long entries at 645–640 on the hour chart, first rebound near 662 for short entries.

$ETH — For ETH short-term: short on rebounds at 1935–1948, or short around 1955–1962.

Continuously watch developments in the Iran–Israel situation. If a mediation/truce window appears, stop placing short (kong) trades.

$XAU (Gold): The 4-hour rebound structure is good. The 1-hour timeframe is in a correction. Today, continue waiting to go long at 4090–4080. The target is still 4180–4200.

【Risk Warning: Sharing only personal trading records; not investment advice】
灯塔说
·
--
The rebound is unlikely to be sustained in the short term; wait for adjustments before setting up the next wave of long positions.

Tensions between the U.S. and Iran have flared up again. Brent crude has risen to around $94–95, and WTI crude has broken above $88. The market is once again concerned about energy prices transmitting to inflation. Meanwhile, the yield on U.S. two-year Treasuries has risen to about 4.3%, and market pricing for a July rate hike briefly climbed to roughly 33.7%. At the same time, the Nasdaq fell by about 0.6% on Wednesday, and risk appetite cooled further after tech leaders reported earnings.

The next Federal Reserve policy meeting is scheduled for July 28–29. Tonight at 20:30 Beijing time, U.S. initial jobless claims will also be released. If the subsequent data continues to show employment resilience, it may further strengthen hawkish expectations.

Within the crypto market, however, there is some support. As of July 21, U.S. spot Bitcoin ETFs have recorded net inflows for six straight trading days, with inflows on July 21 of about $203.2 million. However, Farside currently shows that the preliminary inflow on July 22 is only about $8.8 million, indicating that while capital is still flowing in, the marginal momentum has clearly weakened, and the current data may still be subject to reporting delays.

So, for now, the fundamentals are:
ETF flows are propping up the downside, while crude oil, interest rates, and FOMC expectations are capping the upside. The market can rebound, but for the time being it lacks macro conditions that would enable a sustained breakout and acceleration.
$BTC
The rebound is unlikely to be sustained in the short term; wait for adjustments before setting up the next wave of long positions. Tensions between the U.S. and Iran have flared up again. Brent crude has risen to around $94–95, and WTI crude has broken above $88. The market is once again concerned about energy prices transmitting to inflation. Meanwhile, the yield on U.S. two-year Treasuries has risen to about 4.3%, and market pricing for a July rate hike briefly climbed to roughly 33.7%. At the same time, the Nasdaq fell by about 0.6% on Wednesday, and risk appetite cooled further after tech leaders reported earnings. The next Federal Reserve policy meeting is scheduled for July 28–29. Tonight at 20:30 Beijing time, U.S. initial jobless claims will also be released. If the subsequent data continues to show employment resilience, it may further strengthen hawkish expectations. Within the crypto market, however, there is some support. As of July 21, U.S. spot Bitcoin ETFs have recorded net inflows for six straight trading days, with inflows on July 21 of about $203.2 million. However, Farside currently shows that the preliminary inflow on July 22 is only about $8.8 million, indicating that while capital is still flowing in, the marginal momentum has clearly weakened, and the current data may still be subject to reporting delays. So, for now, the fundamentals are: ETF flows are propping up the downside, while crude oil, interest rates, and FOMC expectations are capping the upside. The market can rebound, but for the time being it lacks macro conditions that would enable a sustained breakout and acceleration. $BTC {spot}(BTCUSDT)
The rebound is unlikely to be sustained in the short term; wait for adjustments before setting up the next wave of long positions.

Tensions between the U.S. and Iran have flared up again. Brent crude has risen to around $94–95, and WTI crude has broken above $88. The market is once again concerned about energy prices transmitting to inflation. Meanwhile, the yield on U.S. two-year Treasuries has risen to about 4.3%, and market pricing for a July rate hike briefly climbed to roughly 33.7%. At the same time, the Nasdaq fell by about 0.6% on Wednesday, and risk appetite cooled further after tech leaders reported earnings.

The next Federal Reserve policy meeting is scheduled for July 28–29. Tonight at 20:30 Beijing time, U.S. initial jobless claims will also be released. If the subsequent data continues to show employment resilience, it may further strengthen hawkish expectations.

Within the crypto market, however, there is some support. As of July 21, U.S. spot Bitcoin ETFs have recorded net inflows for six straight trading days, with inflows on July 21 of about $203.2 million. However, Farside currently shows that the preliminary inflow on July 22 is only about $8.8 million, indicating that while capital is still flowing in, the marginal momentum has clearly weakened, and the current data may still be subject to reporting delays.

So, for now, the fundamentals are:
ETF flows are propping up the downside, while crude oil, interest rates, and FOMC expectations are capping the upside. The market can rebound, but for the time being it lacks macro conditions that would enable a sustained breakout and acceleration.
$BTC
灯塔说
·
--
《AI Monetization Logic Mid-Year Major Exam》
At around 2:00 a.m. on the 23rd, Google is about to release its latest quarterly earnings report. This report is not only about Google itself; at its core, it is the mid-year major test for the market’s “AI monetization logic,” and a barometer of sentiment for recent U.S. stocks—and even for the entire macro risk-asset complex.

Current Market Pricing and Expectations
Wall Street’s consensus expectations have already been priced in very aggressively: total revenue of about $116.8 billion (YoY +21%), with EPS (earnings per share) expected to be $2.89. But that’s just the surface. The real deciding factor—the make-or-break key—is Google Cloud. The market is extremely hungry for it to deliver astonishing cloud business growth of as much as 60%+ to prove that the heavy investments made earlier have not been wasted.

The practical impact on trading isn’t about how impressive the statements look; it’s about how large funds will reassess risk appetite based on what they see. There are two angles:

1) If the report beats expectations across the board and guidance is strong
This is the script that stabilizes everything. If Google proves that AI spending can translate into real cash conversion, this “anchoring needle” can hold up the entire hardware and semiconductor supply chain (NVIDIA, TSMC). Once Nasdaq long sentiment steadies, the resulting tailwind in liquidity can directly spill over, providing strong support to overall AI U.S. equities.

2) If the report falls short, or if Capex (capital expenditures) stays high while revenue guidance is weak
This is the biggest tail risk in the current market setup. Under a consensus that the AI theme is extremely crowded, tolerance for disappointment is very low. As soon as the report hints at a sign of “pumping money with no easy monetization,” it will instantly trigger panic about AI investment returns. That kind of panic can lead the Nasdaq to spearhead valuation cuts, and then drive indiscriminate deleveraging across asset classes (De-risking).

How should we operate and respond?

1. My suggestion: don’t chase long positions on the left side; reduce exposure ahead of the earnings release.
2. Watch the leading indicators closely: if the earnings release triggers a big selloff that’s worse than expected, don’t rush to buy Google. First, assess how well the semiconductor sector—SMH—absorbs the move. If even those selling shovels get dragged down, it means the macro narrative along the main trade is wobbling, and exposure must be reduced decisively.

The market is too crowded right now. As long as the earnings report isn’t “perfect enough,” it becomes a negative catalyst. Keep your ammunition and wait for direction confirmation.
$GOOG.US
Verified
《AI Monetization Logic Mid-Year Major Exam》 At around 2:00 a.m. on the 23rd, Google is about to release its latest quarterly earnings report. This report is not only about Google itself; at its core, it is the mid-year major test for the market’s “AI monetization logic,” and a barometer of sentiment for recent U.S. stocks—and even for the entire macro risk-asset complex. Current Market Pricing and Expectations Wall Street’s consensus expectations have already been priced in very aggressively: total revenue of about $116.8 billion (YoY +21%), with EPS (earnings per share) expected to be $2.89. But that’s just the surface. The real deciding factor—the make-or-break key—is Google Cloud. The market is extremely hungry for it to deliver astonishing cloud business growth of as much as 60%+ to prove that the heavy investments made earlier have not been wasted. The practical impact on trading isn’t about how impressive the statements look; it’s about how large funds will reassess risk appetite based on what they see. There are two angles: 1) If the report beats expectations across the board and guidance is strong This is the script that stabilizes everything. If Google proves that AI spending can translate into real cash conversion, this “anchoring needle” can hold up the entire hardware and semiconductor supply chain (NVIDIA, TSMC). Once Nasdaq long sentiment steadies, the resulting tailwind in liquidity can directly spill over, providing strong support to overall AI U.S. equities. 2) If the report falls short, or if Capex (capital expenditures) stays high while revenue guidance is weak This is the biggest tail risk in the current market setup. Under a consensus that the AI theme is extremely crowded, tolerance for disappointment is very low. As soon as the report hints at a sign of “pumping money with no easy monetization,” it will instantly trigger panic about AI investment returns. That kind of panic can lead the Nasdaq to spearhead valuation cuts, and then drive indiscriminate deleveraging across asset classes (De-risking). How should we operate and respond? 1. My suggestion: don’t chase long positions on the left side; reduce exposure ahead of the earnings release. 2. Watch the leading indicators closely: if the earnings release triggers a big selloff that’s worse than expected, don’t rush to buy Google. First, assess how well the semiconductor sector—SMH—absorbs the move. If even those selling shovels get dragged down, it means the macro narrative along the main trade is wobbling, and exposure must be reduced decisively. The market is too crowded right now. As long as the earnings report isn’t “perfect enough,” it becomes a negative catalyst. Keep your ammunition and wait for direction confirmation. $GOOG.US {stock_us}(GOOG.US)
《AI Monetization Logic Mid-Year Major Exam》
At around 2:00 a.m. on the 23rd, Google is about to release its latest quarterly earnings report. This report is not only about Google itself; at its core, it is the mid-year major test for the market’s “AI monetization logic,” and a barometer of sentiment for recent U.S. stocks—and even for the entire macro risk-asset complex.

Current Market Pricing and Expectations
Wall Street’s consensus expectations have already been priced in very aggressively: total revenue of about $116.8 billion (YoY +21%), with EPS (earnings per share) expected to be $2.89. But that’s just the surface. The real deciding factor—the make-or-break key—is Google Cloud. The market is extremely hungry for it to deliver astonishing cloud business growth of as much as 60%+ to prove that the heavy investments made earlier have not been wasted.

The practical impact on trading isn’t about how impressive the statements look; it’s about how large funds will reassess risk appetite based on what they see. There are two angles:

1) If the report beats expectations across the board and guidance is strong
This is the script that stabilizes everything. If Google proves that AI spending can translate into real cash conversion, this “anchoring needle” can hold up the entire hardware and semiconductor supply chain (NVIDIA, TSMC). Once Nasdaq long sentiment steadies, the resulting tailwind in liquidity can directly spill over, providing strong support to overall AI U.S. equities.

2) If the report falls short, or if Capex (capital expenditures) stays high while revenue guidance is weak
This is the biggest tail risk in the current market setup. Under a consensus that the AI theme is extremely crowded, tolerance for disappointment is very low. As soon as the report hints at a sign of “pumping money with no easy monetization,” it will instantly trigger panic about AI investment returns. That kind of panic can lead the Nasdaq to spearhead valuation cuts, and then drive indiscriminate deleveraging across asset classes (De-risking).

How should we operate and respond?

1. My suggestion: don’t chase long positions on the left side; reduce exposure ahead of the earnings release.
2. Watch the leading indicators closely: if the earnings release triggers a big selloff that’s worse than expected, don’t rush to buy Google. First, assess how well the semiconductor sector—SMH—absorbs the move. If even those selling shovels get dragged down, it means the macro narrative along the main trade is wobbling, and exposure must be reduced decisively.

The market is too crowded right now. As long as the earnings report isn’t “perfect enough,” it becomes a negative catalyst. Keep your ammunition and wait for direction confirmation.
$GOOG.US
GOOGLonAlpha
SMHETF+2.43%
Let’s talk about the trading plan and review: 1. After Bitcoin adjusts, it continues to rise. The fundamentals are all supportive. In the short term, 67K is the key resistance. The long orders that started from 63K were triggered to take profit at 66.2K yesterday. Over the past two days, we adjusted within 65,880–65,500 and continued to go long. Deeper longs are at 64,500–64,000. Before next week’s rate decision meeting, if there is repeated choppy movement around 67K, we will still look to buy the dip—but we won’t chase too aggressively, because August data may be a downside catalyst for a pullback. $BTC 2. Gold: remind you twice again that the 4,000–3,960 range is where to build positions for longs. On the lower timeframe, a reversal has formed at the bottom, but on the 4-hour timeframe, the reversal point is at the key 4,200 level, syncing with fundamental factors. For July, the bullish target for gold is around 4,200. After the August adjustment, continue to buy the dip. For today, watch for longs at 4,090–4,080. Targets remain 4,180–4,200 $XAU 3. Oil: technically it’s biased bullish, but fundamentals have downside expectations. Oil is purely a risk asset. It clearly follows news sentiment. With the current ceasefire window showing up, after Trump pushes for ‘three-and-four’ conditions, negotiations will be accepted as well. That’s a near-term negative for oil. Compared with that, it’s a positive for Bitcoin and gold—using this positive is also why we continue to look for longs in Bitcoin and gold. However, oil will still see short-term pullbacks. After the adjustment, it should keep rising. The adjustment range is around 79–80. If the ceasefire move is larger, the expected adjustment target is around 71–72. $CL 4. Related to US stocks: recently there’s still a rebound, but it’s a sharp, high-volatility rebound. After the rebound, there will still be some adjustment. Major fundamental items to watch: 1. This Thursday early morning: Google earnings report, which will affect the direction of tech and AI-related US stocks; 2. Next week: the PEC and the July FOMC rate decision meeting—Fed rate announcements and future expectations will impact everything; 3. Developments in Iran–Israel situation, oil-price impact, and the ceasefire negotiation window that may appear soon. The above are my recent trading ideas and items to watch. These are for personal record only and do not constitute investment advice.
Let’s talk about the trading plan and review:
1. After Bitcoin adjusts, it continues to rise. The fundamentals are all supportive. In the short term, 67K is the key resistance. The long orders that started from 63K were triggered to take profit at 66.2K yesterday. Over the past two days, we adjusted within 65,880–65,500 and continued to go long. Deeper longs are at 64,500–64,000. Before next week’s rate decision meeting, if there is repeated choppy movement around 67K, we will still look to buy the dip—but we won’t chase too aggressively, because August data may be a downside catalyst for a pullback. $BTC

2. Gold: remind you twice again that the 4,000–3,960 range is where to build positions for longs. On the lower timeframe, a reversal has formed at the bottom, but on the 4-hour timeframe, the reversal point is at the key 4,200 level, syncing with fundamental factors. For July, the bullish target for gold is around 4,200. After the August adjustment, continue to buy the dip. For today, watch for longs at 4,090–4,080. Targets remain 4,180–4,200 $XAU

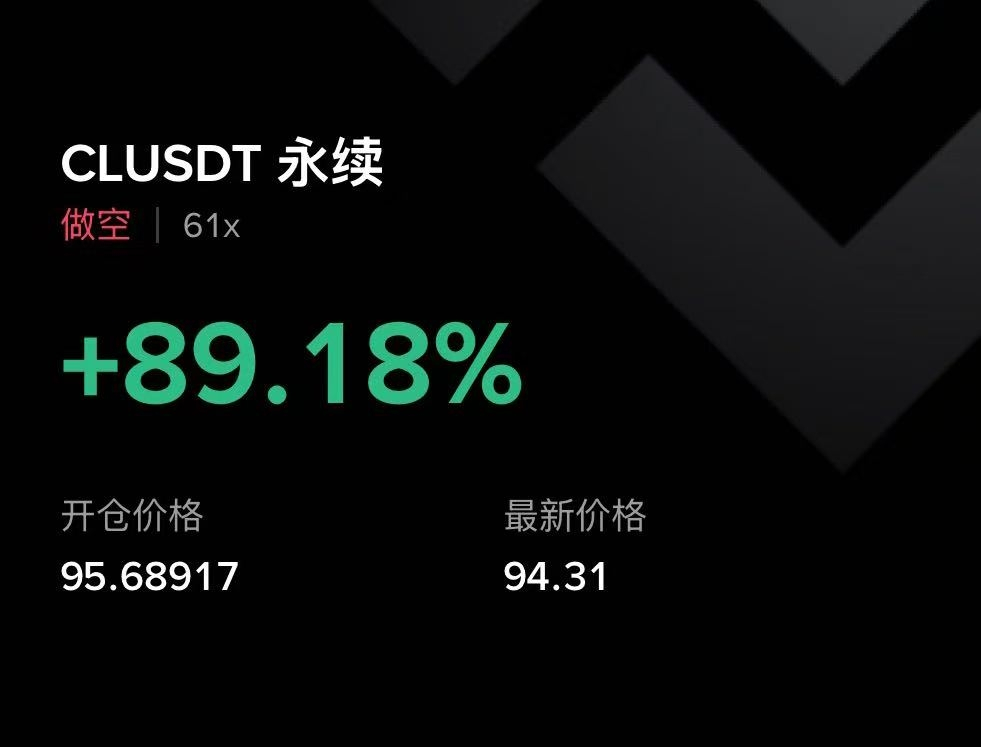
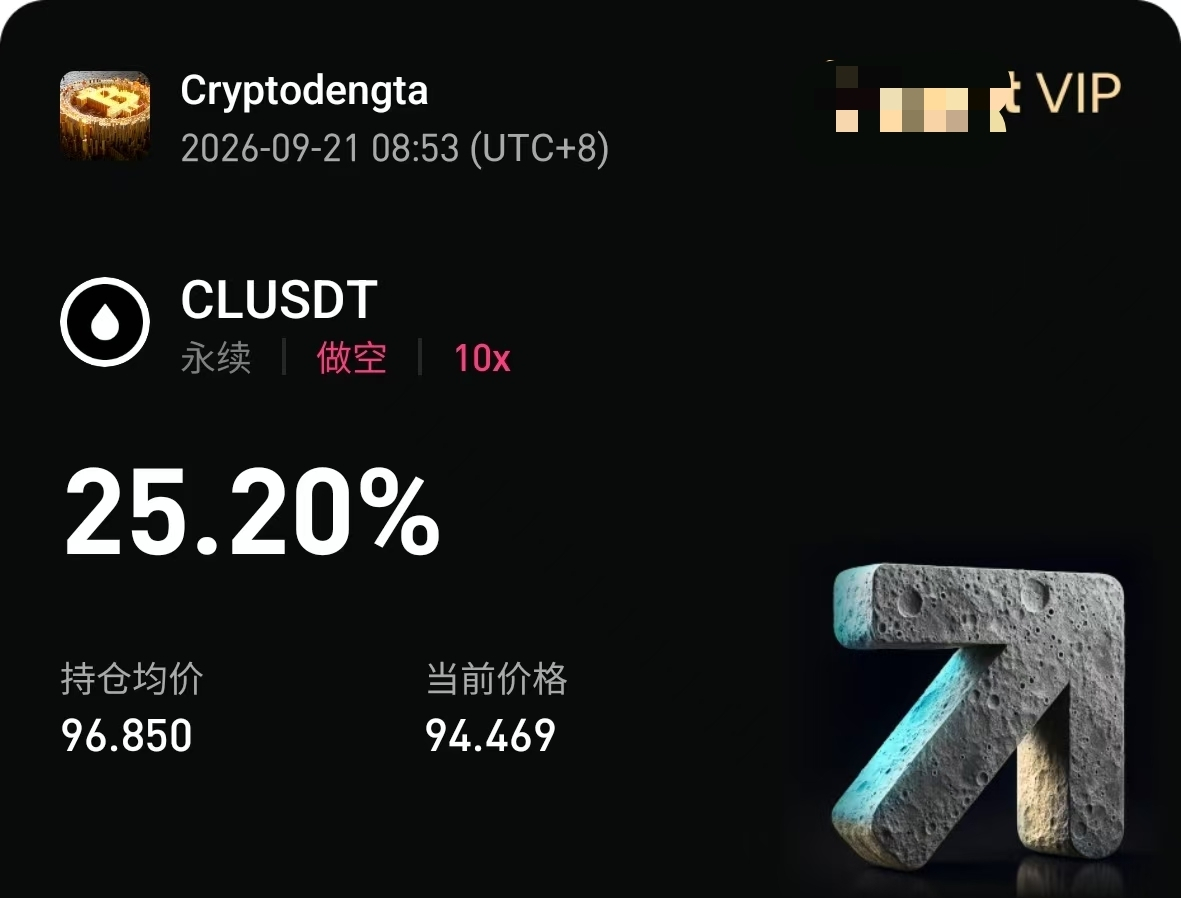
3. Oil: technically it’s biased bullish, but fundamentals have downside expectations. Oil is purely a risk asset. It clearly follows news sentiment. With the current ceasefire window showing up, after Trump pushes for ‘three-and-four’ conditions, negotiations will be accepted as well. That’s a near-term negative for oil. Compared with that, it’s a positive for Bitcoin and gold—using this positive is also why we continue to look for longs in Bitcoin and gold. However, oil will still see short-term pullbacks. After the adjustment, it should keep rising. The adjustment range is around 79–80. If the ceasefire move is larger, the expected adjustment target is around 71–72. $CL

4. Related to US stocks: recently there’s still a rebound, but it’s a sharp, high-volatility rebound. After the rebound, there will still be some adjustment.

Major fundamental items to watch:
1. This Thursday early morning: Google earnings report, which will affect the direction of tech and AI-related US stocks;
2. Next week: the PEC and the July FOMC rate decision meeting—Fed rate announcements and future expectations will impact everything;
3. Developments in Iran–Israel situation, oil-price impact, and the ceasefire negotiation window that may appear soon.

The above are my recent trading ideas and items to watch. These are for personal record only and do not constitute investment advice.
灯塔说
·
--
Why didn’t the first “ceasefire” window after the re-escalation of the situation between Iran and the US cool down oil prices?
Yesterday, Iran first proposed a 10-day ceasefire
In the evening, Trump wasn’t interested
(Probably because Iran opened a crude oil short, and Trump’s long position hasn’t been closed yet)
Today, the U.S. secretary of state said he is open to talks

But these updates didn’t cool oil prices—instead, they kept rising
This should be “the spokesperson” getting it wrong, and it has remained only talk

However, since there are signs of this, more voices calling for short-term ceasefires will likely appear soon. The market will watch Trump’s tone (when to take profit on the longs)

Yesterday, Iran proposed a “temporary ceasefire,” opening an 82 short, but it didn’t get a further response. When they woke up, they got stopped out
Recently, stocks, gold, and oil have all been rising across the board. Stocks have been profitable on the long side, while those short on oil have been losing

But as long as the “temporary ceasefire” window is reached, oil prices will quickly cool down.
$WTI.US $CL
Partly True
Why didn’t the first “ceasefire” window after the re-escalation of the situation between Iran and the US cool down oil prices? Yesterday, Iran first proposed a 10-day ceasefire In the evening, Trump wasn’t interested (Probably because Iran opened a crude oil short, and Trump’s long position hasn’t been closed yet) Today, the U.S. secretary of state said he is open to talks But these updates didn’t cool oil prices—instead, they kept rising This should be “the spokesperson” getting it wrong, and it has remained only talk However, since there are signs of this, more voices calling for short-term ceasefires will likely appear soon. The market will watch Trump’s tone (when to take profit on the longs) Yesterday, Iran proposed a “temporary ceasefire,” opening an 82 short, but it didn’t get a further response. When they woke up, they got stopped out Recently, stocks, gold, and oil have all been rising across the board. Stocks have been profitable on the long side, while those short on oil have been losing But as long as the “temporary ceasefire” window is reached, oil prices will quickly cool down. $WTI.US $CL
Why didn’t the first “ceasefire” window after the re-escalation of the situation between Iran and the US cool down oil prices?
Yesterday, Iran first proposed a 10-day ceasefire
In the evening, Trump wasn’t interested
(Probably because Iran opened a crude oil short, and Trump’s long position hasn’t been closed yet)
Today, the U.S. secretary of state said he is open to talks

But these updates didn’t cool oil prices—instead, they kept rising
This should be “the spokesperson” getting it wrong, and it has remained only talk

However, since there are signs of this, more voices calling for short-term ceasefires will likely appear soon. The market will watch Trump’s tone (when to take profit on the longs)

Yesterday, Iran proposed a “temporary ceasefire,” opening an 82 short, but it didn’t get a further response. When they woke up, they got stopped out
Recently, stocks, gold, and oil have all been rising across the board. Stocks have been profitable on the long side, while those short on oil have been losing

But as long as the “temporary ceasefire” window is reached, oil prices will quickly cool down.
$WTI.US $CL
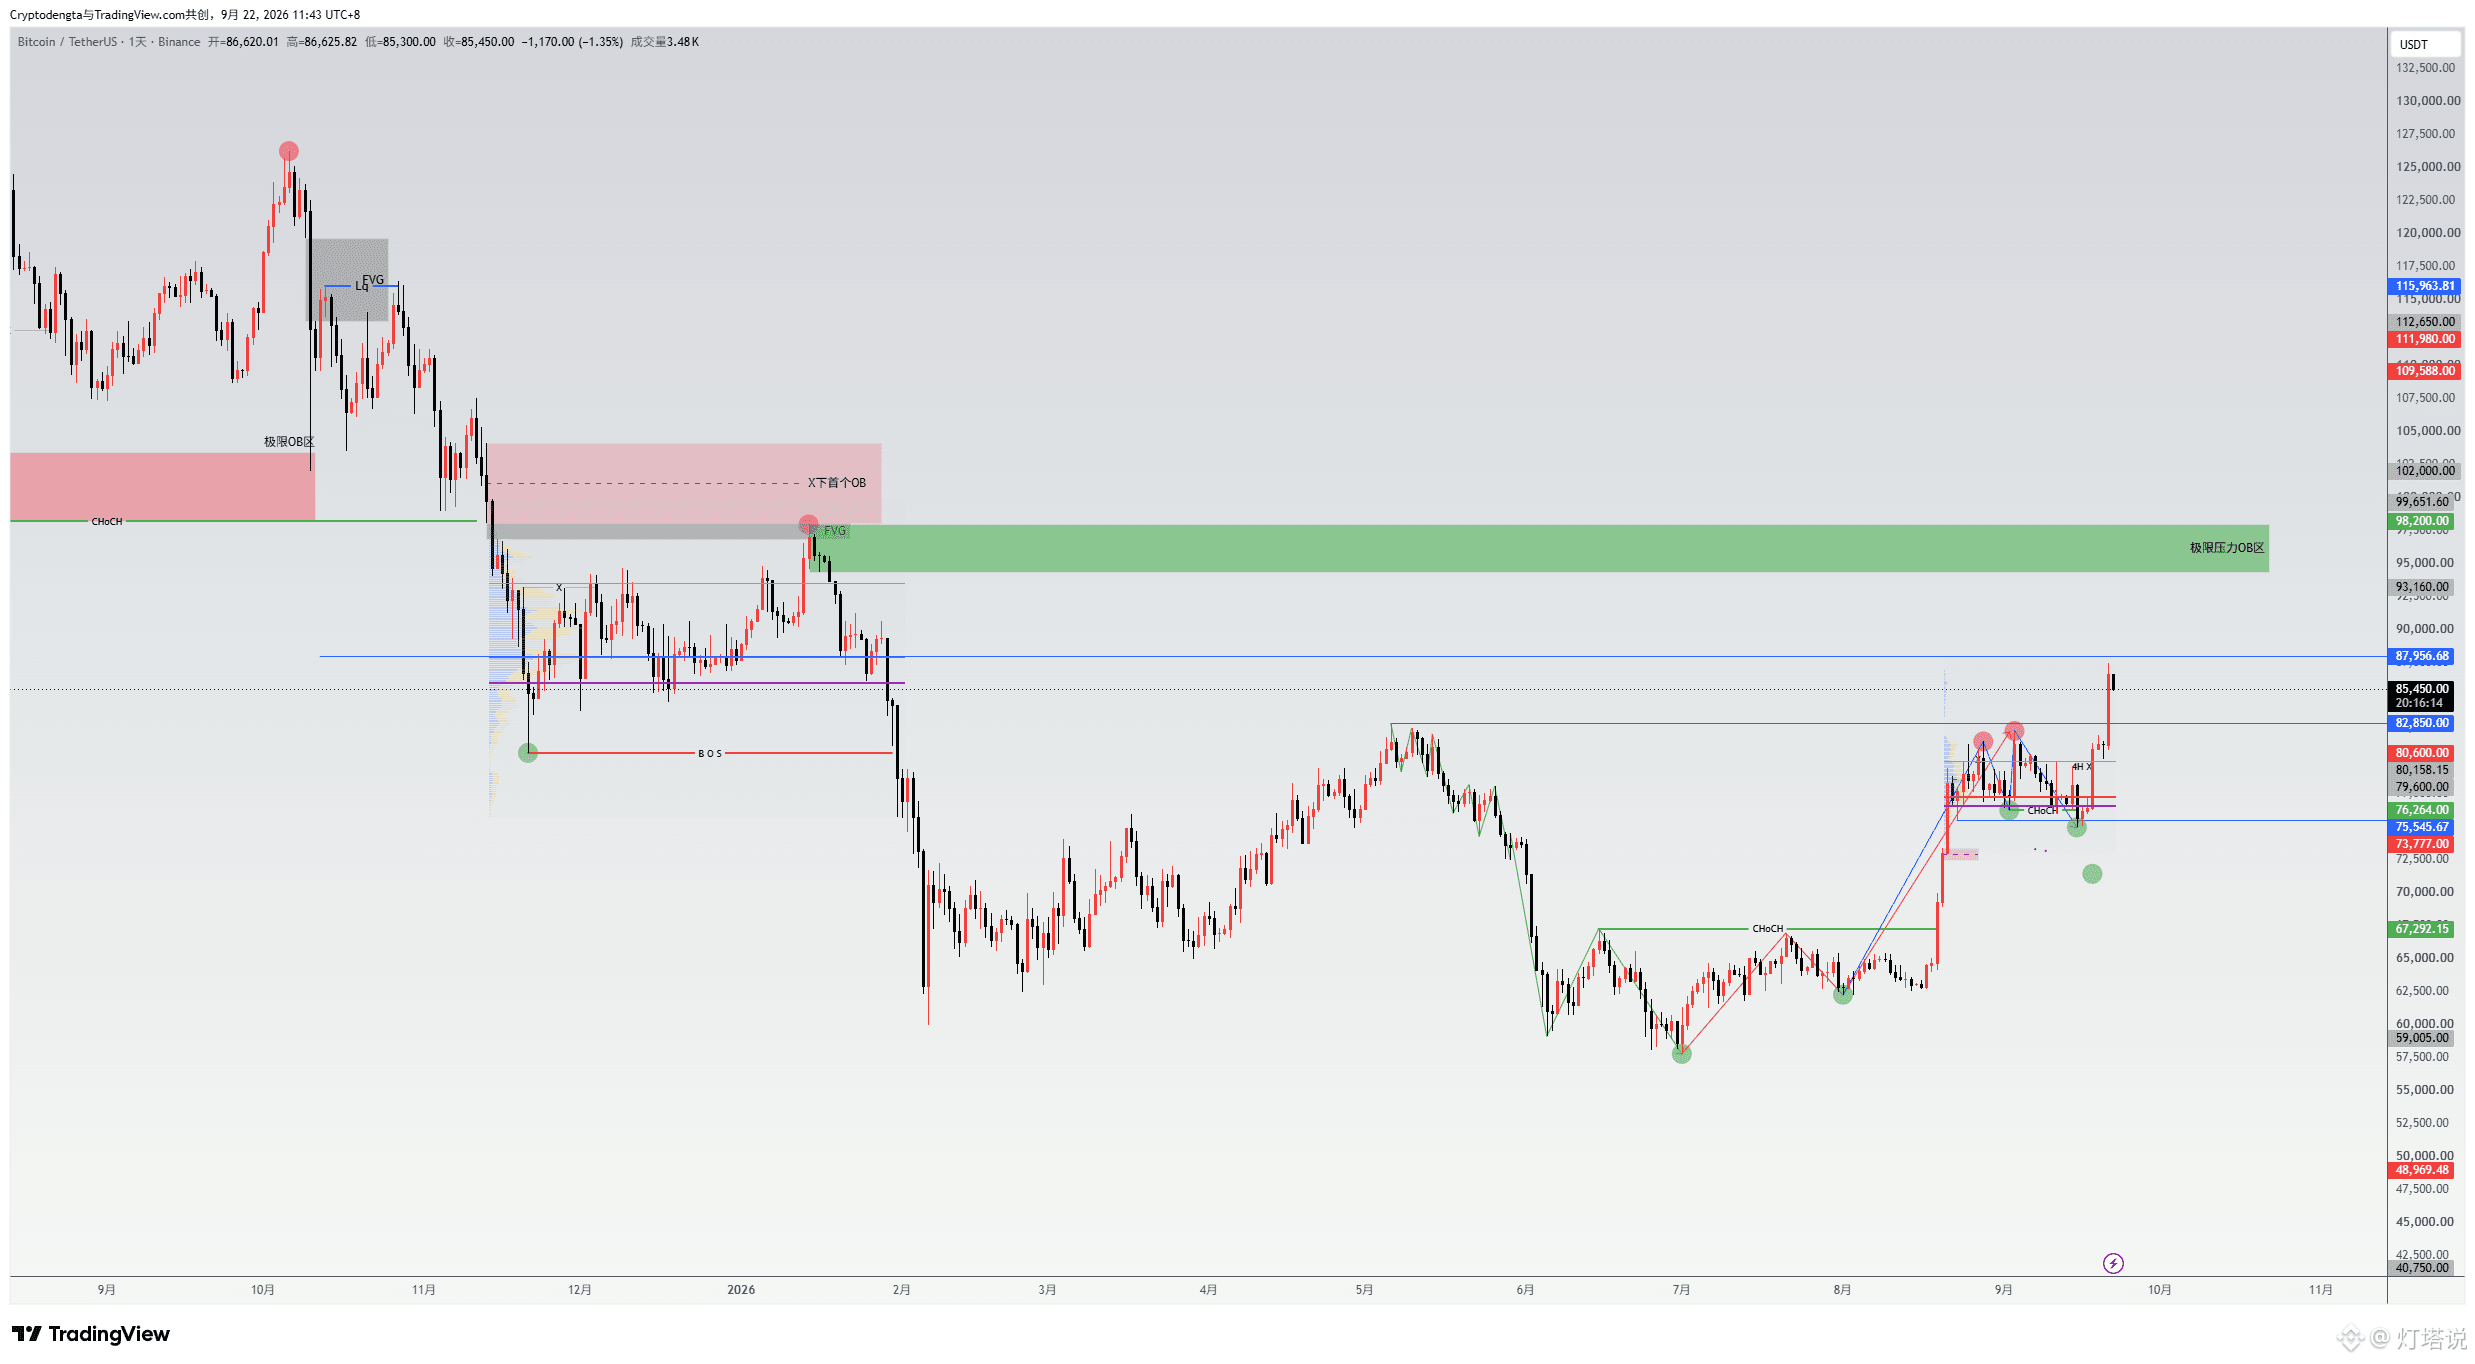
Bitcoin has broken through 66K. Gold has also reached 4080. When I wrote this piece over the weekend, I combined everything and concluded that 57K is the bottom, and that the future trend will be a sideways-to-upward rebound. It’s mainly judged from the macro perspective, options, positioning/flows, and technicals. In simple terms: 1. The main core is the macro fundamentals: Within 2026, the rate hikes will only “stop” in words; the demand for rate cuts outweighs inflation. Slightly higher inflation is already an accepted consensus. As long as the situation between Iran and the U.S. does not escalate into full-scale war, inflation will basically not deteriorate much. The negative impact here is visible. But the market won’t rise in a straight line. The Fed will still occasionally release some data and issue a few “verbal” hawkish signals to ease public fears about inflation. This expectation gap will bring interim consolidation and shakeouts. 2. In addition, the options market’s real pricing for what comes next is clearly bullish. In the market today, based on the latest weekly report from Deribit, the options for August expiry show a mild bullish tilt. For IBIT spot ETF options on the major options platform BlackRock (IBIT), the long-side sentiment is extremely hungry: the call-to-put ratio is above 4:1. This suggests that some large institutions’ “smart money” is front-running through ETF options. 3. From a technical standpoint: although the daily timeframe downtrend hasn’t changed, the 4-hour structure has already shown a reversal. Next, you can look to enter during short-term pullbacks when negative data hits, as those are the best times to get on board. Every day’s retracement is the best entry point. In the short term, watch the resistance zone at 66,500–67,300, and pay attention to whether a breakout above 67,300’s high is truly effective. If it breaks out effectively, the future outlook is 72K–73K. Gold is also bullish from the bottom! $BTC $XAU
Bitcoin has broken through 66K.
Gold has also reached 4080.

When I wrote this piece over the weekend, I combined everything and concluded that 57K is the bottom, and that the future trend will be a sideways-to-upward rebound.

It’s mainly judged from the macro perspective, options, positioning/flows, and technicals.

In simple terms:
1. The main core is the macro fundamentals: Within 2026, the rate hikes will only “stop” in words; the demand for rate cuts outweighs inflation. Slightly higher inflation is already an accepted consensus. As long as the situation between Iran and the U.S. does not escalate into full-scale war, inflation will basically not deteriorate much. The negative impact here is visible.

But the market won’t rise in a straight line. The Fed will still occasionally release some data and issue a few “verbal” hawkish signals to ease public fears about inflation. This expectation gap will bring interim consolidation and shakeouts.

2. In addition, the options market’s real pricing for what comes next is clearly bullish. In the market today, based on the latest weekly report from Deribit, the options for August expiry show a mild bullish tilt. For IBIT spot ETF options on the major options platform BlackRock (IBIT), the long-side sentiment is extremely hungry: the call-to-put ratio is above 4:1. This suggests that some large institutions’ “smart money” is front-running through ETF options.

3. From a technical standpoint: although the daily timeframe downtrend hasn’t changed, the 4-hour structure has already shown a reversal. Next, you can look to enter during short-term pullbacks when negative data hits, as those are the best times to get on board. Every day’s retracement is the best entry point.

In the short term, watch the resistance zone at 66,500–67,300, and pay attention to whether a breakout above 67,300’s high is truly effective. If it breaks out effectively, the future outlook is 72K–73K.

Gold is also bullish from the bottom!
$BTC $XAU
灯塔说
·
--
Oil prices are rising, and crypto and gold are rising as well. Has the market been de-sensitized?

Oil has quietly reached $82.8 today from yesterday.
It’s still affected by Iran’s strikes, hitting production facilities.
So I think the market’s expectations for the situation between the US and Iran are not good right now.

But what’s interesting is that from yesterday to today, as oil has risen, crypto and gold have risen along with it.
It’s almost like things have been de-sensitized.

This also shows that currently crypto’s bullish momentum relies more strongly on the upside from expectations of fewer/less aggressive interest rate hikes than on the longer-term expectation that further oil price increases will continue to affect next month’s inflation rebound.

By the end of the month, expectations for rate hikes have already dropped to the teens.
This month’s fundamentals are basically all supportive and sustained.
That’s also the basis for crypto to keep being positioned long at low levels.

Technically and fundamentally, the alignment for a continued long direction is expected to persist into early August.

But if the US–Iran situation continues to worsen without a window for improvement, then the August fundamentals at high oil prices will become a headwind.
At that time, there could be a 4-hour timeframe decline.

However, if within the next one to two weeks there is a window of relief for the US–Iran situation, that would be an additional positive for crypto.
Gold and crypto would then ride the momentum to climb to a higher level.

In summary: this month’s fundamentals are good.
I remain optimistic about the continued rebound in crypto and gold.
Even if next month’s data turns negative, the best low-buy opportunity after a sell-off would be created.
Simply put: the low point in June will very likely mark a cyclical bottom.
$XAU $BTC $CL


In recent days, the market has been trending up, and today the fundamentals also brought some positive news: 1. ETF capital has flowed back again, providing support on the spot side On July 20, the total net inflow into US spot BTC ETFs was approximately $226.8 million, while ETH ETFs saw net inflows of about $38 million. This means this uptrend is not entirely due to short-covering in the derivatives market. There is indeed incremental spot buying pressure, which is especially favorable for BTC. However, it’s important to note that inflows on a single day can only provide short-term support. Only if net inflows are sustained for multiple consecutive days can the current situation truly change—particularly the previously relatively weak positioning of mid-term capital. 2. The macro environment is not purely “risk-on” The market currently shows clear contradictions: Softer-than-expected inflation data earlier helped risk assets recover, but the situation in the Middle East has heated up again. Brent crude briefly broke above $90, and yields on long-term US Treasuries rose. The market is once again pricing in the risk of energy-driven inflation. Stocks in the US closed lower overall on Monday, suggesting traditional risk assets have not fully confirmed a new expansion of risk appetite. This explains the current characteristics of crypto prices: The price is strong, but the macro environment hasn’t fully aligned. Therefore, once oil prices, the US dollar, and US Treasury yields continue to rise, after BTC and ETH sweep through the liquidity above, a rapid pullback is likely. 3. The market enters “pre-FOMC” positioning and game The Federal Reserve will hold an FOMC meeting on July 28–29. Then, on July 30, it will release the initial estimate of Q2 GDP and the June PCE. This week lacks US economic data at the same level of significance. In the short term, the market is mainly driven by: Middle East developments and oil prices; US Treasury yields; Earnings reports from large US tech companies; BTC and ETH ETF fund flows; These factors drive the move. $XAU $BTC {spot}(BTCUSDT)
In recent days, the market has been trending up, and today the fundamentals also brought some positive news:

1. ETF capital has flowed back again, providing support on the spot side

On July 20, the total net inflow into US spot BTC ETFs was approximately $226.8 million, while ETH ETFs saw net inflows of about $38 million.

This means this uptrend is not entirely due to short-covering in the derivatives market. There is indeed incremental spot buying pressure, which is especially favorable for BTC.

However, it’s important to note that inflows on a single day can only provide short-term support. Only if net inflows are sustained for multiple consecutive days can the current situation truly change—particularly the previously relatively weak positioning of mid-term capital.

2. The macro environment is not purely “risk-on”

The market currently shows clear contradictions:

Softer-than-expected inflation data earlier helped risk assets recover, but the situation in the Middle East has heated up again. Brent crude briefly broke above $90, and yields on long-term US Treasuries rose. The market is once again pricing in the risk of energy-driven inflation. Stocks in the US closed lower overall on Monday, suggesting traditional risk assets have not fully confirmed a new expansion of risk appetite.

This explains the current characteristics of crypto prices:

The price is strong, but the macro environment hasn’t fully aligned.

Therefore, once oil prices, the US dollar, and US Treasury yields continue to rise, after BTC and ETH sweep through the liquidity above, a rapid pullback is likely.

3. The market enters “pre-FOMC” positioning and game

The Federal Reserve will hold an FOMC meeting on July 28–29. Then, on July 30, it will release the initial estimate of Q2 GDP and the June PCE.

This week lacks US economic data at the same level of significance. In the short term, the market is mainly driven by:

Middle East developments and oil prices;

US Treasury yields;

Earnings reports from large US tech companies;

BTC and ETH ETF fund flows;

These factors drive the move.

$XAU
$BTC
Today, U.S. Federal Reserve “message bureau” Nick Timiraos leaked an important data point (see picture) This time, he essentially nailed the core PCE to within 0.18%. And he even directly gave the overall PCE a negative value of -0.07%. This isn’t a forecast. This is the Fed, using his mouth, to quietly hand the answer to the market early. The value of the so-called “new Fed press agency” is fully on display here—rather than being a financial journalist’s conjecture, it’s more like the policy side laying the final-mile groundwork for expectation management. For us traders, the signal here is absolutely crushing: Core PCE’s 0.18% month-over-month, annualized, is firmly within the Fed’s 2% target. And when overall PCE turns negative growth, it directly strikes inflation off the checklist of “policy constraints.” The rate-cut path and the easing pace— the biggest obstacle on the way has already been removed. What remains is mainly the timetable and magnitude. Translating this onto the market: it’s essentially a “locked-in tell” for liquid assets: The top for the U.S. dollar and U.S. Treasury yields is nailed down by this data, and in the near term it’s unlikely that anything will stir up major waves again. The macro foundation for gold is further reinforced—under the twin boosts of cooling inflation + rising easing expectations, the logic for gold to move higher is actually smoother. For risk assets like BTC and U.S. equities, the biggest funding-side nightmare over the past six months—“what if inflation flares up again?”—can, for now, be set aside. But timing matters—there’s one detail worth watching: Because the “leaking the answer early” has already become a market consensus, the bulls’ front-running pricing will have largely been completed before the actual data is released. On the day PCE is officially published, if the numbers come in as expected, you should also guard against a short-term washout driven by “good news already priced in.” On the bigger cycle, the logic is now closed-loop: Inflation constraint removed → easing path made smooth → liquid assets benefit. For the medium- to long-term framework of going long risk assets and gold on dips, the macro backing is now even firmer. Don’t let short-term volatility shake you out of the train. That’s one of the reasons you’ve seen continued low-entry long positioning recently. $BTC $XAU Declaration of interest: currently holding long positions in gold and BTC. [The above is only a personal trading framework share and does not constitute any investment advice]
Today, U.S. Federal Reserve “message bureau” Nick Timiraos leaked an important data point (see picture)

This time, he essentially nailed the core PCE to within 0.18%. And he even directly gave the overall PCE a negative value of -0.07%.

This isn’t a forecast.

This is the Fed, using his mouth, to quietly hand the answer to the market early.

The value of the so-called “new Fed press agency” is fully on display here—rather than being a financial journalist’s conjecture, it’s more like the policy side laying the final-mile groundwork for expectation management.

For us traders, the signal here is absolutely crushing:

Core PCE’s 0.18% month-over-month, annualized, is firmly within the Fed’s 2% target. And when overall PCE turns negative growth, it directly strikes inflation off the checklist of “policy constraints.” The rate-cut path and the easing pace— the biggest obstacle on the way has already been removed. What remains is mainly the timetable and magnitude.

Translating this onto the market: it’s essentially a “locked-in tell” for liquid assets:

The top for the U.S. dollar and U.S. Treasury yields is nailed down by this data, and in the near term it’s unlikely that anything will stir up major waves again. The macro foundation for gold is further reinforced—under the twin boosts of cooling inflation + rising easing expectations, the logic for gold to move higher is actually smoother. For risk assets like BTC and U.S. equities, the biggest funding-side nightmare over the past six months—“what if inflation flares up again?”—can, for now, be set aside.

But timing matters—there’s one detail worth watching:

Because the “leaking the answer early” has already become a market consensus, the bulls’ front-running pricing will have largely been completed before the actual data is released. On the day PCE is officially published, if the numbers come in as expected, you should also guard against a short-term washout driven by “good news already priced in.”

On the bigger cycle, the logic is now closed-loop:

Inflation constraint removed → easing path made smooth → liquid assets benefit. For the medium- to long-term framework of going long risk assets and gold on dips, the macro backing is now even firmer.

Don’t let short-term volatility shake you out of the train. That’s one of the reasons you’ve seen continued low-entry long positioning recently.
$BTC $XAU
Declaration of interest: currently holding long positions in gold and BTC.
[The above is only a personal trading framework share and does not constitute any investment advice]
The market is currently leaning bullish in all aspects. I believe 57K is already a phase-level bottom. I've been going long at low levels recently. Only do longs. $BTC $XAU {spot}(BTCUSDT)
The market is currently leaning bullish in all aspects.
I believe 57K is already a phase-level bottom.
I've been going long at low levels recently.
Only do longs.
$BTC $XAU
Lately, it feels like something is changing. In the past, the biggest risk in the market was always outside the United States. Now, more and more uncertainty is starting to come from within the United States itself. What is truly worth paying attention to is not a single policy shift. It’s when the world begins to reassess: who can still provide stability. Because what the market ultimately trades isn’t the news. It’s expectations about the future order. The value of gold’s future will keep rising $XAU
Lately, it feels like something is changing.
In the past, the biggest risk in the market
was always outside the United States.
Now, more and more uncertainty
is starting to come from within the United States itself.
What is truly worth paying attention to
is not a single policy shift.
It’s when the world begins to reassess:
who can still provide stability.
Because what the market ultimately trades
isn’t the news.
It’s expectations about the future order.

The value of gold’s future will keep rising
$XAU
Oil prices are rising, and crypto and gold are rising as well. Has the market been de-sensitized? Oil has quietly reached $82.8 today from yesterday. It’s still affected by Iran’s strikes, hitting production facilities. So I think the market’s expectations for the situation between the US and Iran are not good right now. But what’s interesting is that from yesterday to today, as oil has risen, crypto and gold have risen along with it. It’s almost like things have been de-sensitized. This also shows that currently crypto’s bullish momentum relies more strongly on the upside from expectations of fewer/less aggressive interest rate hikes than on the longer-term expectation that further oil price increases will continue to affect next month’s inflation rebound. By the end of the month, expectations for rate hikes have already dropped to the teens. This month’s fundamentals are basically all supportive and sustained. That’s also the basis for crypto to keep being positioned long at low levels. Technically and fundamentally, the alignment for a continued long direction is expected to persist into early August. But if the US–Iran situation continues to worsen without a window for improvement, then the August fundamentals at high oil prices will become a headwind. At that time, there could be a 4-hour timeframe decline. However, if within the next one to two weeks there is a window of relief for the US–Iran situation, that would be an additional positive for crypto. Gold and crypto would then ride the momentum to climb to a higher level. In summary: this month’s fundamentals are good. I remain optimistic about the continued rebound in crypto and gold. Even if next month’s data turns negative, the best low-buy opportunity after a sell-off would be created. Simply put: the low point in June will very likely mark a cyclical bottom. $XAU $BTC $CL {future}(CLUSDT) {spot}(BTCUSDT) {future}(XAUUSDT)
Oil prices are rising, and crypto and gold are rising as well. Has the market been de-sensitized?

Oil has quietly reached $82.8 today from yesterday.
It’s still affected by Iran’s strikes, hitting production facilities.
So I think the market’s expectations for the situation between the US and Iran are not good right now.

But what’s interesting is that from yesterday to today, as oil has risen, crypto and gold have risen along with it.
It’s almost like things have been de-sensitized.

This also shows that currently crypto’s bullish momentum relies more strongly on the upside from expectations of fewer/less aggressive interest rate hikes than on the longer-term expectation that further oil price increases will continue to affect next month’s inflation rebound.

By the end of the month, expectations for rate hikes have already dropped to the teens.
This month’s fundamentals are basically all supportive and sustained.
That’s also the basis for crypto to keep being positioned long at low levels.

Technically and fundamentally, the alignment for a continued long direction is expected to persist into early August.

But if the US–Iran situation continues to worsen without a window for improvement, then the August fundamentals at high oil prices will become a headwind.
At that time, there could be a 4-hour timeframe decline.

However, if within the next one to two weeks there is a window of relief for the US–Iran situation, that would be an additional positive for crypto.
Gold and crypto would then ride the momentum to climb to a higher level.

In summary: this month’s fundamentals are good.
I remain optimistic about the continued rebound in crypto and gold.
Even if next month’s data turns negative, the best low-buy opportunity after a sell-off would be created.
Simply put: the low point in June will very likely mark a cyclical bottom.
$XAU $BTC $CL
灯塔说
·
--
Central bank reserves are long-term, and long-term they are very favorable.
They have little to do with short-term moves.
But there is limited downside room in the near term.

You should know that the major non-US central banks started stockpiling gold in 2022, when the Russia-Ukraine war began.
At that time, the US froze and sanctioned Russia, leading some non-US countries to start “selling US Treasuries and buying gold.”
They stockpile every year.
$XAU
Partly True
Central bank reserves are long-term, and long-term they are very favorable. They have little to do with short-term moves. But there is limited downside room in the near term. You should know that the major non-US central banks started stockpiling gold in 2022, when the Russia-Ukraine war began. At that time, the US froze and sanctioned Russia, leading some non-US countries to start “selling US Treasuries and buying gold.” They stockpile every year. $XAU {future}(XAUUSDT)
Central bank reserves are long-term, and long-term they are very favorable.
They have little to do with short-term moves.
But there is limited downside room in the near term.

You should know that the major non-US central banks started stockpiling gold in 2022, when the Russia-Ukraine war began.
At that time, the US froze and sanctioned Russia, leading some non-US countries to start “selling US Treasuries and buying gold.”
They stockpile every year.
$XAU
Why is the U.S. stock market dropping so much? When will it be time to buy the dip? It dropped yesterday and has kept falling until today. It’s a one-way drop like a cliff. One side says profit-taking is unloading. The other side says AI storage demand is still very high and it will keep rising in the future. What do you think? $NVDA.US $AAPL.US $GOOGL.US
Why is the U.S. stock market dropping so much? When will it be time to buy the dip?
It dropped yesterday and has kept falling until today.
It’s a one-way drop like a cliff.

One side says profit-taking is unloading.
The other side says AI storage demand is still very high and it will keep rising in the future.

What do you think?
$NVDA.US $AAPL.US $GOOGL.US
NVDAUS+1.08%
AAPLUS+0.36%
GOOGLUS+1.17%
U.S. stock tech sector selloff creates a synchronized move Last night: Nasdaq Composite fell by about 1.47%; Nasdaq 100 fell by about 1.62%; Semiconductor sector fell by about 4.3%; S&P 500 fell by about 0.51%. Technology and semiconductors were the core of last night’s risk-asset liquidation. During the U.S. trading session, BTC and ETH failed to strengthen independently—instead, they retreated in line with high-beta technology assets. $MU $SKHY $SNDK
U.S. stock tech sector selloff creates a synchronized move
Last night:
Nasdaq Composite fell by about 1.47%;
Nasdaq 100 fell by about 1.62%;
Semiconductor sector fell by about 4.3%;
S&P 500 fell by about 0.51%.
Technology and semiconductors were the core of last night’s risk-asset liquidation. During the U.S. trading session, BTC and ETH failed to strengthen independently—instead, they retreated in line with high-beta technology assets.
$MU $SKHY $SNDK
灯塔说
·
--
#美股就是最大的山寨
Resist the high volatility upfront
Get on at night and get trapped instantly
Today I bought A after yesterday’s entire rebound and still made a new low

After the AI hype cools off and a broad selloff starts, buying the Seven Sisters is the safest
The $MSFT I recommended earlier always rises when AI stocks dump and have a broad decline
Today is mostly red with just a little green

Give me my money back, I’m done playing
#美股就是最大的山寨 Resist the high volatility upfront Get on at night and get trapped instantly Today I bought A after yesterday’s entire rebound and still made a new low After the AI hype cools off and a broad selloff starts, buying the Seven Sisters is the safest The $MSFT I recommended earlier always rises when AI stocks dump and have a broad decline Today is mostly red with just a little green Give me my money back, I’m done playing
#美股就是最大的山寨
Resist the high volatility upfront
Get on at night and get trapped instantly
Today I bought A after yesterday’s entire rebound and still made a new low

After the AI hype cools off and a broad selloff starts, buying the Seven Sisters is the safest
The $MSFT I recommended earlier always rises when AI stocks dump and have a broad decline
Today is mostly red with just a little green

Give me my money back, I’m done playing
灯塔说
·
--
Big pie, Ethereum, and gold have all reached my stage take-profit target position
All positions have been closed
Now I'm short-term selling short at $MU
In the medium term I'm going long on Microsoft $MSFT
【Personal opinion only, not investment advice】
Sync my trading plan for today: Basically still follows yesterday’s view. $BTC : For BTC, you can go long on short dips or short from highs—wait. The cleanup/stop-run highs to short are in the 65600–66300 range. For the downside, wait for a short-term long in 63550–63900; this is the 1-hour support demand zone. In this leg of the rise from 61800 to 65600, the OTE area is roughly 62600–63250. Above that is the reasonable buy-in zone. For $ETH : the short-long entry is around 1870–1890, and it’s stronger than BTC. For shorts, only consider entries around 2045, which is also this rebound’s high point. 1960–1980 is a place to scalp short. $XAU (gold): go long and wait around 4005–3995. If it breaks below here, then observe whether it can hold the down-move and stabilize in the 3980–3960 range. There’s no favorable risk-reward yet for shorting. If a short-term rebound cannot break above and hold around 4060, it may continue to adjust downward. 【Risk reminder: this is only my personal view for record and does not constitute any investment advice】
Sync my trading plan for today:
Basically still follows yesterday’s view.
$BTC : For BTC, you can go long on short dips or short from highs—wait. The cleanup/stop-run highs to short are in the 65600–66300 range.
For the downside, wait for a short-term long in 63550–63900; this is the 1-hour support demand zone.
In this leg of the rise from 61800 to 65600, the OTE area is roughly 62600–63250.
Above that is the reasonable buy-in zone.
For $ETH : the short-long entry is around 1870–1890, and it’s stronger than BTC. For shorts, only consider entries around 2045, which is also this rebound’s high point.
1960–1980 is a place to scalp short.
$XAU (gold): go long and wait around 4005–3995. If it breaks below here, then observe whether it can hold the down-move and stabilize in the 3980–3960 range.
There’s no favorable risk-reward yet for shorting. If a short-term rebound cannot break above and hold around 4060, it may continue to adjust downward.
【Risk reminder: this is only my personal view for record and does not constitute any investment advice】
灯塔说
·
--
Update today on my subjective views regarding the subsequent行情 for each product:
$BTC 4 The rising structure over the past 24 hours looks good, but in the short term I do not recommend chasing it around 65.5K. The 65.6K–66.3K zone is a very important resistance. I expect a pullback at about a 4-hour timeframe. The exact pullback range needs to wait for confirmation of a peak. (Kong if you got stopped in this range)
$ETH is synchronized with Bitcoin, but in the short term, for this rebound, first look around 2030. (Give up on trading)
Gold: $XAU Before it breaks through and holds above 4110, I expect it may revisit around 4000 again. However, above 3950, I would still consider going long. (Kong if you got stopped around here for DUO)
The above are stage-by-stage opinions based on technical analysis and fundamentals.
【This is only personal trading opinion record and does not constitute any investment advice】
Wosh is very tough (hawk) The first thing I do every day at work is to summarize the latest fundamentals from the past day. With the current macro environment directly driving asset volatility, fundamentals are the top priority to understand, and then—only after that—look at technical analysis. This applies to crude oil, gold, BTC, and the US stock market (ranked by their impact priority). To sum up: At present, the impact from fundamentals is a mix of bullish and bearish factors. July is still in the favorable stage of low rate-hike expectations. But after mid-August, rate-hike expectations will reignite, and the September rate-hike expectations will be even higher—making it bearish. Therefore, in July the market environment is characterized by a range-bound rebound trend (gold $XAU 、$BTC ), not a strong one-direction trend. Avoid chasing longs on emotion, and don’t be overly aggressive in chasing shorts either. Buying on pullbacks is the best strategy. The July 30 rate decision meeting basically maintained interest rates unchanged, which is bullish. The only current bearish factor is the escalation of the US-Iran situation, which has driven crude oil prices higher. Although the 70-minute bombardment yesterday didn’t cause much volatility in gold or crude oil—and even affected them less directly—it hasn’t removed the risk from this situation. Instead, if high oil prices keep persisting without easing, it will push up inflation expectations again, offsetting the recent positive effects from soft CPI and PPI. Over the past two days, Wosh also conveyed important bearish signals in his testimony before two houses of Congress. Wosh is “very tough (hawk).” In both appearances, his stance was consistent: zero tolerance for persistently high inflation, but the inflation task hasn’t been completed yet. CPI and other indicators are not the only references. Also, the risk at the tail end of this year’s rate hikes is still there, as the demand for Trump to cut rates is not being met. In summary, fundamentals are somewhat contradictory right now, but as time passes, events will become clearer. As long as the US-Iran conflict doesn’t continue to escalate, oil prices don’t break further upward, and inflation naturally cools, then everything will be fine. On the other hand, if stagflation restarts, it will be bad for gold, crypto, and the US stock market. If you think the summary is good, add a follow and watch for my future market interpretation. 【Risk warning: This is only a record of personal viewpoints and does not constitute any investment advice】
Wosh is very tough (hawk)

The first thing I do every day at work is to summarize the latest fundamentals from the past day.
With the current macro environment directly driving asset volatility, fundamentals are the top priority to understand, and then—only after that—look at technical analysis.
This applies to crude oil, gold, BTC, and the US stock market (ranked by their impact priority).

To sum up: At present, the impact from fundamentals is a mix of bullish and bearish factors. July is still in the favorable stage of low rate-hike expectations. But after mid-August, rate-hike expectations will reignite, and the September rate-hike expectations will be even higher—making it bearish.

Therefore, in July the market environment is characterized by a range-bound rebound trend (gold $XAU $BTC ), not a strong one-direction trend. Avoid chasing longs on emotion, and don’t be overly aggressive in chasing shorts either. Buying on pullbacks is the best strategy. The July 30 rate decision meeting basically maintained interest rates unchanged, which is bullish.

The only current bearish factor is the escalation of the US-Iran situation, which has driven crude oil prices higher. Although the 70-minute bombardment yesterday didn’t cause much volatility in gold or crude oil—and even affected them less directly—it hasn’t removed the risk from this situation. Instead, if high oil prices keep persisting without easing, it will push up inflation expectations again, offsetting the recent positive effects from soft CPI and PPI.

Over the past two days, Wosh also conveyed important bearish signals in his testimony before two houses of Congress. Wosh is “very tough (hawk).” In both appearances, his stance was consistent: zero tolerance for persistently high inflation, but the inflation task hasn’t been completed yet. CPI and other indicators are not the only references. Also, the risk at the tail end of this year’s rate hikes is still there, as the demand for Trump to cut rates is not being met.

In summary, fundamentals are somewhat contradictory right now, but as time passes, events will become clearer. As long as the US-Iran conflict doesn’t continue to escalate, oil prices don’t break further upward, and inflation naturally cools, then everything will be fine. On the other hand, if stagflation restarts, it will be bad for gold, crypto, and the US stock market.

If you think the summary is good, add a follow and watch for my future market interpretation.
【Risk warning: This is only a record of personal viewpoints and does not constitute any investment advice】
#2026足球风潮 #世界杯2026 I don’t know how to describe Argentina’s matches. From the 2022 final to this year’s quarterfinals, and then the semifinals— Messi is just lucky. The teammates around him are so dependable. I can’t even expect France 🇫🇷 to have a comeback-from-the-brink kind of scene like this. That’s probably the魅魅 of football. All it takes is one match for you to turn into a fan. In the final, I’m definitely supporting Spain!! Argentina’s luck ran out 😂😂 #世界杯决赛
#2026足球风潮 #世界杯2026
I don’t know how to describe Argentina’s matches.
From the 2022 final to this year’s quarterfinals, and then the semifinals—
Messi is just lucky.
The teammates around him are so dependable.
I can’t even expect France 🇫🇷 to have a comeback-from-the-brink kind of scene like this.
That’s probably the魅魅 of football.
All it takes is one match for you to turn into a fan.
In the final, I’m definitely supporting Spain!! Argentina’s luck ran out 😂😂
#世界杯决赛
Log in to explore more content
Join global crypto users on Binance Square
⚡️ Get latest and useful information about crypto.
💬 Trusted by the world’s largest crypto exchange.
👍 Discover real insights from verified creators.
Email / Phone number
Sitemap
Cookie Preferences
Platform T&Cs