
Chart-Sniper
614 Posts

Chart-Sniper
Report
Block User
🎯 ChartSniper is your go-to spot for spotting top crypto gainers and breakout setups in real time. I focus on clean chart analysis, key support and resistance.
Open Trade
Occasional Trader
4.8 Months
5 Following
49 Followers
139 Liked
Posts
Portfolio
·
--
Article
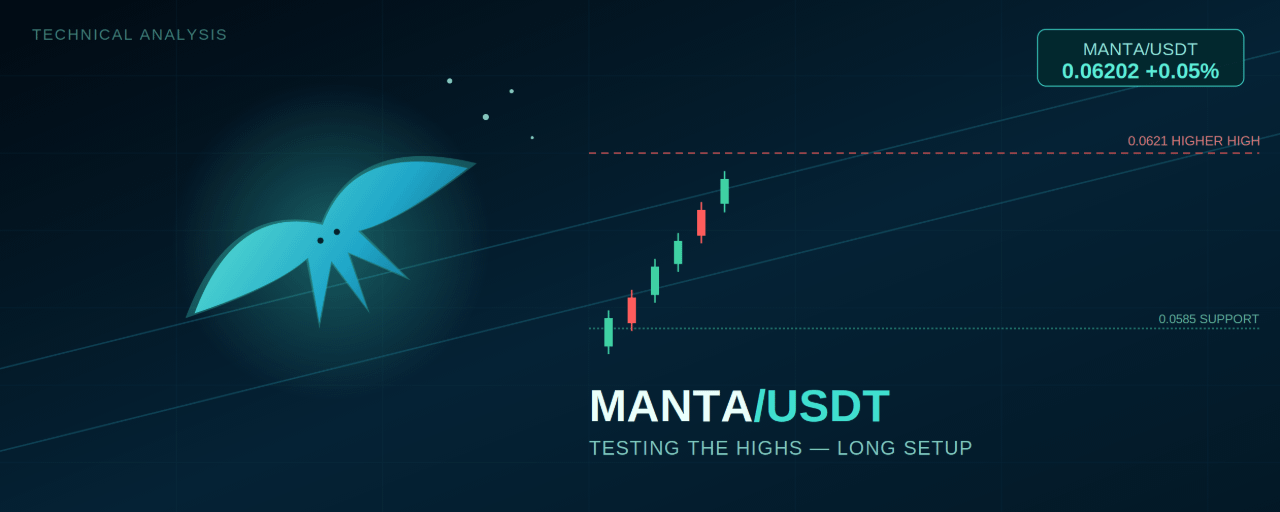
MANTA/USDT: Testing the Highs After a Flawless Ascending Channel Run$MANTA
{future}(MANTAUSDT)
Manta Network has been quietly putting together one of the more disciplined uptrends on the board — a steady climb of higher lows and higher highs, all contained neatly inside a single rising channel. Now, with price pressing right back up against its recent peak, the setup is shaping into a classic breakout-retest opportunity for traders leaning long.
Reading the Structure
The move started from a Higher Low near 0.0552 and has climbed in textbook fashion ever since — a Lower High around 0.0578, a second Lower High near 0.0592, and finally a Higher High at 0.0621. Every leg of this advance has stayed contained inside a well-defined ascending channel, with price respecting both the rising support line beneath it and a parallel line above.
Price is now trading at 0.06202, right at the 0.00% fib level (the recent Higher High), having pulled back only modestly along the way. A Fibonacci retracement from the Higher Low to the Higher High maps out the key support levels below: 38.2% at 0.05924, 50% around 0.0585, and 61.8% at 0.05747 — all of which lined up closely with the channel's lower boundary during the pullback phases, reinforcing the same zones from two different tools at once.
Momentum Still Points Up
RSI (14) reads 62.53 with its moving average at 56.80 — both above the 50 midline and both trending upward. RSI spiked toward 70+ earlier during the steepest part of the rally and has since cooled into a healthier range without breaking down, which is typical of a trend digesting gains rather than reversing.
Trade Setup — Long Bias
Price sitting right at the recent high, inside an intact rising channel, with momentum still constructive, favors a breakout-continuation approach.
Aggressive entry: 0.0620–0.0623, on a confirmed break and hold above the 0.0621 Higher HighConservative entry: 0.0592–0.0598, on a retest of the 38.2% fib level and the channel's lower trendline holding as supportStop-loss: Below 0.05747 (the 61.8% fib) — a break here would put price back below the channel entirely and undercut the higher-low structureTarget 1: 0.0650 (aligned with the channel's upper trendline projection)Target 2: 0.0680Target 3 (extended): 0.0700+, only on strong volume confirming a clean breakout above the channel
Invalidation to watch: A decisive close back below 0.0585 (the 50% fib) would suggest the breakout attempt has failed and the pullback is turning into something deeper, shifting focus back toward the 0.0552 Higher Low.
The Bottom Line
MANTA/USDT is doing exactly what a strong trend should do — grinding higher inside a clean channel and now testing the top of its recent range with momentum intact. As long as the channel and the 0.0585 pivot hold, the bias stays long, with 0.0650 and then 0.0680 as the next levels to watch on a confirmed breakout.
This analysis is based on technical chart structure and is for informational purposes only. It is not financial advice. Cryptocurrency markets are highly volatile — always do your own research and manage risk according to your own trading plan before entering any position.
@Binance_Square_Official #BTCBreaks80K #BuffettBecomesBerkshireChairmanEmeritus #ZcashSpotETFTops$230MMonthlyInflow #Binance #ChartSniper
MANTA/USDT: Testing the Highs After a Flawless Ascending Channel Run
$MANTA
Manta Network has been quietly putting together one of the more disciplined uptrends on the board — a steady climb of higher lows and higher highs, all contained neatly inside a single rising channel. Now, with price pressing right back up against its recent peak, the setup is shaping into a classic breakout-retest opportunity for traders leaning long.
Reading the Structure
The move started from a Higher Low near 0.0552 and has climbed in textbook fashion ever since — a Lower High around 0.0578, a second Lower High near 0.0592, and finally a Higher High at 0.0621. Every leg of this advance has stayed contained inside a well-defined ascending channel, with price respecting both the rising support line beneath it and a parallel line above.
Price is now trading at 0.06202, right at the 0.00% fib level (the recent Higher High), having pulled back only modestly along the way. A Fibonacci retracement from the Higher Low to the Higher High maps out the key support levels below: 38.2% at 0.05924, 50% around 0.0585, and 61.8% at 0.05747 — all of which lined up closely with the channel's lower boundary during the pullback phases, reinforcing the same zones from two different tools at once.
Momentum Still Points Up
RSI (14) reads 62.53 with its moving average at 56.80 — both above the 50 midline and both trending upward. RSI spiked toward 70+ earlier during the steepest part of the rally and has since cooled into a healthier range without breaking down, which is typical of a trend digesting gains rather than reversing.
Trade Setup — Long Bias
Price sitting right at the recent high, inside an intact rising channel, with momentum still constructive, favors a breakout-continuation approach.
Aggressive entry: 0.0620–0.0623, on a confirmed break and hold above the 0.0621 Higher HighConservative entry: 0.0592–0.0598, on a retest of the 38.2% fib level and the channel's lower trendline holding as supportStop-loss: Below 0.05747 (the 61.8% fib) — a break here would put price back below the channel entirely and undercut the higher-low structureTarget 1: 0.0650 (aligned with the channel's upper trendline projection)Target 2: 0.0680Target 3 (extended): 0.0700+, only on strong volume confirming a clean breakout above the channel
Invalidation to watch: A decisive close back below 0.0585 (the 50% fib) would suggest the breakout attempt has failed and the pullback is turning into something deeper, shifting focus back toward the 0.0552 Higher Low.
The Bottom Line
MANTA/USDT is doing exactly what a strong trend should do — grinding higher inside a clean channel and now testing the top of its recent range with momentum intact. As long as the channel and the 0.0585 pivot hold, the bias stays long, with 0.0650 and then 0.0680 as the next levels to watch on a confirmed breakout.
This analysis is based on technical chart structure and is for informational purposes only. It is not financial advice. Cryptocurrency markets are highly volatile — always do your own research and manage risk according to your own trading plan before entering any position.
@Binance Square Official #BTCBreaks80K #BuffettBecomesBerkshireChairmanEmeritus #ZcashSpotETFTops$230MMonthlyInflow #Binance #ChartSniper
Manta Network has been quietly putting together one of the more disciplined uptrends on the board — a steady climb of higher lows and higher highs, all contained neatly inside a single rising channel. Now, with price pressing right back up against its recent peak, the setup is shaping into a classic breakout-retest opportunity for traders leaning long.
Reading the Structure
The move started from a Higher Low near 0.0552 and has climbed in textbook fashion ever since — a Lower High around 0.0578, a second Lower High near 0.0592, and finally a Higher High at 0.0621. Every leg of this advance has stayed contained inside a well-defined ascending channel, with price respecting both the rising support line beneath it and a parallel line above.
Price is now trading at 0.06202, right at the 0.00% fib level (the recent Higher High), having pulled back only modestly along the way. A Fibonacci retracement from the Higher Low to the Higher High maps out the key support levels below: 38.2% at 0.05924, 50% around 0.0585, and 61.8% at 0.05747 — all of which lined up closely with the channel's lower boundary during the pullback phases, reinforcing the same zones from two different tools at once.
Momentum Still Points Up
RSI (14) reads 62.53 with its moving average at 56.80 — both above the 50 midline and both trending upward. RSI spiked toward 70+ earlier during the steepest part of the rally and has since cooled into a healthier range without breaking down, which is typical of a trend digesting gains rather than reversing.
Trade Setup — Long Bias
Price sitting right at the recent high, inside an intact rising channel, with momentum still constructive, favors a breakout-continuation approach.
Aggressive entry: 0.0620–0.0623, on a confirmed break and hold above the 0.0621 Higher HighConservative entry: 0.0592–0.0598, on a retest of the 38.2% fib level and the channel's lower trendline holding as supportStop-loss: Below 0.05747 (the 61.8% fib) — a break here would put price back below the channel entirely and undercut the higher-low structureTarget 1: 0.0650 (aligned with the channel's upper trendline projection)Target 2: 0.0680Target 3 (extended): 0.0700+, only on strong volume confirming a clean breakout above the channel
Invalidation to watch: A decisive close back below 0.0585 (the 50% fib) would suggest the breakout attempt has failed and the pullback is turning into something deeper, shifting focus back toward the 0.0552 Higher Low.
The Bottom Line
MANTA/USDT is doing exactly what a strong trend should do — grinding higher inside a clean channel and now testing the top of its recent range with momentum intact. As long as the channel and the 0.0585 pivot hold, the bias stays long, with 0.0650 and then 0.0680 as the next levels to watch on a confirmed breakout.
This analysis is based on technical chart structure and is for informational purposes only. It is not financial advice. Cryptocurrency markets are highly volatile — always do your own research and manage risk according to your own trading plan before entering any position.
@Binance Square Official #BTCBreaks80K #BuffettBecomesBerkshireChairmanEmeritus #ZcashSpotETFTops$230MMonthlyInflow #Binance #ChartSniper
168
·
--
Article
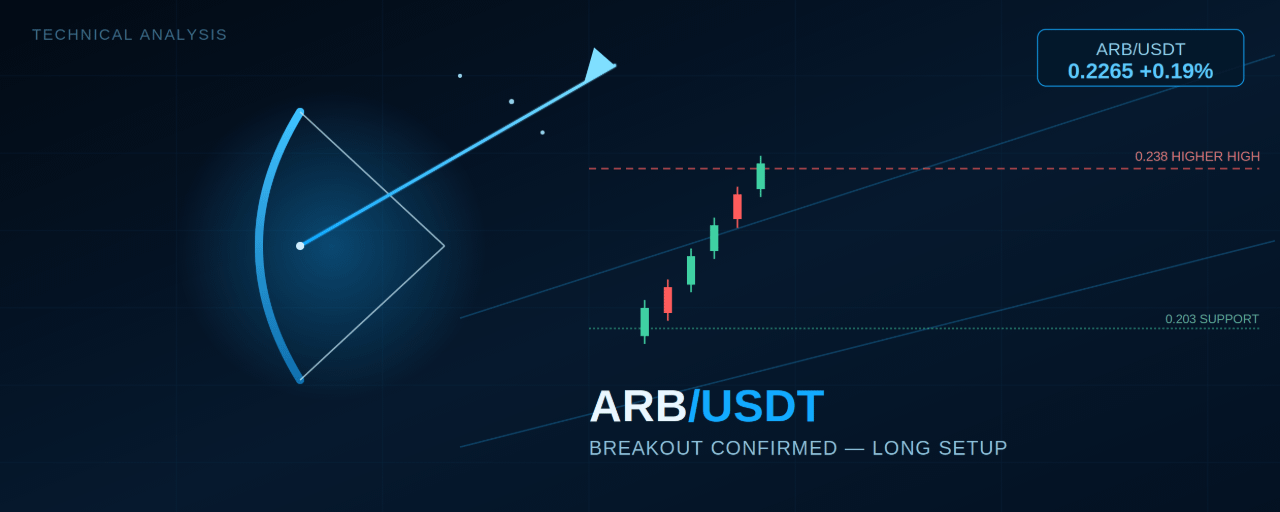
ARB/USDT: Breakout Confirmed — The Broadening Channel Points Higher$ARB
{future}(ARBUSDT)
Arbitrum has broken out of a multi-day consolidation range with real conviction, and the follow-through since that breakout has been exactly what trend traders want to see: a sharp impulsive move, a shallow pullback that held key support, and a fresh push back toward the highs. The structure on the 15-minute perpetual chart lines up clearly in favor of continuation.
Reading the Structure
ARB spent the better part of two sessions grinding sideways between roughly 0.145 and 0.165, printing a series of Lower Highs and a final Lower Low before buyers finally took control. From that Lower Low, price launched into a powerful impulsive rally that produced the session's Higher High near 0.238 — a clean breakout above the entire prior range.
Since that high, ARB pulled back into a Fibonacci retracement zone built from the Lower Low to the Higher High. The 50% level (0.203) lined up almost exactly with a horizontal support shelf that had previously acted as resistance during the consolidation — a textbook "old resistance becomes new support" retest. That confluence held, buyers stepped back in, and price has since reclaimed ground, now trading at 0.22649, up 0.19% and pressing back toward the recent high.
Zooming out, the entire move is developing inside a broadening ascending structure — two rising trendlines expanding apart — with the upper boundary currently projecting up toward the 0.27–0.28 region. That's the structural target if this leg continues to expand the way the pattern suggests.
Momentum Still Has Room
RSI sits at 67.44 with its moving average at 60.97, both comfortably above 50 and both pointing higher. RSI did tag overbought territory briefly during the initial breakout candle, which is normal for a strong impulsive move, and it has since cooled slightly during the pullback without breaking down — a sign the trend has more room to run rather than being exhausted.
Trade Setup — Long Bias
Aggressive entry: 0.2260–0.2280, riding the current push back toward the recent highConservative entry: 0.2100–0.2135, on a retest of the 38.2%–50% fib pocket and the horizontal support shelf holding againStop-loss: Below 0.1930 (the 61.8% fib) — a break of this level would undo the higher-low structure from this breakout leg entirelyTarget 1: 0.2380 (retest and break of the session Higher High)Target 2: 0.2600Target 3 (extended): 0.2750–0.2800, aligning with the upper boundary of the broadening channel — only on strong volume confirmation
Invalidation to watch: A close back below 0.2030 (the reclaimed support shelf) would signal the breakout is failing, opening the door for a retest of the 0.193 zone and a reassessment of the bullish structure.
The Bottom Line
ARB/USDT has broken decisively out of its prior range, defended the retest of that breakout level, and is now pushing back toward its recent high with momentum still intact. As long as 0.203 holds as support, the broader structure favors buyers looking for continuation toward 0.26 and, eventually, the 0.27–0.28 zone.
This analysis is based on technical chart structure and is for informational purposes only. It is not financial advice. Cryptocurrency markets are highly volatile — always do your own research and manage risk according to your own trading plan before entering any position.
@Binance_Square_Official #BTCBreaks80K #BuffettBecomesBerkshireChairmanEmeritus #ZcashSpotETFTops$230MMonthlyInflow #ChartSniper #Binance
ARB/USDT: Breakout Confirmed — The Broadening Channel Points Higher
$ARB
Arbitrum has broken out of a multi-day consolidation range with real conviction, and the follow-through since that breakout has been exactly what trend traders want to see: a sharp impulsive move, a shallow pullback that held key support, and a fresh push back toward the highs. The structure on the 15-minute perpetual chart lines up clearly in favor of continuation.
Reading the Structure
ARB spent the better part of two sessions grinding sideways between roughly 0.145 and 0.165, printing a series of Lower Highs and a final Lower Low before buyers finally took control. From that Lower Low, price launched into a powerful impulsive rally that produced the session's Higher High near 0.238 — a clean breakout above the entire prior range.
Since that high, ARB pulled back into a Fibonacci retracement zone built from the Lower Low to the Higher High. The 50% level (0.203) lined up almost exactly with a horizontal support shelf that had previously acted as resistance during the consolidation — a textbook "old resistance becomes new support" retest. That confluence held, buyers stepped back in, and price has since reclaimed ground, now trading at 0.22649, up 0.19% and pressing back toward the recent high.
Zooming out, the entire move is developing inside a broadening ascending structure — two rising trendlines expanding apart — with the upper boundary currently projecting up toward the 0.27–0.28 region. That's the structural target if this leg continues to expand the way the pattern suggests.
Momentum Still Has Room
RSI sits at 67.44 with its moving average at 60.97, both comfortably above 50 and both pointing higher. RSI did tag overbought territory briefly during the initial breakout candle, which is normal for a strong impulsive move, and it has since cooled slightly during the pullback without breaking down — a sign the trend has more room to run rather than being exhausted.
Trade Setup — Long Bias
Aggressive entry: 0.2260–0.2280, riding the current push back toward the recent highConservative entry: 0.2100–0.2135, on a retest of the 38.2%–50% fib pocket and the horizontal support shelf holding againStop-loss: Below 0.1930 (the 61.8% fib) — a break of this level would undo the higher-low structure from this breakout leg entirelyTarget 1: 0.2380 (retest and break of the session Higher High)Target 2: 0.2600Target 3 (extended): 0.2750–0.2800, aligning with the upper boundary of the broadening channel — only on strong volume confirmation
Invalidation to watch: A close back below 0.2030 (the reclaimed support shelf) would signal the breakout is failing, opening the door for a retest of the 0.193 zone and a reassessment of the bullish structure.
The Bottom Line
ARB/USDT has broken decisively out of its prior range, defended the retest of that breakout level, and is now pushing back toward its recent high with momentum still intact. As long as 0.203 holds as support, the broader structure favors buyers looking for continuation toward 0.26 and, eventually, the 0.27–0.28 zone.
This analysis is based on technical chart structure and is for informational purposes only. It is not financial advice. Cryptocurrency markets are highly volatile — always do your own research and manage risk according to your own trading plan before entering any position.
@Binance Square Official #BTCBreaks80K #BuffettBecomesBerkshireChairmanEmeritus #ZcashSpotETFTops$230MMonthlyInflow #ChartSniper #Binance
Arbitrum has broken out of a multi-day consolidation range with real conviction, and the follow-through since that breakout has been exactly what trend traders want to see: a sharp impulsive move, a shallow pullback that held key support, and a fresh push back toward the highs. The structure on the 15-minute perpetual chart lines up clearly in favor of continuation.
Reading the Structure
ARB spent the better part of two sessions grinding sideways between roughly 0.145 and 0.165, printing a series of Lower Highs and a final Lower Low before buyers finally took control. From that Lower Low, price launched into a powerful impulsive rally that produced the session's Higher High near 0.238 — a clean breakout above the entire prior range.
Since that high, ARB pulled back into a Fibonacci retracement zone built from the Lower Low to the Higher High. The 50% level (0.203) lined up almost exactly with a horizontal support shelf that had previously acted as resistance during the consolidation — a textbook "old resistance becomes new support" retest. That confluence held, buyers stepped back in, and price has since reclaimed ground, now trading at 0.22649, up 0.19% and pressing back toward the recent high.
Zooming out, the entire move is developing inside a broadening ascending structure — two rising trendlines expanding apart — with the upper boundary currently projecting up toward the 0.27–0.28 region. That's the structural target if this leg continues to expand the way the pattern suggests.
Momentum Still Has Room
RSI sits at 67.44 with its moving average at 60.97, both comfortably above 50 and both pointing higher. RSI did tag overbought territory briefly during the initial breakout candle, which is normal for a strong impulsive move, and it has since cooled slightly during the pullback without breaking down — a sign the trend has more room to run rather than being exhausted.
Trade Setup — Long Bias
Aggressive entry: 0.2260–0.2280, riding the current push back toward the recent highConservative entry: 0.2100–0.2135, on a retest of the 38.2%–50% fib pocket and the horizontal support shelf holding againStop-loss: Below 0.1930 (the 61.8% fib) — a break of this level would undo the higher-low structure from this breakout leg entirelyTarget 1: 0.2380 (retest and break of the session Higher High)Target 2: 0.2600Target 3 (extended): 0.2750–0.2800, aligning with the upper boundary of the broadening channel — only on strong volume confirmation
Invalidation to watch: A close back below 0.2030 (the reclaimed support shelf) would signal the breakout is failing, opening the door for a retest of the 0.193 zone and a reassessment of the bullish structure.
The Bottom Line
ARB/USDT has broken decisively out of its prior range, defended the retest of that breakout level, and is now pushing back toward its recent high with momentum still intact. As long as 0.203 holds as support, the broader structure favors buyers looking for continuation toward 0.26 and, eventually, the 0.27–0.28 zone.
This analysis is based on technical chart structure and is for informational purposes only. It is not financial advice. Cryptocurrency markets are highly volatile — always do your own research and manage risk according to your own trading plan before entering any position.
@Binance Square Official #BTCBreaks80K #BuffettBecomesBerkshireChairmanEmeritus #ZcashSpotETFTops$230MMonthlyInflow #ChartSniper #Binance
176
·
--
Article
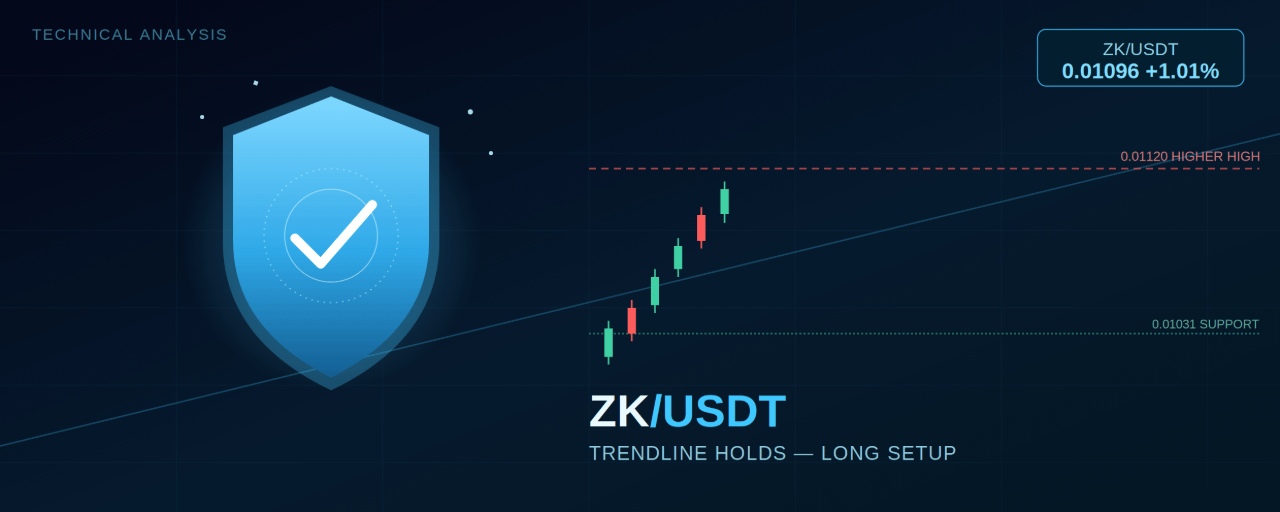
ZK/USDT: The Trendline Keeps Doing Its Job — Long Setup in Play$ZK
{future}(ZKUSDT)
ZKsync has been one of the steadier grinders on the board over the past 24 hours, climbing in a disciplined stair-step pattern along a single rising trendline that hasn't been broken once. After tagging a fresh Higher High and pulling back to test that same trendline, price is bouncing again — and the structure still favors buyers.
Reading the Structure
The move traces back to a low near 0.0089, and from there ZK has respected one continuous rising trendline through an entire session's worth of higher lows and higher highs. Along the way it cleared a Lower High around 0.0110, consolidated, and then launched into a sharp impulsive candle that produced the session's Higher High.
Since that Higher High, price pulled back into a Fibonacci zone built from the recent swing low to that high: the 38.2% level sits at 0.01064, the 50% level just below it, and the 61.8% level at 0.01040 — all clustering right around where the rising trendline itself is currently running. That confluence held. Price bounced from this zone and is now back at 0.01096, up 1.01% on the session, with RSI at 61.11 and its moving average at 58.74 — both above 50 and both turning back up alongside price.
Why the Bounce Matters
This is the second time in the session that the trendline plus a fib support cluster has caught a pullback and turned it back into a rally. That kind of repeated respect for the same dynamic support is exactly what you want to see in a trend you're looking to trade with, not against. As long as price continues to hold above that trendline, dips are still more likely to be bought than sold.
Trade Setup — Long Bias
Aggressive entry: 0.01090–0.01100, on the current bounce continuing with RSI holding above 55Conservative entry: 0.01064–0.01070, on a deeper retest of the 38.2% fib level and rising trendline confluenceStop-loss: Below 0.01031 (the horizontal support shelf) — a break here would put price below both the trendline and the 100% fib low, invalidating the setupTarget 1: 0.01120 (retest of the session's Higher High / 0% fib)Target 2: 0.01160–0.01191 (the marked supply zone above the prior high)Target 3 (extended): 0.01250, only on strong continuation with volume backing the breakout
Invalidation to watch: A decisive close below the rising trendline, followed by a break of 0.01031, would end the higher-low sequence and shift the bias toward a deeper correction back into the 0.00980–0.01000 area.
The Bottom Line
ZK/USDT remains in a clean, well-respected uptrend. The pullback into the fib/trendline confluence held, momentum has turned back up, and as long as 0.01031 isn't lost, the path of least resistance stays higher — with 0.01120 as the first real test on the way toward the 0.0116–0.0119 zone.
This analysis is based on technical chart structure and is for informational purposes only. It is not financial advice. Cryptocurrency markets are highly volatile — always do your own research and manage risk according to your own trading plan before entering any position.
@Binance_Square_Official #BTCBreaks80K #BuffettBecomesBerkshireChairmanEmeritus #ZcashSpotETFTops$230MMonthlyInflow #Binance #ChartSniper
ZK/USDT: The Trendline Keeps Doing Its Job — Long Setup in Play
$ZK
ZKsync has been one of the steadier grinders on the board over the past 24 hours, climbing in a disciplined stair-step pattern along a single rising trendline that hasn't been broken once. After tagging a fresh Higher High and pulling back to test that same trendline, price is bouncing again — and the structure still favors buyers.
Reading the Structure
The move traces back to a low near 0.0089, and from there ZK has respected one continuous rising trendline through an entire session's worth of higher lows and higher highs. Along the way it cleared a Lower High around 0.0110, consolidated, and then launched into a sharp impulsive candle that produced the session's Higher High.
Since that Higher High, price pulled back into a Fibonacci zone built from the recent swing low to that high: the 38.2% level sits at 0.01064, the 50% level just below it, and the 61.8% level at 0.01040 — all clustering right around where the rising trendline itself is currently running. That confluence held. Price bounced from this zone and is now back at 0.01096, up 1.01% on the session, with RSI at 61.11 and its moving average at 58.74 — both above 50 and both turning back up alongside price.
Why the Bounce Matters
This is the second time in the session that the trendline plus a fib support cluster has caught a pullback and turned it back into a rally. That kind of repeated respect for the same dynamic support is exactly what you want to see in a trend you're looking to trade with, not against. As long as price continues to hold above that trendline, dips are still more likely to be bought than sold.
Trade Setup — Long Bias
Aggressive entry: 0.01090–0.01100, on the current bounce continuing with RSI holding above 55Conservative entry: 0.01064–0.01070, on a deeper retest of the 38.2% fib level and rising trendline confluenceStop-loss: Below 0.01031 (the horizontal support shelf) — a break here would put price below both the trendline and the 100% fib low, invalidating the setupTarget 1: 0.01120 (retest of the session's Higher High / 0% fib)Target 2: 0.01160–0.01191 (the marked supply zone above the prior high)Target 3 (extended): 0.01250, only on strong continuation with volume backing the breakout
Invalidation to watch: A decisive close below the rising trendline, followed by a break of 0.01031, would end the higher-low sequence and shift the bias toward a deeper correction back into the 0.00980–0.01000 area.
The Bottom Line
ZK/USDT remains in a clean, well-respected uptrend. The pullback into the fib/trendline confluence held, momentum has turned back up, and as long as 0.01031 isn't lost, the path of least resistance stays higher — with 0.01120 as the first real test on the way toward the 0.0116–0.0119 zone.
This analysis is based on technical chart structure and is for informational purposes only. It is not financial advice. Cryptocurrency markets are highly volatile — always do your own research and manage risk according to your own trading plan before entering any position.
@Binance Square Official #BTCBreaks80K #BuffettBecomesBerkshireChairmanEmeritus #ZcashSpotETFTops$230MMonthlyInflow #Binance #ChartSniper
ZKsync has been one of the steadier grinders on the board over the past 24 hours, climbing in a disciplined stair-step pattern along a single rising trendline that hasn't been broken once. After tagging a fresh Higher High and pulling back to test that same trendline, price is bouncing again — and the structure still favors buyers.
Reading the Structure
The move traces back to a low near 0.0089, and from there ZK has respected one continuous rising trendline through an entire session's worth of higher lows and higher highs. Along the way it cleared a Lower High around 0.0110, consolidated, and then launched into a sharp impulsive candle that produced the session's Higher High.
Since that Higher High, price pulled back into a Fibonacci zone built from the recent swing low to that high: the 38.2% level sits at 0.01064, the 50% level just below it, and the 61.8% level at 0.01040 — all clustering right around where the rising trendline itself is currently running. That confluence held. Price bounced from this zone and is now back at 0.01096, up 1.01% on the session, with RSI at 61.11 and its moving average at 58.74 — both above 50 and both turning back up alongside price.
Why the Bounce Matters
This is the second time in the session that the trendline plus a fib support cluster has caught a pullback and turned it back into a rally. That kind of repeated respect for the same dynamic support is exactly what you want to see in a trend you're looking to trade with, not against. As long as price continues to hold above that trendline, dips are still more likely to be bought than sold.
Trade Setup — Long Bias
Aggressive entry: 0.01090–0.01100, on the current bounce continuing with RSI holding above 55Conservative entry: 0.01064–0.01070, on a deeper retest of the 38.2% fib level and rising trendline confluenceStop-loss: Below 0.01031 (the horizontal support shelf) — a break here would put price below both the trendline and the 100% fib low, invalidating the setupTarget 1: 0.01120 (retest of the session's Higher High / 0% fib)Target 2: 0.01160–0.01191 (the marked supply zone above the prior high)Target 3 (extended): 0.01250, only on strong continuation with volume backing the breakout
Invalidation to watch: A decisive close below the rising trendline, followed by a break of 0.01031, would end the higher-low sequence and shift the bias toward a deeper correction back into the 0.00980–0.01000 area.
The Bottom Line
ZK/USDT remains in a clean, well-respected uptrend. The pullback into the fib/trendline confluence held, momentum has turned back up, and as long as 0.01031 isn't lost, the path of least resistance stays higher — with 0.01120 as the first real test on the way toward the 0.0116–0.0119 zone.
This analysis is based on technical chart structure and is for informational purposes only. It is not financial advice. Cryptocurrency markets are highly volatile — always do your own research and manage risk according to your own trading plan before entering any position.
@Binance Square Official #BTCBreaks80K #BuffettBecomesBerkshireChairmanEmeritus #ZcashSpotETFTops$230MMonthlyInflow #Binance #ChartSniper
145
·
--
Article
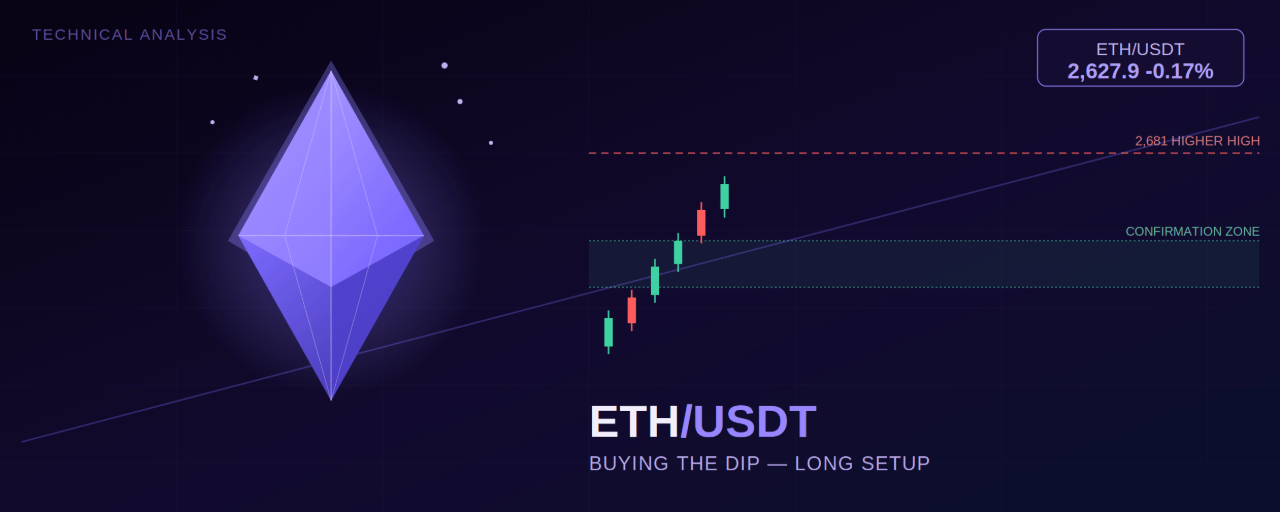
ETH/USDT: Buying the Dip Inside a Textbook Uptrend$ETH
{future}(ETHUSDT)
Ethereum has put in one of its cleanest impulsive rallies in recent sessions, rocketing off a swing low and riding a rising trendline all the way to a fresh Higher High. Now, with price cooling off into a shallow pullback, the question traders are asking is simple: is this the dip to buy, or the start of something deeper? Here's how the structure lines up.
Note: the source chart is ETH/USD on Bitstamp rather than ETH/USDT directly — the two track each other almost exactly, so the levels below apply cleanly to ETH/USDT as well.
Reading the Structure
The rally began from a swing low near 2,455 and accelerated cleanly along a rising trendline, culminating in a Higher High around 2,681. Since tagging that high, price has pulled back modestly and is now trading at 2,627.9, sitting right on top of a horizontal support shelf at 2,629.1 that lines up almost exactly with current price.
A Fibonacci retracement drawn from the swing low (2,493) to the Higher High (2,681) frames the levels that matter from here. The 38.2% level sits at 2,590, the 50% level at 2,570, and the 61.8% level at 2,562 — and that 2,562–2,590 pocket is marked out directly on the chart as a "Confirmation Zone," a logical area for buyers to step back in if the pullback deepens.
Momentum Is Cooling — That's Not the Same as Broken
RSI (14) has slipped to 46.41, down from an overbought spike earlier in the move, while its moving average sits higher at 59.27. This is normal, healthy cooling after an extended impulsive leg — RSI resetting from overbought territory during a pullback is a feature of strong uptrends, not necessarily a warning sign. What would change the picture is RSI breaking meaningfully below 40 or price losing the rising trendline outright; neither has happened yet.
Trade Setup — Long Bias
The uptrend structure remains fully intact: higher low, higher high, and a shallow pullback holding right at horizontal support. This favors buying the pullback rather than fading the trend.
Aggressive entry: 2,625–2,630, on the current support shelf holding and price stabilizing above itConservative entry: 2,562–2,590, inside the marked Confirmation Zone (38.2%–61.8% fib pocket) — the better risk/reward entry if the pullback extendsStop-loss: Below 2,493 (the 100% fib / swing low) — a break of this level would undo the entire impulsive structure and shift bias to neutral/bearishTarget 1: 2,681 (retest of the Higher High)Target 2: 2,710Target 3 (extended): 2,750, on strong continuation with volume confirming the breakout above the prior high
Invalidation to watch: A decisive close below the rising trendline and through 2,562 would suggest the pullback has turned into a deeper corrective move, and the 2,493 low would become the next real test rather than a target.
The Bottom Line
ETH/USDT is pulling back inside an otherwise strong uptrend, holding right at horizontal support with RSI cooling rather than breaking down. As long as the 2,562–2,590 Confirmation Zone holds on any deeper dip, the trend favors buyers looking for a retest — and eventual break — of the 2,681 high.
This analysis is based on technical chart structure and is for informational purposes only. It is not financial advice. Cryptocurrency markets are highly volatile — always do your own research and manage risk according to your own trading plan before entering any position.
@Binance_Square_Official #BTCBreaks80K #BuffettBecomesBerkshireChairmanEmeritus #ZcashSpotETFTops$230MMonthlyInflow #Binance #ChartSniper
ETH/USDT: Buying the Dip Inside a Textbook Uptrend
$ETH
Ethereum has put in one of its cleanest impulsive rallies in recent sessions, rocketing off a swing low and riding a rising trendline all the way to a fresh Higher High. Now, with price cooling off into a shallow pullback, the question traders are asking is simple: is this the dip to buy, or the start of something deeper? Here's how the structure lines up.
Note: the source chart is ETH/USD on Bitstamp rather than ETH/USDT directly — the two track each other almost exactly, so the levels below apply cleanly to ETH/USDT as well.
Reading the Structure
The rally began from a swing low near 2,455 and accelerated cleanly along a rising trendline, culminating in a Higher High around 2,681. Since tagging that high, price has pulled back modestly and is now trading at 2,627.9, sitting right on top of a horizontal support shelf at 2,629.1 that lines up almost exactly with current price.
A Fibonacci retracement drawn from the swing low (2,493) to the Higher High (2,681) frames the levels that matter from here. The 38.2% level sits at 2,590, the 50% level at 2,570, and the 61.8% level at 2,562 — and that 2,562–2,590 pocket is marked out directly on the chart as a "Confirmation Zone," a logical area for buyers to step back in if the pullback deepens.
Momentum Is Cooling — That's Not the Same as Broken
RSI (14) has slipped to 46.41, down from an overbought spike earlier in the move, while its moving average sits higher at 59.27. This is normal, healthy cooling after an extended impulsive leg — RSI resetting from overbought territory during a pullback is a feature of strong uptrends, not necessarily a warning sign. What would change the picture is RSI breaking meaningfully below 40 or price losing the rising trendline outright; neither has happened yet.
Trade Setup — Long Bias
The uptrend structure remains fully intact: higher low, higher high, and a shallow pullback holding right at horizontal support. This favors buying the pullback rather than fading the trend.
Aggressive entry: 2,625–2,630, on the current support shelf holding and price stabilizing above itConservative entry: 2,562–2,590, inside the marked Confirmation Zone (38.2%–61.8% fib pocket) — the better risk/reward entry if the pullback extendsStop-loss: Below 2,493 (the 100% fib / swing low) — a break of this level would undo the entire impulsive structure and shift bias to neutral/bearishTarget 1: 2,681 (retest of the Higher High)Target 2: 2,710Target 3 (extended): 2,750, on strong continuation with volume confirming the breakout above the prior high
Invalidation to watch: A decisive close below the rising trendline and through 2,562 would suggest the pullback has turned into a deeper corrective move, and the 2,493 low would become the next real test rather than a target.
The Bottom Line
ETH/USDT is pulling back inside an otherwise strong uptrend, holding right at horizontal support with RSI cooling rather than breaking down. As long as the 2,562–2,590 Confirmation Zone holds on any deeper dip, the trend favors buyers looking for a retest — and eventual break — of the 2,681 high.
This analysis is based on technical chart structure and is for informational purposes only. It is not financial advice. Cryptocurrency markets are highly volatile — always do your own research and manage risk according to your own trading plan before entering any position.
@Binance Square Official #BTCBreaks80K #BuffettBecomesBerkshireChairmanEmeritus #ZcashSpotETFTops$230MMonthlyInflow #Binance #ChartSniper
Ethereum has put in one of its cleanest impulsive rallies in recent sessions, rocketing off a swing low and riding a rising trendline all the way to a fresh Higher High. Now, with price cooling off into a shallow pullback, the question traders are asking is simple: is this the dip to buy, or the start of something deeper? Here's how the structure lines up.
Note: the source chart is ETH/USD on Bitstamp rather than ETH/USDT directly — the two track each other almost exactly, so the levels below apply cleanly to ETH/USDT as well.
Reading the Structure
The rally began from a swing low near 2,455 and accelerated cleanly along a rising trendline, culminating in a Higher High around 2,681. Since tagging that high, price has pulled back modestly and is now trading at 2,627.9, sitting right on top of a horizontal support shelf at 2,629.1 that lines up almost exactly with current price.
A Fibonacci retracement drawn from the swing low (2,493) to the Higher High (2,681) frames the levels that matter from here. The 38.2% level sits at 2,590, the 50% level at 2,570, and the 61.8% level at 2,562 — and that 2,562–2,590 pocket is marked out directly on the chart as a "Confirmation Zone," a logical area for buyers to step back in if the pullback deepens.
Momentum Is Cooling — That's Not the Same as Broken
RSI (14) has slipped to 46.41, down from an overbought spike earlier in the move, while its moving average sits higher at 59.27. This is normal, healthy cooling after an extended impulsive leg — RSI resetting from overbought territory during a pullback is a feature of strong uptrends, not necessarily a warning sign. What would change the picture is RSI breaking meaningfully below 40 or price losing the rising trendline outright; neither has happened yet.
Trade Setup — Long Bias
The uptrend structure remains fully intact: higher low, higher high, and a shallow pullback holding right at horizontal support. This favors buying the pullback rather than fading the trend.
Aggressive entry: 2,625–2,630, on the current support shelf holding and price stabilizing above itConservative entry: 2,562–2,590, inside the marked Confirmation Zone (38.2%–61.8% fib pocket) — the better risk/reward entry if the pullback extendsStop-loss: Below 2,493 (the 100% fib / swing low) — a break of this level would undo the entire impulsive structure and shift bias to neutral/bearishTarget 1: 2,681 (retest of the Higher High)Target 2: 2,710Target 3 (extended): 2,750, on strong continuation with volume confirming the breakout above the prior high
Invalidation to watch: A decisive close below the rising trendline and through 2,562 would suggest the pullback has turned into a deeper corrective move, and the 2,493 low would become the next real test rather than a target.
The Bottom Line
ETH/USDT is pulling back inside an otherwise strong uptrend, holding right at horizontal support with RSI cooling rather than breaking down. As long as the 2,562–2,590 Confirmation Zone holds on any deeper dip, the trend favors buyers looking for a retest — and eventual break — of the 2,681 high.
This analysis is based on technical chart structure and is for informational purposes only. It is not financial advice. Cryptocurrency markets are highly volatile — always do your own research and manage risk according to your own trading plan before entering any position.
@Binance Square Official #BTCBreaks80K #BuffettBecomesBerkshireChairmanEmeritus #ZcashSpotETFTops$230MMonthlyInflow #Binance #ChartSniper
131
·
--
Article
OG/USDT: The Rising Channel Is Setting Up Another Leg Toward the Highs$OG
{future}(OGUSDT)
OG Fan Token has spent the last day carving out a textbook ascending channel — and after a clean bounce from its Fibonacci demand zone, price is once again pressing toward the top of the structure. For traders tracking the 5-minute chart, this is shaping up to be a continuation setup worth watching closely, with the long side clearly favored while the channel structure holds.
Reading the Structure
The move started with a Higher High early in the session, followed by a sharp pullback into a Lower Low near 2.730. From that low, buyers stepped in decisively, and price has been climbing inside a well-defined rising channel ever since — higher lows and higher highs, bounded by two clean ascending trendlines.
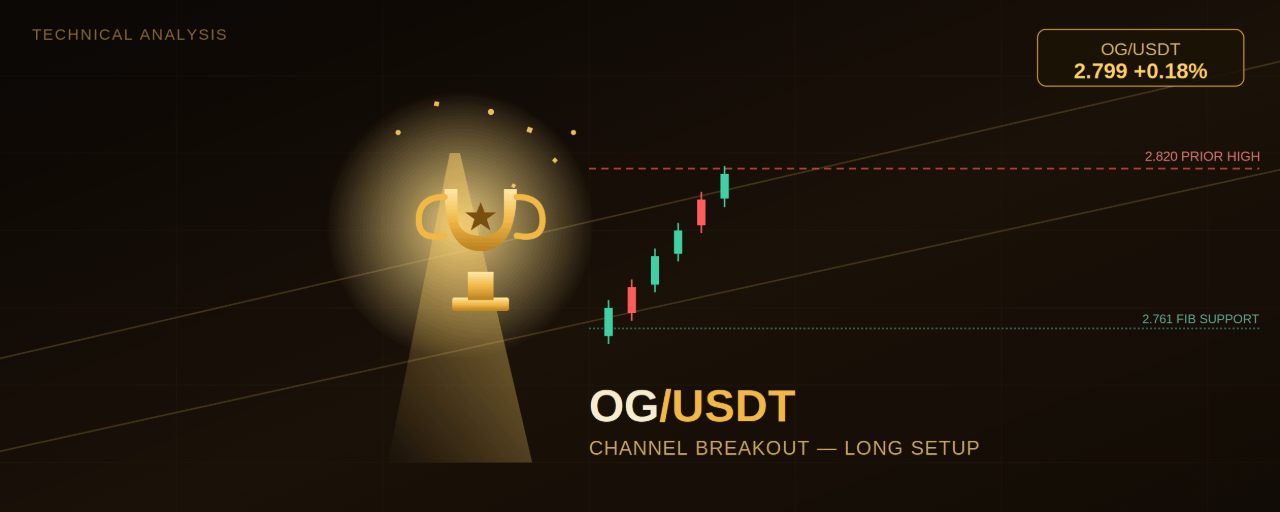
A Fibonacci retracement drawn from the Lower Low up to the most recent Higher High (around 2.820) maps out the key levels in play: the 38.2% retracement at 2.780, the 50% level just below it, and the 61.8% level at 2.761. That 2.761–2.780 pocket is exactly where price pulled back to after tagging the Higher High — and it held. Buyers defended that zone, and price has since reclaimed the 38.2% level and is now trading at 2.799, just below the prior swing high.
Momentum Backs the Bulls
RSI is reading 61.45 with its moving average at 55.62 — both firmly above the 50 midline and both angled upward. That's the momentum signature of a healthy pullback-and-continuation move rather than an exhausted rally. There's no bearish divergence here: price and RSI are moving in the same direction, which supports the case for another push higher rather than a stall.
Trade Setup — Long Bias
With the channel intact, the fib demand zone respected, and RSI confirming, the long setup is the clear play here as long as price stays above the 61.8% level.
Aggressive entry: 2.795–2.805 (current market), riding the move as price pushes back toward the prior highConservative entry: 2.780–2.785, on a pullback retest of the reclaimed 38.2% level holding as supportStop-loss: Below 2.761 (the 61.8% fib / demand zone low) — a break and close under this level would invalidate the higher-low structure and open the door to a deeper retracement toward the channel's lower trendlineTarget 1: 2.820 (the prior Higher High / 0% fib level)Target 2: 2.840–2.850 (the supply zone above, aligned with the upper channel trendline)Target 3 (extended): 2.880–2.900, only on a strong breakout with volume confirmation above 2.850
Invalidation to watch: If price loses 2.761 and closes below it, the higher-low sequence breaks down and the channel's lower boundary (currently trending up near 2.75–2.76) becomes the next real test. A clean break of that trendline would shift the bias from continuation to correction.
The Bottom Line
OG/USDT is doing exactly what a healthy uptrend should do — pulling back into a fib support zone, holding it, and pushing back toward resistance with rising momentum. As long as the 2.761 level holds on any retest, the path of least resistance stays up, with 2.820 and then 2.840–2.850 as the levels to watch on the way toward a potential channel extension.
This analysis is based on technical chart structure and is for informational purposes only. It is not financial advice. Cryptocurrency markets are highly volatile — always do your own research and manage risk according to your own trading plan before entering any position.
@Binance_Square_Official #BTCBreaks80K #BuffettBecomesBerkshireChairmanEmeritus #ZcashSpotETFTops$230MMonthlyInflow #Binance #ChartSniper
OG/USDT: The Rising Channel Is Setting Up Another Leg Toward the Highs
$OG
OG Fan Token has spent the last day carving out a textbook ascending channel — and after a clean bounce from its Fibonacci demand zone, price is once again pressing toward the top of the structure. For traders tracking the 5-minute chart, this is shaping up to be a continuation setup worth watching closely, with the long side clearly favored while the channel structure holds.
Reading the Structure
The move started with a Higher High early in the session, followed by a sharp pullback into a Lower Low near 2.730. From that low, buyers stepped in decisively, and price has been climbing inside a well-defined rising channel ever since — higher lows and higher highs, bounded by two clean ascending trendlines.
A Fibonacci retracement drawn from the Lower Low up to the most recent Higher High (around 2.820) maps out the key levels in play: the 38.2% retracement at 2.780, the 50% level just below it, and the 61.8% level at 2.761. That 2.761–2.780 pocket is exactly where price pulled back to after tagging the Higher High — and it held. Buyers defended that zone, and price has since reclaimed the 38.2% level and is now trading at 2.799, just below the prior swing high.
Momentum Backs the Bulls
RSI is reading 61.45 with its moving average at 55.62 — both firmly above the 50 midline and both angled upward. That's the momentum signature of a healthy pullback-and-continuation move rather than an exhausted rally. There's no bearish divergence here: price and RSI are moving in the same direction, which supports the case for another push higher rather than a stall.
Trade Setup — Long Bias
With the channel intact, the fib demand zone respected, and RSI confirming, the long setup is the clear play here as long as price stays above the 61.8% level.
Aggressive entry: 2.795–2.805 (current market), riding the move as price pushes back toward the prior highConservative entry: 2.780–2.785, on a pullback retest of the reclaimed 38.2% level holding as supportStop-loss: Below 2.761 (the 61.8% fib / demand zone low) — a break and close under this level would invalidate the higher-low structure and open the door to a deeper retracement toward the channel's lower trendlineTarget 1: 2.820 (the prior Higher High / 0% fib level)Target 2: 2.840–2.850 (the supply zone above, aligned with the upper channel trendline)Target 3 (extended): 2.880–2.900, only on a strong breakout with volume confirmation above 2.850
Invalidation to watch: If price loses 2.761 and closes below it, the higher-low sequence breaks down and the channel's lower boundary (currently trending up near 2.75–2.76) becomes the next real test. A clean break of that trendline would shift the bias from continuation to correction.
The Bottom Line
OG/USDT is doing exactly what a healthy uptrend should do — pulling back into a fib support zone, holding it, and pushing back toward resistance with rising momentum. As long as the 2.761 level holds on any retest, the path of least resistance stays up, with 2.820 and then 2.840–2.850 as the levels to watch on the way toward a potential channel extension.
This analysis is based on technical chart structure and is for informational purposes only. It is not financial advice. Cryptocurrency markets are highly volatile — always do your own research and manage risk according to your own trading plan before entering any position.
@Binance Square Official #BTCBreaks80K #BuffettBecomesBerkshireChairmanEmeritus #ZcashSpotETFTops$230MMonthlyInflow #Binance #ChartSniper
OG Fan Token has spent the last day carving out a textbook ascending channel — and after a clean bounce from its Fibonacci demand zone, price is once again pressing toward the top of the structure. For traders tracking the 5-minute chart, this is shaping up to be a continuation setup worth watching closely, with the long side clearly favored while the channel structure holds.
Reading the Structure
The move started with a Higher High early in the session, followed by a sharp pullback into a Lower Low near 2.730. From that low, buyers stepped in decisively, and price has been climbing inside a well-defined rising channel ever since — higher lows and higher highs, bounded by two clean ascending trendlines.
A Fibonacci retracement drawn from the Lower Low up to the most recent Higher High (around 2.820) maps out the key levels in play: the 38.2% retracement at 2.780, the 50% level just below it, and the 61.8% level at 2.761. That 2.761–2.780 pocket is exactly where price pulled back to after tagging the Higher High — and it held. Buyers defended that zone, and price has since reclaimed the 38.2% level and is now trading at 2.799, just below the prior swing high.
Momentum Backs the Bulls
RSI is reading 61.45 with its moving average at 55.62 — both firmly above the 50 midline and both angled upward. That's the momentum signature of a healthy pullback-and-continuation move rather than an exhausted rally. There's no bearish divergence here: price and RSI are moving in the same direction, which supports the case for another push higher rather than a stall.
Trade Setup — Long Bias
With the channel intact, the fib demand zone respected, and RSI confirming, the long setup is the clear play here as long as price stays above the 61.8% level.
Aggressive entry: 2.795–2.805 (current market), riding the move as price pushes back toward the prior highConservative entry: 2.780–2.785, on a pullback retest of the reclaimed 38.2% level holding as supportStop-loss: Below 2.761 (the 61.8% fib / demand zone low) — a break and close under this level would invalidate the higher-low structure and open the door to a deeper retracement toward the channel's lower trendlineTarget 1: 2.820 (the prior Higher High / 0% fib level)Target 2: 2.840–2.850 (the supply zone above, aligned with the upper channel trendline)Target 3 (extended): 2.880–2.900, only on a strong breakout with volume confirmation above 2.850
Invalidation to watch: If price loses 2.761 and closes below it, the higher-low sequence breaks down and the channel's lower boundary (currently trending up near 2.75–2.76) becomes the next real test. A clean break of that trendline would shift the bias from continuation to correction.
The Bottom Line
OG/USDT is doing exactly what a healthy uptrend should do — pulling back into a fib support zone, holding it, and pushing back toward resistance with rising momentum. As long as the 2.761 level holds on any retest, the path of least resistance stays up, with 2.820 and then 2.840–2.850 as the levels to watch on the way toward a potential channel extension.
This analysis is based on technical chart structure and is for informational purposes only. It is not financial advice. Cryptocurrency markets are highly volatile — always do your own research and manage risk according to your own trading plan before entering any position.
@Binance Square Official #BTCBreaks80K #BuffettBecomesBerkshireChairmanEmeritus #ZcashSpotETFTops$230MMonthlyInflow #Binance #ChartSniper
1
561
·
--
Article
ONT/USDT: The Higher Low That Could Flip This Downtrend on Its Head$ONT
{future}(ONTUSDT)
Ontology (ONT) has spent the better part of three sessions grinding lower against Tether, but the 15-minute chart is now showing the first real signs that sellers are losing their grip. After stamping a fresh Lower Low, price has carved out a Higher Low — and that single shift in structure is the crack in the downtrend that traders should be watching closely right now.
Reading the Structure
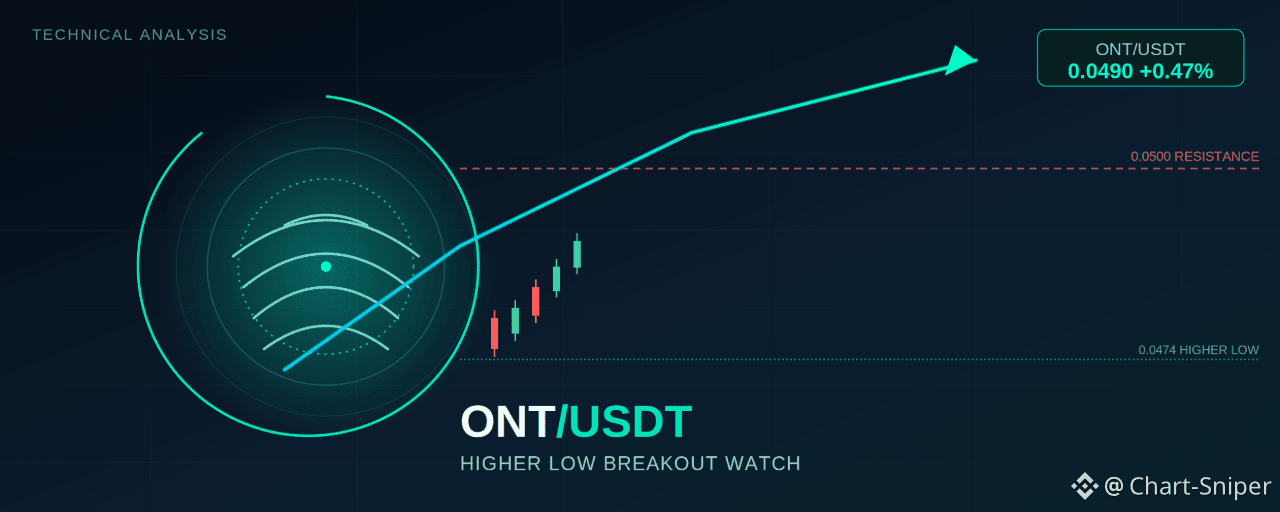
The chart tells a clean story of a fading downtrend. ONT/USDT printed a Lower Low, then rallied into a Lower High, rolled over again into a second Lower High, and finally found buyers at a Higher Low near 0.0474. That HL is the key development — it's the first sign in this sequence that sellers are no longer able to push price to a new floor.
Since that Higher Low, ONT has been building a tight base directly beneath a horizontal resistance shelf sitting between 0.0493 and 0.0500. A descending trendline connecting the two Lower Highs is converging on that same zone, creating a confluence of resistance right around current price. This is effectively a compression zone: a falling trendline pressing down, a horizontal ceiling capping upside, and a rising floor of higher lows pushing from below. Squeezes like this typically resolve with a decisive move, and right now momentum is leaning in the bulls' favor.
Momentum Confirms the Shift
RSI (14) is sitting at 60.95, with its moving average at 55.12 — both comfortably above the 50 midline and both sloping upward. That's a meaningful tell. During the initial leg down, RSI was pinned well below 50; the fact that it's now pushing into bullish territory alongside the Higher Low adds confluence to the idea that buyers are stepping back in rather than this being a dead-cat bounce.
Price last traded at 0.04901, up 0.47% on the session, and is currently pressing directly into the 0.0493 level — the lower boundary of the resistance shelf and, not coincidentally, right where the descending trendline is also cutting through.
Trade Setup
The bullish case: A clean breakout and hold above the 0.0493–0.0500 resistance shelf, especially if it comes with a retest that holds as new support, would confirm the downtrend is broken and open the door for a move back toward the origin of the last Lower High swing.
Aggressive entry: 0.0493–0.0496, on strength through the shelf with RSI staying above 55Conservative entry: 0.0500–0.0505, on a confirmed close above the resistance zone with a successful retest of 0.0500 as supportStop-loss: Below 0.0474 (beneath the Higher Low) — a break back under this level invalidates the reversal structure entirelyTarget 1: 0.0520Target 2: 0.0540 (near the origin of the prior Lower High swing)Target 3 (extended): 0.0570, only on strong volume follow-through
The bearish case: If price gets rejected at the 0.0493–0.0500 confluence zone again — this would be at least the third rejection from this general area — the descending trendline stays in control, and a retest of the 0.0474 Higher Low, followed by a break of it, would resume the broader downtrend toward new lows.
Short trigger: Rejection candle at 0.0495–0.0500 with RSI turning back down through 55Stop-loss: Above 0.0505Target 1: 0.0474Target 2: 0.0450 (measured move of the recent range)
The Bottom Line
ONT/USDT is at a genuine inflection point. The Higher Low plus rising RSI gives the bulls the benefit of the doubt short-term, but the 0.0493–0.0500 zone is a real wall that has already capped two prior rallies via the descending trendline. Watch how price behaves right at this level over the next few candles — a decisive close above 0.0500 is the confirmation bulls need, while continued rejection keeps this range-bound and tilts risk back toward the downside.
This analysis is based on technical chart structure and is for informational purposes only. It is not financial advice. Cryptocurrency markets are highly volatile — always do your own research and manage risk according to your own trading plan before entering any position.
@Binance_Square_Official #FedRateWatch #ZcashRises6% #XRPSinks10% #Binance #ChartSniper
ONT/USDT: The Higher Low That Could Flip This Downtrend on Its Head
$ONT
Ontology (ONT) has spent the better part of three sessions grinding lower against Tether, but the 15-minute chart is now showing the first real signs that sellers are losing their grip. After stamping a fresh Lower Low, price has carved out a Higher Low — and that single shift in structure is the crack in the downtrend that traders should be watching closely right now.
Reading the Structure
The chart tells a clean story of a fading downtrend. ONT/USDT printed a Lower Low, then rallied into a Lower High, rolled over again into a second Lower High, and finally found buyers at a Higher Low near 0.0474. That HL is the key development — it's the first sign in this sequence that sellers are no longer able to push price to a new floor.
Since that Higher Low, ONT has been building a tight base directly beneath a horizontal resistance shelf sitting between 0.0493 and 0.0500. A descending trendline connecting the two Lower Highs is converging on that same zone, creating a confluence of resistance right around current price. This is effectively a compression zone: a falling trendline pressing down, a horizontal ceiling capping upside, and a rising floor of higher lows pushing from below. Squeezes like this typically resolve with a decisive move, and right now momentum is leaning in the bulls' favor.
Momentum Confirms the Shift
RSI (14) is sitting at 60.95, with its moving average at 55.12 — both comfortably above the 50 midline and both sloping upward. That's a meaningful tell. During the initial leg down, RSI was pinned well below 50; the fact that it's now pushing into bullish territory alongside the Higher Low adds confluence to the idea that buyers are stepping back in rather than this being a dead-cat bounce.
Price last traded at 0.04901, up 0.47% on the session, and is currently pressing directly into the 0.0493 level — the lower boundary of the resistance shelf and, not coincidentally, right where the descending trendline is also cutting through.
Trade Setup
The bullish case: A clean breakout and hold above the 0.0493–0.0500 resistance shelf, especially if it comes with a retest that holds as new support, would confirm the downtrend is broken and open the door for a move back toward the origin of the last Lower High swing.
Aggressive entry: 0.0493–0.0496, on strength through the shelf with RSI staying above 55Conservative entry: 0.0500–0.0505, on a confirmed close above the resistance zone with a successful retest of 0.0500 as supportStop-loss: Below 0.0474 (beneath the Higher Low) — a break back under this level invalidates the reversal structure entirelyTarget 1: 0.0520Target 2: 0.0540 (near the origin of the prior Lower High swing)Target 3 (extended): 0.0570, only on strong volume follow-through
The bearish case: If price gets rejected at the 0.0493–0.0500 confluence zone again — this would be at least the third rejection from this general area — the descending trendline stays in control, and a retest of the 0.0474 Higher Low, followed by a break of it, would resume the broader downtrend toward new lows.
Short trigger: Rejection candle at 0.0495–0.0500 with RSI turning back down through 55Stop-loss: Above 0.0505Target 1: 0.0474Target 2: 0.0450 (measured move of the recent range)
The Bottom Line
ONT/USDT is at a genuine inflection point. The Higher Low plus rising RSI gives the bulls the benefit of the doubt short-term, but the 0.0493–0.0500 zone is a real wall that has already capped two prior rallies via the descending trendline. Watch how price behaves right at this level over the next few candles — a decisive close above 0.0500 is the confirmation bulls need, while continued rejection keeps this range-bound and tilts risk back toward the downside.
This analysis is based on technical chart structure and is for informational purposes only. It is not financial advice. Cryptocurrency markets are highly volatile — always do your own research and manage risk according to your own trading plan before entering any position.
@Binance Square Official #FedRateWatch #ZcashRises6% #XRPSinks10% #Binance #ChartSniper
Ontology (ONT) has spent the better part of three sessions grinding lower against Tether, but the 15-minute chart is now showing the first real signs that sellers are losing their grip. After stamping a fresh Lower Low, price has carved out a Higher Low — and that single shift in structure is the crack in the downtrend that traders should be watching closely right now.
Reading the Structure
The chart tells a clean story of a fading downtrend. ONT/USDT printed a Lower Low, then rallied into a Lower High, rolled over again into a second Lower High, and finally found buyers at a Higher Low near 0.0474. That HL is the key development — it's the first sign in this sequence that sellers are no longer able to push price to a new floor.
Since that Higher Low, ONT has been building a tight base directly beneath a horizontal resistance shelf sitting between 0.0493 and 0.0500. A descending trendline connecting the two Lower Highs is converging on that same zone, creating a confluence of resistance right around current price. This is effectively a compression zone: a falling trendline pressing down, a horizontal ceiling capping upside, and a rising floor of higher lows pushing from below. Squeezes like this typically resolve with a decisive move, and right now momentum is leaning in the bulls' favor.
Momentum Confirms the Shift
RSI (14) is sitting at 60.95, with its moving average at 55.12 — both comfortably above the 50 midline and both sloping upward. That's a meaningful tell. During the initial leg down, RSI was pinned well below 50; the fact that it's now pushing into bullish territory alongside the Higher Low adds confluence to the idea that buyers are stepping back in rather than this being a dead-cat bounce.
Price last traded at 0.04901, up 0.47% on the session, and is currently pressing directly into the 0.0493 level — the lower boundary of the resistance shelf and, not coincidentally, right where the descending trendline is also cutting through.
Trade Setup
The bullish case: A clean breakout and hold above the 0.0493–0.0500 resistance shelf, especially if it comes with a retest that holds as new support, would confirm the downtrend is broken and open the door for a move back toward the origin of the last Lower High swing.
Aggressive entry: 0.0493–0.0496, on strength through the shelf with RSI staying above 55Conservative entry: 0.0500–0.0505, on a confirmed close above the resistance zone with a successful retest of 0.0500 as supportStop-loss: Below 0.0474 (beneath the Higher Low) — a break back under this level invalidates the reversal structure entirelyTarget 1: 0.0520Target 2: 0.0540 (near the origin of the prior Lower High swing)Target 3 (extended): 0.0570, only on strong volume follow-through
The bearish case: If price gets rejected at the 0.0493–0.0500 confluence zone again — this would be at least the third rejection from this general area — the descending trendline stays in control, and a retest of the 0.0474 Higher Low, followed by a break of it, would resume the broader downtrend toward new lows.
Short trigger: Rejection candle at 0.0495–0.0500 with RSI turning back down through 55Stop-loss: Above 0.0505Target 1: 0.0474Target 2: 0.0450 (measured move of the recent range)
The Bottom Line
ONT/USDT is at a genuine inflection point. The Higher Low plus rising RSI gives the bulls the benefit of the doubt short-term, but the 0.0493–0.0500 zone is a real wall that has already capped two prior rallies via the descending trendline. Watch how price behaves right at this level over the next few candles — a decisive close above 0.0500 is the confirmation bulls need, while continued rejection keeps this range-bound and tilts risk back toward the downside.
This analysis is based on technical chart structure and is for informational purposes only. It is not financial advice. Cryptocurrency markets are highly volatile — always do your own research and manage risk according to your own trading plan before entering any position.
@Binance Square Official #FedRateWatch #ZcashRises6% #XRPSinks10% #Binance #ChartSniper
157
·
--
Article
AGLD/USDT Grinds Above a Rising Trendline — Is Adventure Gold Quietly Basing for a Move?$AGLD
{future}(AGLDUSDT)
1H Chart | Binance Spot | AGLDUSDT | September 16, 2026
Adventure Gold (AGLD) is trading at 0.1724, up a modest +0.52% on the session after opening at 0.1716 and ranging between 0.1716 and 0.1729. Compared to the sharper, more explosive setups elsewhere on the board right now, AGLD's chart is quieter — but underneath that quiet is a structure worth watching: a token that fell hard from a recent high, found a floor, and has spent the last day and a half slowly climbing a defended trendline back toward the resistance that capped its last bounce.
Reading the Structure
The setup starts with a sharp rally into a higher high near 0.192 on September 13, followed by an equally sharp reversal that dragged AGLD back down through the entire prior range. That decline didn't stop cleanly — price ground lower through September 14-15, eventually carving out a lower low near 0.1656 by September 15-16, just above the major green support level at 0.1641.
From that low, AGLD has been climbing steadily along a rising trendline, connecting the 0.1656 low to the current price action. That climb produced a lower high near 0.1755 on September 16, tagging the upper edge of a gray consolidation zone before rolling over into a shallow pullback. Since then, price has held above the trendline and is grinding back up toward that same resistance, currently sitting at 0.1724.
Two horizontal levels frame the current range clearly: the white line at 0.1813 well above current price — a level AGLD hasn't tested since its initial decline — and the green support at 0.1641 far below, which has held as the structural floor since the September 16 low. Between those, the recent lower-high rejection at 0.1755 is the more immediate hurdle.
RSI (14) is sitting just above neutral at 56.74 (signal 49.64), having recovered from an oversold dip near 40 during the height of the decline. That's a modest but steady improvement — not the sharp, overbought spike seen in some of the more explosive setups elsewhere, but a gradual stabilization consistent with a base-building phase rather than continued distribution.
Key Levels to Watch
Immediate resistance: 0.1755 — the recent lower high and the top of the current consolidation pocket; this is the first level that needs to break for AGLD to signal real strength.Major resistance: 0.1813 — a clean, untested level well above current price; a break above 0.1755 with volume would put this in play.Trendline support: the rising trendline from the 0.1656 low, currently tracking up through roughly 0.170–0.172 and climbing with each hourly candle.Immediate support: 0.1690 – 0.1710 — the recent consolidation floor just below current price.Major support / invalidation: 0.1641 — the green support level; a clean break below this would undo the recovery structure and open a retest of deeper lows.
Two Ways to Approach the Trade
1. Trendline support entry (favored, lower risk): Buying dips toward the rising trendline, roughly where price is sitting right now, offers a defined-risk way to play the continuation of the recovery.
Entry zone: 0.1700 – 0.1720Stop-loss: below 0.1656 (below the recent low and trendline)Target 1: 0.1755Target 2: 0.1813, on a confirmed break of the 0.1755 resistance
2. Breakout continuation (momentum play): For traders wanting confirmation first, a sustained close above 0.1755 with rising volume would validate that AGLD is ready to challenge the higher 0.1813 level.
Entry trigger: sustained close above 0.1755Stop-loss: 0.1710 (back inside the recent range)Target 1: 0.1813Target 2: a further extension toward the 0.185–0.19 zone if momentum accelerates
Given how consistently the trendline has held and RSI's steady (if unspectacular) recovery, this setup favors a patient continuation play over a chase — the more compelling trigger is a clean break of 0.1755 rather than the current grind beneath it.
Next Gainer?
AGLD's structure is less dramatic than some of the sharper breakout patterns elsewhere right now, but the ingredients for a continuation move are present: a defended trendline, a higher low above major support, and RSI recovering without yet reaching overbought. If price clears 0.1755 with volume, AGLD has a reasonable path toward the untested 0.1813 level, which would put it on watch as a steady mover rather than an explosive one. The main risk is that this remains a token still well below its September 13 high, so any failure to hold the trendline would put the move back into a slower, range-bound consolidation.
This is not financial advice. Crypto spot and perpetual markets are highly volatile, and prices can move sharply in either direction in minutes. Always do your own research, size positions responsibly, and use stop-losses before entering any trade.
@Binance_Square_Official #FedRateWatch #ZcashRises6% #XRPSinks10% #Binance #ChartSniper
AGLD/USDT Grinds Above a Rising Trendline — Is Adventure Gold Quietly Basing for a Move?
$AGLD
1H Chart | Binance Spot | AGLDUSDT | September 16, 2026
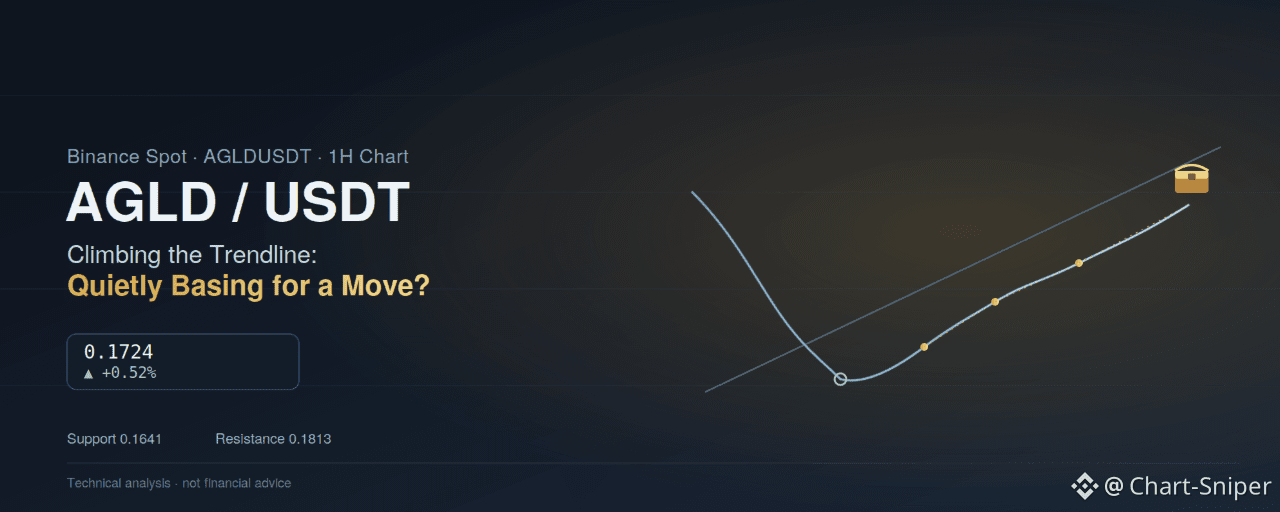
Adventure Gold (AGLD) is trading at 0.1724, up a modest +0.52% on the session after opening at 0.1716 and ranging between 0.1716 and 0.1729. Compared to the sharper, more explosive setups elsewhere on the board right now, AGLD's chart is quieter — but underneath that quiet is a structure worth watching: a token that fell hard from a recent high, found a floor, and has spent the last day and a half slowly climbing a defended trendline back toward the resistance that capped its last bounce.
Reading the Structure
The setup starts with a sharp rally into a higher high near 0.192 on September 13, followed by an equally sharp reversal that dragged AGLD back down through the entire prior range. That decline didn't stop cleanly — price ground lower through September 14-15, eventually carving out a lower low near 0.1656 by September 15-16, just above the major green support level at 0.1641.
From that low, AGLD has been climbing steadily along a rising trendline, connecting the 0.1656 low to the current price action. That climb produced a lower high near 0.1755 on September 16, tagging the upper edge of a gray consolidation zone before rolling over into a shallow pullback. Since then, price has held above the trendline and is grinding back up toward that same resistance, currently sitting at 0.1724.
Two horizontal levels frame the current range clearly: the white line at 0.1813 well above current price — a level AGLD hasn't tested since its initial decline — and the green support at 0.1641 far below, which has held as the structural floor since the September 16 low. Between those, the recent lower-high rejection at 0.1755 is the more immediate hurdle.
RSI (14) is sitting just above neutral at 56.74 (signal 49.64), having recovered from an oversold dip near 40 during the height of the decline. That's a modest but steady improvement — not the sharp, overbought spike seen in some of the more explosive setups elsewhere, but a gradual stabilization consistent with a base-building phase rather than continued distribution.
Key Levels to Watch
Immediate resistance: 0.1755 — the recent lower high and the top of the current consolidation pocket; this is the first level that needs to break for AGLD to signal real strength.Major resistance: 0.1813 — a clean, untested level well above current price; a break above 0.1755 with volume would put this in play.Trendline support: the rising trendline from the 0.1656 low, currently tracking up through roughly 0.170–0.172 and climbing with each hourly candle.Immediate support: 0.1690 – 0.1710 — the recent consolidation floor just below current price.Major support / invalidation: 0.1641 — the green support level; a clean break below this would undo the recovery structure and open a retest of deeper lows.
Two Ways to Approach the Trade
1. Trendline support entry (favored, lower risk): Buying dips toward the rising trendline, roughly where price is sitting right now, offers a defined-risk way to play the continuation of the recovery.
Entry zone: 0.1700 – 0.1720Stop-loss: below 0.1656 (below the recent low and trendline)Target 1: 0.1755Target 2: 0.1813, on a confirmed break of the 0.1755 resistance
2. Breakout continuation (momentum play): For traders wanting confirmation first, a sustained close above 0.1755 with rising volume would validate that AGLD is ready to challenge the higher 0.1813 level.
Entry trigger: sustained close above 0.1755Stop-loss: 0.1710 (back inside the recent range)Target 1: 0.1813Target 2: a further extension toward the 0.185–0.19 zone if momentum accelerates
Given how consistently the trendline has held and RSI's steady (if unspectacular) recovery, this setup favors a patient continuation play over a chase — the more compelling trigger is a clean break of 0.1755 rather than the current grind beneath it.
Next Gainer?
AGLD's structure is less dramatic than some of the sharper breakout patterns elsewhere right now, but the ingredients for a continuation move are present: a defended trendline, a higher low above major support, and RSI recovering without yet reaching overbought. If price clears 0.1755 with volume, AGLD has a reasonable path toward the untested 0.1813 level, which would put it on watch as a steady mover rather than an explosive one. The main risk is that this remains a token still well below its September 13 high, so any failure to hold the trendline would put the move back into a slower, range-bound consolidation.
This is not financial advice. Crypto spot and perpetual markets are highly volatile, and prices can move sharply in either direction in minutes. Always do your own research, size positions responsibly, and use stop-losses before entering any trade.
@Binance Square Official #FedRateWatch #ZcashRises6% #XRPSinks10% #Binance #ChartSniper
1H Chart | Binance Spot | AGLDUSDT | September 16, 2026
Adventure Gold (AGLD) is trading at 0.1724, up a modest +0.52% on the session after opening at 0.1716 and ranging between 0.1716 and 0.1729. Compared to the sharper, more explosive setups elsewhere on the board right now, AGLD's chart is quieter — but underneath that quiet is a structure worth watching: a token that fell hard from a recent high, found a floor, and has spent the last day and a half slowly climbing a defended trendline back toward the resistance that capped its last bounce.
Reading the Structure
The setup starts with a sharp rally into a higher high near 0.192 on September 13, followed by an equally sharp reversal that dragged AGLD back down through the entire prior range. That decline didn't stop cleanly — price ground lower through September 14-15, eventually carving out a lower low near 0.1656 by September 15-16, just above the major green support level at 0.1641.
From that low, AGLD has been climbing steadily along a rising trendline, connecting the 0.1656 low to the current price action. That climb produced a lower high near 0.1755 on September 16, tagging the upper edge of a gray consolidation zone before rolling over into a shallow pullback. Since then, price has held above the trendline and is grinding back up toward that same resistance, currently sitting at 0.1724.
Two horizontal levels frame the current range clearly: the white line at 0.1813 well above current price — a level AGLD hasn't tested since its initial decline — and the green support at 0.1641 far below, which has held as the structural floor since the September 16 low. Between those, the recent lower-high rejection at 0.1755 is the more immediate hurdle.
RSI (14) is sitting just above neutral at 56.74 (signal 49.64), having recovered from an oversold dip near 40 during the height of the decline. That's a modest but steady improvement — not the sharp, overbought spike seen in some of the more explosive setups elsewhere, but a gradual stabilization consistent with a base-building phase rather than continued distribution.
Key Levels to Watch
Immediate resistance: 0.1755 — the recent lower high and the top of the current consolidation pocket; this is the first level that needs to break for AGLD to signal real strength.Major resistance: 0.1813 — a clean, untested level well above current price; a break above 0.1755 with volume would put this in play.Trendline support: the rising trendline from the 0.1656 low, currently tracking up through roughly 0.170–0.172 and climbing with each hourly candle.Immediate support: 0.1690 – 0.1710 — the recent consolidation floor just below current price.Major support / invalidation: 0.1641 — the green support level; a clean break below this would undo the recovery structure and open a retest of deeper lows.
Two Ways to Approach the Trade
1. Trendline support entry (favored, lower risk): Buying dips toward the rising trendline, roughly where price is sitting right now, offers a defined-risk way to play the continuation of the recovery.
Entry zone: 0.1700 – 0.1720Stop-loss: below 0.1656 (below the recent low and trendline)Target 1: 0.1755Target 2: 0.1813, on a confirmed break of the 0.1755 resistance
2. Breakout continuation (momentum play): For traders wanting confirmation first, a sustained close above 0.1755 with rising volume would validate that AGLD is ready to challenge the higher 0.1813 level.
Entry trigger: sustained close above 0.1755Stop-loss: 0.1710 (back inside the recent range)Target 1: 0.1813Target 2: a further extension toward the 0.185–0.19 zone if momentum accelerates
Given how consistently the trendline has held and RSI's steady (if unspectacular) recovery, this setup favors a patient continuation play over a chase — the more compelling trigger is a clean break of 0.1755 rather than the current grind beneath it.
Next Gainer?
AGLD's structure is less dramatic than some of the sharper breakout patterns elsewhere right now, but the ingredients for a continuation move are present: a defended trendline, a higher low above major support, and RSI recovering without yet reaching overbought. If price clears 0.1755 with volume, AGLD has a reasonable path toward the untested 0.1813 level, which would put it on watch as a steady mover rather than an explosive one. The main risk is that this remains a token still well below its September 13 high, so any failure to hold the trendline would put the move back into a slower, range-bound consolidation.
This is not financial advice. Crypto spot and perpetual markets are highly volatile, and prices can move sharply in either direction in minutes. Always do your own research, size positions responsibly, and use stop-losses before entering any trade.
@Binance Square Official #FedRateWatch #ZcashRises6% #XRPSinks10% #Binance #ChartSniper
113
·
--
Article
HEI/USDT Rockets Out of a Multi-Day Base — Can the Channel Keep Climbing?$HEI
{future}(HEIUSDT)
15M Chart | Binance Perpetual | HEIUSDT | September 16, 2026
Heima (HEI) is trading at 0.14539, up a sharp +1.80% on the session after opening at 0.14282 and swinging between 0.14143 and 0.14608. That daily number barely captures the scale of what's happened over the past 24 hours: HEI has broken out of a long, flat base and gone almost parabolic, rallying more than 30% from its early-session lows to a fresh high before cooling into a textbook pullback that's now resolving back to the upside.
Reading the Structure
The setup begins with an extended period of quiet, rangebound trading held above a green support floor near 0.11133 — a level that had capped downside for hours without any real directional conviction. That base finally gave way around 06:00-07:00 on September 16, when HEI printed a lower high near 0.1105 and immediately reversed into an aggressive breakout.
From there, the move was fast and structured: price surged inside a well-defined ascending channel, marked by two parallel rising trendlines, climbing from the low-0.11s all the way to a higher high near 0.1505, tagging the red resistance line almost exactly. That's close to a 35% impulsive rally in a matter of hours — an unusually strong move that immediately triggered profit-taking.
The pullback that followed was sharp but controlled: HEI dropped to a lower low near 0.1350, right at the horizontal white support line, before buyers stepped back in. Since that low, price has been climbing again, riding the lower rail of the ascending channel back up to the current 0.14539 — a classic higher-low bounce inside an intact uptrend structure rather than a breakdown.
RSI (14) tells a constructive story: it spiked well above 80 during the initial breakout, cooled sharply during the pullback to the 0.1350 low, and has since recovered to 61.29 (signal at 55.46) — back above the neutral 50 line and rising, consistent with renewed buying pressure rather than exhaustion.
Key Levels to Watch
Major resistance: 0.15053 — the recent higher high and the level that triggered the first pullback; a confirmed break above this on volume would open fresh price discovery.Immediate support: 0.13507 — the horizontal level that held the recent lower low and is now backed by the rising channel trendline.Channel support: the lower ascending trendline, currently tracking through roughly 0.135–0.140 and rising with each 15-minute candle.Major support / invalidation: 0.11133 — the long-term base; a break back below this would undo the entire breakout structure, though it sits far below current price and is not an immediate concern.Upper channel boundary: the steeper white trendline running above the current channel, useful as a guide for how extended price can get before a deeper pullback becomes likely.
Two Ways to Approach the Trade
1. Channel support entry (favored, trend-aligned): Buying pullbacks toward the lower channel trendline and the 0.1350 support has worked cleanly on the most recent test, and offers a defined-risk way to ride the continuation.
Entry zone: 0.1400 – 0.1425 (on any dip back toward the channel's lower rail)Stop-loss: below 0.1340 (below the recent lower low and channel support)Target 1: 0.1505Target 2: an extension beyond 0.1505 if the breakout resumes with volume
2. Breakout continuation (momentum play): For traders looking for confirmation, a sustained close above 0.1505 with strong volume would validate the next leg of the move.
Entry trigger: sustained close above 0.1505Stop-loss: 0.1425 (back inside the recent range)Target 1: 0.1600Target 2: a further measured extension based on the size of the initial breakout leg
Given how quickly HEI recovered off the 0.1350 low and how well RSI has held above neutral through the pullback, the structure favors continuation — but a move this fast and steep also carries real risk of sharp volatility in both directions, so position sizing should stay conservative regardless of direction.
Next Gainer?
HEI's breakout from a multi-hour base into a near-35% impulsive rally, followed by a controlled pullback that respected both a horizontal support level and the channel's rising trendline, is one of the more aggressive momentum setups on the board today. If price holds the channel and clears 0.1505 with continued volume, HEI has real potential to be among the stronger short-term gainers given the speed of the move already in play. The key risk is the sheer size of the initial rally — parabolic moves like this can reverse just as fast as they formed, so a break of the channel and the 0.1350 support would be the first sign the move is losing steam.
This is not financial advice. Crypto perpetual contracts are highly leveraged, highly volatile instruments, and prices can move sharply against a position in minutes. Always do your own research, size positions responsibly, and use stop-losses before entering any trade.
@Binance_Square_Official #FedRateWatch #ZcashRises6% #XRPSinks10% #Binance #ChartSniper
HEI/USDT Rockets Out of a Multi-Day Base — Can the Channel Keep Climbing?
$HEI
15M Chart | Binance Perpetual | HEIUSDT | September 16, 2026
Heima (HEI) is trading at 0.14539, up a sharp +1.80% on the session after opening at 0.14282 and swinging between 0.14143 and 0.14608. That daily number barely captures the scale of what's happened over the past 24 hours: HEI has broken out of a long, flat base and gone almost parabolic, rallying more than 30% from its early-session lows to a fresh high before cooling into a textbook pullback that's now resolving back to the upside.
Reading the Structure
The setup begins with an extended period of quiet, rangebound trading held above a green support floor near 0.11133 — a level that had capped downside for hours without any real directional conviction. That base finally gave way around 06:00-07:00 on September 16, when HEI printed a lower high near 0.1105 and immediately reversed into an aggressive breakout.
From there, the move was fast and structured: price surged inside a well-defined ascending channel, marked by two parallel rising trendlines, climbing from the low-0.11s all the way to a higher high near 0.1505, tagging the red resistance line almost exactly. That's close to a 35% impulsive rally in a matter of hours — an unusually strong move that immediately triggered profit-taking.
The pullback that followed was sharp but controlled: HEI dropped to a lower low near 0.1350, right at the horizontal white support line, before buyers stepped back in. Since that low, price has been climbing again, riding the lower rail of the ascending channel back up to the current 0.14539 — a classic higher-low bounce inside an intact uptrend structure rather than a breakdown.
RSI (14) tells a constructive story: it spiked well above 80 during the initial breakout, cooled sharply during the pullback to the 0.1350 low, and has since recovered to 61.29 (signal at 55.46) — back above the neutral 50 line and rising, consistent with renewed buying pressure rather than exhaustion.
Key Levels to Watch
Major resistance: 0.15053 — the recent higher high and the level that triggered the first pullback; a confirmed break above this on volume would open fresh price discovery.Immediate support: 0.13507 — the horizontal level that held the recent lower low and is now backed by the rising channel trendline.Channel support: the lower ascending trendline, currently tracking through roughly 0.135–0.140 and rising with each 15-minute candle.Major support / invalidation: 0.11133 — the long-term base; a break back below this would undo the entire breakout structure, though it sits far below current price and is not an immediate concern.Upper channel boundary: the steeper white trendline running above the current channel, useful as a guide for how extended price can get before a deeper pullback becomes likely.
Two Ways to Approach the Trade
1. Channel support entry (favored, trend-aligned): Buying pullbacks toward the lower channel trendline and the 0.1350 support has worked cleanly on the most recent test, and offers a defined-risk way to ride the continuation.
Entry zone: 0.1400 – 0.1425 (on any dip back toward the channel's lower rail)Stop-loss: below 0.1340 (below the recent lower low and channel support)Target 1: 0.1505Target 2: an extension beyond 0.1505 if the breakout resumes with volume
2. Breakout continuation (momentum play): For traders looking for confirmation, a sustained close above 0.1505 with strong volume would validate the next leg of the move.
Entry trigger: sustained close above 0.1505Stop-loss: 0.1425 (back inside the recent range)Target 1: 0.1600Target 2: a further measured extension based on the size of the initial breakout leg
Given how quickly HEI recovered off the 0.1350 low and how well RSI has held above neutral through the pullback, the structure favors continuation — but a move this fast and steep also carries real risk of sharp volatility in both directions, so position sizing should stay conservative regardless of direction.
Next Gainer?
HEI's breakout from a multi-hour base into a near-35% impulsive rally, followed by a controlled pullback that respected both a horizontal support level and the channel's rising trendline, is one of the more aggressive momentum setups on the board today. If price holds the channel and clears 0.1505 with continued volume, HEI has real potential to be among the stronger short-term gainers given the speed of the move already in play. The key risk is the sheer size of the initial rally — parabolic moves like this can reverse just as fast as they formed, so a break of the channel and the 0.1350 support would be the first sign the move is losing steam.
This is not financial advice. Crypto perpetual contracts are highly leveraged, highly volatile instruments, and prices can move sharply against a position in minutes. Always do your own research, size positions responsibly, and use stop-losses before entering any trade.
@Binance Square Official #FedRateWatch #ZcashRises6% #XRPSinks10% #Binance #ChartSniper
15M Chart | Binance Perpetual | HEIUSDT | September 16, 2026
Heima (HEI) is trading at 0.14539, up a sharp +1.80% on the session after opening at 0.14282 and swinging between 0.14143 and 0.14608. That daily number barely captures the scale of what's happened over the past 24 hours: HEI has broken out of a long, flat base and gone almost parabolic, rallying more than 30% from its early-session lows to a fresh high before cooling into a textbook pullback that's now resolving back to the upside.
Reading the Structure
The setup begins with an extended period of quiet, rangebound trading held above a green support floor near 0.11133 — a level that had capped downside for hours without any real directional conviction. That base finally gave way around 06:00-07:00 on September 16, when HEI printed a lower high near 0.1105 and immediately reversed into an aggressive breakout.
From there, the move was fast and structured: price surged inside a well-defined ascending channel, marked by two parallel rising trendlines, climbing from the low-0.11s all the way to a higher high near 0.1505, tagging the red resistance line almost exactly. That's close to a 35% impulsive rally in a matter of hours — an unusually strong move that immediately triggered profit-taking.
The pullback that followed was sharp but controlled: HEI dropped to a lower low near 0.1350, right at the horizontal white support line, before buyers stepped back in. Since that low, price has been climbing again, riding the lower rail of the ascending channel back up to the current 0.14539 — a classic higher-low bounce inside an intact uptrend structure rather than a breakdown.
RSI (14) tells a constructive story: it spiked well above 80 during the initial breakout, cooled sharply during the pullback to the 0.1350 low, and has since recovered to 61.29 (signal at 55.46) — back above the neutral 50 line and rising, consistent with renewed buying pressure rather than exhaustion.
Key Levels to Watch
Major resistance: 0.15053 — the recent higher high and the level that triggered the first pullback; a confirmed break above this on volume would open fresh price discovery.Immediate support: 0.13507 — the horizontal level that held the recent lower low and is now backed by the rising channel trendline.Channel support: the lower ascending trendline, currently tracking through roughly 0.135–0.140 and rising with each 15-minute candle.Major support / invalidation: 0.11133 — the long-term base; a break back below this would undo the entire breakout structure, though it sits far below current price and is not an immediate concern.Upper channel boundary: the steeper white trendline running above the current channel, useful as a guide for how extended price can get before a deeper pullback becomes likely.
Two Ways to Approach the Trade
1. Channel support entry (favored, trend-aligned): Buying pullbacks toward the lower channel trendline and the 0.1350 support has worked cleanly on the most recent test, and offers a defined-risk way to ride the continuation.
Entry zone: 0.1400 – 0.1425 (on any dip back toward the channel's lower rail)Stop-loss: below 0.1340 (below the recent lower low and channel support)Target 1: 0.1505Target 2: an extension beyond 0.1505 if the breakout resumes with volume
2. Breakout continuation (momentum play): For traders looking for confirmation, a sustained close above 0.1505 with strong volume would validate the next leg of the move.
Entry trigger: sustained close above 0.1505Stop-loss: 0.1425 (back inside the recent range)Target 1: 0.1600Target 2: a further measured extension based on the size of the initial breakout leg
Given how quickly HEI recovered off the 0.1350 low and how well RSI has held above neutral through the pullback, the structure favors continuation — but a move this fast and steep also carries real risk of sharp volatility in both directions, so position sizing should stay conservative regardless of direction.
Next Gainer?
HEI's breakout from a multi-hour base into a near-35% impulsive rally, followed by a controlled pullback that respected both a horizontal support level and the channel's rising trendline, is one of the more aggressive momentum setups on the board today. If price holds the channel and clears 0.1505 with continued volume, HEI has real potential to be among the stronger short-term gainers given the speed of the move already in play. The key risk is the sheer size of the initial rally — parabolic moves like this can reverse just as fast as they formed, so a break of the channel and the 0.1350 support would be the first sign the move is losing steam.
This is not financial advice. Crypto perpetual contracts are highly leveraged, highly volatile instruments, and prices can move sharply against a position in minutes. Always do your own research, size positions responsibly, and use stop-losses before entering any trade.
@Binance Square Official #FedRateWatch #ZcashRises6% #XRPSinks10% #Binance #ChartSniper
127
·
--
Article
LA/USDT Climbs Inside a Rising Channel — Is the Next Breakout Already Loading?$LA
{future}(LAUSDT)
15M Chart | Binance Perpetual | LAUSDT | September 16, 2026
Lagrange (LA) is trading at 0.06588, up a modest +0.14% on the session after opening at 0.06578 and ranging between a high of 0.06597 and a low of 0.06561. The daily candle looks flat, but the structure underneath is anything but static — after a sharp two-day selloff earlier in the week, LA has spent the last day and a half building a genuine rising channel, bouncing off its lower rail for a third time as it grinds back toward the resistance that capped its last rally attempt.
Reading the Structure
The move starts with a volatile spike into a higher high near 0.0741 on September 14, followed almost immediately by a sharp pullback into the low-0.065 zone, a second push to a fresh high near 0.0738, and then a hard reversal that broke the prior structure entirely — dropping LA all the way down to a base near 0.0598 by September 16. That decline wiped out more than 19% from the September 15 high in under a day, a capitulation-style flush that often marks exhaustion on the sell side.
From that low, LA has been climbing inside a well-defined ascending channel, marked by two parallel rising trendlines on the chart. Price pushed up sharply to a lower high near 0.0687, tagging the horizontal resistance at 0.06875 almost exactly, before rolling over and sliding back down to retest the lower rail of the channel. That retest is happening right now — LA has bounced off the lower trendline and is pushing back up toward 0.06588, the third clean touch of that rising support line since the base formed.
RSI (14) reflects the choppy but improving picture: it dipped toward 30 during the capitulation low, spiked to nearly 75 on the rally into the 0.0687 high, and has since cooled to a more neutral 61.45 (signal at 48.10) — elevated but not overbought, consistent with a market still finding its footing inside an uptrend rather than exhausting it.
Key Levels to Watch
Major resistance: 0.06875 — the horizontal level that capped the last rally and the lower-high on the chart; this is the level that needs to break for LA to make a genuine run at the September highs.Extended resistance: 0.0738 – 0.0741 — the prior swing highs from September 14-15; a much bigger target if 0.06875 clears with volume.Immediate support: the rising lower channel trendline, currently tracking through roughly 0.0640–0.0650 and rising.Major support / invalidation: 0.0598 — the base of the entire recovery structure; a clean break below this with volume would undo the channel thesis and open a retest of lower levels.Midline support: the horizontal 0.0651 level (the prior lower-low pivot), which sits inside the channel and can act as a secondary cushion on dips.
Two Ways to Approach the Trade
1. Channel support bounce (favored, trend-aligned): Buying the current bounce off the lower trendline, near where price is sitting right now, offers a defined-risk way to play the continuation of the channel.
Entry zone: 0.0655 – 0.0665Stop-loss: below 0.0640 (below the rising trendline and the 0.0651 pivot)Target 1: 0.0687Target 2: 0.0738, on a confirmed break of the 0.06875 resistance
2. Breakout continuation (momentum play): For traders who want confirmation first, a sustained close above 0.06875 with rising volume would validate that the channel is resolving higher rather than just oscillating inside it.
Entry trigger: sustained close above 0.06875Stop-loss: 0.0665 (back inside the channel)Target 1: 0.0710Target 2: 0.0738 – 0.0741 (prior swing highs)
Given that this is the third respected touch of the rising trendline and RSI has stayed constructive through each dip, the setup favors continuation — but 0.06875 remains the level standing between a healthy channel and a confirmed breakout toward the September highs.
Next Gainer?
LA's price action since the 0.0598 base has been a clean, repeatable pattern: higher lows on every trendline touch, RSI holding above neutral, and a resistance level being retested with increasing conviction. That kind of coiling structure often precedes a decisive move once it resolves. If LA holds the channel and clears 0.06875 with volume, it has a credible path back toward the 0.0738–0.0741 highs, putting it firmly in the conversation for a short-term mover. The key risk is the channel itself — a break of the lower trendline and the 0.0598 base would flip the bias back toward consolidation or renewed downside.
This is not financial advice. Crypto perpetual contracts are highly leveraged, highly volatile instruments, and prices can move sharply against a position in minutes. Always do your own research, size positions responsibly, and use stop-losses before entering any trade.
@Binance_Square_Official #FedRateWatch #ZcashRises6% #XRPSinks10% #Binance #ChartSniper
LA/USDT Climbs Inside a Rising Channel — Is the Next Breakout Already Loading?
$LA
15M Chart | Binance Perpetual | LAUSDT | September 16, 2026
Lagrange (LA) is trading at 0.06588, up a modest +0.14% on the session after opening at 0.06578 and ranging between a high of 0.06597 and a low of 0.06561. The daily candle looks flat, but the structure underneath is anything but static — after a sharp two-day selloff earlier in the week, LA has spent the last day and a half building a genuine rising channel, bouncing off its lower rail for a third time as it grinds back toward the resistance that capped its last rally attempt.
Reading the Structure
The move starts with a volatile spike into a higher high near 0.0741 on September 14, followed almost immediately by a sharp pullback into the low-0.065 zone, a second push to a fresh high near 0.0738, and then a hard reversal that broke the prior structure entirely — dropping LA all the way down to a base near 0.0598 by September 16. That decline wiped out more than 19% from the September 15 high in under a day, a capitulation-style flush that often marks exhaustion on the sell side.
From that low, LA has been climbing inside a well-defined ascending channel, marked by two parallel rising trendlines on the chart. Price pushed up sharply to a lower high near 0.0687, tagging the horizontal resistance at 0.06875 almost exactly, before rolling over and sliding back down to retest the lower rail of the channel. That retest is happening right now — LA has bounced off the lower trendline and is pushing back up toward 0.06588, the third clean touch of that rising support line since the base formed.
RSI (14) reflects the choppy but improving picture: it dipped toward 30 during the capitulation low, spiked to nearly 75 on the rally into the 0.0687 high, and has since cooled to a more neutral 61.45 (signal at 48.10) — elevated but not overbought, consistent with a market still finding its footing inside an uptrend rather than exhausting it.
Key Levels to Watch
Major resistance: 0.06875 — the horizontal level that capped the last rally and the lower-high on the chart; this is the level that needs to break for LA to make a genuine run at the September highs.Extended resistance: 0.0738 – 0.0741 — the prior swing highs from September 14-15; a much bigger target if 0.06875 clears with volume.Immediate support: the rising lower channel trendline, currently tracking through roughly 0.0640–0.0650 and rising.Major support / invalidation: 0.0598 — the base of the entire recovery structure; a clean break below this with volume would undo the channel thesis and open a retest of lower levels.Midline support: the horizontal 0.0651 level (the prior lower-low pivot), which sits inside the channel and can act as a secondary cushion on dips.
Two Ways to Approach the Trade
1. Channel support bounce (favored, trend-aligned): Buying the current bounce off the lower trendline, near where price is sitting right now, offers a defined-risk way to play the continuation of the channel.
Entry zone: 0.0655 – 0.0665Stop-loss: below 0.0640 (below the rising trendline and the 0.0651 pivot)Target 1: 0.0687Target 2: 0.0738, on a confirmed break of the 0.06875 resistance
2. Breakout continuation (momentum play): For traders who want confirmation first, a sustained close above 0.06875 with rising volume would validate that the channel is resolving higher rather than just oscillating inside it.
Entry trigger: sustained close above 0.06875Stop-loss: 0.0665 (back inside the channel)Target 1: 0.0710Target 2: 0.0738 – 0.0741 (prior swing highs)
Given that this is the third respected touch of the rising trendline and RSI has stayed constructive through each dip, the setup favors continuation — but 0.06875 remains the level standing between a healthy channel and a confirmed breakout toward the September highs.
Next Gainer?
LA's price action since the 0.0598 base has been a clean, repeatable pattern: higher lows on every trendline touch, RSI holding above neutral, and a resistance level being retested with increasing conviction. That kind of coiling structure often precedes a decisive move once it resolves. If LA holds the channel and clears 0.06875 with volume, it has a credible path back toward the 0.0738–0.0741 highs, putting it firmly in the conversation for a short-term mover. The key risk is the channel itself — a break of the lower trendline and the 0.0598 base would flip the bias back toward consolidation or renewed downside.
This is not financial advice. Crypto perpetual contracts are highly leveraged, highly volatile instruments, and prices can move sharply against a position in minutes. Always do your own research, size positions responsibly, and use stop-losses before entering any trade.
@Binance Square Official #FedRateWatch #ZcashRises6% #XRPSinks10% #Binance #ChartSniper
15M Chart | Binance Perpetual | LAUSDT | September 16, 2026
Lagrange (LA) is trading at 0.06588, up a modest +0.14% on the session after opening at 0.06578 and ranging between a high of 0.06597 and a low of 0.06561. The daily candle looks flat, but the structure underneath is anything but static — after a sharp two-day selloff earlier in the week, LA has spent the last day and a half building a genuine rising channel, bouncing off its lower rail for a third time as it grinds back toward the resistance that capped its last rally attempt.
Reading the Structure
The move starts with a volatile spike into a higher high near 0.0741 on September 14, followed almost immediately by a sharp pullback into the low-0.065 zone, a second push to a fresh high near 0.0738, and then a hard reversal that broke the prior structure entirely — dropping LA all the way down to a base near 0.0598 by September 16. That decline wiped out more than 19% from the September 15 high in under a day, a capitulation-style flush that often marks exhaustion on the sell side.
From that low, LA has been climbing inside a well-defined ascending channel, marked by two parallel rising trendlines on the chart. Price pushed up sharply to a lower high near 0.0687, tagging the horizontal resistance at 0.06875 almost exactly, before rolling over and sliding back down to retest the lower rail of the channel. That retest is happening right now — LA has bounced off the lower trendline and is pushing back up toward 0.06588, the third clean touch of that rising support line since the base formed.
RSI (14) reflects the choppy but improving picture: it dipped toward 30 during the capitulation low, spiked to nearly 75 on the rally into the 0.0687 high, and has since cooled to a more neutral 61.45 (signal at 48.10) — elevated but not overbought, consistent with a market still finding its footing inside an uptrend rather than exhausting it.
Key Levels to Watch
Major resistance: 0.06875 — the horizontal level that capped the last rally and the lower-high on the chart; this is the level that needs to break for LA to make a genuine run at the September highs.Extended resistance: 0.0738 – 0.0741 — the prior swing highs from September 14-15; a much bigger target if 0.06875 clears with volume.Immediate support: the rising lower channel trendline, currently tracking through roughly 0.0640–0.0650 and rising.Major support / invalidation: 0.0598 — the base of the entire recovery structure; a clean break below this with volume would undo the channel thesis and open a retest of lower levels.Midline support: the horizontal 0.0651 level (the prior lower-low pivot), which sits inside the channel and can act as a secondary cushion on dips.
Two Ways to Approach the Trade
1. Channel support bounce (favored, trend-aligned): Buying the current bounce off the lower trendline, near where price is sitting right now, offers a defined-risk way to play the continuation of the channel.
Entry zone: 0.0655 – 0.0665Stop-loss: below 0.0640 (below the rising trendline and the 0.0651 pivot)Target 1: 0.0687Target 2: 0.0738, on a confirmed break of the 0.06875 resistance
2. Breakout continuation (momentum play): For traders who want confirmation first, a sustained close above 0.06875 with rising volume would validate that the channel is resolving higher rather than just oscillating inside it.
Entry trigger: sustained close above 0.06875Stop-loss: 0.0665 (back inside the channel)Target 1: 0.0710Target 2: 0.0738 – 0.0741 (prior swing highs)
Given that this is the third respected touch of the rising trendline and RSI has stayed constructive through each dip, the setup favors continuation — but 0.06875 remains the level standing between a healthy channel and a confirmed breakout toward the September highs.
Next Gainer?
LA's price action since the 0.0598 base has been a clean, repeatable pattern: higher lows on every trendline touch, RSI holding above neutral, and a resistance level being retested with increasing conviction. That kind of coiling structure often precedes a decisive move once it resolves. If LA holds the channel and clears 0.06875 with volume, it has a credible path back toward the 0.0738–0.0741 highs, putting it firmly in the conversation for a short-term mover. The key risk is the channel itself — a break of the lower trendline and the 0.0598 base would flip the bias back toward consolidation or renewed downside.
This is not financial advice. Crypto perpetual contracts are highly leveraged, highly volatile instruments, and prices can move sharply against a position in minutes. Always do your own research, size positions responsibly, and use stop-losses before entering any trade.
@Binance Square Official #FedRateWatch #ZcashRises6% #XRPSinks10% #Binance #ChartSniper
260
·
--
📉 $ZEC USDT — SHORT SETUP
ZEC is around $1,178–$1,217, after a sharp recent correction from above $1,200. Momentum remains volatile, with sellers active after the reversal.
🔴 SHORT ENTRY: Market Price
🛑 SL: $1,300
🎯 TP1: $1,100
🎯 TP2: $1,020
🎯 TP3: $950
⚡ Entry: Market Price — executable now.
⚠️ Not financial advice. Manage risk carefully.
@Binance_Square_Official #FedRateWatch #ZcashRises6% #XRPSinks10% #Binance #ChartSniper
{future}(ZECUSDT)
📉 $ZEC USDT — SHORT SETUP
ZEC is around $1,178–$1,217, after a sharp recent correction from above $1,200. Momentum remains volatile, with sellers active after the reversal.
🔴 SHORT ENTRY: Market Price
🛑 SL: $1,300
🎯 TP1: $1,100
🎯 TP2: $1,020
🎯 TP3: $950
⚡ Entry: Market Price — executable now.
⚠️ Not financial advice. Manage risk carefully.
@Binance Square Official #FedRateWatch #ZcashRises6% #XRPSinks10% #Binance #ChartSniper
ZEC is around $1,178–$1,217, after a sharp recent correction from above $1,200. Momentum remains volatile, with sellers active after the reversal.
🔴 SHORT ENTRY: Market Price
🛑 SL: $1,300
🎯 TP1: $1,100
🎯 TP2: $1,020
🎯 TP3: $950
⚡ Entry: Market Price — executable now.
⚠️ Not financial advice. Manage risk carefully.
@Binance Square Official #FedRateWatch #ZcashRises6% #XRPSinks10% #Binance #ChartSniper
191
·
--

Article
CATI/USDT Builds a Staircase Off the Lows — Is the Next Leg Higher Loading?$CATI
{future}(CATIUSDT)
1H Chart | Binance Perpetual | CATIUSDT | September 11, 2026
Catizen (CATI) is trading at 0.06116, up +0.81% on the day after opening at 0.06066 and swinging between a high of 0.06148 and a low of 0.06061. That's a quiet daily range, but it sits on top of one of the more constructive recovery structures on the board — a token that crashed hard, found a durable low, and has spent the last week building a genuine staircase of higher highs underneath a well-defined resistance shelf.
Reading the Structure
The setup begins with a violent move: CATI topped out at a higher high near 0.06575 on September 3, then collapsed almost immediately into a lower low near 0.0525, before one final flush down to a higher low at 0.04846 on September 5 — the anchor for the Fibonacci retracement drawn on the chart. That 0.04846 low marks a roughly 26% drawdown from the September 3 high in just two days, the kind of capitulation move that often precedes a base.
From that low, CATI didn't just bounce — it climbed with real structure. Price reclaimed the 0.786, 0.618, and 0.5 retracements in sequence, pushed into a higher high near 0.0625 by September 7, pulled back to a higher low around 0.0562 (well above the 0.04846 origin), and then pushed to yet another higher high near 0.0630 by September 9-10. That's two consecutive higher highs off a single defended low — a textbook uptrend structure, not just a dead-cat bounce.
Since that second high, CATI has been consolidating in a tight band roughly between 0.0593 (the 0.382 retracement) and 0.0662 (the top of the gray/red supply zone), with current price sitting almost exactly mid-range at 0.06116. The dashed ascending trendline connecting the 0.04846 low through the September 8 higher low is still intact and tracking up toward the current price zone, reinforcing that dips are still being bought rather than sold into.
RSI (14) is hovering right around neutral at 54.80 (signal 50.36), having cooled from an overbought spike earlier in the rally without breaking down — consistent with a market taking a breather inside an established uptrend rather than rolling over.
Key Levels to Watch
Major resistance: 0.0662 — the top of the current supply zone; a clean break and hold above this on volume would open a path to fresh local highs.Immediate resistance: 0.06167 — the 0.236 retracement, the first hurdle inside the current range.Immediate support: 0.05929 (0.382 retracement) — the level that has underpinned the recent consolidation.Trendline support: the rising trendline from the 0.04846 low, currently tracking up through the low-0.06 area.Major support: 0.05710 (0.5 retracement) and 0.05001 — a strong psychological round-number level that would be the deeper line of defense on any larger pullback.
Two Ways to Approach the Trade
1. Pullback entry into support (favored, trend-aligned): Waiting for a retest of the 0.0593–0.0612 zone — where the 0.382 retracement and the rising trendline converge — offers a cleaner entry than chasing the current range.
Entry zone: 0.0593 – 0.0612Stop-loss: below 0.0571 (below the 0.5 retracement)Target 1: 0.0625Target 2: 0.0662 (top of the supply zone)
2. Breakout continuation (momentum play): A confirmed close above 0.0662 with rising volume would confirm the range has resolved higher and open the door to a fresh push beyond the recent highs.
Entry trigger: sustained close above 0.0662Stop-loss: 0.0612 (back inside the prior range)Target 1: 0.0710 (measured extension)Target 2: extending further on continued strength, trailing the stop as new highs form
Given the pattern of higher highs and higher lows since the September 5 bottom, and RSI holding above neutral through the recent pullback, this setup favors continuation over reversal — but 0.0662 is the level that needs to give way before calling this a confirmed breakout rather than a range-bound consolidation.
Next Gainer?
CATI's recovery off the 0.04846 low stands out for its structure: two consecutive higher highs, a defended higher low, and a trendline that keeps getting bought on every retest. That's a cleaner uptrend pattern than a lot of charts showing up right now. If price holds above 0.0593 and clears 0.0662 with volume, CATI has a legitimate case to be one of the stronger short-term movers on the board. The main risk is that the token remains well below its September 3 high and has already failed once near the top of this range, so a rejection at 0.0662 would put it back into consolidation rather than a clean breakout.
This is not financial advice. Crypto perpetual contracts are highly leveraged, highly volatile instruments, and prices can move sharply against a position in minutes. Always do your own research, size positions responsibly, and use stop-losses before entering any trade.
@Binance_Square_Official #CPIWatch #BitcoinReboundsAbove$79KAfterCPI #BNBTops730USDT #Binance #ChartSniper
CATI/USDT Builds a Staircase Off the Lows — Is the Next Leg Higher Loading?
$CATI
1H Chart | Binance Perpetual | CATIUSDT | September 11, 2026
Catizen (CATI) is trading at 0.06116, up +0.81% on the day after opening at 0.06066 and swinging between a high of 0.06148 and a low of 0.06061. That's a quiet daily range, but it sits on top of one of the more constructive recovery structures on the board — a token that crashed hard, found a durable low, and has spent the last week building a genuine staircase of higher highs underneath a well-defined resistance shelf.
Reading the Structure
The setup begins with a violent move: CATI topped out at a higher high near 0.06575 on September 3, then collapsed almost immediately into a lower low near 0.0525, before one final flush down to a higher low at 0.04846 on September 5 — the anchor for the Fibonacci retracement drawn on the chart. That 0.04846 low marks a roughly 26% drawdown from the September 3 high in just two days, the kind of capitulation move that often precedes a base.
From that low, CATI didn't just bounce — it climbed with real structure. Price reclaimed the 0.786, 0.618, and 0.5 retracements in sequence, pushed into a higher high near 0.0625 by September 7, pulled back to a higher low around 0.0562 (well above the 0.04846 origin), and then pushed to yet another higher high near 0.0630 by September 9-10. That's two consecutive higher highs off a single defended low — a textbook uptrend structure, not just a dead-cat bounce.
Since that second high, CATI has been consolidating in a tight band roughly between 0.0593 (the 0.382 retracement) and 0.0662 (the top of the gray/red supply zone), with current price sitting almost exactly mid-range at 0.06116. The dashed ascending trendline connecting the 0.04846 low through the September 8 higher low is still intact and tracking up toward the current price zone, reinforcing that dips are still being bought rather than sold into.
RSI (14) is hovering right around neutral at 54.80 (signal 50.36), having cooled from an overbought spike earlier in the rally without breaking down — consistent with a market taking a breather inside an established uptrend rather than rolling over.
Key Levels to Watch
Major resistance: 0.0662 — the top of the current supply zone; a clean break and hold above this on volume would open a path to fresh local highs.Immediate resistance: 0.06167 — the 0.236 retracement, the first hurdle inside the current range.Immediate support: 0.05929 (0.382 retracement) — the level that has underpinned the recent consolidation.Trendline support: the rising trendline from the 0.04846 low, currently tracking up through the low-0.06 area.Major support: 0.05710 (0.5 retracement) and 0.05001 — a strong psychological round-number level that would be the deeper line of defense on any larger pullback.
Two Ways to Approach the Trade
1. Pullback entry into support (favored, trend-aligned): Waiting for a retest of the 0.0593–0.0612 zone — where the 0.382 retracement and the rising trendline converge — offers a cleaner entry than chasing the current range.
Entry zone: 0.0593 – 0.0612Stop-loss: below 0.0571 (below the 0.5 retracement)Target 1: 0.0625Target 2: 0.0662 (top of the supply zone)
2. Breakout continuation (momentum play): A confirmed close above 0.0662 with rising volume would confirm the range has resolved higher and open the door to a fresh push beyond the recent highs.
Entry trigger: sustained close above 0.0662Stop-loss: 0.0612 (back inside the prior range)Target 1: 0.0710 (measured extension)Target 2: extending further on continued strength, trailing the stop as new highs form
Given the pattern of higher highs and higher lows since the September 5 bottom, and RSI holding above neutral through the recent pullback, this setup favors continuation over reversal — but 0.0662 is the level that needs to give way before calling this a confirmed breakout rather than a range-bound consolidation.
Next Gainer?
CATI's recovery off the 0.04846 low stands out for its structure: two consecutive higher highs, a defended higher low, and a trendline that keeps getting bought on every retest. That's a cleaner uptrend pattern than a lot of charts showing up right now. If price holds above 0.0593 and clears 0.0662 with volume, CATI has a legitimate case to be one of the stronger short-term movers on the board. The main risk is that the token remains well below its September 3 high and has already failed once near the top of this range, so a rejection at 0.0662 would put it back into consolidation rather than a clean breakout.
This is not financial advice. Crypto perpetual contracts are highly leveraged, highly volatile instruments, and prices can move sharply against a position in minutes. Always do your own research, size positions responsibly, and use stop-losses before entering any trade.
@Binance Square Official #CPIWatch #BitcoinReboundsAbove$79KAfterCPI #BNBTops730USDT #Binance #ChartSniper
1H Chart | Binance Perpetual | CATIUSDT | September 11, 2026
Catizen (CATI) is trading at 0.06116, up +0.81% on the day after opening at 0.06066 and swinging between a high of 0.06148 and a low of 0.06061. That's a quiet daily range, but it sits on top of one of the more constructive recovery structures on the board — a token that crashed hard, found a durable low, and has spent the last week building a genuine staircase of higher highs underneath a well-defined resistance shelf.
Reading the Structure
The setup begins with a violent move: CATI topped out at a higher high near 0.06575 on September 3, then collapsed almost immediately into a lower low near 0.0525, before one final flush down to a higher low at 0.04846 on September 5 — the anchor for the Fibonacci retracement drawn on the chart. That 0.04846 low marks a roughly 26% drawdown from the September 3 high in just two days, the kind of capitulation move that often precedes a base.
From that low, CATI didn't just bounce — it climbed with real structure. Price reclaimed the 0.786, 0.618, and 0.5 retracements in sequence, pushed into a higher high near 0.0625 by September 7, pulled back to a higher low around 0.0562 (well above the 0.04846 origin), and then pushed to yet another higher high near 0.0630 by September 9-10. That's two consecutive higher highs off a single defended low — a textbook uptrend structure, not just a dead-cat bounce.
Since that second high, CATI has been consolidating in a tight band roughly between 0.0593 (the 0.382 retracement) and 0.0662 (the top of the gray/red supply zone), with current price sitting almost exactly mid-range at 0.06116. The dashed ascending trendline connecting the 0.04846 low through the September 8 higher low is still intact and tracking up toward the current price zone, reinforcing that dips are still being bought rather than sold into.
RSI (14) is hovering right around neutral at 54.80 (signal 50.36), having cooled from an overbought spike earlier in the rally without breaking down — consistent with a market taking a breather inside an established uptrend rather than rolling over.
Key Levels to Watch
Major resistance: 0.0662 — the top of the current supply zone; a clean break and hold above this on volume would open a path to fresh local highs.Immediate resistance: 0.06167 — the 0.236 retracement, the first hurdle inside the current range.Immediate support: 0.05929 (0.382 retracement) — the level that has underpinned the recent consolidation.Trendline support: the rising trendline from the 0.04846 low, currently tracking up through the low-0.06 area.Major support: 0.05710 (0.5 retracement) and 0.05001 — a strong psychological round-number level that would be the deeper line of defense on any larger pullback.
Two Ways to Approach the Trade
1. Pullback entry into support (favored, trend-aligned): Waiting for a retest of the 0.0593–0.0612 zone — where the 0.382 retracement and the rising trendline converge — offers a cleaner entry than chasing the current range.
Entry zone: 0.0593 – 0.0612Stop-loss: below 0.0571 (below the 0.5 retracement)Target 1: 0.0625Target 2: 0.0662 (top of the supply zone)
2. Breakout continuation (momentum play): A confirmed close above 0.0662 with rising volume would confirm the range has resolved higher and open the door to a fresh push beyond the recent highs.
Entry trigger: sustained close above 0.0662Stop-loss: 0.0612 (back inside the prior range)Target 1: 0.0710 (measured extension)Target 2: extending further on continued strength, trailing the stop as new highs form
Given the pattern of higher highs and higher lows since the September 5 bottom, and RSI holding above neutral through the recent pullback, this setup favors continuation over reversal — but 0.0662 is the level that needs to give way before calling this a confirmed breakout rather than a range-bound consolidation.
Next Gainer?
CATI's recovery off the 0.04846 low stands out for its structure: two consecutive higher highs, a defended higher low, and a trendline that keeps getting bought on every retest. That's a cleaner uptrend pattern than a lot of charts showing up right now. If price holds above 0.0593 and clears 0.0662 with volume, CATI has a legitimate case to be one of the stronger short-term movers on the board. The main risk is that the token remains well below its September 3 high and has already failed once near the top of this range, so a rejection at 0.0662 would put it back into consolidation rather than a clean breakout.
This is not financial advice. Crypto perpetual contracts are highly leveraged, highly volatile instruments, and prices can move sharply against a position in minutes. Always do your own research, size positions responsibly, and use stop-losses before entering any trade.
@Binance Square Official #CPIWatch #BitcoinReboundsAbove$79KAfterCPI #BNBTops730USDT #Binance #ChartSniper
1
127
·
--

Article
NOT/USDT Coils at a Crossroads — Which Way Does Notcoin Break?$NOT
{future}(NOTUSDT)
1H Chart | Binance Spot | NOTUSDT | September 11, 2026
Notcoin (NOT) is trading at 0.000431, up a modest +0.70% on the day after opening at 0.000428 and ranging between 0.000428 and 0.000432. Unlike the sharp, decisive moves showing up elsewhere on the board right now, NOT's chart tells a story of indecision — a token caught between a broken uptrend and a support shelf that has held for over a week, with price compressing into a tighter and tighter range as it approaches a clear decision point.
Reading the Structure
The larger picture starts with a sharp spike into a higher high near 0.000523 on September 1, followed by an equally sharp collapse into a lower low around 0.000419 just a day later — a classic blow-off top and flush. From that low, NOT spent the better part of a week grinding higher in a choppy but generally constructive recovery, building a lower high near 0.000462 on September 3-4, consolidating, and eventually pushing up to a swing high near 0.000489 by September 8 — the anchor for the 1.0 Fibonacci level on the current chart.
That September 8 high is where the tone shifted. Instead of continuing higher, NOT rolled over hard, breaking down through the entire Fibonacci grid — the 0.786, 0.618, 0.5, 0.382, and 0.236 retracements all in sequence — and pushed into a fresh low near 0.000411 by September 10-11, briefly undercutting the prior 0.000419 support. The bounce off that low was sharp, with price spiking back up to retest the 0.382 retracement (0.000446), but that retest was rejected, and NOT has since settled back into the current range around 0.000431.
A descending trendline connecting the September 8 high to the recent failed retest is still intact and currently caps price from above, while the horizontal band between 0.000419 and 0.000436 (the 0 and 0.236 retracement levels) is acting as the immediate support shelf below. RSI (14) is sitting almost exactly at neutral — 51.88, signal at 49.93 — after recovering from an oversold dip near 40, which is consistent with a market that has stabilized but hasn't committed to a direction yet.
Key Levels to Watch
Immediate resistance: 0.000446 — the 0.382 retracement and the level that rejected the last bounce attempt; this is the first hurdle bulls need to clear.Major resistance: 0.000462 – 0.000489 — the broader supply zone from the prior consolidation and swing high; a break above 0.000489 would be needed to fully invalidate the current downtrend.Descending trendline: currently capping price from above, tracking down from the 0.000489 high through the recent rejection point.Immediate support: 0.000419 – 0.000436 — the horizontal band that has held on multiple tests since early September.Major support / invalidation: 0.000411 — the most recent swing low; a clean break below this with volume opens the door to a deeper leg down with no clear structure until much lower prices.
Two Ways to Approach the Trade
1. Range support long (favored while inside the current band): As long as price holds the 0.000419–0.000436 shelf, buying near support with a tight stop offers a defined-risk way to play a continued range or a breakout attempt.
Entry zone: 0.000419 – 0.000428Stop-loss: below 0.000411 (below the recent swing low)Target 1: 0.000446Target 2: 0.000462, only on a clean break of the descending trendline
2. Breakdown short (if support fails): A confirmed close below 0.000419 would suggest the recovery attempt has failed and sellers are back in control, reopening the path toward the prior 0.000411 low and potentially lower.
Entry trigger: sustained close below 0.000419Stop-loss: 0.000436 (back above the broken support shelf)Target 1: 0.000411Target 2: a further extension toward the 0 Fibonacci origin if 0.000411 fails to hold
Given that price is currently compressed between well-defined support and a still-intact descending trendline, this is a setup better suited to waiting for a clear break in either direction rather than forcing an entry in the middle of the range.
Next Gainer?
Unlike some of the sharper reversal patterns showing up elsewhere right now, NOT's chart looks more like a market catching its breath than one building toward a clean breakout. The rejection at the 0.382 retracement and the still-descending trendline both favor caution on the long side until 0.000446 is reclaimed with conviction. If that level breaks and the trendline gives way, NOT could squeeze back toward the 0.000462–0.000489 zone quickly given how compressed the range has become — but as things stand, this is a "wait for the break" chart rather than an immediate momentum play.
This is not financial advice. Crypto perpetual and spot markets are highly volatile, and prices can move sharply in either direction in minutes. Always do your own research, size positions responsibly, and use stop-losses before entering any trade.
@Binance_Square_Official #CPIWatch #BitcoinReboundsAbove$79KAfterCPI #BNBTops730USDT #Binance #ChartSniper
NOT/USDT Coils at a Crossroads — Which Way Does Notcoin Break?
$NOT
1H Chart | Binance Spot | NOTUSDT | September 11, 2026
Notcoin (NOT) is trading at 0.000431, up a modest +0.70% on the day after opening at 0.000428 and ranging between 0.000428 and 0.000432. Unlike the sharp, decisive moves showing up elsewhere on the board right now, NOT's chart tells a story of indecision — a token caught between a broken uptrend and a support shelf that has held for over a week, with price compressing into a tighter and tighter range as it approaches a clear decision point.
Reading the Structure
The larger picture starts with a sharp spike into a higher high near 0.000523 on September 1, followed by an equally sharp collapse into a lower low around 0.000419 just a day later — a classic blow-off top and flush. From that low, NOT spent the better part of a week grinding higher in a choppy but generally constructive recovery, building a lower high near 0.000462 on September 3-4, consolidating, and eventually pushing up to a swing high near 0.000489 by September 8 — the anchor for the 1.0 Fibonacci level on the current chart.
That September 8 high is where the tone shifted. Instead of continuing higher, NOT rolled over hard, breaking down through the entire Fibonacci grid — the 0.786, 0.618, 0.5, 0.382, and 0.236 retracements all in sequence — and pushed into a fresh low near 0.000411 by September 10-11, briefly undercutting the prior 0.000419 support. The bounce off that low was sharp, with price spiking back up to retest the 0.382 retracement (0.000446), but that retest was rejected, and NOT has since settled back into the current range around 0.000431.
A descending trendline connecting the September 8 high to the recent failed retest is still intact and currently caps price from above, while the horizontal band between 0.000419 and 0.000436 (the 0 and 0.236 retracement levels) is acting as the immediate support shelf below. RSI (14) is sitting almost exactly at neutral — 51.88, signal at 49.93 — after recovering from an oversold dip near 40, which is consistent with a market that has stabilized but hasn't committed to a direction yet.
Key Levels to Watch
Immediate resistance: 0.000446 — the 0.382 retracement and the level that rejected the last bounce attempt; this is the first hurdle bulls need to clear.Major resistance: 0.000462 – 0.000489 — the broader supply zone from the prior consolidation and swing high; a break above 0.000489 would be needed to fully invalidate the current downtrend.Descending trendline: currently capping price from above, tracking down from the 0.000489 high through the recent rejection point.Immediate support: 0.000419 – 0.000436 — the horizontal band that has held on multiple tests since early September.Major support / invalidation: 0.000411 — the most recent swing low; a clean break below this with volume opens the door to a deeper leg down with no clear structure until much lower prices.
Two Ways to Approach the Trade
1. Range support long (favored while inside the current band): As long as price holds the 0.000419–0.000436 shelf, buying near support with a tight stop offers a defined-risk way to play a continued range or a breakout attempt.
Entry zone: 0.000419 – 0.000428Stop-loss: below 0.000411 (below the recent swing low)Target 1: 0.000446Target 2: 0.000462, only on a clean break of the descending trendline
2. Breakdown short (if support fails): A confirmed close below 0.000419 would suggest the recovery attempt has failed and sellers are back in control, reopening the path toward the prior 0.000411 low and potentially lower.
Entry trigger: sustained close below 0.000419Stop-loss: 0.000436 (back above the broken support shelf)Target 1: 0.000411Target 2: a further extension toward the 0 Fibonacci origin if 0.000411 fails to hold
Given that price is currently compressed between well-defined support and a still-intact descending trendline, this is a setup better suited to waiting for a clear break in either direction rather than forcing an entry in the middle of the range.
Next Gainer?
Unlike some of the sharper reversal patterns showing up elsewhere right now, NOT's chart looks more like a market catching its breath than one building toward a clean breakout. The rejection at the 0.382 retracement and the still-descending trendline both favor caution on the long side until 0.000446 is reclaimed with conviction. If that level breaks and the trendline gives way, NOT could squeeze back toward the 0.000462–0.000489 zone quickly given how compressed the range has become — but as things stand, this is a "wait for the break" chart rather than an immediate momentum play.
This is not financial advice. Crypto perpetual and spot markets are highly volatile, and prices can move sharply in either direction in minutes. Always do your own research, size positions responsibly, and use stop-losses before entering any trade.
@Binance Square Official #CPIWatch #BitcoinReboundsAbove$79KAfterCPI #BNBTops730USDT #Binance #ChartSniper
1H Chart | Binance Spot | NOTUSDT | September 11, 2026
Notcoin (NOT) is trading at 0.000431, up a modest +0.70% on the day after opening at 0.000428 and ranging between 0.000428 and 0.000432. Unlike the sharp, decisive moves showing up elsewhere on the board right now, NOT's chart tells a story of indecision — a token caught between a broken uptrend and a support shelf that has held for over a week, with price compressing into a tighter and tighter range as it approaches a clear decision point.
Reading the Structure
The larger picture starts with a sharp spike into a higher high near 0.000523 on September 1, followed by an equally sharp collapse into a lower low around 0.000419 just a day later — a classic blow-off top and flush. From that low, NOT spent the better part of a week grinding higher in a choppy but generally constructive recovery, building a lower high near 0.000462 on September 3-4, consolidating, and eventually pushing up to a swing high near 0.000489 by September 8 — the anchor for the 1.0 Fibonacci level on the current chart.
That September 8 high is where the tone shifted. Instead of continuing higher, NOT rolled over hard, breaking down through the entire Fibonacci grid — the 0.786, 0.618, 0.5, 0.382, and 0.236 retracements all in sequence — and pushed into a fresh low near 0.000411 by September 10-11, briefly undercutting the prior 0.000419 support. The bounce off that low was sharp, with price spiking back up to retest the 0.382 retracement (0.000446), but that retest was rejected, and NOT has since settled back into the current range around 0.000431.
A descending trendline connecting the September 8 high to the recent failed retest is still intact and currently caps price from above, while the horizontal band between 0.000419 and 0.000436 (the 0 and 0.236 retracement levels) is acting as the immediate support shelf below. RSI (14) is sitting almost exactly at neutral — 51.88, signal at 49.93 — after recovering from an oversold dip near 40, which is consistent with a market that has stabilized but hasn't committed to a direction yet.
Key Levels to Watch
Immediate resistance: 0.000446 — the 0.382 retracement and the level that rejected the last bounce attempt; this is the first hurdle bulls need to clear.Major resistance: 0.000462 – 0.000489 — the broader supply zone from the prior consolidation and swing high; a break above 0.000489 would be needed to fully invalidate the current downtrend.Descending trendline: currently capping price from above, tracking down from the 0.000489 high through the recent rejection point.Immediate support: 0.000419 – 0.000436 — the horizontal band that has held on multiple tests since early September.Major support / invalidation: 0.000411 — the most recent swing low; a clean break below this with volume opens the door to a deeper leg down with no clear structure until much lower prices.
Two Ways to Approach the Trade
1. Range support long (favored while inside the current band): As long as price holds the 0.000419–0.000436 shelf, buying near support with a tight stop offers a defined-risk way to play a continued range or a breakout attempt.
Entry zone: 0.000419 – 0.000428Stop-loss: below 0.000411 (below the recent swing low)Target 1: 0.000446Target 2: 0.000462, only on a clean break of the descending trendline
2. Breakdown short (if support fails): A confirmed close below 0.000419 would suggest the recovery attempt has failed and sellers are back in control, reopening the path toward the prior 0.000411 low and potentially lower.
Entry trigger: sustained close below 0.000419Stop-loss: 0.000436 (back above the broken support shelf)Target 1: 0.000411Target 2: a further extension toward the 0 Fibonacci origin if 0.000411 fails to hold
Given that price is currently compressed between well-defined support and a still-intact descending trendline, this is a setup better suited to waiting for a clear break in either direction rather than forcing an entry in the middle of the range.
Next Gainer?
Unlike some of the sharper reversal patterns showing up elsewhere right now, NOT's chart looks more like a market catching its breath than one building toward a clean breakout. The rejection at the 0.382 retracement and the still-descending trendline both favor caution on the long side until 0.000446 is reclaimed with conviction. If that level breaks and the trendline gives way, NOT could squeeze back toward the 0.000462–0.000489 zone quickly given how compressed the range has become — but as things stand, this is a "wait for the break" chart rather than an immediate momentum play.
This is not financial advice. Crypto perpetual and spot markets are highly volatile, and prices can move sharply in either direction in minutes. Always do your own research, size positions responsibly, and use stop-losses before entering any trade.
@Binance Square Official #CPIWatch #BitcoinReboundsAbove$79KAfterCPI #BNBTops730USDT #Binance #ChartSniper
138
·
--

Article
THETA/USDT Explodes Off the Lows — Is a New Uptrend Just Getting Started?$THETA
{future}(THETAUSDT)
1H Chart | Binance Perpetual | THETAUSDT | September 11, 2026
Theta Token is trading at 0.1906, up +1.06% on the day after opening at 0.1886 and swinging between a low of 0.1884 and a high of 0.1914. The daily candle looks unremarkable on its own, but it's sitting on top of one of the sharpest impulsive moves THETA has made in weeks — a rally that took price from a fresh low near 0.1685 to a higher high above 0.2073 in a matter of hours, before cooling into a healthy retracement that's now setting up the next decision point.
Reading the Structure
The setup starts with a clear lower-high, lower-low decline: THETA topped out near 0.1958 on September 7, then spent the following days grinding lower through a series of declining swings, eventually flushing down to a fresh low around 0.1685 on September 10-11. That low marks the anchor of the Fibonacci retracement now drawn on the chart.
From that low, THETA didn't just bounce — it ripped. Price broke the descending structure entirely, tore through the 0.236, 0.382, 0.5, 0.618, and 0.786 retracement levels in a single push, and printed a higher high above 0.2073 (the 1.0 Fib extension), briefly tagging the psychological 0.2047 resistance zone in the process. That's a five-level reclaim in one impulsive candle sequence — a strong signal of aggressive buying, not a weak short-covering bounce.
Since that spike, price has pulled back to 0.1906, landing almost exactly between the 0.5 (0.1879) and 0.618 (0.1925) retracement levels — a textbook healthy pullback zone after a strong impulse leg. The rising white trendline connecting the 0.1685 low to the more recent higher low is still intact and currently tracks just under current price, reinforcing that buyers are stepping in on dips rather than letting the move fully unwind.
RSI (14) tells the same story: it spiked to nearly 75 during the impulsive rally, has since cooled to 69.60 (signal at 55.44), and is holding well above the neutral 50 line — momentum has eased but hasn't broken down, which is consistent with a pause inside an uptrend rather than a reversal.
Key Levels to Watch
Major resistance: 0.2047–0.2073 — the prior swing high and the 1.0 Fibonacci extension; this zone capped the initial rally and needs to break with volume for the next leg to extend.Extended target: 0.2313 — the 1.618 Fibonacci extension, the next logical objective if 0.2073 clears cleanly.Immediate support: 0.1879 – 0.1925 — the 0.5–0.618 retracement band that price is currently consolidating inside.Trendline support: the rising white trendline from the 0.1685 low, currently tracking near 0.1870–0.1890 and rising.Major support / invalidation: 0.1834 — the 0.382 retracement; a clean break and close below this level would suggest the pullback is turning into a deeper correction, with 0.1685 as the next real support beneath it.
Two Ways to Approach the Trade
1. Pullback entry inside the retracement zone (favored, trend-aligned): Buying the current consolidation between the 0.5 and 0.618 retracement levels offers a reasonable entry with a defined invalidation just below the rising trendline.
Entry zone: 0.1879 – 0.1925Stop-loss: below 0.1834 (below the 0.382 retracement and trendline)Target 1: 0.2047Target 2: 0.2073, extending toward 0.2313 on continuation
2. Breakout continuation (momentum play): For traders who want confirmation before entering, a sustained close above 0.2047 with rising volume would confirm buyers are ready to challenge the prior high directly.
Entry trigger: sustained close above 0.2047Stop-loss: 0.1925 (below the 0.618 retracement)Target 1: 0.2073Target 2: 0.2313 (1.618 extension)
Given how cleanly the initial impulse reclaimed the entire Fibonacci grid and how well the pullback has respected the rising trendline so far, the structure favors continuation over reversal — but 0.2047–0.2073 remains the level that decides whether this becomes a genuine new leg higher or another failed test of the range top.
Next Gainer?
THETA's move off the 0.1685 low stands out for its speed and conviction — a full retracement reclaim followed by a controlled pullback that's holding above the midpoint of the rally is a constructive pattern, not an exhausted one. If price holds above 0.1879 and clears 0.2047 with volume, THETA has a credible path toward the 1.618 extension near 0.2313, which would put it among the stronger short-term performers on the board. The key risk is a failure to hold trendline support, which would open a deeper retest of 0.1685 before any further upside attempt.
This is not financial advice. Crypto perpetual contracts are highly leveraged, highly volatile instruments, and prices can move sharply against a position in minutes. Always do your own research, size positions responsibly, and use stop-losses before entering any trade.
@Binance_Square_Official #CPIWatch #BitcoinReboundsAbove$79KAfterCPI #BNBTops730USDT #Binance #ChartSniper
THETA/USDT Explodes Off the Lows — Is a New Uptrend Just Getting Started?
$THETA
1H Chart | Binance Perpetual | THETAUSDT | September 11, 2026
Theta Token is trading at 0.1906, up +1.06% on the day after opening at 0.1886 and swinging between a low of 0.1884 and a high of 0.1914. The daily candle looks unremarkable on its own, but it's sitting on top of one of the sharpest impulsive moves THETA has made in weeks — a rally that took price from a fresh low near 0.1685 to a higher high above 0.2073 in a matter of hours, before cooling into a healthy retracement that's now setting up the next decision point.
Reading the Structure
The setup starts with a clear lower-high, lower-low decline: THETA topped out near 0.1958 on September 7, then spent the following days grinding lower through a series of declining swings, eventually flushing down to a fresh low around 0.1685 on September 10-11. That low marks the anchor of the Fibonacci retracement now drawn on the chart.
From that low, THETA didn't just bounce — it ripped. Price broke the descending structure entirely, tore through the 0.236, 0.382, 0.5, 0.618, and 0.786 retracement levels in a single push, and printed a higher high above 0.2073 (the 1.0 Fib extension), briefly tagging the psychological 0.2047 resistance zone in the process. That's a five-level reclaim in one impulsive candle sequence — a strong signal of aggressive buying, not a weak short-covering bounce.
Since that spike, price has pulled back to 0.1906, landing almost exactly between the 0.5 (0.1879) and 0.618 (0.1925) retracement levels — a textbook healthy pullback zone after a strong impulse leg. The rising white trendline connecting the 0.1685 low to the more recent higher low is still intact and currently tracks just under current price, reinforcing that buyers are stepping in on dips rather than letting the move fully unwind.
RSI (14) tells the same story: it spiked to nearly 75 during the impulsive rally, has since cooled to 69.60 (signal at 55.44), and is holding well above the neutral 50 line — momentum has eased but hasn't broken down, which is consistent with a pause inside an uptrend rather than a reversal.
Key Levels to Watch
Major resistance: 0.2047–0.2073 — the prior swing high and the 1.0 Fibonacci extension; this zone capped the initial rally and needs to break with volume for the next leg to extend.Extended target: 0.2313 — the 1.618 Fibonacci extension, the next logical objective if 0.2073 clears cleanly.Immediate support: 0.1879 – 0.1925 — the 0.5–0.618 retracement band that price is currently consolidating inside.Trendline support: the rising white trendline from the 0.1685 low, currently tracking near 0.1870–0.1890 and rising.Major support / invalidation: 0.1834 — the 0.382 retracement; a clean break and close below this level would suggest the pullback is turning into a deeper correction, with 0.1685 as the next real support beneath it.
Two Ways to Approach the Trade
1. Pullback entry inside the retracement zone (favored, trend-aligned): Buying the current consolidation between the 0.5 and 0.618 retracement levels offers a reasonable entry with a defined invalidation just below the rising trendline.
Entry zone: 0.1879 – 0.1925Stop-loss: below 0.1834 (below the 0.382 retracement and trendline)Target 1: 0.2047Target 2: 0.2073, extending toward 0.2313 on continuation
2. Breakout continuation (momentum play): For traders who want confirmation before entering, a sustained close above 0.2047 with rising volume would confirm buyers are ready to challenge the prior high directly.
Entry trigger: sustained close above 0.2047Stop-loss: 0.1925 (below the 0.618 retracement)Target 1: 0.2073Target 2: 0.2313 (1.618 extension)
Given how cleanly the initial impulse reclaimed the entire Fibonacci grid and how well the pullback has respected the rising trendline so far, the structure favors continuation over reversal — but 0.2047–0.2073 remains the level that decides whether this becomes a genuine new leg higher or another failed test of the range top.
Next Gainer?
THETA's move off the 0.1685 low stands out for its speed and conviction — a full retracement reclaim followed by a controlled pullback that's holding above the midpoint of the rally is a constructive pattern, not an exhausted one. If price holds above 0.1879 and clears 0.2047 with volume, THETA has a credible path toward the 1.618 extension near 0.2313, which would put it among the stronger short-term performers on the board. The key risk is a failure to hold trendline support, which would open a deeper retest of 0.1685 before any further upside attempt.
This is not financial advice. Crypto perpetual contracts are highly leveraged, highly volatile instruments, and prices can move sharply against a position in minutes. Always do your own research, size positions responsibly, and use stop-losses before entering any trade.
@Binance Square Official #CPIWatch #BitcoinReboundsAbove$79KAfterCPI #BNBTops730USDT #Binance #ChartSniper
1H Chart | Binance Perpetual | THETAUSDT | September 11, 2026
Theta Token is trading at 0.1906, up +1.06% on the day after opening at 0.1886 and swinging between a low of 0.1884 and a high of 0.1914. The daily candle looks unremarkable on its own, but it's sitting on top of one of the sharpest impulsive moves THETA has made in weeks — a rally that took price from a fresh low near 0.1685 to a higher high above 0.2073 in a matter of hours, before cooling into a healthy retracement that's now setting up the next decision point.
Reading the Structure
The setup starts with a clear lower-high, lower-low decline: THETA topped out near 0.1958 on September 7, then spent the following days grinding lower through a series of declining swings, eventually flushing down to a fresh low around 0.1685 on September 10-11. That low marks the anchor of the Fibonacci retracement now drawn on the chart.
From that low, THETA didn't just bounce — it ripped. Price broke the descending structure entirely, tore through the 0.236, 0.382, 0.5, 0.618, and 0.786 retracement levels in a single push, and printed a higher high above 0.2073 (the 1.0 Fib extension), briefly tagging the psychological 0.2047 resistance zone in the process. That's a five-level reclaim in one impulsive candle sequence — a strong signal of aggressive buying, not a weak short-covering bounce.
Since that spike, price has pulled back to 0.1906, landing almost exactly between the 0.5 (0.1879) and 0.618 (0.1925) retracement levels — a textbook healthy pullback zone after a strong impulse leg. The rising white trendline connecting the 0.1685 low to the more recent higher low is still intact and currently tracks just under current price, reinforcing that buyers are stepping in on dips rather than letting the move fully unwind.
RSI (14) tells the same story: it spiked to nearly 75 during the impulsive rally, has since cooled to 69.60 (signal at 55.44), and is holding well above the neutral 50 line — momentum has eased but hasn't broken down, which is consistent with a pause inside an uptrend rather than a reversal.
Key Levels to Watch
Major resistance: 0.2047–0.2073 — the prior swing high and the 1.0 Fibonacci extension; this zone capped the initial rally and needs to break with volume for the next leg to extend.Extended target: 0.2313 — the 1.618 Fibonacci extension, the next logical objective if 0.2073 clears cleanly.Immediate support: 0.1879 – 0.1925 — the 0.5–0.618 retracement band that price is currently consolidating inside.Trendline support: the rising white trendline from the 0.1685 low, currently tracking near 0.1870–0.1890 and rising.Major support / invalidation: 0.1834 — the 0.382 retracement; a clean break and close below this level would suggest the pullback is turning into a deeper correction, with 0.1685 as the next real support beneath it.
Two Ways to Approach the Trade
1. Pullback entry inside the retracement zone (favored, trend-aligned): Buying the current consolidation between the 0.5 and 0.618 retracement levels offers a reasonable entry with a defined invalidation just below the rising trendline.
Entry zone: 0.1879 – 0.1925Stop-loss: below 0.1834 (below the 0.382 retracement and trendline)Target 1: 0.2047Target 2: 0.2073, extending toward 0.2313 on continuation
2. Breakout continuation (momentum play): For traders who want confirmation before entering, a sustained close above 0.2047 with rising volume would confirm buyers are ready to challenge the prior high directly.
Entry trigger: sustained close above 0.2047Stop-loss: 0.1925 (below the 0.618 retracement)Target 1: 0.2073Target 2: 0.2313 (1.618 extension)
Given how cleanly the initial impulse reclaimed the entire Fibonacci grid and how well the pullback has respected the rising trendline so far, the structure favors continuation over reversal — but 0.2047–0.2073 remains the level that decides whether this becomes a genuine new leg higher or another failed test of the range top.
Next Gainer?
THETA's move off the 0.1685 low stands out for its speed and conviction — a full retracement reclaim followed by a controlled pullback that's holding above the midpoint of the rally is a constructive pattern, not an exhausted one. If price holds above 0.1879 and clears 0.2047 with volume, THETA has a credible path toward the 1.618 extension near 0.2313, which would put it among the stronger short-term performers on the board. The key risk is a failure to hold trendline support, which would open a deeper retest of 0.1685 before any further upside attempt.
This is not financial advice. Crypto perpetual contracts are highly leveraged, highly volatile instruments, and prices can move sharply against a position in minutes. Always do your own research, size positions responsibly, and use stop-losses before entering any trade.
@Binance Square Official #CPIWatch #BitcoinReboundsAbove$79KAfterCPI #BNBTops730USDT #Binance #ChartSniper
70
·
--

Article
AT/USDT Reclaims Every Level It Lost — Has the Trend Just Flipped?$AT
{future}(ATUSDT)
1H Chart | Binance Perpetual | ATUSDT | September 11, 2026
AT is trading at 0.1529, up +0.53% on the session after printing a high of 0.1536 and a low of 0.1519. That modest daily number undersells what just happened on the chart: over the past 24 hours, AT staged one of the sharpest reversals of its recent range, ripping straight through a cluster of prior resistance levels that had capped every rally since the September 7 high. This is the kind of move that turns a "watch and wait" chart into an active setup.
Reading the Structure
The broader picture starts with a clean impulsive rally into a higher high near 0.1574 on September 7 — the top of the current Fibonacci retracement drawn on the chart. From there, AT rolled over hard, tagging a lower low around 0.1508 before a weak bounce failed to reclaim the 0.236 retracement level (0.1520) and rolled into a much deeper slide.
That slide didn't stop until price carved a higher-low / lower-low sequence all the way down to the 1.0 retracement at 0.1343 on September 10 — a 50%+ drawdown from the September 7 peak. Along the way, AT built a clear descending staircase: a lower high near 0.1435, a higher low near 0.1403, and a final flush into the 0.1343 low that swept the prior demand zone.
What happened next is the important part. From that 0.1343 low, AT didn't just bounce — it reclaimed every broken level in sequence: back through the 0.786 (0.1393), the 0.618 (0.1431), the 0.5 (0.1459), and the 0.382 (0.1466) retracements in a single strong impulse, before breaking above the prior lower-high structure and printing a fresh higher high near 0.1541. That's a full structural shift — the market has gone from making lower highs and lower lows to making a higher high above the most recent swing structure, which is the first technical definition of a trend reversal.
Price has since pulled back modestly to 0.1529, sitting just above the 0.1487 level that capped the most recent bounce candle, and is now consolidating in the gray supply zone between roughly 0.1430 and 0.1460 acting as fresh support beneath it.
Key Levels to Watch
Major resistance: 0.1574 — the September 7 swing high and the top of the entire measured range. This is the level that decides whether AT is in full reversal mode or just a strong relief rally inside a larger downtrend.Immediate resistance: 0.1541 — the most recent higher high; a breakout above this on strong volume targets the 0.1574 high directly.Immediate support: 0.1487 — the recent breakout candle's base; holding above this keeps the short-term structure bullish.Major support: 0.1430 – 0.1460 — the broad gray zone that previously acted as resistance during the decline and should now act as the first real demand shelf on any deeper pullback.Invalidation zone: a close back below 0.1393 (the 0.786 retracement) would undo the reversal thesis and put the 0.1343 low back in play.
Two Ways to Approach the Trade
1. Pullback entry into support (favored, lower risk): Rather than chasing the current bounce, waiting for a retest of the 0.1460–0.1487 zone offers a cleaner risk/reward, using the reclaimed zone as confirmation that old resistance is now support.
Entry zone: 0.1460 – 0.1487Stop-loss: below 0.1430 (below the broader support shelf)Target 1: 0.1541Target 2: 0.1574 (major resistance / range high)
2. Breakout continuation (momentum play): For traders who want to ride the strength directly, a confirmed close above 0.1541 with rising volume adds weight to a continuation toward the range high.
Entry trigger: sustained close above 0.1541Stop-loss: 0.1487 (back below the recent breakout base)Target 1: 0.1574Target 2: a measured extension beyond the range high if 0.1574 breaks with strength
Given how fast and clean the reclaim of the entire Fibonacci grid was, this setup carries real momentum behind it — but AT is still trading inside a wide 0.1343–0.1574 range overall, so treat 0.1574 as the level that needs to break before calling this a confirmed trend change rather than a strong bounce.
Next Gainer?
The structural shift here is one of the cleaner reversal patterns on the board right now — a full higher-high breakout after reclaiming five consecutive Fibonacci levels in one move is not a typical dead-cat bounce. If AT holds above 0.1487 and takes out 0.1541 with volume, it has a legitimate path to test — and potentially clear — the 0.1574 range high, which would put it firmly on the radar as one of the stronger short-term setups among mid-cap perpetuals. The main risk is that the range top has already rejected price once before; a failure there would put AT back into consolidation rather than a clean breakout.
This is not financial advice. Crypto perpetual contracts are highly leveraged, highly volatile instruments, and prices can move sharply against a position in minutes. Always do your own research, size positions responsibly, and use stop-losses before entering any trade.
@Binance_Square_Official #CPIWatch #BitcoinReboundsAbove$79KAfterCPI #BNBTops730USDT #Binance #ChartSniper
Content
AT/USDT Reclaims Every Level It Lost — Has the Trend Just Flipped?
$AT
1H Chart | Binance Perpetual | ATUSDT | September 11, 2026
AT is trading at 0.1529, up +0.53% on the session after printing a high of 0.1536 and a low of 0.1519. That modest daily number undersells what just happened on the chart: over the past 24 hours, AT staged one of the sharpest reversals of its recent range, ripping straight through a cluster of prior resistance levels that had capped every rally since the September 7 high. This is the kind of move that turns a "watch and wait" chart into an active setup.
Reading the Structure
The broader picture starts with a clean impulsive rally into a higher high near 0.1574 on September 7 — the top of the current Fibonacci retracement drawn on the chart. From there, AT rolled over hard, tagging a lower low around 0.1508 before a weak bounce failed to reclaim the 0.236 retracement level (0.1520) and rolled into a much deeper slide.
That slide didn't stop until price carved a higher-low / lower-low sequence all the way down to the 1.0 retracement at 0.1343 on September 10 — a 50%+ drawdown from the September 7 peak. Along the way, AT built a clear descending staircase: a lower high near 0.1435, a higher low near 0.1403, and a final flush into the 0.1343 low that swept the prior demand zone.
What happened next is the important part. From that 0.1343 low, AT didn't just bounce — it reclaimed every broken level in sequence: back through the 0.786 (0.1393), the 0.618 (0.1431), the 0.5 (0.1459), and the 0.382 (0.1466) retracements in a single strong impulse, before breaking above the prior lower-high structure and printing a fresh higher high near 0.1541. That's a full structural shift — the market has gone from making lower highs and lower lows to making a higher high above the most recent swing structure, which is the first technical definition of a trend reversal.
Price has since pulled back modestly to 0.1529, sitting just above the 0.1487 level that capped the most recent bounce candle, and is now consolidating in the gray supply zone between roughly 0.1430 and 0.1460 acting as fresh support beneath it.
Key Levels to Watch
Major resistance: 0.1574 — the September 7 swing high and the top of the entire measured range. This is the level that decides whether AT is in full reversal mode or just a strong relief rally inside a larger downtrend.Immediate resistance: 0.1541 — the most recent higher high; a breakout above this on strong volume targets the 0.1574 high directly.Immediate support: 0.1487 — the recent breakout candle's base; holding above this keeps the short-term structure bullish.Major support: 0.1430 – 0.1460 — the broad gray zone that previously acted as resistance during the decline and should now act as the first real demand shelf on any deeper pullback.Invalidation zone: a close back below 0.1393 (the 0.786 retracement) would undo the reversal thesis and put the 0.1343 low back in play.
Two Ways to Approach the Trade
1. Pullback entry into support (favored, lower risk): Rather than chasing the current bounce, waiting for a retest of the 0.1460–0.1487 zone offers a cleaner risk/reward, using the reclaimed zone as confirmation that old resistance is now support.
Entry zone: 0.1460 – 0.1487Stop-loss: below 0.1430 (below the broader support shelf)Target 1: 0.1541Target 2: 0.1574 (major resistance / range high)
2. Breakout continuation (momentum play): For traders who want to ride the strength directly, a confirmed close above 0.1541 with rising volume adds weight to a continuation toward the range high.
Entry trigger: sustained close above 0.1541Stop-loss: 0.1487 (back below the recent breakout base)Target 1: 0.1574Target 2: a measured extension beyond the range high if 0.1574 breaks with strength
Given how fast and clean the reclaim of the entire Fibonacci grid was, this setup carries real momentum behind it — but AT is still trading inside a wide 0.1343–0.1574 range overall, so treat 0.1574 as the level that needs to break before calling this a confirmed trend change rather than a strong bounce.
Next Gainer?
The structural shift here is one of the cleaner reversal patterns on the board right now — a full higher-high breakout after reclaiming five consecutive Fibonacci levels in one move is not a typical dead-cat bounce. If AT holds above 0.1487 and takes out 0.1541 with volume, it has a legitimate path to test — and potentially clear — the 0.1574 range high, which would put it firmly on the radar as one of the stronger short-term setups among mid-cap perpetuals. The main risk is that the range top has already rejected price once before; a failure there would put AT back into consolidation rather than a clean breakout.
This is not financial advice. Crypto perpetual contracts are highly leveraged, highly volatile instruments, and prices can move sharply against a position in minutes. Always do your own research, size positions responsibly, and use stop-losses before entering any trade.
@Binance Square Official #CPIWatch #BitcoinReboundsAbove$79KAfterCPI #BNBTops730USDT #Binance #ChartSniper
Content
1H Chart | Binance Perpetual | ATUSDT | September 11, 2026
AT is trading at 0.1529, up +0.53% on the session after printing a high of 0.1536 and a low of 0.1519. That modest daily number undersells what just happened on the chart: over the past 24 hours, AT staged one of the sharpest reversals of its recent range, ripping straight through a cluster of prior resistance levels that had capped every rally since the September 7 high. This is the kind of move that turns a "watch and wait" chart into an active setup.
Reading the Structure
The broader picture starts with a clean impulsive rally into a higher high near 0.1574 on September 7 — the top of the current Fibonacci retracement drawn on the chart. From there, AT rolled over hard, tagging a lower low around 0.1508 before a weak bounce failed to reclaim the 0.236 retracement level (0.1520) and rolled into a much deeper slide.
That slide didn't stop until price carved a higher-low / lower-low sequence all the way down to the 1.0 retracement at 0.1343 on September 10 — a 50%+ drawdown from the September 7 peak. Along the way, AT built a clear descending staircase: a lower high near 0.1435, a higher low near 0.1403, and a final flush into the 0.1343 low that swept the prior demand zone.
What happened next is the important part. From that 0.1343 low, AT didn't just bounce — it reclaimed every broken level in sequence: back through the 0.786 (0.1393), the 0.618 (0.1431), the 0.5 (0.1459), and the 0.382 (0.1466) retracements in a single strong impulse, before breaking above the prior lower-high structure and printing a fresh higher high near 0.1541. That's a full structural shift — the market has gone from making lower highs and lower lows to making a higher high above the most recent swing structure, which is the first technical definition of a trend reversal.
Price has since pulled back modestly to 0.1529, sitting just above the 0.1487 level that capped the most recent bounce candle, and is now consolidating in the gray supply zone between roughly 0.1430 and 0.1460 acting as fresh support beneath it.
Key Levels to Watch
Major resistance: 0.1574 — the September 7 swing high and the top of the entire measured range. This is the level that decides whether AT is in full reversal mode or just a strong relief rally inside a larger downtrend.Immediate resistance: 0.1541 — the most recent higher high; a breakout above this on strong volume targets the 0.1574 high directly.Immediate support: 0.1487 — the recent breakout candle's base; holding above this keeps the short-term structure bullish.Major support: 0.1430 – 0.1460 — the broad gray zone that previously acted as resistance during the decline and should now act as the first real demand shelf on any deeper pullback.Invalidation zone: a close back below 0.1393 (the 0.786 retracement) would undo the reversal thesis and put the 0.1343 low back in play.
Two Ways to Approach the Trade
1. Pullback entry into support (favored, lower risk): Rather than chasing the current bounce, waiting for a retest of the 0.1460–0.1487 zone offers a cleaner risk/reward, using the reclaimed zone as confirmation that old resistance is now support.
Entry zone: 0.1460 – 0.1487Stop-loss: below 0.1430 (below the broader support shelf)Target 1: 0.1541Target 2: 0.1574 (major resistance / range high)
2. Breakout continuation (momentum play): For traders who want to ride the strength directly, a confirmed close above 0.1541 with rising volume adds weight to a continuation toward the range high.
Entry trigger: sustained close above 0.1541Stop-loss: 0.1487 (back below the recent breakout base)Target 1: 0.1574Target 2: a measured extension beyond the range high if 0.1574 breaks with strength
Given how fast and clean the reclaim of the entire Fibonacci grid was, this setup carries real momentum behind it — but AT is still trading inside a wide 0.1343–0.1574 range overall, so treat 0.1574 as the level that needs to break before calling this a confirmed trend change rather than a strong bounce.
Next Gainer?
The structural shift here is one of the cleaner reversal patterns on the board right now — a full higher-high breakout after reclaiming five consecutive Fibonacci levels in one move is not a typical dead-cat bounce. If AT holds above 0.1487 and takes out 0.1541 with volume, it has a legitimate path to test — and potentially clear — the 0.1574 range high, which would put it firmly on the radar as one of the stronger short-term setups among mid-cap perpetuals. The main risk is that the range top has already rejected price once before; a failure there would put AT back into consolidation rather than a clean breakout.
This is not financial advice. Crypto perpetual contracts are highly leveraged, highly volatile instruments, and prices can move sharply against a position in minutes. Always do your own research, size positions responsibly, and use stop-losses before entering any trade.
@Binance Square Official #CPIWatch #BitcoinReboundsAbove$79KAfterCPI #BNBTops730USDT #Binance #ChartSniper
Content
104
·
--

Article
LIT/USDT Rejected Again — Is the Downtrend Ready for One More Leg Lower?$LIT
{future}(LITUSDT)
15M Chart | Binance Perpetual | LITUSDT | September 11, 2026
Lighter (LIT) is trading at 4.4168 after opening the session at 4.4160 and swinging between a high of 4.4340 and a low of 4.3645 — a quiet, almost flat candle on the surface, but the structure underneath tells a more decisive story. Since putting in a higher high near 5.25 on September 9, LIT has been carving out a textbook descending channel: lower highs, a clean break of the prior range low, and a rejection at a well-defined resistance trendline that has now been tested and denied three separate times.
Reading the Structure
The move started with a strong higher high just above 5.25, followed by an immediate loss of momentum. Price rolled over into a descending trendline that connects that high to two subsequent lower-high rejections — the first near 4.60 and the second, more recent, a failed push into the 4.8361 resistance zone (marked in red) that stalled almost exactly on the trendline itself.
In between those two rejections, sellers drove price into a fresh lower low around 4.30, confirming the broader trend has flipped from consolidation into active downside. The bounce off that low was sharp — LIT rallied hard back up toward 4.83 — but the fact that it topped out precisely on the descending trendline, rather than breaking through it, is the key tell here. That's a lower high forming inside an established downtrend, not a trend reversal.
Since that rejection, price has been sliding back down through the horizontal support/resistance band between 4.45 and 4.65, and now sits right on top of the lower edge of that band at 4.4168. The RSI (14) backs up the weakening picture: it spiked toward 75 during the rally into the LH, and has since rolled over hard to 44.33, slipping back below its signal line and trending toward the 25–50 zone that typically accompanies renewed selling pressure.
Key Levels to Watch
Major resistance / trend cap: 4.8361 — the recent lower-high and the level the descending trendline currently intersects. A close above this with volume is the first sign the downtrend is losing control.Immediate resistance: the upper edge of the current support band near 4.60–4.65.Immediate support: 4.45 — the lower edge of the current consolidation band; this is the level price is testing right now.Major support: 4.30 — the prior lower low; a break below this reopens the downside with no clear structure until much lower prices.Trendline resistance: descending from the 5.25 high, currently tracking down through roughly 4.55–4.60 and falling — as long as price stays under this line, the bias remains bearish.
Two Ways to Approach the Trade
1. Breakdown continuation (aligned with the trend): The dominant structure is still bearish — lower highs, a broken range low, and RSI rolling over from overbought all favor sellers. A confirmed break of the 4.45 support with a 15M close below it would confirm continuation toward the prior low.
Entry trigger: sustained close below 4.4500Stop-loss: 4.6500 (above the recent lower-high shelf and back above the trendline)Target 1: 4.3600Target 2: 4.3000 (prior swing low)
2. Range/bounce trade (counter-trend, higher risk): Aggressive traders may look to fade the lower edge of the current band, since price has held 4.45 on the first test. This is a lower-probability, mean-reversion play against the dominant trend and should be sized accordingly.
Entry zone: 4.4000 – 4.4500 on signs of a reaction (rejection wick, RSI turning up from below 40)Stop-loss: below 4.30 (below the confirmed lower low)Target 1: 4.60Target 2: 4.75, only on a break back above the descending trendline
Given the strength of the rejection at 4.83 and the trendline still sloping down, the breakdown-continuation setup lines up better with the current structure. The counter-trend bounce is a scalp idea for traders comfortable moving against the primary trend, not a swing position.
Bottom Line
LIT's rally attempt was capped almost perfectly by a well-respected descending trendline, and momentum has since faded fast, with RSI back under 45 and price pressing on support. Unless buyers can reclaim 4.65 and close back above the trendline, the path of least resistance stays down toward the 4.30 low and potentially lower. Watch the 4.45 level closely — how it holds over the next few 15-minute candles should decide which side takes control next.
This is not financial advice. Crypto perpetual contracts are highly leveraged, highly volatile instruments, and prices can move sharply against a position in minutes. Always do your own research, size positions responsibly, and use stop-losses before entering any trade.
@Binance_Square_Official #CPIWatch #BitcoinReboundsAbove$79KAfterCPI #BNBTops730USDT #Binance #ChartSniper
Content
LIT/USDT Rejected Again — Is the Downtrend Ready for One More Leg Lower?
$LIT
15M Chart | Binance Perpetual | LITUSDT | September 11, 2026
Lighter (LIT) is trading at 4.4168 after opening the session at 4.4160 and swinging between a high of 4.4340 and a low of 4.3645 — a quiet, almost flat candle on the surface, but the structure underneath tells a more decisive story. Since putting in a higher high near 5.25 on September 9, LIT has been carving out a textbook descending channel: lower highs, a clean break of the prior range low, and a rejection at a well-defined resistance trendline that has now been tested and denied three separate times.
Reading the Structure
The move started with a strong higher high just above 5.25, followed by an immediate loss of momentum. Price rolled over into a descending trendline that connects that high to two subsequent lower-high rejections — the first near 4.60 and the second, more recent, a failed push into the 4.8361 resistance zone (marked in red) that stalled almost exactly on the trendline itself.
In between those two rejections, sellers drove price into a fresh lower low around 4.30, confirming the broader trend has flipped from consolidation into active downside. The bounce off that low was sharp — LIT rallied hard back up toward 4.83 — but the fact that it topped out precisely on the descending trendline, rather than breaking through it, is the key tell here. That's a lower high forming inside an established downtrend, not a trend reversal.
Since that rejection, price has been sliding back down through the horizontal support/resistance band between 4.45 and 4.65, and now sits right on top of the lower edge of that band at 4.4168. The RSI (14) backs up the weakening picture: it spiked toward 75 during the rally into the LH, and has since rolled over hard to 44.33, slipping back below its signal line and trending toward the 25–50 zone that typically accompanies renewed selling pressure.
Key Levels to Watch
Major resistance / trend cap: 4.8361 — the recent lower-high and the level the descending trendline currently intersects. A close above this with volume is the first sign the downtrend is losing control.Immediate resistance: the upper edge of the current support band near 4.60–4.65.Immediate support: 4.45 — the lower edge of the current consolidation band; this is the level price is testing right now.Major support: 4.30 — the prior lower low; a break below this reopens the downside with no clear structure until much lower prices.Trendline resistance: descending from the 5.25 high, currently tracking down through roughly 4.55–4.60 and falling — as long as price stays under this line, the bias remains bearish.
Two Ways to Approach the Trade
1. Breakdown continuation (aligned with the trend): The dominant structure is still bearish — lower highs, a broken range low, and RSI rolling over from overbought all favor sellers. A confirmed break of the 4.45 support with a 15M close below it would confirm continuation toward the prior low.
Entry trigger: sustained close below 4.4500Stop-loss: 4.6500 (above the recent lower-high shelf and back above the trendline)Target 1: 4.3600Target 2: 4.3000 (prior swing low)
2. Range/bounce trade (counter-trend, higher risk): Aggressive traders may look to fade the lower edge of the current band, since price has held 4.45 on the first test. This is a lower-probability, mean-reversion play against the dominant trend and should be sized accordingly.
Entry zone: 4.4000 – 4.4500 on signs of a reaction (rejection wick, RSI turning up from below 40)Stop-loss: below 4.30 (below the confirmed lower low)Target 1: 4.60Target 2: 4.75, only on a break back above the descending trendline
Given the strength of the rejection at 4.83 and the trendline still sloping down, the breakdown-continuation setup lines up better with the current structure. The counter-trend bounce is a scalp idea for traders comfortable moving against the primary trend, not a swing position.
Bottom Line
LIT's rally attempt was capped almost perfectly by a well-respected descending trendline, and momentum has since faded fast, with RSI back under 45 and price pressing on support. Unless buyers can reclaim 4.65 and close back above the trendline, the path of least resistance stays down toward the 4.30 low and potentially lower. Watch the 4.45 level closely — how it holds over the next few 15-minute candles should decide which side takes control next.
This is not financial advice. Crypto perpetual contracts are highly leveraged, highly volatile instruments, and prices can move sharply against a position in minutes. Always do your own research, size positions responsibly, and use stop-losses before entering any trade.
@Binance Square Official #CPIWatch #BitcoinReboundsAbove$79KAfterCPI #BNBTops730USDT #Binance #ChartSniper
Content
15M Chart | Binance Perpetual | LITUSDT | September 11, 2026
Lighter (LIT) is trading at 4.4168 after opening the session at 4.4160 and swinging between a high of 4.4340 and a low of 4.3645 — a quiet, almost flat candle on the surface, but the structure underneath tells a more decisive story. Since putting in a higher high near 5.25 on September 9, LIT has been carving out a textbook descending channel: lower highs, a clean break of the prior range low, and a rejection at a well-defined resistance trendline that has now been tested and denied three separate times.
Reading the Structure
The move started with a strong higher high just above 5.25, followed by an immediate loss of momentum. Price rolled over into a descending trendline that connects that high to two subsequent lower-high rejections — the first near 4.60 and the second, more recent, a failed push into the 4.8361 resistance zone (marked in red) that stalled almost exactly on the trendline itself.
In between those two rejections, sellers drove price into a fresh lower low around 4.30, confirming the broader trend has flipped from consolidation into active downside. The bounce off that low was sharp — LIT rallied hard back up toward 4.83 — but the fact that it topped out precisely on the descending trendline, rather than breaking through it, is the key tell here. That's a lower high forming inside an established downtrend, not a trend reversal.
Since that rejection, price has been sliding back down through the horizontal support/resistance band between 4.45 and 4.65, and now sits right on top of the lower edge of that band at 4.4168. The RSI (14) backs up the weakening picture: it spiked toward 75 during the rally into the LH, and has since rolled over hard to 44.33, slipping back below its signal line and trending toward the 25–50 zone that typically accompanies renewed selling pressure.
Key Levels to Watch
Major resistance / trend cap: 4.8361 — the recent lower-high and the level the descending trendline currently intersects. A close above this with volume is the first sign the downtrend is losing control.Immediate resistance: the upper edge of the current support band near 4.60–4.65.Immediate support: 4.45 — the lower edge of the current consolidation band; this is the level price is testing right now.Major support: 4.30 — the prior lower low; a break below this reopens the downside with no clear structure until much lower prices.Trendline resistance: descending from the 5.25 high, currently tracking down through roughly 4.55–4.60 and falling — as long as price stays under this line, the bias remains bearish.
Two Ways to Approach the Trade
1. Breakdown continuation (aligned with the trend): The dominant structure is still bearish — lower highs, a broken range low, and RSI rolling over from overbought all favor sellers. A confirmed break of the 4.45 support with a 15M close below it would confirm continuation toward the prior low.
Entry trigger: sustained close below 4.4500Stop-loss: 4.6500 (above the recent lower-high shelf and back above the trendline)Target 1: 4.3600Target 2: 4.3000 (prior swing low)
2. Range/bounce trade (counter-trend, higher risk): Aggressive traders may look to fade the lower edge of the current band, since price has held 4.45 on the first test. This is a lower-probability, mean-reversion play against the dominant trend and should be sized accordingly.
Entry zone: 4.4000 – 4.4500 on signs of a reaction (rejection wick, RSI turning up from below 40)Stop-loss: below 4.30 (below the confirmed lower low)Target 1: 4.60Target 2: 4.75, only on a break back above the descending trendline
Given the strength of the rejection at 4.83 and the trendline still sloping down, the breakdown-continuation setup lines up better with the current structure. The counter-trend bounce is a scalp idea for traders comfortable moving against the primary trend, not a swing position.
Bottom Line
LIT's rally attempt was capped almost perfectly by a well-respected descending trendline, and momentum has since faded fast, with RSI back under 45 and price pressing on support. Unless buyers can reclaim 4.65 and close back above the trendline, the path of least resistance stays down toward the 4.30 low and potentially lower. Watch the 4.45 level closely — how it holds over the next few 15-minute candles should decide which side takes control next.
This is not financial advice. Crypto perpetual contracts are highly leveraged, highly volatile instruments, and prices can move sharply against a position in minutes. Always do your own research, size positions responsibly, and use stop-losses before entering any trade.
@Binance Square Official #CPIWatch #BitcoinReboundsAbove$79KAfterCPI #BNBTops730USDT #Binance #ChartSniper
Content
234
·
--

Article
MMT/USDT: Momentum Lost — The Domino Effect Keeps Toppling Support$MMT
{future}(MMTUSDT)
Asset: MMT/USDT Perpetual | Timeframe: 15M | Exchange: Binance
MMT's chart reads like a cascade of falling dominoes. After consolidating for two days in the 0.1670–0.1710 range (marked by a clear Lower High), sellers took control on September 9–10 and drove price straight through support in one aggressive impulsive leg to a Lower Low near 0.155. Since then, the pair has been grinding lower inside a well-defined descending trendline, finally carving out a Higher Low at 0.1484 before a sharp bounce attempt to 0.1550 — which was immediately rejected right back into the trendline. Price now sits at 0.1508, down 0.79% on the session, and still trapped beneath that falling resistance line.
What the structure is saying
This is a textbook downtrend: Lower High, Lower Low, Higher Low, and every rally so far has been sold into the descending trendline rather than breaking above it. The 0.1484 level (marked in green) is the only real demand zone that has held on this timeframe — every dip toward it has produced a bounce, but every bounce has failed to reclaim the trendline. Until that line is broken with a clean 15M close above it, the path of least resistance remains down.
Trade setups (structure-based, not advice)
Primary bias — bearish continuation:
Wait for price to retest the descending trendline again, likely in the 0.1530–0.1555 zone (the same area the last bounce was rejected from), and look for a bearish rejection candle before entering short. Stop-loss above 0.1580, just past the recent local high and clear of trendline noise. First target is a retest of the 0.1484 Higher Low support, with an extended target of 0.1450–0.1440 if that level gives way.
Counter-trend scalp — support bounce:
If 0.1484 holds again on a retest, a tactical long becomes viable on confirmation of a reversal candle. Entry in the 0.1485–0.1495 zone, tight stop below 0.1465, targeting a move back to the trendline near 0.1530–0.1550. This only works as a quick scalp — the broader trend is still down until the trendline breaks.
The bigger picture
A live cross-check against broader market sources returned wide, conflicting figures for MMT across different platforms and time-stamps (Momentum's token has seen sharp multi-month volatility, and third-party feeds appear to lag), so the Binance perpetual chart's own live price was treated as the authoritative reference here. Given the intact downtrend and repeated rejection at the trendline, MMT is not showing gainer characteristics on this timeframe — a reclaim and close above 0.1580 would be the first real signal that changes.
Not financial advice. This is a technical structure breakdown for educational purposes only. Crypto markets are highly volatile — always manage risk, use proper position sizing, and do your own research before entering any trade.
@Binance_Square_Official #CPIWatch #BitcoinReboundsAbove$79KAfterCPI #BNBTops730USDT #Binance #ChartSniper
MMT/USDT: Momentum Lost — The Domino Effect Keeps Toppling Support
$MMT
Asset: MMT/USDT Perpetual | Timeframe: 15M | Exchange: Binance
MMT's chart reads like a cascade of falling dominoes. After consolidating for two days in the 0.1670–0.1710 range (marked by a clear Lower High), sellers took control on September 9–10 and drove price straight through support in one aggressive impulsive leg to a Lower Low near 0.155. Since then, the pair has been grinding lower inside a well-defined descending trendline, finally carving out a Higher Low at 0.1484 before a sharp bounce attempt to 0.1550 — which was immediately rejected right back into the trendline. Price now sits at 0.1508, down 0.79% on the session, and still trapped beneath that falling resistance line.
What the structure is saying
This is a textbook downtrend: Lower High, Lower Low, Higher Low, and every rally so far has been sold into the descending trendline rather than breaking above it. The 0.1484 level (marked in green) is the only real demand zone that has held on this timeframe — every dip toward it has produced a bounce, but every bounce has failed to reclaim the trendline. Until that line is broken with a clean 15M close above it, the path of least resistance remains down.
Trade setups (structure-based, not advice)
Primary bias — bearish continuation:
Wait for price to retest the descending trendline again, likely in the 0.1530–0.1555 zone (the same area the last bounce was rejected from), and look for a bearish rejection candle before entering short. Stop-loss above 0.1580, just past the recent local high and clear of trendline noise. First target is a retest of the 0.1484 Higher Low support, with an extended target of 0.1450–0.1440 if that level gives way.
Counter-trend scalp — support bounce:
If 0.1484 holds again on a retest, a tactical long becomes viable on confirmation of a reversal candle. Entry in the 0.1485–0.1495 zone, tight stop below 0.1465, targeting a move back to the trendline near 0.1530–0.1550. This only works as a quick scalp — the broader trend is still down until the trendline breaks.
The bigger picture
A live cross-check against broader market sources returned wide, conflicting figures for MMT across different platforms and time-stamps (Momentum's token has seen sharp multi-month volatility, and third-party feeds appear to lag), so the Binance perpetual chart's own live price was treated as the authoritative reference here. Given the intact downtrend and repeated rejection at the trendline, MMT is not showing gainer characteristics on this timeframe — a reclaim and close above 0.1580 would be the first real signal that changes.
Not financial advice. This is a technical structure breakdown for educational purposes only. Crypto markets are highly volatile — always manage risk, use proper position sizing, and do your own research before entering any trade.
@Binance Square Official #CPIWatch #BitcoinReboundsAbove$79KAfterCPI #BNBTops730USDT #Binance #ChartSniper
Asset: MMT/USDT Perpetual | Timeframe: 15M | Exchange: Binance
MMT's chart reads like a cascade of falling dominoes. After consolidating for two days in the 0.1670–0.1710 range (marked by a clear Lower High), sellers took control on September 9–10 and drove price straight through support in one aggressive impulsive leg to a Lower Low near 0.155. Since then, the pair has been grinding lower inside a well-defined descending trendline, finally carving out a Higher Low at 0.1484 before a sharp bounce attempt to 0.1550 — which was immediately rejected right back into the trendline. Price now sits at 0.1508, down 0.79% on the session, and still trapped beneath that falling resistance line.
What the structure is saying
This is a textbook downtrend: Lower High, Lower Low, Higher Low, and every rally so far has been sold into the descending trendline rather than breaking above it. The 0.1484 level (marked in green) is the only real demand zone that has held on this timeframe — every dip toward it has produced a bounce, but every bounce has failed to reclaim the trendline. Until that line is broken with a clean 15M close above it, the path of least resistance remains down.
Trade setups (structure-based, not advice)
Primary bias — bearish continuation:
Wait for price to retest the descending trendline again, likely in the 0.1530–0.1555 zone (the same area the last bounce was rejected from), and look for a bearish rejection candle before entering short. Stop-loss above 0.1580, just past the recent local high and clear of trendline noise. First target is a retest of the 0.1484 Higher Low support, with an extended target of 0.1450–0.1440 if that level gives way.
Counter-trend scalp — support bounce:
If 0.1484 holds again on a retest, a tactical long becomes viable on confirmation of a reversal candle. Entry in the 0.1485–0.1495 zone, tight stop below 0.1465, targeting a move back to the trendline near 0.1530–0.1550. This only works as a quick scalp — the broader trend is still down until the trendline breaks.
The bigger picture
A live cross-check against broader market sources returned wide, conflicting figures for MMT across different platforms and time-stamps (Momentum's token has seen sharp multi-month volatility, and third-party feeds appear to lag), so the Binance perpetual chart's own live price was treated as the authoritative reference here. Given the intact downtrend and repeated rejection at the trendline, MMT is not showing gainer characteristics on this timeframe — a reclaim and close above 0.1580 would be the first real signal that changes.
Not financial advice. This is a technical structure breakdown for educational purposes only. Crypto markets are highly volatile — always manage risk, use proper position sizing, and do your own research before entering any trade.
@Binance Square Official #CPIWatch #BitcoinReboundsAbove$79KAfterCPI #BNBTops730USDT #Binance #ChartSniper
322
·
--

Article
PUMP/USDT: The Heartbeat Fades — Structure Cracks Below Key Support$PUMP
{future}(PUMPUSDT)
Asset: PUMP/USDT Perpetual | Timeframe: 1H | Exchange: Binance
PUMP just delivered a textbook lesson in how fast sentiment can flip on a meme-adjacent token. After rallying off its early-September base near 0.0035 into a clean impulsive leg toward 0.0048, price carved out a Higher High — then immediately began printing lower structure. The 1H chart now shows a completed LH → HH → LL → HL sequence, and the most recent candle just broke below the HL, wicking through the 0 Fibonacci level (0.003506) before closing at 0.003539, down over 4% on the session.
What the structure is saying
The Fibonacci retracement drawn from the 0.0035 swing low to the 0.0049 swing high frames the whole move cleanly. Price rejected hard from the 1.0 extension zone near 0.0049, sliced through the 0.618 (0.004362), 0.5 (0.004199) and 0.382 (0.004035) levels in quick succession, and is now testing the 0 anchor itself. That's a decisive break of trend structure — the descending trendline connecting the HH to the current low is still intact and has not been reclaimed.
RSI (14) sits at 35.6, with its moving average at 40.9 and rolling over — momentum is bearish but not yet at a washed-out extreme, which tells us there could still be room to the downside before a genuine reversal signal shows up.
Trade setups (structure-based, not advice)
Primary bias — bearish continuation:
Look for a corrective bounce back into the 0.00383–0.00410 zone (the 0.236–0.5 fib band, also the prior support-turned-resistance shelf marked on the chart) as the higher-probability short entry, rather than chasing the current candle. A rejection wick or bearish engulfing pattern in that zone would confirm sellers are still in control. Stop-loss sits above 0.00437 (just past the 0.618 fib), protecting against a full trend invalidation. First target is a retest of 0.00350–0.00355, with an extended target near 0.00330–0.00320 if that level fails to hold as support again.
Counter-trend scalp — bounce watch:
If price stabilizes right here without breaking meaningfully below 0.00350, a tactical long scalp becomes viable on a confirmed bullish reversal candle with rising RSI. Entry near 0.00350–0.00356, tight stop below 0.00340, targeting a reclaim of 0.00383 and, if momentum builds, the 0.00410 zone. This is a lower-probability, faster trade — size accordingly.
The bigger picture
Until PUMP reclaims the broken trendline and closes back above the 0.00410 shelf, the structure remains bearish. A live cross-check against broader market data returned widely scattered pricing across different PUMP-named tokens and pools (unrelated tickers sharing the name), so the Binance perpetual chart's own live price was used as the authoritative reference for this analysis.
Not financial advice. This is a technical structure breakdown for educational purposes only. Crypto markets are highly volatile — always manage risk, use proper position sizing, and do your own research before entering any trade.
@Binance_Square_Official #CPIWatch #BitcoinReboundsAbove$79KAfterCPI #BNBTops730USDT #Binance #ChartSniper
PUMP/USDT: The Heartbeat Fades — Structure Cracks Below Key Support
$PUMP
Asset: PUMP/USDT Perpetual | Timeframe: 1H | Exchange: Binance
PUMP just delivered a textbook lesson in how fast sentiment can flip on a meme-adjacent token. After rallying off its early-September base near 0.0035 into a clean impulsive leg toward 0.0048, price carved out a Higher High — then immediately began printing lower structure. The 1H chart now shows a completed LH → HH → LL → HL sequence, and the most recent candle just broke below the HL, wicking through the 0 Fibonacci level (0.003506) before closing at 0.003539, down over 4% on the session.
What the structure is saying
The Fibonacci retracement drawn from the 0.0035 swing low to the 0.0049 swing high frames the whole move cleanly. Price rejected hard from the 1.0 extension zone near 0.0049, sliced through the 0.618 (0.004362), 0.5 (0.004199) and 0.382 (0.004035) levels in quick succession, and is now testing the 0 anchor itself. That's a decisive break of trend structure — the descending trendline connecting the HH to the current low is still intact and has not been reclaimed.
RSI (14) sits at 35.6, with its moving average at 40.9 and rolling over — momentum is bearish but not yet at a washed-out extreme, which tells us there could still be room to the downside before a genuine reversal signal shows up.
Trade setups (structure-based, not advice)
Primary bias — bearish continuation:
Look for a corrective bounce back into the 0.00383–0.00410 zone (the 0.236–0.5 fib band, also the prior support-turned-resistance shelf marked on the chart) as the higher-probability short entry, rather than chasing the current candle. A rejection wick or bearish engulfing pattern in that zone would confirm sellers are still in control. Stop-loss sits above 0.00437 (just past the 0.618 fib), protecting against a full trend invalidation. First target is a retest of 0.00350–0.00355, with an extended target near 0.00330–0.00320 if that level fails to hold as support again.
Counter-trend scalp — bounce watch:
If price stabilizes right here without breaking meaningfully below 0.00350, a tactical long scalp becomes viable on a confirmed bullish reversal candle with rising RSI. Entry near 0.00350–0.00356, tight stop below 0.00340, targeting a reclaim of 0.00383 and, if momentum builds, the 0.00410 zone. This is a lower-probability, faster trade — size accordingly.
The bigger picture
Until PUMP reclaims the broken trendline and closes back above the 0.00410 shelf, the structure remains bearish. A live cross-check against broader market data returned widely scattered pricing across different PUMP-named tokens and pools (unrelated tickers sharing the name), so the Binance perpetual chart's own live price was used as the authoritative reference for this analysis.
Not financial advice. This is a technical structure breakdown for educational purposes only. Crypto markets are highly volatile — always manage risk, use proper position sizing, and do your own research before entering any trade.
@Binance Square Official #CPIWatch #BitcoinReboundsAbove$79KAfterCPI #BNBTops730USDT #Binance #ChartSniper
Asset: PUMP/USDT Perpetual | Timeframe: 1H | Exchange: Binance
PUMP just delivered a textbook lesson in how fast sentiment can flip on a meme-adjacent token. After rallying off its early-September base near 0.0035 into a clean impulsive leg toward 0.0048, price carved out a Higher High — then immediately began printing lower structure. The 1H chart now shows a completed LH → HH → LL → HL sequence, and the most recent candle just broke below the HL, wicking through the 0 Fibonacci level (0.003506) before closing at 0.003539, down over 4% on the session.
What the structure is saying
The Fibonacci retracement drawn from the 0.0035 swing low to the 0.0049 swing high frames the whole move cleanly. Price rejected hard from the 1.0 extension zone near 0.0049, sliced through the 0.618 (0.004362), 0.5 (0.004199) and 0.382 (0.004035) levels in quick succession, and is now testing the 0 anchor itself. That's a decisive break of trend structure — the descending trendline connecting the HH to the current low is still intact and has not been reclaimed.
RSI (14) sits at 35.6, with its moving average at 40.9 and rolling over — momentum is bearish but not yet at a washed-out extreme, which tells us there could still be room to the downside before a genuine reversal signal shows up.
Trade setups (structure-based, not advice)
Primary bias — bearish continuation:
Look for a corrective bounce back into the 0.00383–0.00410 zone (the 0.236–0.5 fib band, also the prior support-turned-resistance shelf marked on the chart) as the higher-probability short entry, rather than chasing the current candle. A rejection wick or bearish engulfing pattern in that zone would confirm sellers are still in control. Stop-loss sits above 0.00437 (just past the 0.618 fib), protecting against a full trend invalidation. First target is a retest of 0.00350–0.00355, with an extended target near 0.00330–0.00320 if that level fails to hold as support again.
Counter-trend scalp — bounce watch:
If price stabilizes right here without breaking meaningfully below 0.00350, a tactical long scalp becomes viable on a confirmed bullish reversal candle with rising RSI. Entry near 0.00350–0.00356, tight stop below 0.00340, targeting a reclaim of 0.00383 and, if momentum builds, the 0.00410 zone. This is a lower-probability, faster trade — size accordingly.
The bigger picture
Until PUMP reclaims the broken trendline and closes back above the 0.00410 shelf, the structure remains bearish. A live cross-check against broader market data returned widely scattered pricing across different PUMP-named tokens and pools (unrelated tickers sharing the name), so the Binance perpetual chart's own live price was used as the authoritative reference for this analysis.
Not financial advice. This is a technical structure breakdown for educational purposes only. Crypto markets are highly volatile — always manage risk, use proper position sizing, and do your own research before entering any trade.
@Binance Square Official #CPIWatch #BitcoinReboundsAbove$79KAfterCPI #BNBTops730USDT #Binance #ChartSniper
195
·
--
📈 $DEXE USDT — LONG SETUP
DEXE is trading around $1.96, with recent selling pressure creating a potential support zone. A hold above $1.90–$1.95 could trigger a recovery toward the next resistance levels. Technical structure favors a cautious rebound setup.
🟢 ENTRY: $1.96
🛑 SL: $1.84
🎯 TP1: $2.10
🎯 TP2: $2.25
🎯 TP3: $2.40
⚡ Entry is executable now.
⚠️ Not financial advice. Manage risk carefully.
@Binance_Square_Official #USAugustPPIRisesLessThanExpected #SECApprovesNasdaqTexasCommodityTrustRule #ECBRaisesRatesSecondTimeTo2.5% #Binance #ChartSniper
{future}(DEXEUSDT)
📈 $DEXE USDT — LONG SETUP
DEXE is trading around $1.96, with recent selling pressure creating a potential support zone. A hold above $1.90–$1.95 could trigger a recovery toward the next resistance levels. Technical structure favors a cautious rebound setup.
🟢 ENTRY: $1.96
🛑 SL: $1.84
🎯 TP1: $2.10
🎯 TP2: $2.25
🎯 TP3: $2.40
⚡ Entry is executable now.
⚠️ Not financial advice. Manage risk carefully.
@Binance Square Official #USAugustPPIRisesLessThanExpected #SECApprovesNasdaqTexasCommodityTrustRule #ECBRaisesRatesSecondTimeTo2.5% #Binance #ChartSniper
DEXE is trading around $1.96, with recent selling pressure creating a potential support zone. A hold above $1.90–$1.95 could trigger a recovery toward the next resistance levels. Technical structure favors a cautious rebound setup.
🟢 ENTRY: $1.96
🛑 SL: $1.84
🎯 TP1: $2.10
🎯 TP2: $2.25
🎯 TP3: $2.40
⚡ Entry is executable now.
⚠️ Not financial advice. Manage risk carefully.
@Binance Square Official #USAugustPPIRisesLessThanExpected #SECApprovesNasdaqTexasCommodityTrustRule #ECBRaisesRatesSecondTimeTo2.5% #Binance #ChartSniper
206
·
--
📉 $SAGA USDT — SHORT SETUP
SAGA is trading near $0.0142, down around 3–4% over 24H. Price remains below the recent $0.0150 resistance, showing bearish pressure after rejection.
🔴 SHORT ENTRY: $0.01420
🛑 SL: $0.01480
🎯 TP1: $0.01370
🎯 TP2: $0.01320
🎯 TP3: $0.01280
⚡ Entry is executable at current market price.
⚠️ Not financial advice. Manage risk carefully.
@Binance_Square_Official #USAugustPPIRisesLessThanExpected #SECApprovesNasdaqTexasCommodityTrustRule #ECBRaisesRatesSecondTimeTo2.5% #Binance #ChartSniper
{future}(SAGAUSDT)
📉 $SAGA USDT — SHORT SETUP
SAGA is trading near $0.0142, down around 3–4% over 24H. Price remains below the recent $0.0150 resistance, showing bearish pressure after rejection.
🔴 SHORT ENTRY: $0.01420
🛑 SL: $0.01480
🎯 TP1: $0.01370
🎯 TP2: $0.01320
🎯 TP3: $0.01280
⚡ Entry is executable at current market price.
⚠️ Not financial advice. Manage risk carefully.
@Binance Square Official #USAugustPPIRisesLessThanExpected #SECApprovesNasdaqTexasCommodityTrustRule #ECBRaisesRatesSecondTimeTo2.5% #Binance #ChartSniper
SAGA is trading near $0.0142, down around 3–4% over 24H. Price remains below the recent $0.0150 resistance, showing bearish pressure after rejection.
🔴 SHORT ENTRY: $0.01420
🛑 SL: $0.01480
🎯 TP1: $0.01370
🎯 TP2: $0.01320
🎯 TP3: $0.01280
⚡ Entry is executable at current market price.
⚠️ Not financial advice. Manage risk carefully.
@Binance Square Official #USAugustPPIRisesLessThanExpected #SECApprovesNasdaqTexasCommodityTrustRule #ECBRaisesRatesSecondTimeTo2.5% #Binance #ChartSniper
127
·
--
Article
NEAR Protocol Pulls Back From a Fresh High — Is the Uptrend Bridge Still Standing?$NEAR
{future}(NEARUSDT)
NEAR (NEAR/USDT Perpetual) is cooling off after tagging a new local high. On the 1H chart, price opened at 2.616, spiked to 2.639, then sold off to a low of 2.526 before settling around 2.552, putting the candle down -2.45%. After a strong multi-day rally off the early-September low, this looks like a routine pullback inside a still-intact uptrend rather than a trend change — but the next few candles at the current support shelf will tell the real story.
Reading the Structure
The broader move on this chart is a clean impulsive rally: price bottomed at a Lower Low (LL) near 1.882, rallied into a Lower High (LH) area, dipped again, then broke decisively higher into a sequence of Higher Highs (HH) — first testing resistance in the mid-2.30s to 2.40s (the "Retracement Area" box on the chart), consolidating there, and then thrusting to the latest HH at 2.639.
That consolidation box wasn't just a pause — it acted as a launchpad. Price built a base there before breaking out to fresh highs, which is a constructive sign for trend continuation. Two parallel ascending trendlines are visible on the chart, forming a rising channel that has guided price higher since the early-September low; as long as price respects the lower boundary of that channel, the broader uptrend structure remains valid.
Key Levels on the Chart
Using the Fibonacci retracement drawn from the swing low (1.882) to the new swing high (2.639):
2.639 — the fresh high (0 fib), immediate overhead resistance2.460 — 23.6% retracement, highlighted as a key horizontal support/resistance level (green line) — price is currently trading just above this2.350 — 38.2% retracement, aligning closely with the top of the prior consolidation box2.261 — 50% retracement, the midpoint and the "structure test" level2.171 — 61.8% retracement, deep pullback zone2.044 — 78.6% retracement, the last line of defense before the move is fully retraced1.882 — the origin low (1 fib)
Current price (2.552) is holding comfortably above the 2.460 support and inside the upper third of this range, which keeps the near-term bullish structure intact.
Trade Setups
Setup 1 — Support Bounce Long (favored) Look for price to hold or reclaim the 2.460–2.500 zone (23.6% fib / the highlighted green support line) before entering.
Entry: 2.460 – 2.500Stop Loss: below 2.350 (38.2% fib, below the old consolidation top)Target 1: 2.639 (recent high)Target 2: 2.75 (channel extension)Target 3 (extended): 2.90 (upper trendline projection)
Setup 2 — Breakout Continuation (aggressive) For traders who prefer confirmation over anticipation, wait for a 1H close back above 2.639.
Entry: above 2.639 on a confirmed closeStop Loss: below 2.460Target 1: 2.75Target 2: 2.90
Invalidation: A decisive break and hold below 2.350 (38.2% fib) would signal the pullback is deepening beyond a routine retest, opening the door toward the 2.261–2.171 zone (50%–61.8% fib). A break below 2.044 (78.6% fib) would put the entire rally structure — and the higher-low sequence — in question.
The Bigger Picture
NEAR's current -2.45% candle looks like healthy profit-taking after a strong impulsive leg rather than a structural breakdown, since price is still trading well above the mid-range fib levels and inside the rising channel. That said, perpetual contracts can move fast in both directions, so waiting for price to confirm support at the 2.460 zone (or a clean breakout reclaim above 2.639) is the more disciplined approach versus buying into the middle of a red candle.
Live cross-checks of NEAR/USD across other sources returned a wide, inconsistent spread — from roughly $2.33 to $9.70 depending on the source and pair, several clearly stale or unrelated to the current Binance perpetual price — so the chart's own timestamped price (2.552) was treated as the authoritative reference for this analysis.
This is not financial advice. Perpetual futures carry additional funding-rate and liquidation risk on top of normal price volatility. Always size positions responsibly, use a stop loss, and do your own research before entering any trade.
@Binance_Square_Official #BitcoinSurpasses$79K #BrentCrudeTops$100 #USADPWeeklyEmploymentRises12000 #Binance #ChartSniper
NEAR Protocol Pulls Back From a Fresh High — Is the Uptrend Bridge Still Standing?
$NEAR
NEAR (NEAR/USDT Perpetual) is cooling off after tagging a new local high. On the 1H chart, price opened at 2.616, spiked to 2.639, then sold off to a low of 2.526 before settling around 2.552, putting the candle down -2.45%. After a strong multi-day rally off the early-September low, this looks like a routine pullback inside a still-intact uptrend rather than a trend change — but the next few candles at the current support shelf will tell the real story.
Reading the Structure
The broader move on this chart is a clean impulsive rally: price bottomed at a Lower Low (LL) near 1.882, rallied into a Lower High (LH) area, dipped again, then broke decisively higher into a sequence of Higher Highs (HH) — first testing resistance in the mid-2.30s to 2.40s (the "Retracement Area" box on the chart), consolidating there, and then thrusting to the latest HH at 2.639.
That consolidation box wasn't just a pause — it acted as a launchpad. Price built a base there before breaking out to fresh highs, which is a constructive sign for trend continuation. Two parallel ascending trendlines are visible on the chart, forming a rising channel that has guided price higher since the early-September low; as long as price respects the lower boundary of that channel, the broader uptrend structure remains valid.
Key Levels on the Chart
Using the Fibonacci retracement drawn from the swing low (1.882) to the new swing high (2.639):
2.639 — the fresh high (0 fib), immediate overhead resistance2.460 — 23.6% retracement, highlighted as a key horizontal support/resistance level (green line) — price is currently trading just above this2.350 — 38.2% retracement, aligning closely with the top of the prior consolidation box2.261 — 50% retracement, the midpoint and the "structure test" level2.171 — 61.8% retracement, deep pullback zone2.044 — 78.6% retracement, the last line of defense before the move is fully retraced1.882 — the origin low (1 fib)
Current price (2.552) is holding comfortably above the 2.460 support and inside the upper third of this range, which keeps the near-term bullish structure intact.
Trade Setups
Setup 1 — Support Bounce Long (favored) Look for price to hold or reclaim the 2.460–2.500 zone (23.6% fib / the highlighted green support line) before entering.
Entry: 2.460 – 2.500Stop Loss: below 2.350 (38.2% fib, below the old consolidation top)Target 1: 2.639 (recent high)Target 2: 2.75 (channel extension)Target 3 (extended): 2.90 (upper trendline projection)
Setup 2 — Breakout Continuation (aggressive) For traders who prefer confirmation over anticipation, wait for a 1H close back above 2.639.
Entry: above 2.639 on a confirmed closeStop Loss: below 2.460Target 1: 2.75Target 2: 2.90
Invalidation: A decisive break and hold below 2.350 (38.2% fib) would signal the pullback is deepening beyond a routine retest, opening the door toward the 2.261–2.171 zone (50%–61.8% fib). A break below 2.044 (78.6% fib) would put the entire rally structure — and the higher-low sequence — in question.
The Bigger Picture
NEAR's current -2.45% candle looks like healthy profit-taking after a strong impulsive leg rather than a structural breakdown, since price is still trading well above the mid-range fib levels and inside the rising channel. That said, perpetual contracts can move fast in both directions, so waiting for price to confirm support at the 2.460 zone (or a clean breakout reclaim above 2.639) is the more disciplined approach versus buying into the middle of a red candle.
Live cross-checks of NEAR/USD across other sources returned a wide, inconsistent spread — from roughly $2.33 to $9.70 depending on the source and pair, several clearly stale or unrelated to the current Binance perpetual price — so the chart's own timestamped price (2.552) was treated as the authoritative reference for this analysis.
This is not financial advice. Perpetual futures carry additional funding-rate and liquidation risk on top of normal price volatility. Always size positions responsibly, use a stop loss, and do your own research before entering any trade.
@Binance Square Official #BitcoinSurpasses$79K #BrentCrudeTops$100 #USADPWeeklyEmploymentRises12000 #Binance #ChartSniper
NEAR (NEAR/USDT Perpetual) is cooling off after tagging a new local high. On the 1H chart, price opened at 2.616, spiked to 2.639, then sold off to a low of 2.526 before settling around 2.552, putting the candle down -2.45%. After a strong multi-day rally off the early-September low, this looks like a routine pullback inside a still-intact uptrend rather than a trend change — but the next few candles at the current support shelf will tell the real story.
Reading the Structure
The broader move on this chart is a clean impulsive rally: price bottomed at a Lower Low (LL) near 1.882, rallied into a Lower High (LH) area, dipped again, then broke decisively higher into a sequence of Higher Highs (HH) — first testing resistance in the mid-2.30s to 2.40s (the "Retracement Area" box on the chart), consolidating there, and then thrusting to the latest HH at 2.639.
That consolidation box wasn't just a pause — it acted as a launchpad. Price built a base there before breaking out to fresh highs, which is a constructive sign for trend continuation. Two parallel ascending trendlines are visible on the chart, forming a rising channel that has guided price higher since the early-September low; as long as price respects the lower boundary of that channel, the broader uptrend structure remains valid.
Key Levels on the Chart
Using the Fibonacci retracement drawn from the swing low (1.882) to the new swing high (2.639):
2.639 — the fresh high (0 fib), immediate overhead resistance2.460 — 23.6% retracement, highlighted as a key horizontal support/resistance level (green line) — price is currently trading just above this2.350 — 38.2% retracement, aligning closely with the top of the prior consolidation box2.261 — 50% retracement, the midpoint and the "structure test" level2.171 — 61.8% retracement, deep pullback zone2.044 — 78.6% retracement, the last line of defense before the move is fully retraced1.882 — the origin low (1 fib)
Current price (2.552) is holding comfortably above the 2.460 support and inside the upper third of this range, which keeps the near-term bullish structure intact.
Trade Setups
Setup 1 — Support Bounce Long (favored) Look for price to hold or reclaim the 2.460–2.500 zone (23.6% fib / the highlighted green support line) before entering.
Entry: 2.460 – 2.500Stop Loss: below 2.350 (38.2% fib, below the old consolidation top)Target 1: 2.639 (recent high)Target 2: 2.75 (channel extension)Target 3 (extended): 2.90 (upper trendline projection)
Setup 2 — Breakout Continuation (aggressive) For traders who prefer confirmation over anticipation, wait for a 1H close back above 2.639.
Entry: above 2.639 on a confirmed closeStop Loss: below 2.460Target 1: 2.75Target 2: 2.90
Invalidation: A decisive break and hold below 2.350 (38.2% fib) would signal the pullback is deepening beyond a routine retest, opening the door toward the 2.261–2.171 zone (50%–61.8% fib). A break below 2.044 (78.6% fib) would put the entire rally structure — and the higher-low sequence — in question.
The Bigger Picture
NEAR's current -2.45% candle looks like healthy profit-taking after a strong impulsive leg rather than a structural breakdown, since price is still trading well above the mid-range fib levels and inside the rising channel. That said, perpetual contracts can move fast in both directions, so waiting for price to confirm support at the 2.460 zone (or a clean breakout reclaim above 2.639) is the more disciplined approach versus buying into the middle of a red candle.
Live cross-checks of NEAR/USD across other sources returned a wide, inconsistent spread — from roughly $2.33 to $9.70 depending on the source and pair, several clearly stale or unrelated to the current Binance perpetual price — so the chart's own timestamped price (2.552) was treated as the authoritative reference for this analysis.
This is not financial advice. Perpetual futures carry additional funding-rate and liquidation risk on top of normal price volatility. Always size positions responsibly, use a stop loss, and do your own research before entering any trade.
@Binance Square Official #BitcoinSurpasses$79K #BrentCrudeTops$100 #USADPWeeklyEmploymentRises12000 #Binance #ChartSniper
74
Log in to explore more content
Join global crypto users on Binance Square
⚡️ Get latest and useful information about crypto.
💬 Trusted by the world’s largest crypto exchange.
👍 Discover real insights from verified creators.
Email / Phone number
Trending Topics
BOJRaisesRatesTo31YearHigh
125,629 views
1,957 Discussing
#BOJRaisesRatesTo31YearHigh
#BOJRaisesRatesTo31YearHigh 🇯🇵📈
The Bank of Japan has taken another major step by raising interest rates to their highest level in 31 years, putting global markets on alert. The move signals a continued shift away from Japan’s long-standing ultra-loose monetary policy. Higher Japanese rates could strengthen the yen, influence global bond yields, and potentially impact capital flows across financial markets. Crypto and risk assets may also react as investors reassess liquidity and risk exposure. Traders are now watching the BOJ’s next statements closely for clues about future rate decisions. Volatility could increase as markets digest the policy change and its potential global impact. #BOJ #Japan #Crypto #Markets #InterestRates $NVDAB
maqsoodahmed1
·1 Likes
·112 views
BuffettStepsDownAsBerkshireChairman
59,422 views
970 Discussing
XRPExchangeReservesHitSevenYearLow
63,200 views
906 Discussing