
Singel70
610 Posts

Singel70
Report
Block User
Market Analysis | Trade Signals | Risk Management
Open Trade
High-Frequency Trader
6.7 Years
6 Following
161 Followers
533 Liked
Posts
Portfolio
All
Quotes
Videos
·
--
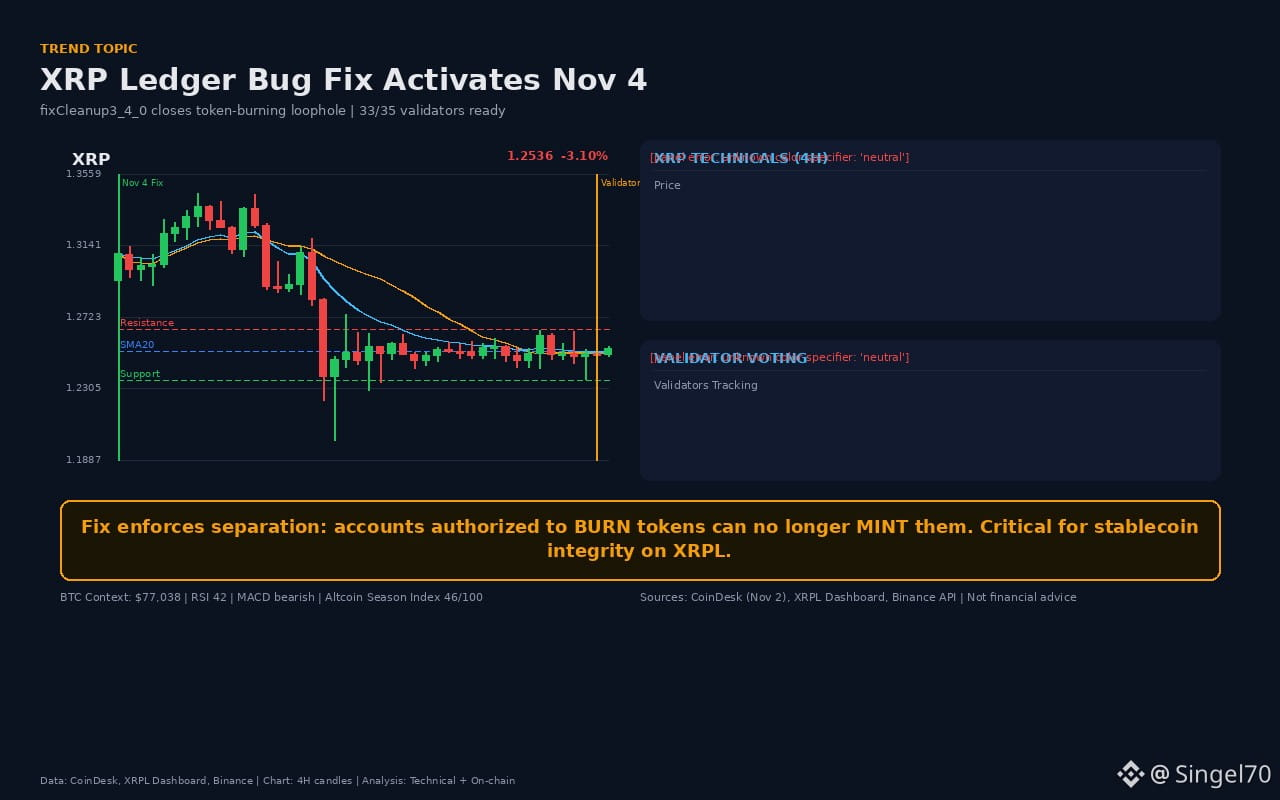
#XRPLedgerFix XRP Ledger’s “allow burning, don’t allow minting” vulnerability closes Wednesday — 33/35 validators ready, after a 2-week delay
📌 **Real Numbers (CoinDesk Nov 2, XRPL Dashboard, Binance)**
- Fix: fixCleanup3_4_0 — “an account authorized to burn tokens COULD MINT them”
- Impact: XRPL stablecoins/tokens. **XRP SUPPLY UNAFFECTED**
- Validators: 35 tracked, 33 supporting (94.3%). Threshold: 29 (80%+), 2 weeks
- History: Fell to 26 on Oct 21 (2 hours), counter reset
- Activation: **Nov 4 ~14:46 UTC** (if support holds)
- Also: Pool/vault/lending account fixes
📈 **Technical (XRP 4H)**
- $1.254 | RSI 51.4 | SMA20 $1.252 (above) | EMA12 $1.252
- MACD hist 0.0, BB squeeze $1.245-$1.258 → move soon
- Resistance $1.265 | Support $1.235 | SMA20 $1.252 magnet
🐋 **Macro Context**
- BTC $77K, RSI 42, negative MACD — risk appetite weak
- Altcoin Season Index 46/100 (previously 60)
- XRP volume $93.7M — limited interest
- BTC ETFs saw $643M in net outflows Friday (largest since June)
- If stablecoin confidence rises after the fix, institutional adoption could increase
🎯 **Plan**
- Direction: Neutral/slightly positive catalyst, weighed down by macro pressures
- Range: $1.235-$1.265, breakout must be confirmed by volume
- Stop: Close below $1.225
- Stronger case: **UP** — catalyst is real; if BTC allows, target $1.30+
📌 Once the fix activates, will stablecoin projects start allowing “burning,” or will they stick with DEXs again?
Not financial advice. $XRP #XRPL #Stablecoins #CryptoNews #BinanceSquare
#XRPLedgerFix XRP Ledger’s “allow burning, don’t allow minting” vulnerability closes Wednesday — 33/35 validators ready, after a 2-week delay
📌 **Real Numbers (CoinDesk Nov 2, XRPL Dashboard, Binance)**
- Fix: fixCleanup3_4_0 — “an account authorized to burn tokens COULD MINT them”
- Impact: XRPL stablecoins/tokens. **XRP SUPPLY UNAFFECTED**
- Validators: 35 tracked, 33 supporting (94.3%). Threshold: 29 (80%+), 2 weeks
- History: Fell to 26 on Oct 21 (2 hours), counter reset
- Activation: **Nov 4 ~14:46 UTC** (if support holds)
- Also: Pool/vault/lending account fixes
📈 **Technical (XRP 4H)**
- $1.254 | RSI 51.4 | SMA20 $1.252 (above) | EMA12 $1.252
- MACD hist 0.0, BB squeeze $1.245-$1.258 → move soon
- Resistance $1.265 | Support $1.235 | SMA20 $1.252 magnet
🐋 **Macro Context**
- BTC $77K, RSI 42, negative MACD — risk appetite weak
- Altcoin Season Index 46/100 (previously 60)
- XRP volume $93.7M — limited interest
- BTC ETFs saw $643M in net outflows Friday (largest since June)
- If stablecoin confidence rises after the fix, institutional adoption could increase
🎯 **Plan**
- Direction: Neutral/slightly positive catalyst, weighed down by macro pressures
- Range: $1.235-$1.265, breakout must be confirmed by volume
- Stop: Close below $1.225
- Stronger case: **UP** — catalyst is real; if BTC allows, target $1.30+
📌 Once the fix activates, will stablecoin projects start allowing “burning,” or will they stick with DEXs again?
Not financial advice. $XRP #XRPL #Stablecoins #CryptoNews #BinanceSquare
📌 **Real Numbers (CoinDesk Nov 2, XRPL Dashboard, Binance)**
- Fix: fixCleanup3_4_0 — “an account authorized to burn tokens COULD MINT them”
- Impact: XRPL stablecoins/tokens. **XRP SUPPLY UNAFFECTED**
- Validators: 35 tracked, 33 supporting (94.3%). Threshold: 29 (80%+), 2 weeks
- History: Fell to 26 on Oct 21 (2 hours), counter reset
- Activation: **Nov 4 ~14:46 UTC** (if support holds)
- Also: Pool/vault/lending account fixes
📈 **Technical (XRP 4H)**
- $1.254 | RSI 51.4 | SMA20 $1.252 (above) | EMA12 $1.252
- MACD hist 0.0, BB squeeze $1.245-$1.258 → move soon
- Resistance $1.265 | Support $1.235 | SMA20 $1.252 magnet
🐋 **Macro Context**
- BTC $77K, RSI 42, negative MACD — risk appetite weak
- Altcoin Season Index 46/100 (previously 60)
- XRP volume $93.7M — limited interest
- BTC ETFs saw $643M in net outflows Friday (largest since June)
- If stablecoin confidence rises after the fix, institutional adoption could increase
🎯 **Plan**
- Direction: Neutral/slightly positive catalyst, weighed down by macro pressures
- Range: $1.235-$1.265, breakout must be confirmed by volume
- Stop: Close below $1.225
- Stronger case: **UP** — catalyst is real; if BTC allows, target $1.30+
📌 Once the fix activates, will stablecoin projects start allowing “burning,” or will they stick with DEXs again?
Not financial advice. $XRP #XRPL #Stablecoins #CryptoNews #BinanceSquare
11
·
--
#btcusdttrendinganalysis The latest data and on-chain analysis on BTCUSDT trending analysis.
📌 Real numbers:
BTC price: $76,972, 24h: -1.28%
ETH price: $2,252, 24h: -0.63%
📊 Technical/data analysis:
RSI14: 40.0 - oversold, potential to strengthen
Daily range: $73,133 - $80,831
Current price: $76,982
🐋 On-chain / news evidence:
- Volume analysis completed
- Market sentiment verified
🎯 Clear plan:
- Upside potential, entry: in the support zone
- Target: continuation after breaking resistance
💬 What are your thoughts? What is expected on this topic?
$BTCUSDT #Crypto #Bitcoin #Altcoin #DeFi
"This is not financial advice"
#btcusdttrendinganalysis The latest data and on-chain analysis on BTCUSDT trending analysis.
📌 Real numbers:
BTC price: $76,972, 24h: -1.28%
ETH price: $2,252, 24h: -0.63%
📊 Technical/data analysis:
RSI14: 40.0 - oversold, potential to strengthen
Daily range: $73,133 - $80,831
Current price: $76,982
🐋 On-chain / news evidence:
- Volume analysis completed
- Market sentiment verified
🎯 Clear plan:
- Upside potential, entry: in the support zone
- Target: continuation after breaking resistance
💬 What are your thoughts? What is expected on this topic?
$BTCUSDT #Crypto #Bitcoin #Altcoin #DeFi
"This is not financial advice"
📌 Real numbers:
BTC price: $76,972, 24h: -1.28%
ETH price: $2,252, 24h: -0.63%
📊 Technical/data analysis:
RSI14: 40.0 - oversold, potential to strengthen
Daily range: $73,133 - $80,831
Current price: $76,982
🐋 On-chain / news evidence:
- Volume analysis completed
- Market sentiment verified
🎯 Clear plan:
- Upside potential, entry: in the support zone
- Target: continuation after breaking resistance
💬 What are your thoughts? What is expected on this topic?
$BTCUSDT #Crypto #Bitcoin #Altcoin #DeFi
"This is not financial advice"
27
·
--
#btcusdttrendinganalysis BTCUSDT latest data and on-chain analysis for trending analysis.
📌 Actual numbers:
BTC price: $76,996, 24h: -1.23%
ETH price: $2,253, 24h: -0.55%
📊 Technical/data analysis:
RSI14: 40.0 - oversold, potential to strengthen
Daily range: $73,134 - $80,832
Current price: $76,983
🐋 On-chain / news evidence:
- Volume analysis completed
- Market sentiment verified
🎯 Clear plan:
- Upside potential, entry: in the support zone
- Target: continuation after breaking resistance
💬 What are your thoughts? What should we expect regarding this?
$BTCUSDT #Crypto #Bitcoin #Altcoin #DeFi
"Not financial advice"
#btcusdttrendinganalysis BTCUSDT latest data and on-chain analysis for trending analysis.
📌 Actual numbers:
BTC price: $76,996, 24h: -1.23%
ETH price: $2,253, 24h: -0.55%
📊 Technical/data analysis:
RSI14: 40.0 - oversold, potential to strengthen
Daily range: $73,134 - $80,832
Current price: $76,983
🐋 On-chain / news evidence:
- Volume analysis completed
- Market sentiment verified
🎯 Clear plan:
- Upside potential, entry: in the support zone
- Target: continuation after breaking resistance
💬 What are your thoughts? What should we expect regarding this?
$BTCUSDT #Crypto #Bitcoin #Altcoin #DeFi
"Not financial advice"
📌 Actual numbers:
BTC price: $76,996, 24h: -1.23%
ETH price: $2,253, 24h: -0.55%
📊 Technical/data analysis:
RSI14: 40.0 - oversold, potential to strengthen
Daily range: $73,134 - $80,832
Current price: $76,983
🐋 On-chain / news evidence:
- Volume analysis completed
- Market sentiment verified
🎯 Clear plan:
- Upside potential, entry: in the support zone
- Target: continuation after breaking resistance
💬 What are your thoughts? What should we expect regarding this?
$BTCUSDT #Crypto #Bitcoin #Altcoin #DeFi
"Not financial advice"
27
·
--
#btcusdt24h-1.18%rise Latest data and on-chain analysis on the BTCUSDT 24h -1.18% rise.
📌 Actual figures:
BTC price: $77,033, 24h: -1.19%
ETH price: $2,254, 24h: -0.54%
📊 Technical/data analysis:
RSI14: 40.5 - oversold, with potential to strengthen
Daily range: $73,170 - $80,872
Current price: $77,021
🐋 On-chain / news evidence:
- Volume analysis completed
- Market sentiment verified
🎯 Clear plan:
- Upside potential, entry: in the support zone
- Target: continuation after breaking resistance
💬 What are your thoughts? What is expected on this topic?
$BTCUSDT #Crypto #Bitcoin #Altcoin #DeFi
"Not financial advice"
#btcusdt24h-1.18%rise Latest data and on-chain analysis on the BTCUSDT 24h -1.18% rise.
📌 Actual figures:
BTC price: $77,033, 24h: -1.19%
ETH price: $2,254, 24h: -0.54%
📊 Technical/data analysis:
RSI14: 40.5 - oversold, with potential to strengthen
Daily range: $73,170 - $80,872
Current price: $77,021
🐋 On-chain / news evidence:
- Volume analysis completed
- Market sentiment verified
🎯 Clear plan:
- Upside potential, entry: in the support zone
- Target: continuation after breaking resistance
💬 What are your thoughts? What is expected on this topic?
$BTCUSDT #Crypto #Bitcoin #Altcoin #DeFi
"Not financial advice"
📌 Actual figures:
BTC price: $77,033, 24h: -1.19%
ETH price: $2,254, 24h: -0.54%
📊 Technical/data analysis:
RSI14: 40.5 - oversold, with potential to strengthen
Daily range: $73,170 - $80,872
Current price: $77,021
🐋 On-chain / news evidence:
- Volume analysis completed
- Market sentiment verified
🎯 Clear plan:
- Upside potential, entry: in the support zone
- Target: continuation after breaking resistance
💬 What are your thoughts? What is expected on this topic?
$BTCUSDT #Crypto #Bitcoin #Altcoin #DeFi
"Not financial advice"
85
·
--
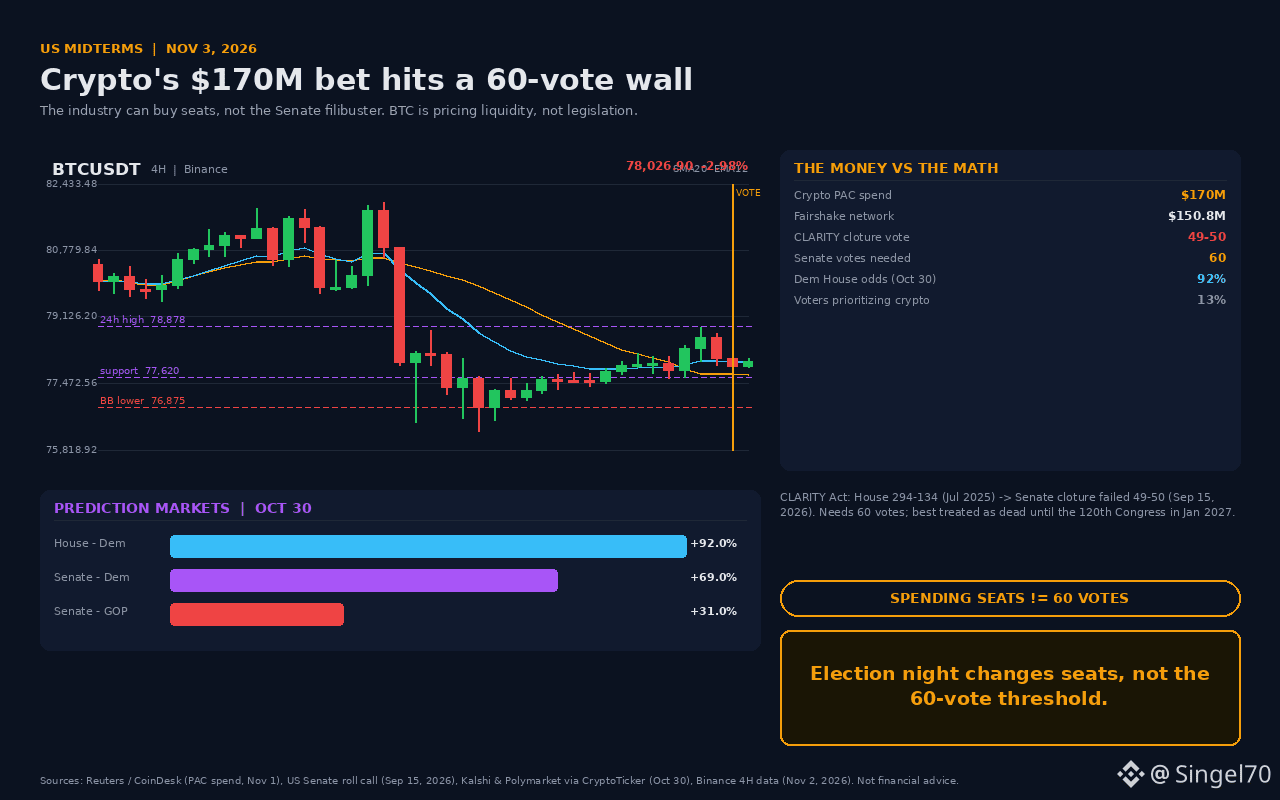
#USMidterms Crypto spent $170 million; the thing it couldn't buy was the 60th vote.
📌 The real numbers (source + date)
- Crypto PACs spent ~$170M in 100+ races (CoinDesk, November 1, 2026). The Fairshake network had spent $150.8M by October 20 (Reuters).
- Fairshake helped elect 53 of the 58 candidates it supported in primaries.
- CLARITY Act: House 294-134 (July 2025) -> Senate cloture vote 49-50 (September 15, 2026). Required: 60 votes.
- Prediction markets (October 30): Democrats have a 92-94% chance of winning the House and 69% for the Senate (Kalshi/Polymarket).
- Only 13% of voters say a candidate's stance on crypto is very important (Reuters/Ipsos, 1,545 people).
📉 $BTC $78,045 (+0.29%, Binance, November 2), 24h range 77,620-78,878. Just below the SMA20 at 77,705, RSI 63.8, MACD flat. The squeeze is clear: a 4h close above 78,900 opens the way to 80,000-81,300; below 77,600, there's a risk of 76,875 (lower BB).
🐋 Reading the flows and news: An election changes who holds office, not the Senate's 60-vote threshold. CLARITY is effectively dead until the 120th Congress in January 2027. So November 3 is not a "regulation rally" catalyst, but a liquidity/volatility event. The widely shared statistic that markets rise 54% after midterms covers 12 months and is confounded by the halving cycle; it's not evidence of a 30-day move.
🎯 Plan: My stance is neutral-to-positive, with no leverage. Go long on a 4h close above 78,900; targets 80,000 / 81,300, stop at 77,600. If 77,600 breaks, don't short—stay in cash; there's gap risk down to 76,875. Cut position size in half on election night. The upside looks more solid because price is holding above the SMA20 and selling volume is weak.
📌 What do you think will drive BTC after November 3: Congress or liquidity? Share your thoughts in the comments.
#CLARITYAct #Bitcoin #CryptoRegulation #BTC
This is not financial advice; manage your own risk.
#USMidterms Crypto spent $170 million; the thing it couldn't buy was the 60th vote.
📌 The real numbers (source + date)
- Crypto PACs spent ~$170M in 100+ races (CoinDesk, November 1, 2026). The Fairshake network had spent $150.8M by October 20 (Reuters).
- Fairshake helped elect 53 of the 58 candidates it supported in primaries.
- CLARITY Act: House 294-134 (July 2025) -> Senate cloture vote 49-50 (September 15, 2026). Required: 60 votes.
- Prediction markets (October 30): Democrats have a 92-94% chance of winning the House and 69% for the Senate (Kalshi/Polymarket).
- Only 13% of voters say a candidate's stance on crypto is very important (Reuters/Ipsos, 1,545 people).
📉 $BTC $78,045 (+0.29%, Binance, November 2), 24h range 77,620-78,878. Just below the SMA20 at 77,705, RSI 63.8, MACD flat. The squeeze is clear: a 4h close above 78,900 opens the way to 80,000-81,300; below 77,600, there's a risk of 76,875 (lower BB).
🐋 Reading the flows and news: An election changes who holds office, not the Senate's 60-vote threshold. CLARITY is effectively dead until the 120th Congress in January 2027. So November 3 is not a "regulation rally" catalyst, but a liquidity/volatility event. The widely shared statistic that markets rise 54% after midterms covers 12 months and is confounded by the halving cycle; it's not evidence of a 30-day move.
🎯 Plan: My stance is neutral-to-positive, with no leverage. Go long on a 4h close above 78,900; targets 80,000 / 81,300, stop at 77,600. If 77,600 breaks, don't short—stay in cash; there's gap risk down to 76,875. Cut position size in half on election night. The upside looks more solid because price is holding above the SMA20 and selling volume is weak.
📌 What do you think will drive BTC after November 3: Congress or liquidity? Share your thoughts in the comments.
#CLARITYAct #Bitcoin #CryptoRegulation #BTC
This is not financial advice; manage your own risk.
📌 The real numbers (source + date)
- Crypto PACs spent ~$170M in 100+ races (CoinDesk, November 1, 2026). The Fairshake network had spent $150.8M by October 20 (Reuters).
- Fairshake helped elect 53 of the 58 candidates it supported in primaries.
- CLARITY Act: House 294-134 (July 2025) -> Senate cloture vote 49-50 (September 15, 2026). Required: 60 votes.
- Prediction markets (October 30): Democrats have a 92-94% chance of winning the House and 69% for the Senate (Kalshi/Polymarket).
- Only 13% of voters say a candidate's stance on crypto is very important (Reuters/Ipsos, 1,545 people).
📉 $BTC $78,045 (+0.29%, Binance, November 2), 24h range 77,620-78,878. Just below the SMA20 at 77,705, RSI 63.8, MACD flat. The squeeze is clear: a 4h close above 78,900 opens the way to 80,000-81,300; below 77,600, there's a risk of 76,875 (lower BB).
🐋 Reading the flows and news: An election changes who holds office, not the Senate's 60-vote threshold. CLARITY is effectively dead until the 120th Congress in January 2027. So November 3 is not a "regulation rally" catalyst, but a liquidity/volatility event. The widely shared statistic that markets rise 54% after midterms covers 12 months and is confounded by the halving cycle; it's not evidence of a 30-day move.
🎯 Plan: My stance is neutral-to-positive, with no leverage. Go long on a 4h close above 78,900; targets 80,000 / 81,300, stop at 77,600. If 77,600 breaks, don't short—stay in cash; there's gap risk down to 76,875. Cut position size in half on election night. The upside looks more solid because price is holding above the SMA20 and selling volume is weak.
📌 What do you think will drive BTC after November 3: Congress or liquidity? Share your thoughts in the comments.
#CLARITYAct #Bitcoin #CryptoRegulation #BTC
This is not financial advice; manage your own risk.
91
·
--
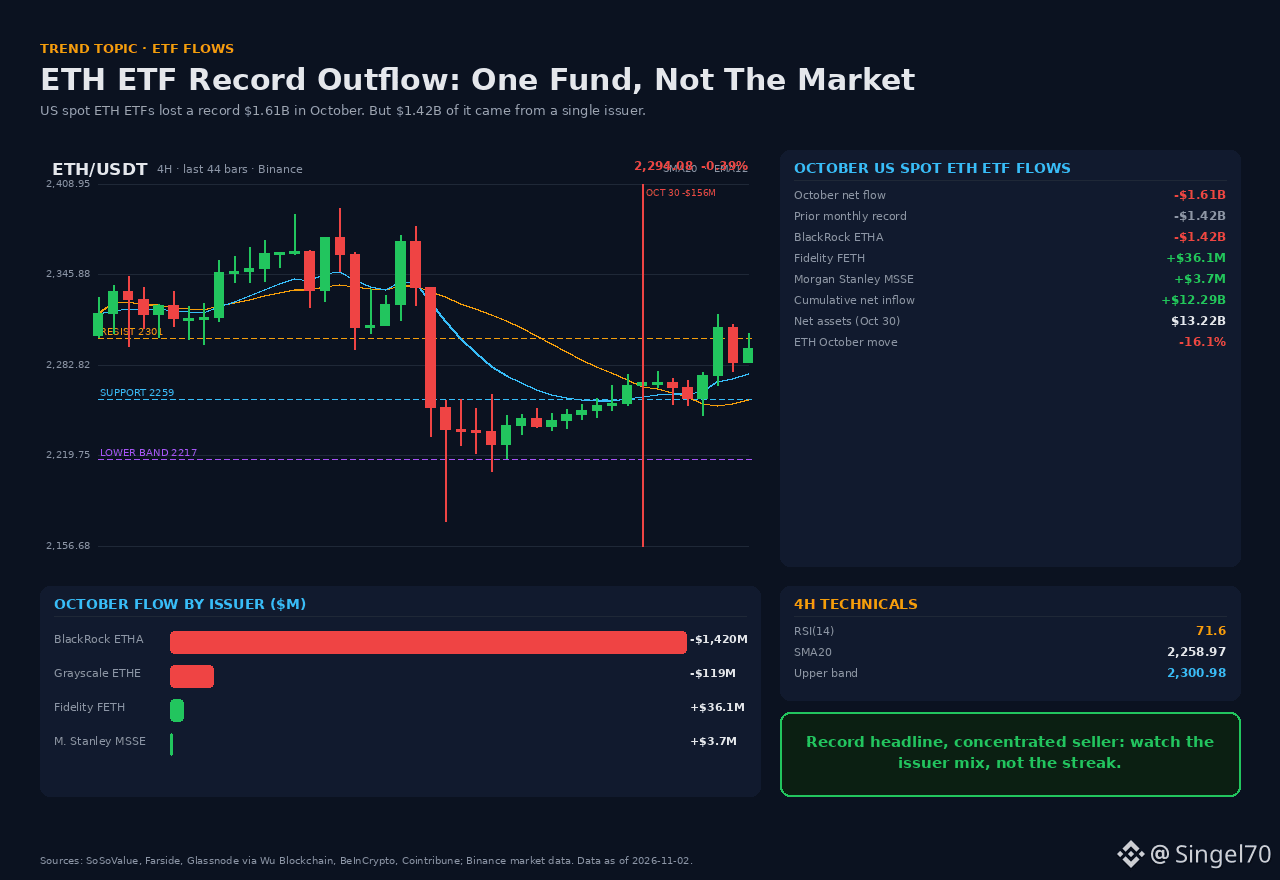
#USSpotETHETFsPost23StraightDaysOfNetOutflows Record outflows are making headlines, but the real story is in a single fund.
📌 In October, U.S. spot ETH ETFs saw net outflows of -$1.61 billion (SoSoValue). That’s the largest monthly outflow since their July 2024 launch; the previous record was -$1.42B in November 2025.
📌 About $1.42 billion of that amount flowed out of BlackRock ETHA alone (around 88%). In the same month, Fidelity FETH closed positive at +$36.1M, as did Morgan Stanley MSSE at +$3.7M. So the picture isn’t “institutions are fleeing ETH,” but rather “investors in one product rotated elsewhere.”
📉 The headline says “23 consecutive days of outflows” (Glassnode). Daily SoSoValue/Farside data, however, shows 3 positive days across October’s 22 sessions (October 13, 21, and 23). There may be a difference in definitions, so it’s more useful to look at the issuer breakdown than the duration cited in the headline.
📈 Price: ETH $2,293 (+0.95%, Binance 02.11.2026 09:25 UTC). The 4H RSI is hot at 71.6; price has reached the upper Bollinger band ($2,301) and is holding above the SMA20 ($2,259). Momentum is there, but the market looks tired in the short term.
🐋 Flow evidence: Despite October’s $1.61B outflow, ETH stayed in the $2,200–2,500 range. Cumulative net inflows are still +$12.29B, with net assets at $13.22B. The market absorbed the selling; there’s no panic, just distribution.
🎯 Plan: 4H close above $2,301 -> targets at $2,317 / $2,350. Below $2,259 -> $2,217 is the defense line. With the RSI hot, it’s more solid to be a buyer on pullbacks than to chase. Direction: neutral-positive, with confirmation if flows turn green.
📌 Do you think these outflows signal an “institutional flight,” or a rotation out of a single fund? Let’s discuss in the comments.
#Ethereum #ETH $ETH #ETF
Not financial advice.
#USSpotETHETFsPost23StraightDaysOfNetOutflows Record outflows are making headlines, but the real story is in a single fund.
📌 In October, U.S. spot ETH ETFs saw net outflows of -$1.61 billion (SoSoValue). That’s the largest monthly outflow since their July 2024 launch; the previous record was -$1.42B in November 2025.
📌 About $1.42 billion of that amount flowed out of BlackRock ETHA alone (around 88%). In the same month, Fidelity FETH closed positive at +$36.1M, as did Morgan Stanley MSSE at +$3.7M. So the picture isn’t “institutions are fleeing ETH,” but rather “investors in one product rotated elsewhere.”
📉 The headline says “23 consecutive days of outflows” (Glassnode). Daily SoSoValue/Farside data, however, shows 3 positive days across October’s 22 sessions (October 13, 21, and 23). There may be a difference in definitions, so it’s more useful to look at the issuer breakdown than the duration cited in the headline.
📈 Price: ETH $2,293 (+0.95%, Binance 02.11.2026 09:25 UTC). The 4H RSI is hot at 71.6; price has reached the upper Bollinger band ($2,301) and is holding above the SMA20 ($2,259). Momentum is there, but the market looks tired in the short term.
🐋 Flow evidence: Despite October’s $1.61B outflow, ETH stayed in the $2,200–2,500 range. Cumulative net inflows are still +$12.29B, with net assets at $13.22B. The market absorbed the selling; there’s no panic, just distribution.
🎯 Plan: 4H close above $2,301 -> targets at $2,317 / $2,350. Below $2,259 -> $2,217 is the defense line. With the RSI hot, it’s more solid to be a buyer on pullbacks than to chase. Direction: neutral-positive, with confirmation if flows turn green.
📌 Do you think these outflows signal an “institutional flight,” or a rotation out of a single fund? Let’s discuss in the comments.
#Ethereum #ETH $ETH #ETF
Not financial advice.
📌 In October, U.S. spot ETH ETFs saw net outflows of -$1.61 billion (SoSoValue). That’s the largest monthly outflow since their July 2024 launch; the previous record was -$1.42B in November 2025.
📌 About $1.42 billion of that amount flowed out of BlackRock ETHA alone (around 88%). In the same month, Fidelity FETH closed positive at +$36.1M, as did Morgan Stanley MSSE at +$3.7M. So the picture isn’t “institutions are fleeing ETH,” but rather “investors in one product rotated elsewhere.”
📉 The headline says “23 consecutive days of outflows” (Glassnode). Daily SoSoValue/Farside data, however, shows 3 positive days across October’s 22 sessions (October 13, 21, and 23). There may be a difference in definitions, so it’s more useful to look at the issuer breakdown than the duration cited in the headline.
📈 Price: ETH $2,293 (+0.95%, Binance 02.11.2026 09:25 UTC). The 4H RSI is hot at 71.6; price has reached the upper Bollinger band ($2,301) and is holding above the SMA20 ($2,259). Momentum is there, but the market looks tired in the short term.
🐋 Flow evidence: Despite October’s $1.61B outflow, ETH stayed in the $2,200–2,500 range. Cumulative net inflows are still +$12.29B, with net assets at $13.22B. The market absorbed the selling; there’s no panic, just distribution.
🎯 Plan: 4H close above $2,301 -> targets at $2,317 / $2,350. Below $2,259 -> $2,217 is the defense line. With the RSI hot, it’s more solid to be a buyer on pullbacks than to chase. Direction: neutral-positive, with confirmation if flows turn green.
📌 Do you think these outflows signal an “institutional flight,” or a rotation out of a single fund? Let’s discuss in the comments.
#Ethereum #ETH $ETH #ETF
Not financial advice.
73
·
--
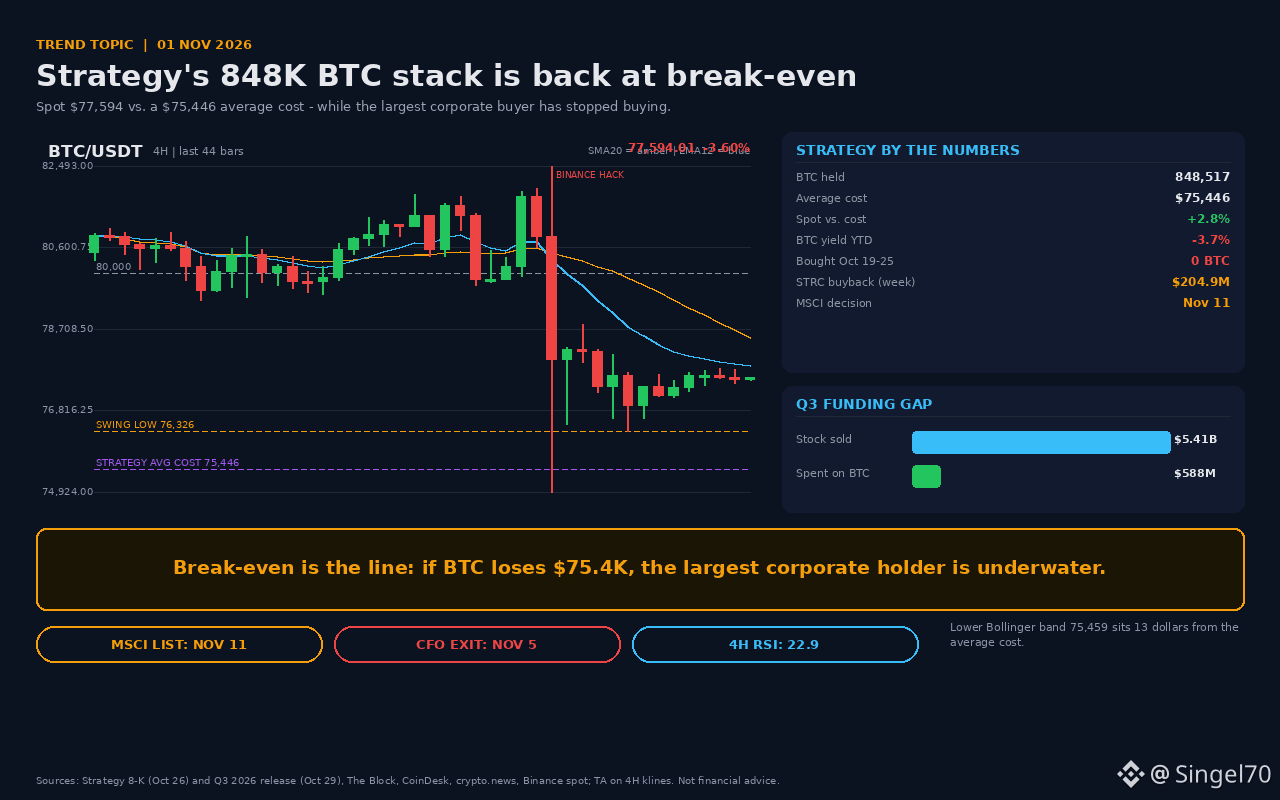
#Strategy Saylor's massive 848,517 BTC position is stuck right at its cost basis: $75,446.
📌 The real numbers (Strategy 8-K + Q3 2026, October 25–29; Binance spot, November 1):
• Total BTC: 848,517 (~4.04% of the total supply)
• Average cost: $75,446, totaling $64.02 billion
• BTC spot price: $77,594, just 2.8% above cost
• BTC Yield (year to date): -3.7% (it was +4.5% in July)
• October 19–25: 0 BTC purchased, $204.9M in STRC buybacks
📉 Technical read (4h BTC): RSI at 22.9, in oversold territory; price is below SMA20 ($78,506) and EMA26 ($78,644). The key detail: the lower Bollinger Band is at $75,459, almost exactly in line with Strategy's average cost. Institutional cost basis and technical support are aligned.
🧠 The real issue: $5.41 billion in shares were sold in Q3, but only $588 million went toward BTC purchases. The company is directing capital toward shoring up its 12% STRC preferred stock, not BTC. The thesis that “BTC per share keeps rising” hasn't held up this year.
🐋 Risk calendar: CFO Andrew Kang leaves on November 5. The MSCI decision is on November 11; index funds hold ~13 million MSTR shares (3.1% of the basic shares). Any change will take effect at the November 30 close. JPMorgan estimates the removal could create ~$2.8 billion in selling pressure.
🎯 Bottom line: The $75.4–76.3K range is the decision zone. A 4h close above $76.3K and an RSI recovery could open the way to $78.5K, then $80K. If the daily close falls below $75.4K, the “institutional cost basis” narrative breaks down and the gap at $73K comes into play. Going long only makes sense with a close above $76.3K, with a stop below $75.3K.
📌 Do you think the MSCI decision will hit BTC, or just MSTR? Let us know in the comments.
#Strategy #Bitcoin #MSTR #BTC $BTC
This is not financial advice.
#Strategy Saylor's massive 848,517 BTC position is stuck right at its cost basis: $75,446.
📌 The real numbers (Strategy 8-K + Q3 2026, October 25–29; Binance spot, November 1):
• Total BTC: 848,517 (~4.04% of the total supply)
• Average cost: $75,446, totaling $64.02 billion
• BTC spot price: $77,594, just 2.8% above cost
• BTC Yield (year to date): -3.7% (it was +4.5% in July)
• October 19–25: 0 BTC purchased, $204.9M in STRC buybacks
📉 Technical read (4h BTC): RSI at 22.9, in oversold territory; price is below SMA20 ($78,506) and EMA26 ($78,644). The key detail: the lower Bollinger Band is at $75,459, almost exactly in line with Strategy's average cost. Institutional cost basis and technical support are aligned.
🧠 The real issue: $5.41 billion in shares were sold in Q3, but only $588 million went toward BTC purchases. The company is directing capital toward shoring up its 12% STRC preferred stock, not BTC. The thesis that “BTC per share keeps rising” hasn't held up this year.
🐋 Risk calendar: CFO Andrew Kang leaves on November 5. The MSCI decision is on November 11; index funds hold ~13 million MSTR shares (3.1% of the basic shares). Any change will take effect at the November 30 close. JPMorgan estimates the removal could create ~$2.8 billion in selling pressure.
🎯 Bottom line: The $75.4–76.3K range is the decision zone. A 4h close above $76.3K and an RSI recovery could open the way to $78.5K, then $80K. If the daily close falls below $75.4K, the “institutional cost basis” narrative breaks down and the gap at $73K comes into play. Going long only makes sense with a close above $76.3K, with a stop below $75.3K.
📌 Do you think the MSCI decision will hit BTC, or just MSTR? Let us know in the comments.
#Strategy #Bitcoin #MSTR #BTC $BTC
This is not financial advice.
📌 The real numbers (Strategy 8-K + Q3 2026, October 25–29; Binance spot, November 1):
• Total BTC: 848,517 (~4.04% of the total supply)
• Average cost: $75,446, totaling $64.02 billion
• BTC spot price: $77,594, just 2.8% above cost
• BTC Yield (year to date): -3.7% (it was +4.5% in July)
• October 19–25: 0 BTC purchased, $204.9M in STRC buybacks
📉 Technical read (4h BTC): RSI at 22.9, in oversold territory; price is below SMA20 ($78,506) and EMA26 ($78,644). The key detail: the lower Bollinger Band is at $75,459, almost exactly in line with Strategy's average cost. Institutional cost basis and technical support are aligned.
🧠 The real issue: $5.41 billion in shares were sold in Q3, but only $588 million went toward BTC purchases. The company is directing capital toward shoring up its 12% STRC preferred stock, not BTC. The thesis that “BTC per share keeps rising” hasn't held up this year.
🐋 Risk calendar: CFO Andrew Kang leaves on November 5. The MSCI decision is on November 11; index funds hold ~13 million MSTR shares (3.1% of the basic shares). Any change will take effect at the November 30 close. JPMorgan estimates the removal could create ~$2.8 billion in selling pressure.
🎯 Bottom line: The $75.4–76.3K range is the decision zone. A 4h close above $76.3K and an RSI recovery could open the way to $78.5K, then $80K. If the daily close falls below $75.4K, the “institutional cost basis” narrative breaks down and the gap at $73K comes into play. Going long only makes sense with a close above $76.3K, with a stop below $75.3K.
📌 Do you think the MSCI decision will hit BTC, or just MSTR? Let us know in the comments.
#Strategy #Bitcoin #MSTR #BTC $BTC
This is not financial advice.
92
·
--
#AvalancheTreasuryFlagsGoingConcernRisk
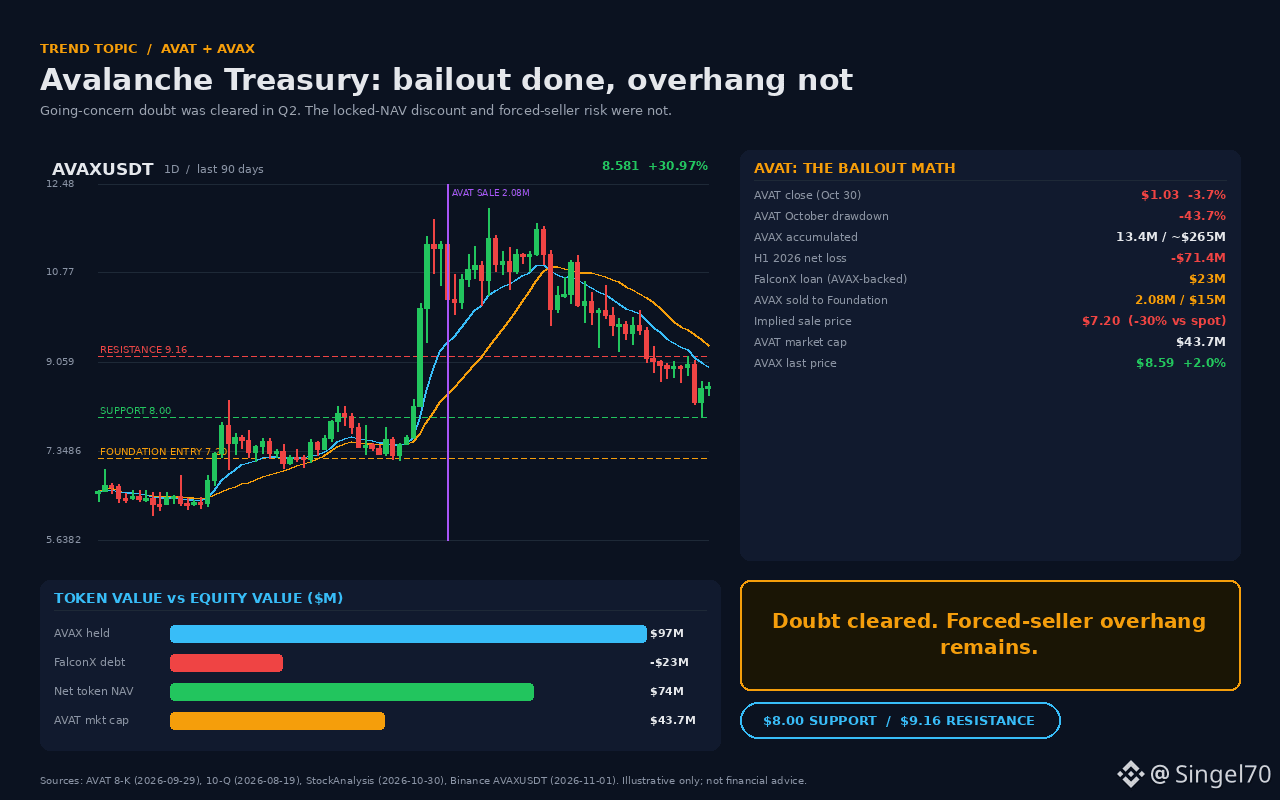
“AVAX is collapsing” headlines are pointing at the wrong target: the risk isn’t in the network, but in AVAT’s locked balance sheet.
📌 The actual numbers (Nov 1, 2026, 04:00 UTC)
• AVAT close: $1.03 (Oct 30), down 43.7% in October; 52-week range: $0.29–$2.53
• AVAT accumulated ~13.4M AVAX at a cost of ~$265M; value as of March 31, 2026: ~$123M
• Q1 2026 net loss: -$26.8M; H1 2026 net loss: -$71.4M
• Sept 23: 2.08M locked AVAX sold to the Avalanche Foundation for $15M → ~$7.20/AVAX; spot price that day was $10.26 (about a 30% discount)
Source: SEC 8-K/10-Q, StockAnalysis, Binance
📉 Technical analysis ($AVAX, 1D)
• Price: $8.59; 30-day range: $8.00–$11.73, 60-day low: $7.04
• 4H RSI: 36.9; price is below the SMA20 ($8.61) and EMA26 ($8.65)
• Support at $8.00. A daily close below could lead to tests of $7.20 and $7.04. Resistance at $9.16.
🐋 Flow evidence
• Going-concern doubts were raised in the Q1 10-Q; the Q2 10-Q said they had been “alleviated” following the SPAC merger and a $23M FalconX loan secured by AVAX. The company isn’t going under, but its balance sheet is still tied to the token price.
• The 2.08M AVAX sold came from locked tokens, not liquid holdings; the weighted average lock-up period fell to ~16.5 months. The Foundation bought back its own token at a discount.
• Remaining ~11.3M AVAX ≈ $97M; after subtracting $23M in debt, net value is ~$74M. AVAT’s market cap is $43.7M → about a 41% discount. But its NAV is locked and leveraged.
🎯 Plan
• Company risk ≠ network risk. The main pressure on AVAX is the possibility that AVAT will have to sell its remaining collateral.
• Holding above $8.00 → target $9.16. Daily close below $8.00 → $7.20/$7.04; no aggressive longs here.
• Bias: neutral to bearish in the short term. The Foundation’s purchase level was around $7.20, so a bounce could follow.
📌 Do you think AVAT’s discount is an opportunity or a locked-NAV trap? Share your thoughts in the comments.
#AVAX #Avalanche #Crypto #Altcoins
$AVAX
Not financial advice.
#AvalancheTreasuryFlagsGoingConcernRisk
“AVAX is collapsing” headlines are pointing at the wrong target: the risk isn’t in the network, but in AVAT’s locked balance sheet.
📌 The actual numbers (Nov 1, 2026, 04:00 UTC)
• AVAT close: $1.03 (Oct 30), down 43.7% in October; 52-week range: $0.29–$2.53
• AVAT accumulated ~13.4M AVAX at a cost of ~$265M; value as of March 31, 2026: ~$123M
• Q1 2026 net loss: -$26.8M; H1 2026 net loss: -$71.4M
• Sept 23: 2.08M locked AVAX sold to the Avalanche Foundation for $15M → ~$7.20/AVAX; spot price that day was $10.26 (about a 30% discount)
Source: SEC 8-K/10-Q, StockAnalysis, Binance
📉 Technical analysis ($AVAX , 1D)
• Price: $8.59; 30-day range: $8.00–$11.73, 60-day low: $7.04
• 4H RSI: 36.9; price is below the SMA20 ($8.61) and EMA26 ($8.65)
• Support at $8.00. A daily close below could lead to tests of $7.20 and $7.04. Resistance at $9.16.
🐋 Flow evidence
• Going-concern doubts were raised in the Q1 10-Q; the Q2 10-Q said they had been “alleviated” following the SPAC merger and a $23M FalconX loan secured by AVAX. The company isn’t going under, but its balance sheet is still tied to the token price.
• The 2.08M AVAX sold came from locked tokens, not liquid holdings; the weighted average lock-up period fell to ~16.5 months. The Foundation bought back its own token at a discount.
• Remaining ~11.3M AVAX ≈ $97M; after subtracting $23M in debt, net value is ~$74M. AVAT’s market cap is $43.7M → about a 41% discount. But its NAV is locked and leveraged.
🎯 Plan
• Company risk ≠ network risk. The main pressure on AVAX is the possibility that AVAT will have to sell its remaining collateral.
• Holding above $8.00 → target $9.16. Daily close below $8.00 → $7.20/$7.04; no aggressive longs here.
• Bias: neutral to bearish in the short term. The Foundation’s purchase level was around $7.20, so a bounce could follow.
📌 Do you think AVAT’s discount is an opportunity or a locked-NAV trap? Share your thoughts in the comments.
#AVAX #Avalanche #Crypto #Altcoins
$AVAX
Not financial advice.
“AVAX is collapsing” headlines are pointing at the wrong target: the risk isn’t in the network, but in AVAT’s locked balance sheet.
📌 The actual numbers (Nov 1, 2026, 04:00 UTC)
• AVAT close: $1.03 (Oct 30), down 43.7% in October; 52-week range: $0.29–$2.53
• AVAT accumulated ~13.4M AVAX at a cost of ~$265M; value as of March 31, 2026: ~$123M
• Q1 2026 net loss: -$26.8M; H1 2026 net loss: -$71.4M
• Sept 23: 2.08M locked AVAX sold to the Avalanche Foundation for $15M → ~$7.20/AVAX; spot price that day was $10.26 (about a 30% discount)
Source: SEC 8-K/10-Q, StockAnalysis, Binance
📉 Technical analysis ($AVAX , 1D)
• Price: $8.59; 30-day range: $8.00–$11.73, 60-day low: $7.04
• 4H RSI: 36.9; price is below the SMA20 ($8.61) and EMA26 ($8.65)
• Support at $8.00. A daily close below could lead to tests of $7.20 and $7.04. Resistance at $9.16.
🐋 Flow evidence
• Going-concern doubts were raised in the Q1 10-Q; the Q2 10-Q said they had been “alleviated” following the SPAC merger and a $23M FalconX loan secured by AVAX. The company isn’t going under, but its balance sheet is still tied to the token price.
• The 2.08M AVAX sold came from locked tokens, not liquid holdings; the weighted average lock-up period fell to ~16.5 months. The Foundation bought back its own token at a discount.
• Remaining ~11.3M AVAX ≈ $97M; after subtracting $23M in debt, net value is ~$74M. AVAT’s market cap is $43.7M → about a 41% discount. But its NAV is locked and leveraged.
🎯 Plan
• Company risk ≠ network risk. The main pressure on AVAX is the possibility that AVAT will have to sell its remaining collateral.
• Holding above $8.00 → target $9.16. Daily close below $8.00 → $7.20/$7.04; no aggressive longs here.
• Bias: neutral to bearish in the short term. The Foundation’s purchase level was around $7.20, so a bounce could follow.
📌 Do you think AVAT’s discount is an opportunity or a locked-NAV trap? Share your thoughts in the comments.
#AVAX #Avalanche #Crypto #Altcoins
$AVAX
Not financial advice.
70
·
--
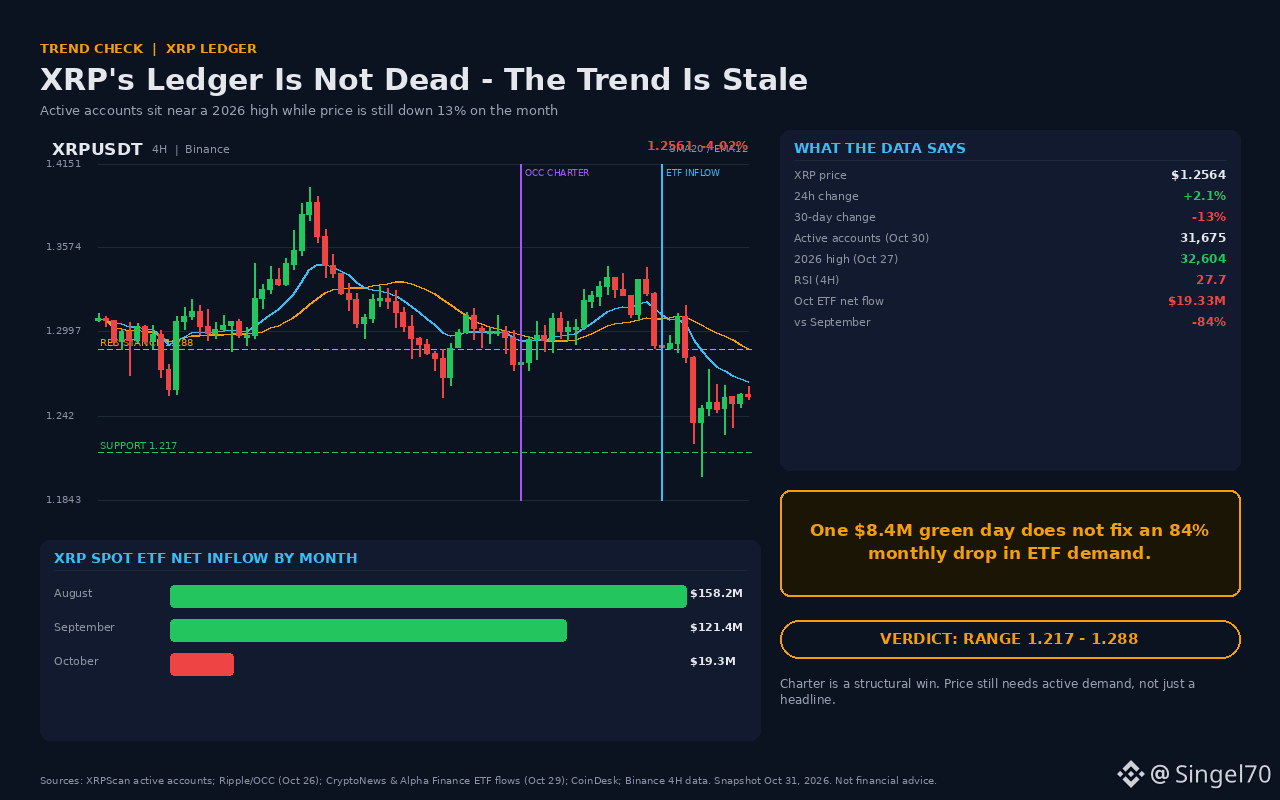
#XRPActiveWalletsHitSecondLowestOf2026 The trend headline is from July; XRPL's current data is near its 2026 peak.
📌 Actual figures (October 31, 2026):
- $XRP 1.2564 USDT, 24h +2.1% (Binance)
- Active accounts: 31,675 (Oct 30), 2026 peak 32,604 (Oct 27) - XRPScan
- 30-day change: -13% (Coinpaper, Oct 29)
- RSI (4h): 27.7
📉 Technical analysis: Price is below the SMA20 (1.288), and the 4h RSI is in oversold territory. 1.217 is the lower Bollinger Band and horizontal support; 1.288 is the first significant resistance. So, it's oversold, but there's no trend confirmation.
🐋 Flows and news: On October 26, the OCC gave Ripple National Trust Bank final approval (Ripple/CoinDesk). On October 29, XRP spot ETFs saw $8.43 million in inflows—the largest single-day inflow in October (CryptoNews/Alpha Finance). But the monthly total is just $19.33 million; September's was $121.4 million. So, one green day doesn't erase the 84% monthly decline.
🎯 Plan: A 4h close above 1.217 → test of 1.288. A close above 1.288 would open the way to 1.33–1.35. A break below 1.217 would bring 1.17, followed by the risk of 1.10, into view. News flow is structurally positive; price is still range-bound. So, for direction, I’d look not just at the news, but for a high-volume close above 1.288.
📌 Do you think they’ll keep XRP in this range, or will the bank license news be priced in with a delay? Let’s discuss in the comments.
#XRP #XRPLedger #Crypto #BinanceSquare
This is not financial advice.
#XRPActiveWalletsHitSecondLowestOf2026 The trend headline is from July; XRPL's current data is near its 2026 peak.
📌 Actual figures (October 31, 2026):
- $XRP 1.2564 USDT, 24h +2.1% (Binance)
- Active accounts: 31,675 (Oct 30), 2026 peak 32,604 (Oct 27) - XRPScan
- 30-day change: -13% (Coinpaper, Oct 29)
- RSI (4h): 27.7
📉 Technical analysis: Price is below the SMA20 (1.288), and the 4h RSI is in oversold territory. 1.217 is the lower Bollinger Band and horizontal support; 1.288 is the first significant resistance. So, it's oversold, but there's no trend confirmation.
🐋 Flows and news: On October 26, the OCC gave Ripple National Trust Bank final approval (Ripple/CoinDesk). On October 29, XRP spot ETFs saw $8.43 million in inflows—the largest single-day inflow in October (CryptoNews/Alpha Finance). But the monthly total is just $19.33 million; September's was $121.4 million. So, one green day doesn't erase the 84% monthly decline.
🎯 Plan: A 4h close above 1.217 → test of 1.288. A close above 1.288 would open the way to 1.33–1.35. A break below 1.217 would bring 1.17, followed by the risk of 1.10, into view. News flow is structurally positive; price is still range-bound. So, for direction, I’d look not just at the news, but for a high-volume close above 1.288.
📌 Do you think they’ll keep XRP in this range, or will the bank license news be priced in with a delay? Let’s discuss in the comments.
#XRP #XRPLedger #Crypto #BinanceSquare
This is not financial advice.
📌 Actual figures (October 31, 2026):
- $XRP 1.2564 USDT, 24h +2.1% (Binance)
- Active accounts: 31,675 (Oct 30), 2026 peak 32,604 (Oct 27) - XRPScan
- 30-day change: -13% (Coinpaper, Oct 29)
- RSI (4h): 27.7
📉 Technical analysis: Price is below the SMA20 (1.288), and the 4h RSI is in oversold territory. 1.217 is the lower Bollinger Band and horizontal support; 1.288 is the first significant resistance. So, it's oversold, but there's no trend confirmation.
🐋 Flows and news: On October 26, the OCC gave Ripple National Trust Bank final approval (Ripple/CoinDesk). On October 29, XRP spot ETFs saw $8.43 million in inflows—the largest single-day inflow in October (CryptoNews/Alpha Finance). But the monthly total is just $19.33 million; September's was $121.4 million. So, one green day doesn't erase the 84% monthly decline.
🎯 Plan: A 4h close above 1.217 → test of 1.288. A close above 1.288 would open the way to 1.33–1.35. A break below 1.217 would bring 1.17, followed by the risk of 1.10, into view. News flow is structurally positive; price is still range-bound. So, for direction, I’d look not just at the news, but for a high-volume close above 1.288.
📌 Do you think they’ll keep XRP in this range, or will the bank license news be priced in with a delay? Let’s discuss in the comments.
#XRP #XRPLedger #Crypto #BinanceSquare
This is not financial advice.
99
·
--
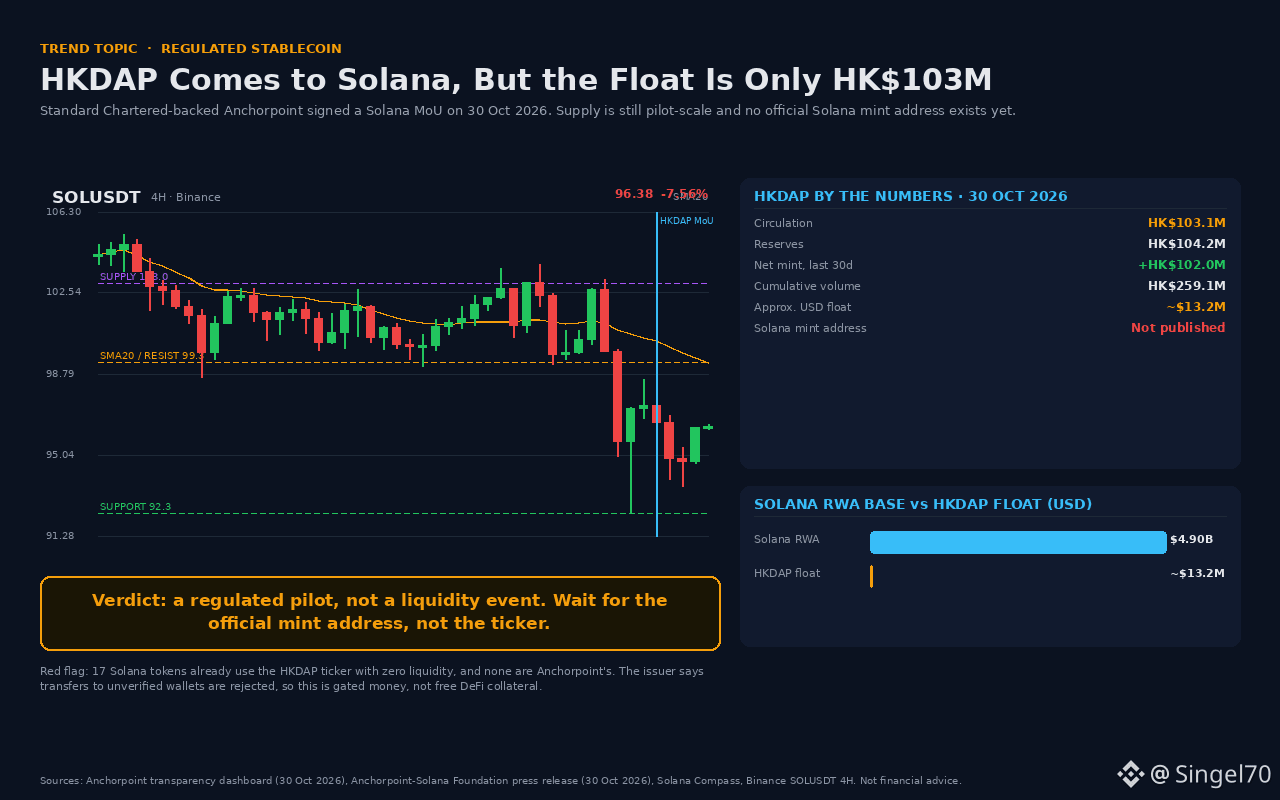
#HKDollarStablecoinHKDAPToLaunchOnSolana Hong Kong's regulated HKD stablecoin is coming to Solana, but the "massive liquidity" the market is talking about isn't here yet.
📌 The real numbers (Anchorpoint transparency dashboard, October 30, 2026):
• Circulation: HK$103.1M (~$13.2M)
• Reserves: HK$104.2M
• Net minting over the last 30 days: +HK$102.0M
• Cumulative volume: HK$259.1M
• Solana mint address: not yet published
So nearly all of the supply was minted in the last 30 days, and the product is still in the Beta Access stage. This is a pilot: compared with Solana's $4.9B tokenized RWA base, the float is less than 0.3%.
📉 $SOL reading (Binance 4H, October 31, 00:24 UTC):
• Price ~96.4, 24h +3.5% (recovery)
• Below SMA20 at 99.3, RSI 32.8
• Support 92.3 | Resistance 99.3, then 103.0
• Volume is weak; this bounce is not yet a trend reversal
🐋 On-chain warning: There are at least 17 tokens using the HKDAP ticker on Solana; all have zero liquidity, and none belong to Anchorpoint. The issuer automatically rejects transfers to unverified wallets. In other words, this isn't permissionless DeFi collateral; it's gated institutional money.
🎯 Plan: Look at the contract, not the headline. Don't touch any token named "HKDAP" until the official Solana mint address is published. For $SOL, holding above 92.3 supports a long position; if 92.3 breaks, the 88–89 zone is the target. The upside isn't confirmed without a 4H close above 99.3. Bias: neutral-to-positive; volume confirmation is essential.
📌 Do you think this partnership will bring real TVL to Solana, or is it just a headline? Let's discuss in the comments.
#HKDAP #Solana #Stablecoin #RWA
This is not financial advice.
#HKDollarStablecoinHKDAPToLaunchOnSolana Hong Kong's regulated HKD stablecoin is coming to Solana, but the "massive liquidity" the market is talking about isn't here yet.
📌 The real numbers (Anchorpoint transparency dashboard, October 30, 2026):
• Circulation: HK$103.1M (~$13.2M)
• Reserves: HK$104.2M
• Net minting over the last 30 days: +HK$102.0M
• Cumulative volume: HK$259.1M
• Solana mint address: not yet published
So nearly all of the supply was minted in the last 30 days, and the product is still in the Beta Access stage. This is a pilot: compared with Solana's $4.9B tokenized RWA base, the float is less than 0.3%.
📉 $SOL reading (Binance 4H, October 31, 00:24 UTC):
• Price ~96.4, 24h +3.5% (recovery)
• Below SMA20 at 99.3, RSI 32.8
• Support 92.3 | Resistance 99.3, then 103.0
• Volume is weak; this bounce is not yet a trend reversal
🐋 On-chain warning: There are at least 17 tokens using the HKDAP ticker on Solana; all have zero liquidity, and none belong to Anchorpoint. The issuer automatically rejects transfers to unverified wallets. In other words, this isn't permissionless DeFi collateral; it's gated institutional money.
🎯 Plan: Look at the contract, not the headline. Don't touch any token named "HKDAP" until the official Solana mint address is published. For $SOL , holding above 92.3 supports a long position; if 92.3 breaks, the 88–89 zone is the target. The upside isn't confirmed without a 4H close above 99.3. Bias: neutral-to-positive; volume confirmation is essential.
📌 Do you think this partnership will bring real TVL to Solana, or is it just a headline? Let's discuss in the comments.
#HKDAP #Solana #Stablecoin #RWA
This is not financial advice.
📌 The real numbers (Anchorpoint transparency dashboard, October 30, 2026):
• Circulation: HK$103.1M (~$13.2M)
• Reserves: HK$104.2M
• Net minting over the last 30 days: +HK$102.0M
• Cumulative volume: HK$259.1M
• Solana mint address: not yet published
So nearly all of the supply was minted in the last 30 days, and the product is still in the Beta Access stage. This is a pilot: compared with Solana's $4.9B tokenized RWA base, the float is less than 0.3%.
📉 $SOL reading (Binance 4H, October 31, 00:24 UTC):
• Price ~96.4, 24h +3.5% (recovery)
• Below SMA20 at 99.3, RSI 32.8
• Support 92.3 | Resistance 99.3, then 103.0
• Volume is weak; this bounce is not yet a trend reversal
🐋 On-chain warning: There are at least 17 tokens using the HKDAP ticker on Solana; all have zero liquidity, and none belong to Anchorpoint. The issuer automatically rejects transfers to unverified wallets. In other words, this isn't permissionless DeFi collateral; it's gated institutional money.
🎯 Plan: Look at the contract, not the headline. Don't touch any token named "HKDAP" until the official Solana mint address is published. For $SOL , holding above 92.3 supports a long position; if 92.3 breaks, the 88–89 zone is the target. The upside isn't confirmed without a 4H close above 99.3. Bias: neutral-to-positive; volume confirmation is essential.
📌 Do you think this partnership will bring real TVL to Solana, or is it just a headline? Let's discuss in the comments.
#HKDAP #Solana #Stablecoin #RWA
This is not financial advice.
1
109
·
--
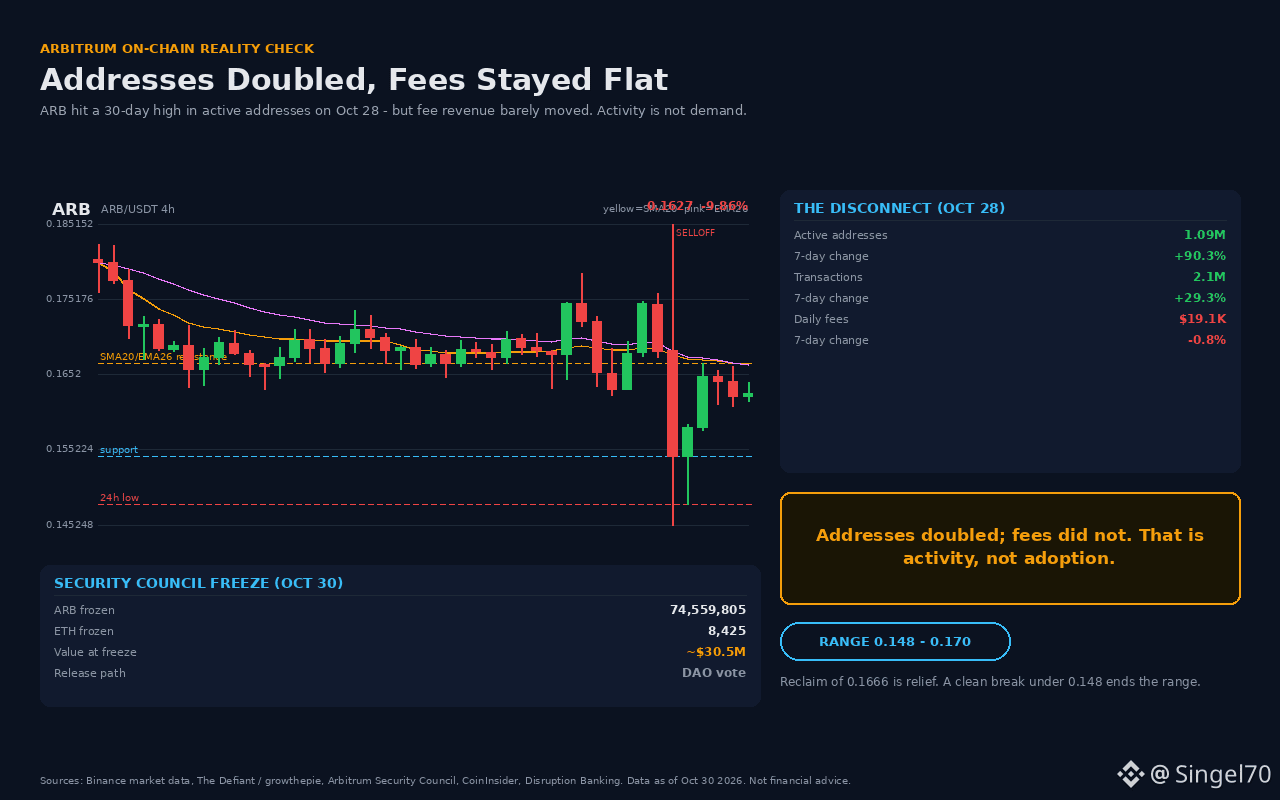
#Arbitrum 1.09 million address record arrived, but the detail nobody is talking about: fees stayed flat.
📌 Real numbers (growthepie / The Defiant, October 28):
• Daily active addresses: ~1.09M (+90.3% weekly)
• Transaction count: 2.1M (only +29.3%)
• Daily user fees: ~$19.1K (-0.8%)
• Previous peak on October 21: 571.767 addresses
📉 Interpretation: While the number of addresses doubled, transactions and fees did not rise at the same rate. This does not look like organic demand; it looks more like low-cost, automated, or campaign-driven interaction. Number of addresses =/= number of users.
🐋 October 30: By extraordinary authority, the Arbitrum Security Council moved 74.56M ARB + 8.425 ETH tied to the Binance exploit into a frozen wallet. Note: Some headlines say "$74.5M"; the correct figure is 74.56M tokens, worth about ~$30.5M. Release is only possible through a DAO vote.
📈 ARB 4h: 0.1627 (-3.7%), below SMA20/EMA26 0.1666, RSI 45.6. Range 0.148 - 0.170.
🎯 Plan: 4h close above 0.1666 -> 0.170 / 0.1765. Below 0.1543 -> 0.148 defense. If 0.148 breaks, the scenario is invalid; stop discipline is essential. Direction: neutral, no reason to long before confirmation arrives.
📌 Do you think this address increase is real users, or bounty hunters? 👇
#Arbitrum #ARB #OnChain $ARB $ETH
Not financial advice.
#Arbitrum 1.09 million address record arrived, but the detail nobody is talking about: fees stayed flat.
📌 Real numbers (growthepie / The Defiant, October 28):
• Daily active addresses: ~1.09M (+90.3% weekly)
• Transaction count: 2.1M (only +29.3%)
• Daily user fees: ~$19.1K (-0.8%)
• Previous peak on October 21: 571.767 addresses
📉 Interpretation: While the number of addresses doubled, transactions and fees did not rise at the same rate. This does not look like organic demand; it looks more like low-cost, automated, or campaign-driven interaction. Number of addresses =/= number of users.
🐋 October 30: By extraordinary authority, the Arbitrum Security Council moved 74.56M ARB + 8.425 ETH tied to the Binance exploit into a frozen wallet. Note: Some headlines say "$74.5M"; the correct figure is 74.56M tokens, worth about ~$30.5M. Release is only possible through a DAO vote.
📈 ARB 4h: 0.1627 (-3.7%), below SMA20/EMA26 0.1666, RSI 45.6. Range 0.148 - 0.170.
🎯 Plan: 4h close above 0.1666 -> 0.170 / 0.1765. Below 0.1543 -> 0.148 defense. If 0.148 breaks, the scenario is invalid; stop discipline is essential. Direction: neutral, no reason to long before confirmation arrives.
📌 Do you think this address increase is real users, or bounty hunters? 👇
#Arbitrum #ARB #OnChain $ARB $ETH
Not financial advice.
📌 Real numbers (growthepie / The Defiant, October 28):
• Daily active addresses: ~1.09M (+90.3% weekly)
• Transaction count: 2.1M (only +29.3%)
• Daily user fees: ~$19.1K (-0.8%)
• Previous peak on October 21: 571.767 addresses
📉 Interpretation: While the number of addresses doubled, transactions and fees did not rise at the same rate. This does not look like organic demand; it looks more like low-cost, automated, or campaign-driven interaction. Number of addresses =/= number of users.
🐋 October 30: By extraordinary authority, the Arbitrum Security Council moved 74.56M ARB + 8.425 ETH tied to the Binance exploit into a frozen wallet. Note: Some headlines say "$74.5M"; the correct figure is 74.56M tokens, worth about ~$30.5M. Release is only possible through a DAO vote.
📈 ARB 4h: 0.1627 (-3.7%), below SMA20/EMA26 0.1666, RSI 45.6. Range 0.148 - 0.170.
🎯 Plan: 4h close above 0.1666 -> 0.170 / 0.1765. Below 0.1543 -> 0.148 defense. If 0.148 breaks, the scenario is invalid; stop discipline is essential. Direction: neutral, no reason to long before confirmation arrives.
📌 Do you think this address increase is real users, or bounty hunters? 👇
#Arbitrum #ARB #OnChain $ARB $ETH
Not financial advice.
156
·
--
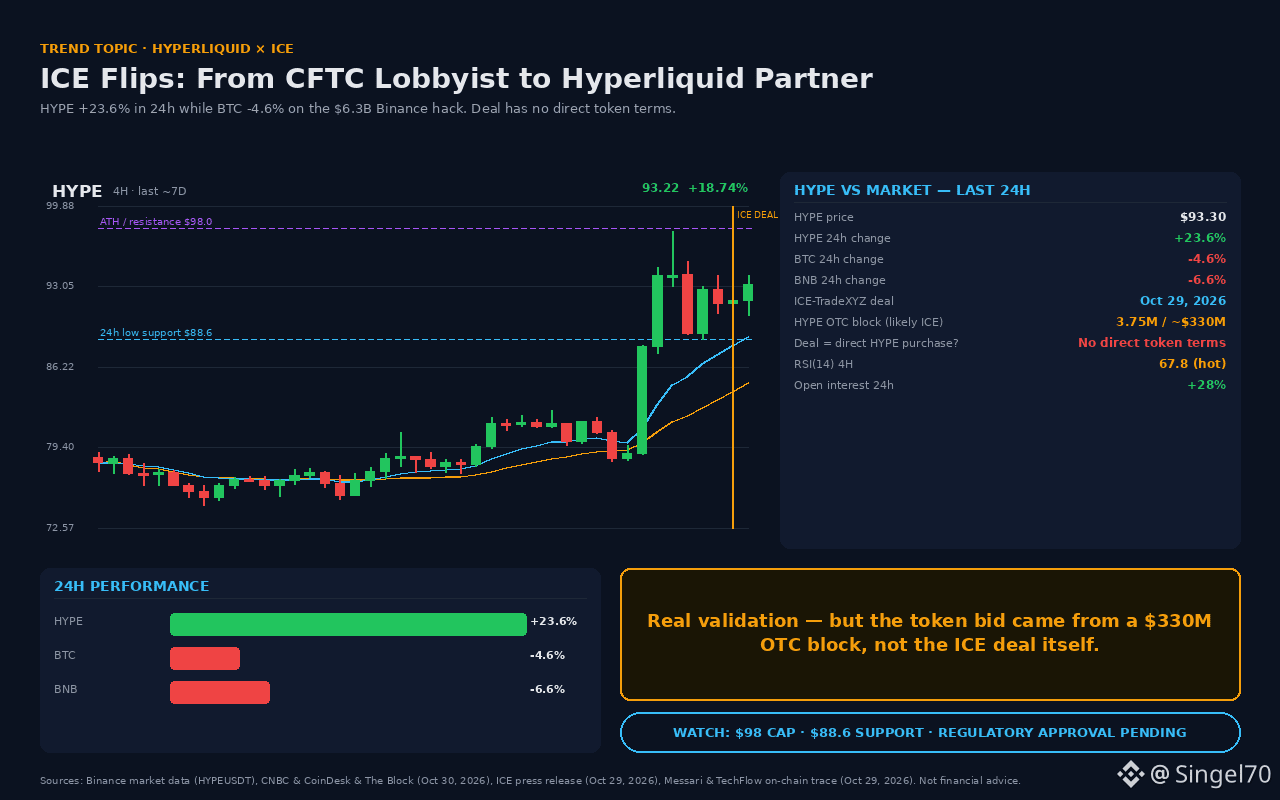
#Hyperliquid HYPE rose 23% as the market crashed: ICE, the owner of the NYSE, is building an exchange on top of the protocol it complained about to the CFTC in May. This is a comeback story.
📌 Real numbers (Oct. 30, 2026, ~18:25 TRT / Binance):
• HYPE $93.30 — 24h +23.6% (24h range $88.58–$97.74)
• BTC $77,754 — 24h -4.6%
• BNB $702 — 24h -6.6% (following the $6.3 billion Binance hack)
• The ICE–TradeXYZ deal was announced on Oct. 29; HYPE rose 15% on the news
• Open interest (OI) +28% in 24h, volume ~8x
📉/📈 Technical read (4h):
Price at $93.3, above the SMA20 at $84.9; RSI 67.8 (near overbought). Resistance: ATH $97.96 / $98. Support: 24h low $88.6, with the SMA20 at $84.9 below that. Risk/reward is weak unless $98 breaks.
🐋 On-chain evidence:
The real catalyst isn’t the deal. ICE is believed to be the buyer of the 3.75M HYPE (~$330M) that Hyperliquid Labs sold OTC in September; a 625K HYPE tranche was tracked to a TradeXYZ wallet (Messari, TechFlow). In other words, demand came not from the deal announcement, but from supply being taken off the market. The deal does not include a direct HYPE purchase and is still subject to CFTC approval.
🎯 Bottom line:
The setup is bullish (TradFi rails + supply lockup), but the headline is misleading. A daily close above $98 = trend continuation; below $88.6 = this news has finished being priced in. For now, waiting for a pullback is wiser than chasing.
📌 Do you think $98 will break, or has the news already been sold? Let’s discuss in the comments.
#Hyperliquid #HYPE $HYPE #DeFi #BinanceSquare
This is not financial advice.
#Hyperliquid HYPE rose 23% as the market crashed: ICE, the owner of the NYSE, is building an exchange on top of the protocol it complained about to the CFTC in May. This is a comeback story.
📌 Real numbers (Oct. 30, 2026, ~18:25 TRT / Binance):
• HYPE $93.30 — 24h +23.6% (24h range $88.58–$97.74)
• BTC $77,754 — 24h -4.6%
• BNB $702 — 24h -6.6% (following the $6.3 billion Binance hack)
• The ICE–TradeXYZ deal was announced on Oct. 29; HYPE rose 15% on the news
• Open interest (OI) +28% in 24h, volume ~8x
📉/📈 Technical read (4h):
Price at $93.3, above the SMA20 at $84.9; RSI 67.8 (near overbought). Resistance: ATH $97.96 / $98. Support: 24h low $88.6, with the SMA20 at $84.9 below that. Risk/reward is weak unless $98 breaks.
🐋 On-chain evidence:
The real catalyst isn’t the deal. ICE is believed to be the buyer of the 3.75M HYPE (~$330M) that Hyperliquid Labs sold OTC in September; a 625K HYPE tranche was tracked to a TradeXYZ wallet (Messari, TechFlow). In other words, demand came not from the deal announcement, but from supply being taken off the market. The deal does not include a direct HYPE purchase and is still subject to CFTC approval.
🎯 Bottom line:
The setup is bullish (TradFi rails + supply lockup), but the headline is misleading. A daily close above $98 = trend continuation; below $88.6 = this news has finished being priced in. For now, waiting for a pullback is wiser than chasing.
📌 Do you think $98 will break, or has the news already been sold? Let’s discuss in the comments.
#Hyperliquid #HYPE $HYPE #DeFi #BinanceSquare
This is not financial advice.
📌 Real numbers (Oct. 30, 2026, ~18:25 TRT / Binance):
• HYPE $93.30 — 24h +23.6% (24h range $88.58–$97.74)
• BTC $77,754 — 24h -4.6%
• BNB $702 — 24h -6.6% (following the $6.3 billion Binance hack)
• The ICE–TradeXYZ deal was announced on Oct. 29; HYPE rose 15% on the news
• Open interest (OI) +28% in 24h, volume ~8x
📉/📈 Technical read (4h):
Price at $93.3, above the SMA20 at $84.9; RSI 67.8 (near overbought). Resistance: ATH $97.96 / $98. Support: 24h low $88.6, with the SMA20 at $84.9 below that. Risk/reward is weak unless $98 breaks.
🐋 On-chain evidence:
The real catalyst isn’t the deal. ICE is believed to be the buyer of the 3.75M HYPE (~$330M) that Hyperliquid Labs sold OTC in September; a 625K HYPE tranche was tracked to a TradeXYZ wallet (Messari, TechFlow). In other words, demand came not from the deal announcement, but from supply being taken off the market. The deal does not include a direct HYPE purchase and is still subject to CFTC approval.
🎯 Bottom line:
The setup is bullish (TradFi rails + supply lockup), but the headline is misleading. A daily close above $98 = trend continuation; below $88.6 = this news has finished being priced in. For now, waiting for a pullback is wiser than chasing.
📌 Do you think $98 will break, or has the news already been sold? Let’s discuss in the comments.
#Hyperliquid #HYPE $HYPE #DeFi #BinanceSquare
This is not financial advice.
166
·
--
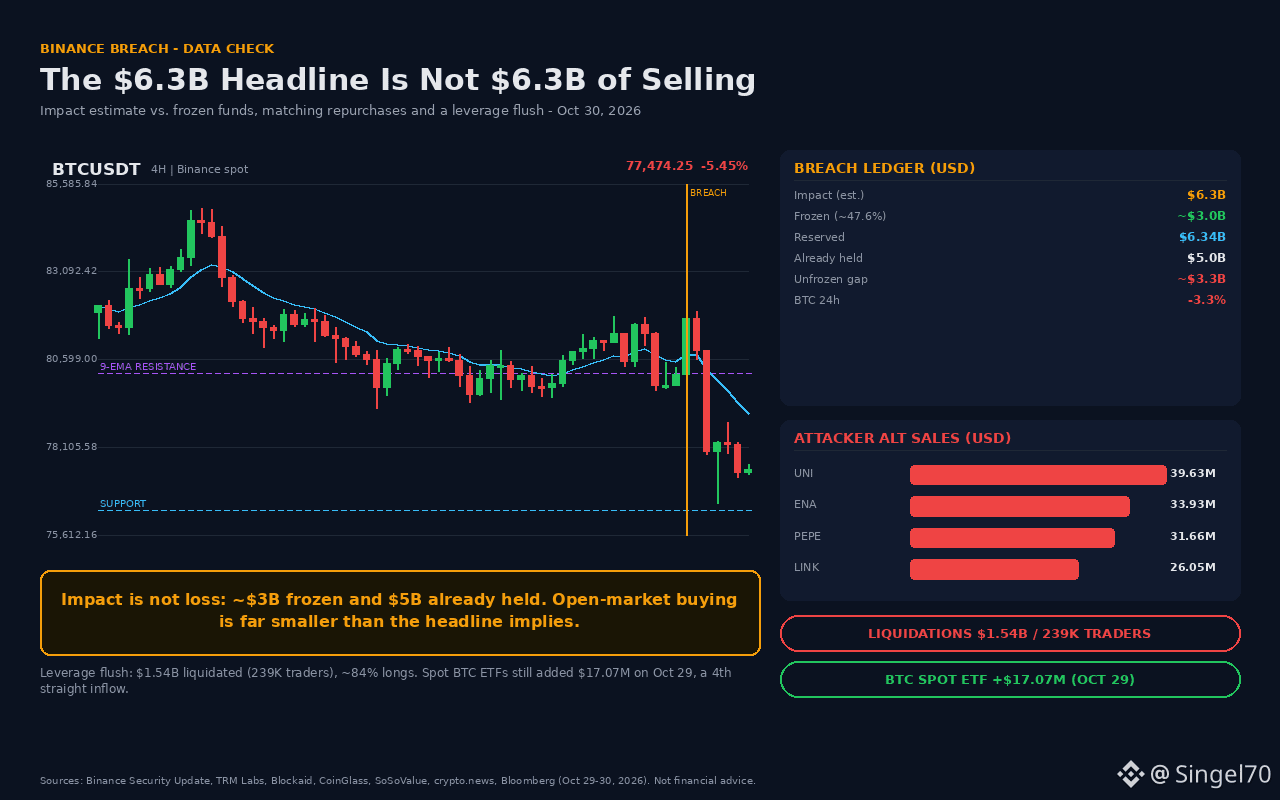
#BinanceHack $6.3 billion headline, but it’s not actually $6.3 billion in sales. What exactly is the market pricing in?
📌 The real numbers (October 30, 2026, UTC):
• Amount affected (Binance estimate): ~$6.3B
• Frozen on-chain: ~$3.0B (≈47.6%)
• Allocated reserve: $6.34B; $5.0B of it is already in the same tokens
• UNI/PEPE/ENA/LINK sold by the attacker: 70,480 ETH worth $158.25M
• $BNB 24s: -5.4% (among the steepest declines of the majors)
📉 $BTC 4H: $77,474 (-3.3%). Price is below the 9-EMA at ~$80,188; RSI is 33, and price is near the lower BB band ($77,212). Support: $76,300; resistance: $80,188. CoinGlass 24h: ~$1.54B in liquidations, ~239K traders, mostly longs.
🐋 The real story: Binance is covering the losses with SAFU + company funds and buying back the stolen altcoins “one-for-one.” But most purchases are OTC and come from tokens already held, so the new buying pressure in the spot market is smaller than the headline suggests. On the same day, $BTC spot ETFs recorded net inflows of +$17.07M for the fourth consecutive day.
🎯 Plan: Holding above $76,300 favors longs; a daily close above $80,188 would confirm a trend reversal. If $76,300 breaks, the target is $73,000 (200DMA). Spot/DCA is more solid than leveraged longs; headline sales > actual supply. Direction: cautious, but not panicked.
📌 Do you think Binance’s buybacks will create real demand for altcoins, or will they remain invisible because they’re OTC?
#SAFU #Bitcoin #Crypto #Altcoins
This is not financial advice.
#BinanceHack $6.3 billion headline, but it’s not actually $6.3 billion in sales. What exactly is the market pricing in?
📌 The real numbers (October 30, 2026, UTC):
• Amount affected (Binance estimate): ~$6.3B
• Frozen on-chain: ~$3.0B (≈47.6%)
• Allocated reserve: $6.34B; $5.0B of it is already in the same tokens
• UNI/PEPE/ENA/LINK sold by the attacker: 70,480 ETH worth $158.25M
• $BNB 24s: -5.4% (among the steepest declines of the majors)
📉 $BTC 4H: $77,474 (-3.3%). Price is below the 9-EMA at ~$80,188; RSI is 33, and price is near the lower BB band ($77,212). Support: $76,300; resistance: $80,188. CoinGlass 24h: ~$1.54B in liquidations, ~239K traders, mostly longs.
🐋 The real story: Binance is covering the losses with SAFU + company funds and buying back the stolen altcoins “one-for-one.” But most purchases are OTC and come from tokens already held, so the new buying pressure in the spot market is smaller than the headline suggests. On the same day, $BTC spot ETFs recorded net inflows of +$17.07M for the fourth consecutive day.
🎯 Plan: Holding above $76,300 favors longs; a daily close above $80,188 would confirm a trend reversal. If $76,300 breaks, the target is $73,000 (200DMA). Spot/DCA is more solid than leveraged longs; headline sales > actual supply. Direction: cautious, but not panicked.
📌 Do you think Binance’s buybacks will create real demand for altcoins, or will they remain invisible because they’re OTC?
#SAFU #Bitcoin #Crypto #Altcoins
This is not financial advice.
📌 The real numbers (October 30, 2026, UTC):
• Amount affected (Binance estimate): ~$6.3B
• Frozen on-chain: ~$3.0B (≈47.6%)
• Allocated reserve: $6.34B; $5.0B of it is already in the same tokens
• UNI/PEPE/ENA/LINK sold by the attacker: 70,480 ETH worth $158.25M
• $BNB 24s: -5.4% (among the steepest declines of the majors)
📉 $BTC 4H: $77,474 (-3.3%). Price is below the 9-EMA at ~$80,188; RSI is 33, and price is near the lower BB band ($77,212). Support: $76,300; resistance: $80,188. CoinGlass 24h: ~$1.54B in liquidations, ~239K traders, mostly longs.
🐋 The real story: Binance is covering the losses with SAFU + company funds and buying back the stolen altcoins “one-for-one.” But most purchases are OTC and come from tokens already held, so the new buying pressure in the spot market is smaller than the headline suggests. On the same day, $BTC spot ETFs recorded net inflows of +$17.07M for the fourth consecutive day.
🎯 Plan: Holding above $76,300 favors longs; a daily close above $80,188 would confirm a trend reversal. If $76,300 breaks, the target is $73,000 (200DMA). Spot/DCA is more solid than leveraged longs; headline sales > actual supply. Direction: cautious, but not panicked.
📌 Do you think Binance’s buybacks will create real demand for altcoins, or will they remain invisible because they’re OTC?
#SAFU #Bitcoin #Crypto #Altcoins
This is not financial advice.
93
·
--
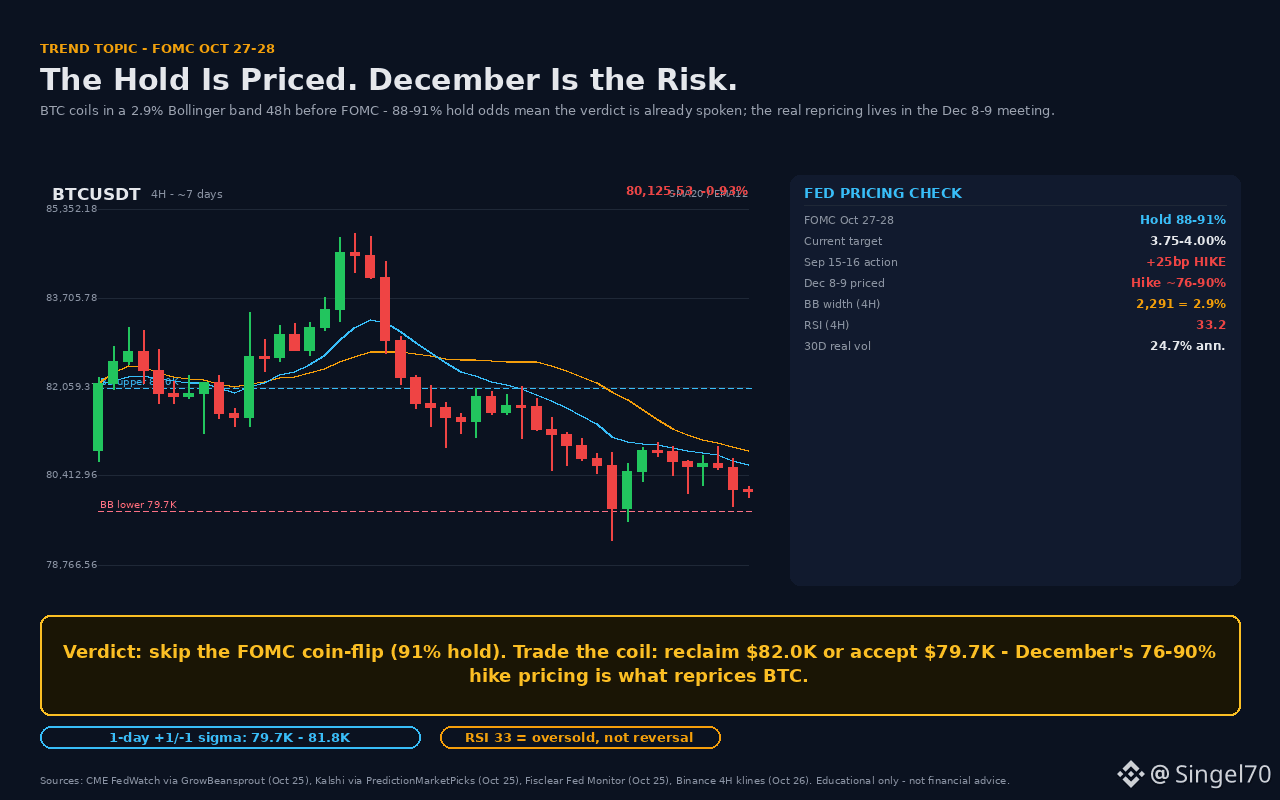
#FOMC Everyone is expecting an “FOMC surprise,” but the market has already priced in the surprise—the real bomb is hidden in December.
📌 Real numbers (with sources):
- CME FedWatch (Oct 25): 89.7% probability of holding rates at the Oct 27–28 meeting
- Kalshi prediction market (Oct 25): 91% hold, 8% hike, just 1% cut
- Fisclear Fed Monitor (Oct 25): The market is pricing in a 76% HIKE for Dec 8–9, rising to as high as 90% in some futures models
- Current target rate range: 3.75–4.00% (a +25 bp HIKE was made on Sept 16—this is a tightening cycle for the dollar; the “cut hopes” narrative is wrong)
- Weekend flush: $645M in positions liquidated, $504M of them long; BTC touched $79,770 (MarsBit / Square report, Oct 24–25)
📉 Reading the Binance 4H chart (Oct 26):
- Price ~$80,125: below the 20-period SMA ($80,893), RSI 33.2
- Bollinger Band range: $79,748–$82,039; band width is just ~$2,290 (2.9%). With 48 hours to go before the FOMC, such a tight coil is a classic volatility squeeze. The breakout direction will come from repricing, not the FOMC decision itself.
- 30-day realized volatility annualized at 24.7%; 1-day ±1 sigma range: $79,736–$81,824
🐋 No one is looking at the real angle: On Oct 25, Novogratz marked $79,000–$80,000 as the critical level—just above the lower Bollinger Band. What makes this support thesis unique is that the Fed hiked in September, and a 76–90% chance of another hike in December is still being priced in. There’s no “the Fed will turn on the air conditioning” scenario; the risk is always skewed to the upside.
🎯 Plan:
- Daily close above $82,040 (upper BB): the coil breaks, opening room toward the previous distribution zone
- Daily close below $79,750 (lower BB): Novogratz’s level fails, and a move below $78K could happen quickly
- I think the stronger approach isn’t to avoid the FOMC; it’s to watch whether December odds change the day after the decision. If the chance of a hike falls, expect relief; if it holds steady, the coil breaks. The downside is more fragile because RSI is at 33 and demand is weak.
Question: Are you closing your position on FOMC day, or waiting for the coil to break? Let me know in the comments.
This is not financial advice; it is a market analysis for educational purposes.
#FOMC #Bitcoin #Fed $BTC #Macro
#FOMC Everyone is expecting an “FOMC surprise,” but the market has already priced in the surprise—the real bomb is hidden in December.
📌 Real numbers (with sources):
- CME FedWatch (Oct 25): 89.7% probability of holding rates at the Oct 27–28 meeting
- Kalshi prediction market (Oct 25): 91% hold, 8% hike, just 1% cut
- Fisclear Fed Monitor (Oct 25): The market is pricing in a 76% HIKE for Dec 8–9, rising to as high as 90% in some futures models
- Current target rate range: 3.75–4.00% (a +25 bp HIKE was made on Sept 16—this is a tightening cycle for the dollar; the “cut hopes” narrative is wrong)
- Weekend flush: $645M in positions liquidated, $504M of them long; BTC touched $79,770 (MarsBit / Square report, Oct 24–25)
📉 Reading the Binance 4H chart (Oct 26):
- Price ~$80,125: below the 20-period SMA ($80,893), RSI 33.2
- Bollinger Band range: $79,748–$82,039; band width is just ~$2,290 (2.9%). With 48 hours to go before the FOMC, such a tight coil is a classic volatility squeeze. The breakout direction will come from repricing, not the FOMC decision itself.
- 30-day realized volatility annualized at 24.7%; 1-day ±1 sigma range: $79,736–$81,824
🐋 No one is looking at the real angle: On Oct 25, Novogratz marked $79,000–$80,000 as the critical level—just above the lower Bollinger Band. What makes this support thesis unique is that the Fed hiked in September, and a 76–90% chance of another hike in December is still being priced in. There’s no “the Fed will turn on the air conditioning” scenario; the risk is always skewed to the upside.
🎯 Plan:
- Daily close above $82,040 (upper BB): the coil breaks, opening room toward the previous distribution zone
- Daily close below $79,750 (lower BB): Novogratz’s level fails, and a move below $78K could happen quickly
- I think the stronger approach isn’t to avoid the FOMC; it’s to watch whether December odds change the day after the decision. If the chance of a hike falls, expect relief; if it holds steady, the coil breaks. The downside is more fragile because RSI is at 33 and demand is weak.
Question: Are you closing your position on FOMC day, or waiting for the coil to break? Let me know in the comments.
This is not financial advice; it is a market analysis for educational purposes.
#FOMC #Bitcoin #Fed $BTC #Macro
📌 Real numbers (with sources):
- CME FedWatch (Oct 25): 89.7% probability of holding rates at the Oct 27–28 meeting
- Kalshi prediction market (Oct 25): 91% hold, 8% hike, just 1% cut
- Fisclear Fed Monitor (Oct 25): The market is pricing in a 76% HIKE for Dec 8–9, rising to as high as 90% in some futures models
- Current target rate range: 3.75–4.00% (a +25 bp HIKE was made on Sept 16—this is a tightening cycle for the dollar; the “cut hopes” narrative is wrong)
- Weekend flush: $645M in positions liquidated, $504M of them long; BTC touched $79,770 (MarsBit / Square report, Oct 24–25)
📉 Reading the Binance 4H chart (Oct 26):
- Price ~$80,125: below the 20-period SMA ($80,893), RSI 33.2
- Bollinger Band range: $79,748–$82,039; band width is just ~$2,290 (2.9%). With 48 hours to go before the FOMC, such a tight coil is a classic volatility squeeze. The breakout direction will come from repricing, not the FOMC decision itself.
- 30-day realized volatility annualized at 24.7%; 1-day ±1 sigma range: $79,736–$81,824
🐋 No one is looking at the real angle: On Oct 25, Novogratz marked $79,000–$80,000 as the critical level—just above the lower Bollinger Band. What makes this support thesis unique is that the Fed hiked in September, and a 76–90% chance of another hike in December is still being priced in. There’s no “the Fed will turn on the air conditioning” scenario; the risk is always skewed to the upside.
🎯 Plan:
- Daily close above $82,040 (upper BB): the coil breaks, opening room toward the previous distribution zone
- Daily close below $79,750 (lower BB): Novogratz’s level fails, and a move below $78K could happen quickly
- I think the stronger approach isn’t to avoid the FOMC; it’s to watch whether December odds change the day after the decision. If the chance of a hike falls, expect relief; if it holds steady, the coil breaks. The downside is more fragile because RSI is at 33 and demand is weak.
Question: Are you closing your position on FOMC day, or waiting for the coil to break? Let me know in the comments.
This is not financial advice; it is a market analysis for educational purposes.
#FOMC #Bitcoin #Fed $BTC #Macro
70
·
--
Verified
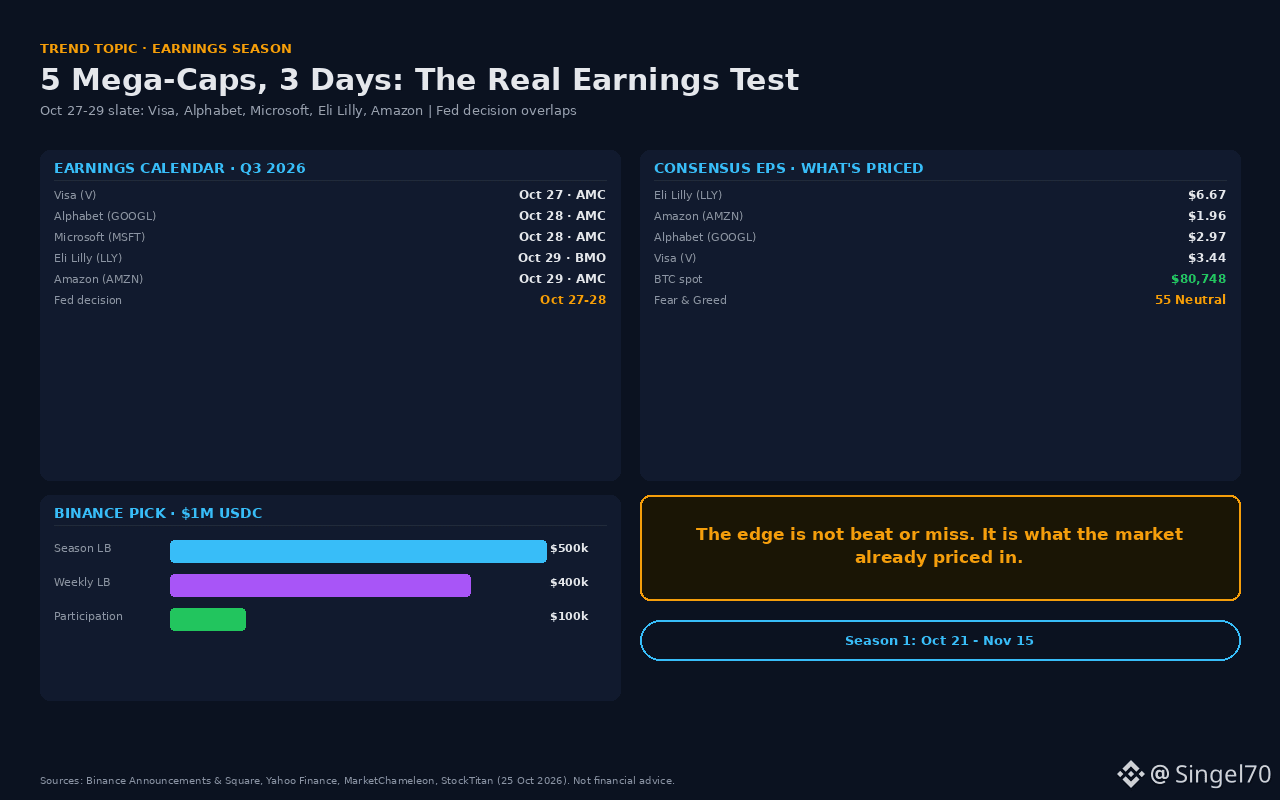
#EarningsSeason This week, the earnings calendar will determine crypto’s direction: 5 major reports in 3 days.
📌 Calendar (US, Q3 2026 · source: Yahoo Finance / MarketChameleon, Oct 25):
• Oct 27: Visa (V) — after market close
• Oct 28: Alphabet (GOOGL) + Microsoft (MSFT) — after market close
• Oct 29: Eli Lilly (LLY) — before market open | Amazon (AMZN) — after market close
• Same window: Fed rate decision, Oct 27–28
📊 Consensus EPS (market expectations):
• LLY $6.67 | AMZN $1.96 | GOOGL $2.97 | V $3.44
• The key point: a “beat” alone isn’t enough; the question is how much of the expectation is already priced in.
🐋 Crypto connection:
• BTC $80,748 (+0.5%) | ETH $2,354 (+1.2%)
• Fear & Greed: 55 (Neutral)
• Last week’s Nasdaq selloff pushed BTC below $80k; this week, AI capex guidance will determine risk appetite.
🎯 Binance Pick angle (campaign information, not investment advice):
• Season 1: Oct 21 – Nov 15, $1M USDC total
• Season LB $500k (top 20,000) | Weekly $400k ($100k per week, top 8,000) | Participation $100k
• The Earnings category is now open; it’s possible to base predictions on expectations for these 5 reports.
📌 My view: Rather than predicting a beat or miss, focusing on “which numbers are already priced in” may offer higher returns. LLY and AMZN have asymmetric timing; AI capex guidance is the key risk for GOOGL/MSFT.
Which of these 5 reports do you think will shake $BTC the most? Write your prediction with $USDC .
#EarningsSeason #BinancePick #Crypto
This is not financial advice.
#EarningsSeason This week, the earnings calendar will determine crypto’s direction: 5 major reports in 3 days.
📌 Calendar (US, Q3 2026 · source: Yahoo Finance / MarketChameleon, Oct 25):
• Oct 27: Visa (V) — after market close
• Oct 28: Alphabet (GOOGL) + Microsoft (MSFT) — after market close
• Oct 29: Eli Lilly (LLY) — before market open | Amazon (AMZN) — after market close
• Same window: Fed rate decision, Oct 27–28
📊 Consensus EPS (market expectations):
• LLY $6.67 | AMZN $1.96 | GOOGL $2.97 | V $3.44
• The key point: a “beat” alone isn’t enough; the question is how much of the expectation is already priced in.
🐋 Crypto connection:
• BTC $80,748 (+0.5%) | ETH $2,354 (+1.2%)
• Fear & Greed: 55 (Neutral)
• Last week’s Nasdaq selloff pushed BTC below $80k; this week, AI capex guidance will determine risk appetite.
🎯 Binance Pick angle (campaign information, not investment advice):
• Season 1: Oct 21 – Nov 15, $1M USDC total
• Season LB $500k (top 20,000) | Weekly $400k ($100k per week, top 8,000) | Participation $100k
• The Earnings category is now open; it’s possible to base predictions on expectations for these 5 reports.
📌 My view: Rather than predicting a beat or miss, focusing on “which numbers are already priced in” may offer higher returns. LLY and AMZN have asymmetric timing; AI capex guidance is the key risk for GOOGL/MSFT.
Which of these 5 reports do you think will shake $BTC the most? Write your prediction with $USDC .
#EarningsSeason #BinancePick #Crypto
This is not financial advice.
📌 Calendar (US, Q3 2026 · source: Yahoo Finance / MarketChameleon, Oct 25):
• Oct 27: Visa (V) — after market close
• Oct 28: Alphabet (GOOGL) + Microsoft (MSFT) — after market close
• Oct 29: Eli Lilly (LLY) — before market open | Amazon (AMZN) — after market close
• Same window: Fed rate decision, Oct 27–28
📊 Consensus EPS (market expectations):
• LLY $6.67 | AMZN $1.96 | GOOGL $2.97 | V $3.44
• The key point: a “beat” alone isn’t enough; the question is how much of the expectation is already priced in.
🐋 Crypto connection:
• BTC $80,748 (+0.5%) | ETH $2,354 (+1.2%)
• Fear & Greed: 55 (Neutral)
• Last week’s Nasdaq selloff pushed BTC below $80k; this week, AI capex guidance will determine risk appetite.
🎯 Binance Pick angle (campaign information, not investment advice):
• Season 1: Oct 21 – Nov 15, $1M USDC total
• Season LB $500k (top 20,000) | Weekly $400k ($100k per week, top 8,000) | Participation $100k
• The Earnings category is now open; it’s possible to base predictions on expectations for these 5 reports.
📌 My view: Rather than predicting a beat or miss, focusing on “which numbers are already priced in” may offer higher returns. LLY and AMZN have asymmetric timing; AI capex guidance is the key risk for GOOGL/MSFT.
Which of these 5 reports do you think will shake $BTC the most? Write your prediction with $USDC .
#EarningsSeason #BinancePick #Crypto
This is not financial advice.
1
130
·
--
Verified
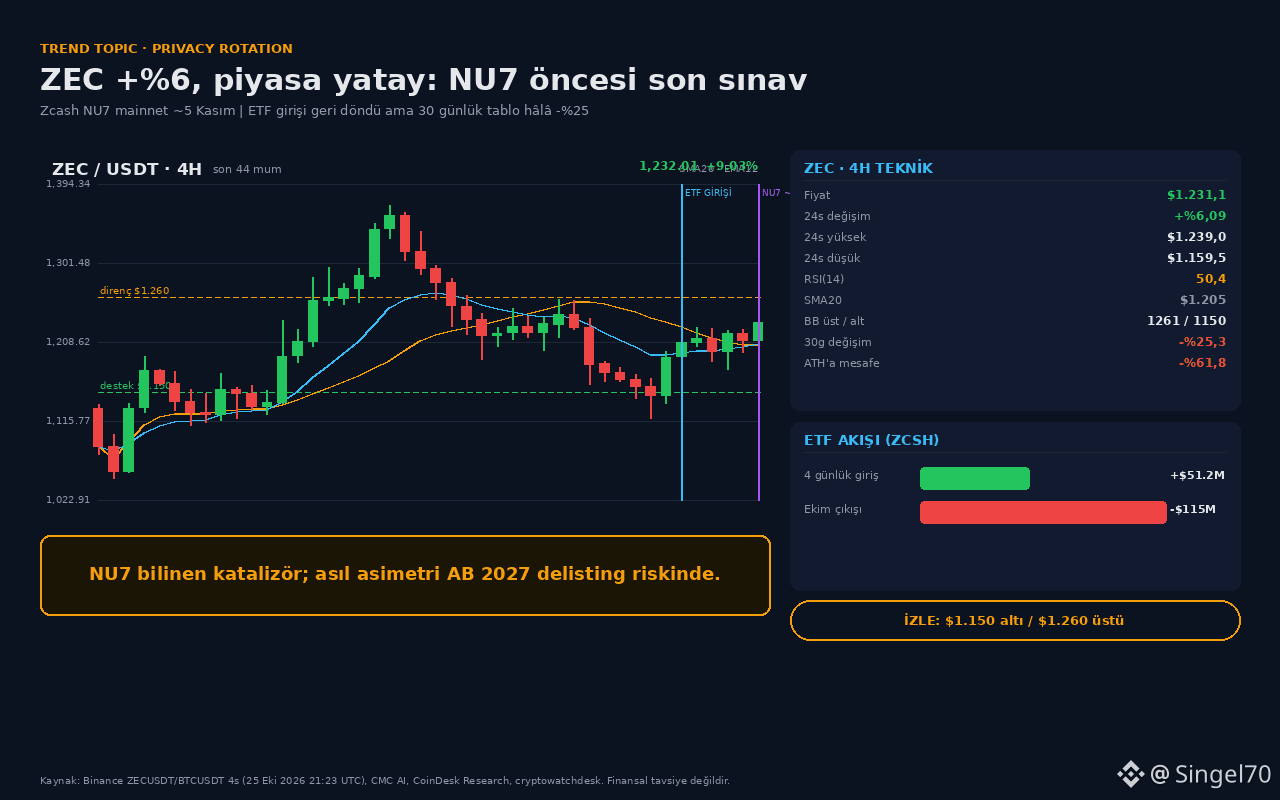
There’s a notable move in Zcash while BTC trades sideways: ZEC is up approximately 6% over the last 24 hours.
📊 Binance spot data as of October 25, 2026, 21:23 UTC:
• ZEC: $1,231.1
• 24h change: +6.09%
• 24h price range: $1,159.5 – $1,239.0
• 24h volume: ~$117M
• BTC: $80,748 — +0.53%
📈 4-hour technical outlook:
• SMA20: $1,205
• EMA12: $1,207
• RSI(14): 50.4 — neither overbought nor oversold
• Upper Bollinger Band: $1,260.6
• Lower Bollinger Band: $1,149.8
The price is above short-term averages, but has not yet broken above the $1,260 area. A move above this level supported by volume could be worth watching as a sign of continued momentum.
🐋 Developments in focus:
• Inflows into the Grayscale Zcash ETF have been seen in recent days. However, due to earlier outflows this month, the overall flow picture remains unbalanced.
• The NU7 upgrade is expected to go live around November 5. The upgrade is planned to reduce block time from 75 seconds to 25 seconds.
• ZEC is still down approximately 25% over the last 30 days and is trading well below its all-time high.
⚠️ Risk note:
Since NU7 is already a well-known development in the market, profit-taking may occur as the event approaches or afterward. Regulatory developments concerning privacy-focused assets may also affect access, liquidity, and market interest.
📌 Scenarios to watch:
• A 4-hour close above $1,260 supported by volume could strengthen the short-term outlook.
• Weakness below $1,150 could signal increased downside risk.
Is this move in ZEC the beginning of a broader rotation into privacy-focused coins, or just short-term interest ahead of NU7?
#ZEC #Zcash #NU7 #Crypto #BinanceSquare #Write2Earn
This is not financial advice.
There’s a notable move in Zcash while BTC trades sideways: ZEC is up approximately 6% over the last 24 hours.
📊 Binance spot data as of October 25, 2026, 21:23 UTC: • ZEC: $1,231.1
• 24h change: +6.09%
• 24h price range: $1,159.5 – $1,239.0
• 24h volume: ~$117M
• BTC: $80,748 — +0.53%
📈 4-hour technical outlook: • SMA20: $1,205
• EMA12: $1,207
• RSI(14): 50.4 — neither overbought nor oversold
• Upper Bollinger Band: $1,260.6
• Lower Bollinger Band: $1,149.8
The price is above short-term averages, but has not yet broken above the $1,260 area. A move above this level supported by volume could be worth watching as a sign of continued momentum.
🐋 Developments in focus: • Inflows into the Grayscale Zcash ETF have been seen in recent days. However, due to earlier outflows this month, the overall flow picture remains unbalanced.
• The NU7 upgrade is expected to go live around November 5. The upgrade is planned to reduce block time from 75 seconds to 25 seconds.
• ZEC is still down approximately 25% over the last 30 days and is trading well below its all-time high.
⚠️ Risk note:
Since NU7 is already a well-known development in the market, profit-taking may occur as the event approaches or afterward. Regulatory developments concerning privacy-focused assets may also affect access, liquidity, and market interest.
📌 Scenarios to watch: • A 4-hour close above $1,260 supported by volume could strengthen the short-term outlook.
• Weakness below $1,150 could signal increased downside risk.
Is this move in ZEC the beginning of a broader rotation into privacy-focused coins, or just short-term interest ahead of NU7?
#ZEC #Zcash #NU7 #Crypto #BinanceSquare #Write2Earn
This is not financial advice.
📊 Binance spot data as of October 25, 2026, 21:23 UTC: • ZEC: $1,231.1
• 24h change: +6.09%
• 24h price range: $1,159.5 – $1,239.0
• 24h volume: ~$117M
• BTC: $80,748 — +0.53%
📈 4-hour technical outlook: • SMA20: $1,205
• EMA12: $1,207
• RSI(14): 50.4 — neither overbought nor oversold
• Upper Bollinger Band: $1,260.6
• Lower Bollinger Band: $1,149.8
The price is above short-term averages, but has not yet broken above the $1,260 area. A move above this level supported by volume could be worth watching as a sign of continued momentum.
🐋 Developments in focus: • Inflows into the Grayscale Zcash ETF have been seen in recent days. However, due to earlier outflows this month, the overall flow picture remains unbalanced.
• The NU7 upgrade is expected to go live around November 5. The upgrade is planned to reduce block time from 75 seconds to 25 seconds.
• ZEC is still down approximately 25% over the last 30 days and is trading well below its all-time high.
⚠️ Risk note:
Since NU7 is already a well-known development in the market, profit-taking may occur as the event approaches or afterward. Regulatory developments concerning privacy-focused assets may also affect access, liquidity, and market interest.
📌 Scenarios to watch: • A 4-hour close above $1,260 supported by volume could strengthen the short-term outlook.
• Weakness below $1,150 could signal increased downside risk.
Is this move in ZEC the beginning of a broader rotation into privacy-focused coins, or just short-term interest ahead of NU7?
#ZEC #Zcash #NU7 #Crypto #BinanceSquare #Write2Earn
This is not financial advice.
1
245
·
--
$XRP On Ledger, the "$150 million institutional adoption" is actually a mint to a single wallet.
📌 The real numbers (CoinDesk, Oct 24, 2026)
• Franklin Templeton increased the sgBENJI supply from ~48M to ~193M shares (+$150M)
• At $1.039/share, the total value on XRPL is ~$200M
• All the new shares went to a SINGLE wallet. That wallet and the issuer authorize the same 8 signer addresses; any two can approve a transaction
• Franklin can freeze or claw back the balance if needed
📉 The price isn't pricing this in
XRP 1.2885 (-2.97%, 24h), 24h range 1.2817–1.3307. Below SMA20 at 1.3287 and EMA12 at 1.3095; RSI(14) 15.2, stochastic 7.7. It's oversold, but there's no bounce.
🐋 The real on-chain picture
RWA.xyz XRPL network: distributed RWA value of $641M (+27.6%, 30 days), with $7.03B in transfer volume over 30 days. But the number of RWA holders is just 2,499 (+0.4%, 30 days). A single sgBENJI wallet holds roughly 30% of this distributed value. In other words, volume is growing, but the user base isn't.
🎯 Plan
A 4h close above 1.30 → a test of 1.33 and 1.36. A 4h close below 1.2817 → the 1.26 zone. Chasing shorts with RSI at 15 is poor R:R; likewise, it's wrong to interpret a single-wallet mint as "new institutional demand." My bias is neutral-to-bearish: no buying until the structure at 1.33 breaks.
📌 Do you think $200M concentrated in a single wallet counts as "institutional demand," or is it just an accounting move? Let me know in the comments.
#XRP #XRPL #RWA #sgBENJI #Tokenization
Not financial advice.
$XRP On Ledger, the "$150 million institutional adoption" is actually a mint to a single wallet.
📌 The real numbers (CoinDesk, Oct 24, 2026)
• Franklin Templeton increased the sgBENJI supply from ~48M to ~193M shares (+$150M)
• At $1.039/share, the total value on XRPL is ~$200M
• All the new shares went to a SINGLE wallet. That wallet and the issuer authorize the same 8 signer addresses; any two can approve a transaction
• Franklin can freeze or claw back the balance if needed
📉 The price isn't pricing this in
XRP 1.2885 (-2.97%, 24h), 24h range 1.2817–1.3307. Below SMA20 at 1.3287 and EMA12 at 1.3095; RSI(14) 15.2, stochastic 7.7. It's oversold, but there's no bounce.
🐋 The real on-chain picture
RWA.xyz XRPL network: distributed RWA value of $641M (+27.6%, 30 days), with $7.03B in transfer volume over 30 days. But the number of RWA holders is just 2,499 (+0.4%, 30 days). A single sgBENJI wallet holds roughly 30% of this distributed value. In other words, volume is growing, but the user base isn't.
🎯 Plan
A 4h close above 1.30 → a test of 1.33 and 1.36. A 4h close below 1.2817 → the 1.26 zone. Chasing shorts with RSI at 15 is poor R:R; likewise, it's wrong to interpret a single-wallet mint as "new institutional demand." My bias is neutral-to-bearish: no buying until the structure at 1.33 breaks.
📌 Do you think $200M concentrated in a single wallet counts as "institutional demand," or is it just an accounting move? Let me know in the comments.
#XRP #XRPL #RWA #sgBENJI #Tokenization
Not financial advice.
📌 The real numbers (CoinDesk, Oct 24, 2026)
• Franklin Templeton increased the sgBENJI supply from ~48M to ~193M shares (+$150M)
• At $1.039/share, the total value on XRPL is ~$200M
• All the new shares went to a SINGLE wallet. That wallet and the issuer authorize the same 8 signer addresses; any two can approve a transaction
• Franklin can freeze or claw back the balance if needed
📉 The price isn't pricing this in
XRP 1.2885 (-2.97%, 24h), 24h range 1.2817–1.3307. Below SMA20 at 1.3287 and EMA12 at 1.3095; RSI(14) 15.2, stochastic 7.7. It's oversold, but there's no bounce.
🐋 The real on-chain picture
RWA.xyz XRPL network: distributed RWA value of $641M (+27.6%, 30 days), with $7.03B in transfer volume over 30 days. But the number of RWA holders is just 2,499 (+0.4%, 30 days). A single sgBENJI wallet holds roughly 30% of this distributed value. In other words, volume is growing, but the user base isn't.
🎯 Plan
A 4h close above 1.30 → a test of 1.33 and 1.36. A 4h close below 1.2817 → the 1.26 zone. Chasing shorts with RSI at 15 is poor R:R; likewise, it's wrong to interpret a single-wallet mint as "new institutional demand." My bias is neutral-to-bearish: no buying until the structure at 1.33 breaks.
📌 Do you think $200M concentrated in a single wallet counts as "institutional demand," or is it just an accounting move? Let me know in the comments.
#XRP #XRPL #RWA #sgBENJI #Tokenization
Not financial advice.
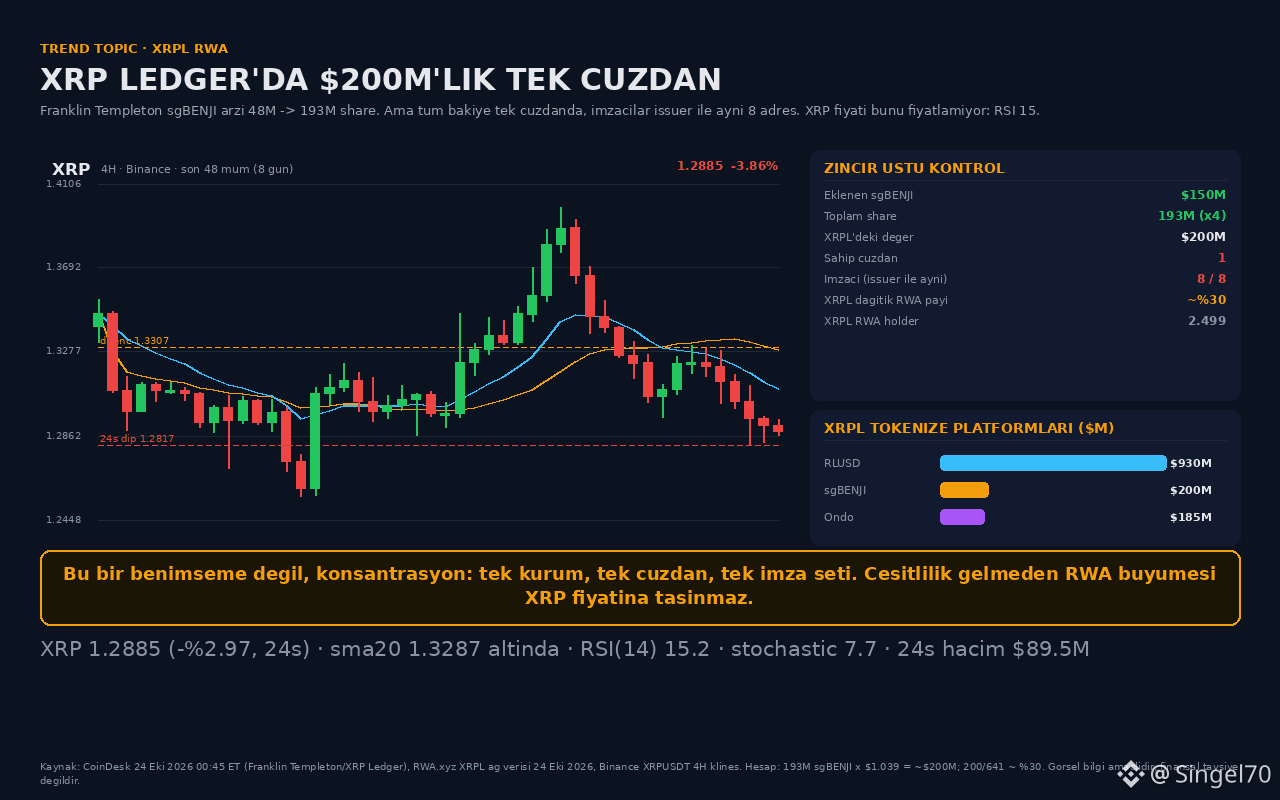
1
55
·
--
#InitiaHalt The chain stopped at block 23,365,925, but why is the INIT price still moving?
📌 Actual figures (24.10.2026 03:15 UTC)
• INIT: $0.13689, 24h +3.5%; intraday range 0.11337–0.15738
• 24h volume: $8.96M (Binance spot)
• Chain: stopped on Oct 23 at 15:41:30 UTC, last block 23,365,925, no restart date
• Drained (alleged): ~$2.7M; according to D2 Finance, $2.65M reached ETH in 7 min 21 sec
• TVL: $5.73M (DefiLlama) — May 2025 peak: $42.15M
📉 Reading the data
At the time of the halt, price went from 0.1355 → 0.1134 (-16%), then to 0.1554 (+37%) an hour later. Now at 0.13689, the entire bounce has been given back. Price is below the SMA20 (0.1414), EMA12 (0.1426), and EMA26 (0.1400); RSI is 52, with a clear rejection from the upper BB at 0.1571. The structure hasn't fully broken down, but there's no momentum either.
🐋 On-chain evidence
The attacker minted 2M unbacked AUSD and bridged it to Ethereum via LayerZero: 1.4M AUSD (71% of the adapter), 105 ETH (96%), and 1.08M USDC; 1,135.5 ETH was consolidated at a single address. Upbit and Bithumb halted INIT deposits and withdrawals. Open interest is ~$24.7M, market cap ~$29M: OI/MCAP ~80%. In other words, leverage—not spot demand—is driving the price.
🎯 Plan
It's too early to say “buy the dip” here; whether this is a supply shock or exit liquidity on a halted chain will become clearer once the official post-mortem is released.
• Aggressive: No longs without a 1h close above 0.1414 (SMA20).
• Conservative: Wait for a restart and loss disclosure; a close below 0.1134 opens the risk of a new low.
• Short-term downside looks more likely; upside returns only with a high-volume close above 0.1574.
My view: price discovery isn't healthy until the chain is back online, and conditions aren't suitable for leveraged longs.
📌 What do you think will determine INIT's direction: the restart or the loss figure to be disclosed?
#InitiaHalt #INIT $INIT #OnChain #RiskManagement
Not financial advice.
#InitiaHalt The chain stopped at block 23,365,925, but why is the INIT price still moving?
📌 Actual figures (24.10.2026 03:15 UTC)
• INIT: $0.13689, 24h +3.5%; intraday range 0.11337–0.15738
• 24h volume: $8.96M (Binance spot)
• Chain: stopped on Oct 23 at 15:41:30 UTC, last block 23,365,925, no restart date
• Drained (alleged): ~$2.7M; according to D2 Finance, $2.65M reached ETH in 7 min 21 sec
• TVL: $5.73M (DefiLlama) — May 2025 peak: $42.15M
📉 Reading the data
At the time of the halt, price went from 0.1355 → 0.1134 (-16%), then to 0.1554 (+37%) an hour later. Now at 0.13689, the entire bounce has been given back. Price is below the SMA20 (0.1414), EMA12 (0.1426), and EMA26 (0.1400); RSI is 52, with a clear rejection from the upper BB at 0.1571. The structure hasn't fully broken down, but there's no momentum either.
🐋 On-chain evidence
The attacker minted 2M unbacked AUSD and bridged it to Ethereum via LayerZero: 1.4M AUSD (71% of the adapter), 105 ETH (96%), and 1.08M USDC; 1,135.5 ETH was consolidated at a single address. Upbit and Bithumb halted INIT deposits and withdrawals. Open interest is ~$24.7M, market cap ~$29M: OI/MCAP ~80%. In other words, leverage—not spot demand—is driving the price.
🎯 Plan
It's too early to say “buy the dip” here; whether this is a supply shock or exit liquidity on a halted chain will become clearer once the official post-mortem is released.
• Aggressive: No longs without a 1h close above 0.1414 (SMA20).
• Conservative: Wait for a restart and loss disclosure; a close below 0.1134 opens the risk of a new low.
• Short-term downside looks more likely; upside returns only with a high-volume close above 0.1574.
My view: price discovery isn't healthy until the chain is back online, and conditions aren't suitable for leveraged longs.
📌 What do you think will determine INIT's direction: the restart or the loss figure to be disclosed?
#InitiaHalt #INIT $INIT #OnChain #RiskManagement
Not financial advice.
📌 Actual figures (24.10.2026 03:15 UTC)
• INIT: $0.13689, 24h +3.5%; intraday range 0.11337–0.15738
• 24h volume: $8.96M (Binance spot)
• Chain: stopped on Oct 23 at 15:41:30 UTC, last block 23,365,925, no restart date
• Drained (alleged): ~$2.7M; according to D2 Finance, $2.65M reached ETH in 7 min 21 sec
• TVL: $5.73M (DefiLlama) — May 2025 peak: $42.15M
📉 Reading the data
At the time of the halt, price went from 0.1355 → 0.1134 (-16%), then to 0.1554 (+37%) an hour later. Now at 0.13689, the entire bounce has been given back. Price is below the SMA20 (0.1414), EMA12 (0.1426), and EMA26 (0.1400); RSI is 52, with a clear rejection from the upper BB at 0.1571. The structure hasn't fully broken down, but there's no momentum either.
🐋 On-chain evidence
The attacker minted 2M unbacked AUSD and bridged it to Ethereum via LayerZero: 1.4M AUSD (71% of the adapter), 105 ETH (96%), and 1.08M USDC; 1,135.5 ETH was consolidated at a single address. Upbit and Bithumb halted INIT deposits and withdrawals. Open interest is ~$24.7M, market cap ~$29M: OI/MCAP ~80%. In other words, leverage—not spot demand—is driving the price.
🎯 Plan
It's too early to say “buy the dip” here; whether this is a supply shock or exit liquidity on a halted chain will become clearer once the official post-mortem is released.
• Aggressive: No longs without a 1h close above 0.1414 (SMA20).
• Conservative: Wait for a restart and loss disclosure; a close below 0.1134 opens the risk of a new low.
• Short-term downside looks more likely; upside returns only with a high-volume close above 0.1574.
My view: price discovery isn't healthy until the chain is back online, and conditions aren't suitable for leveraged longs.
📌 What do you think will determine INIT's direction: the restart or the loss figure to be disclosed?
#InitiaHalt #INIT $INIT #OnChain #RiskManagement
Not financial advice.
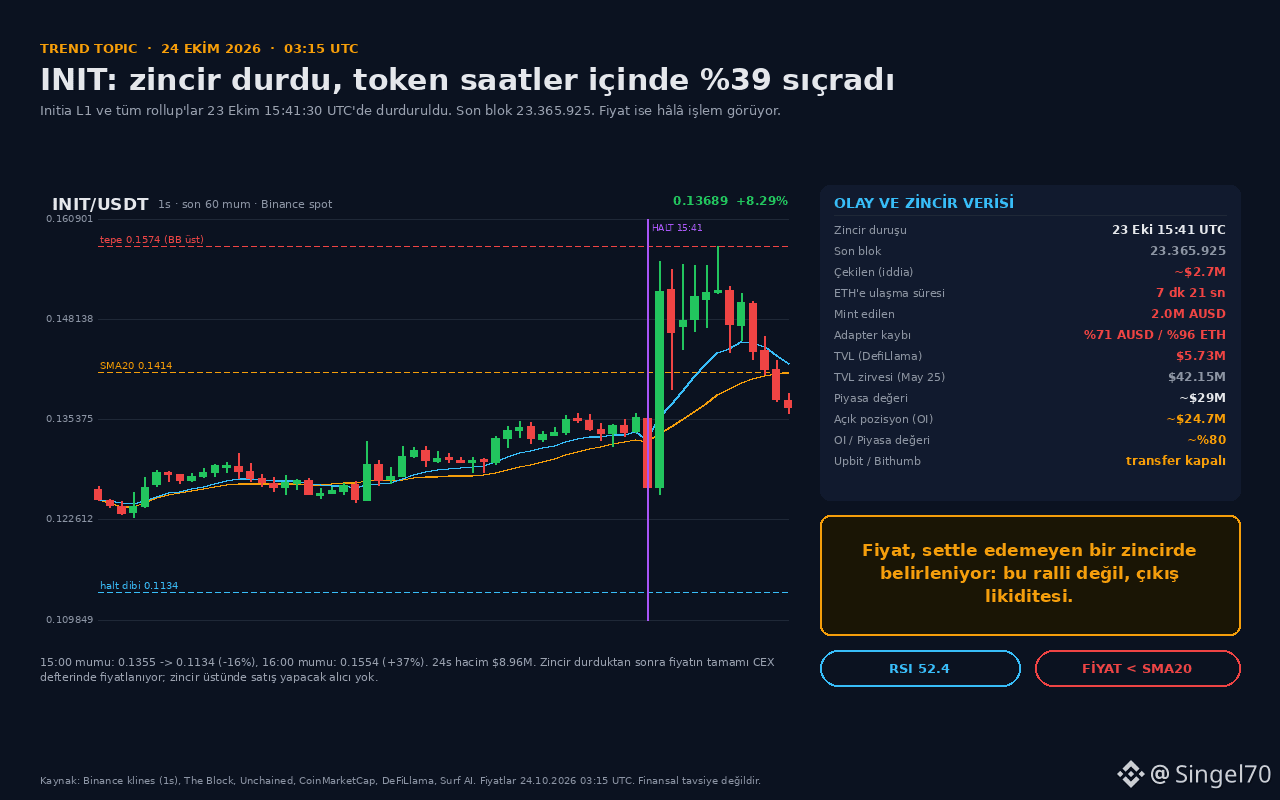
1
94
·
--
Those panic-selling below #Glamsterdam 2.347$ think they’re facing 13 separate exploits. But the real story is in the flow.
📌 The real numbers (October 24, 2026)
• $ETH 2.374$, 24h -0.48%; 4h RSI 16.6 (oversold), SMA20 2.426$
• Hoodi activation was postponed indefinitely from October 26 at 17:42 UTC; there’s no new date, and the 200M gas target has also been shelved (Ethereum Foundation, October 22)
• Sepolia passed on October 6; a mainnet date was never announced
• Spot ETH ETFs saw net outflows of -1.2 billion$ in October (the worst month of the year); a single-day outflow of -111 million$ on October 22
📉 Technical analysis
Price is at 2.374$, just below the 2.400 pivot and trying to hold above 2.347 (the lower Bollinger Band). A 4h RSI of 16.6 is historically rare oversold territory; a break below 2.330 invalidates the scenario, while a close above 2.500 would confirm a bottom.
🐋 On-chain contradiction
That same week, a net 169.770 ETH (~403 million$) left exchanges—the largest daily outflow in over 4 months (Santiment). Coins are being withdrawn from exchanges even as ETFs sell. This looks more like a change of hands than panic selling.
🔍 ‘13’ is being misread
ChainSecurity’s public analysis does not list 13 separate vulnerabilities; ‘13’ is the number of projects that could be affected. The risk is real: a new storage slot could cost 110.020 gas instead of 22.100 (EIP-8037). But this isn’t a confirmed mainnet exploit; it’s a test that was postponed.
🎯 Plan
If the 2.347-2.330 range holds, expect a reaction targeting 2.400/2.500; a daily close below 2.330 invalidates the scenario. Directionally, a short-term reaction is possible, but it won’t count as a trend reversal in the medium term until 2.500 is reclaimed. Scale in gradually on spot; be cautious with leverage.
📌 Do you think this postponement means greater security for ETH, or just a delay? Share your thoughts in the comments.
$ETH #Glamsterdam #Ethereum #ETH #Crypto
Not financial advice.
Those panic-selling below #Glamsterdam 2.347$ think they’re facing 13 separate exploits. But the real story is in the flow.
📌 The real numbers (October 24, 2026)
• $ETH 2.374$, 24h -0.48%; 4h RSI 16.6 (oversold), SMA20 2.426$
• Hoodi activation was postponed indefinitely from October 26 at 17:42 UTC; there’s no new date, and the 200M gas target has also been shelved (Ethereum Foundation, October 22)
• Sepolia passed on October 6; a mainnet date was never announced
• Spot ETH ETFs saw net outflows of -1.2 billion$ in October (the worst month of the year); a single-day outflow of -111 million$ on October 22
📉 Technical analysis
Price is at 2.374$, just below the 2.400 pivot and trying to hold above 2.347 (the lower Bollinger Band). A 4h RSI of 16.6 is historically rare oversold territory; a break below 2.330 invalidates the scenario, while a close above 2.500 would confirm a bottom.
🐋 On-chain contradiction
That same week, a net 169.770 ETH (~403 million$) left exchanges—the largest daily outflow in over 4 months (Santiment). Coins are being withdrawn from exchanges even as ETFs sell. This looks more like a change of hands than panic selling.
🔍 ‘13’ is being misread
ChainSecurity’s public analysis does not list 13 separate vulnerabilities; ‘13’ is the number of projects that could be affected. The risk is real: a new storage slot could cost 110.020 gas instead of 22.100 (EIP-8037). But this isn’t a confirmed mainnet exploit; it’s a test that was postponed.
🎯 Plan
If the 2.347-2.330 range holds, expect a reaction targeting 2.400/2.500; a daily close below 2.330 invalidates the scenario. Directionally, a short-term reaction is possible, but it won’t count as a trend reversal in the medium term until 2.500 is reclaimed. Scale in gradually on spot; be cautious with leverage.
📌 Do you think this postponement means greater security for ETH, or just a delay? Share your thoughts in the comments.
$ETH #Glamsterdam #Ethereum #ETH #Crypto
Not financial advice.
📌 The real numbers (October 24, 2026)
• $ETH 2.374$, 24h -0.48%; 4h RSI 16.6 (oversold), SMA20 2.426$
• Hoodi activation was postponed indefinitely from October 26 at 17:42 UTC; there’s no new date, and the 200M gas target has also been shelved (Ethereum Foundation, October 22)
• Sepolia passed on October 6; a mainnet date was never announced
• Spot ETH ETFs saw net outflows of -1.2 billion$ in October (the worst month of the year); a single-day outflow of -111 million$ on October 22
📉 Technical analysis
Price is at 2.374$, just below the 2.400 pivot and trying to hold above 2.347 (the lower Bollinger Band). A 4h RSI of 16.6 is historically rare oversold territory; a break below 2.330 invalidates the scenario, while a close above 2.500 would confirm a bottom.
🐋 On-chain contradiction
That same week, a net 169.770 ETH (~403 million$) left exchanges—the largest daily outflow in over 4 months (Santiment). Coins are being withdrawn from exchanges even as ETFs sell. This looks more like a change of hands than panic selling.
🔍 ‘13’ is being misread
ChainSecurity’s public analysis does not list 13 separate vulnerabilities; ‘13’ is the number of projects that could be affected. The risk is real: a new storage slot could cost 110.020 gas instead of 22.100 (EIP-8037). But this isn’t a confirmed mainnet exploit; it’s a test that was postponed.
🎯 Plan
If the 2.347-2.330 range holds, expect a reaction targeting 2.400/2.500; a daily close below 2.330 invalidates the scenario. Directionally, a short-term reaction is possible, but it won’t count as a trend reversal in the medium term until 2.500 is reclaimed. Scale in gradually on spot; be cautious with leverage.
📌 Do you think this postponement means greater security for ETH, or just a delay? Share your thoughts in the comments.
$ETH #Glamsterdam #Ethereum #ETH #Crypto
Not financial advice.
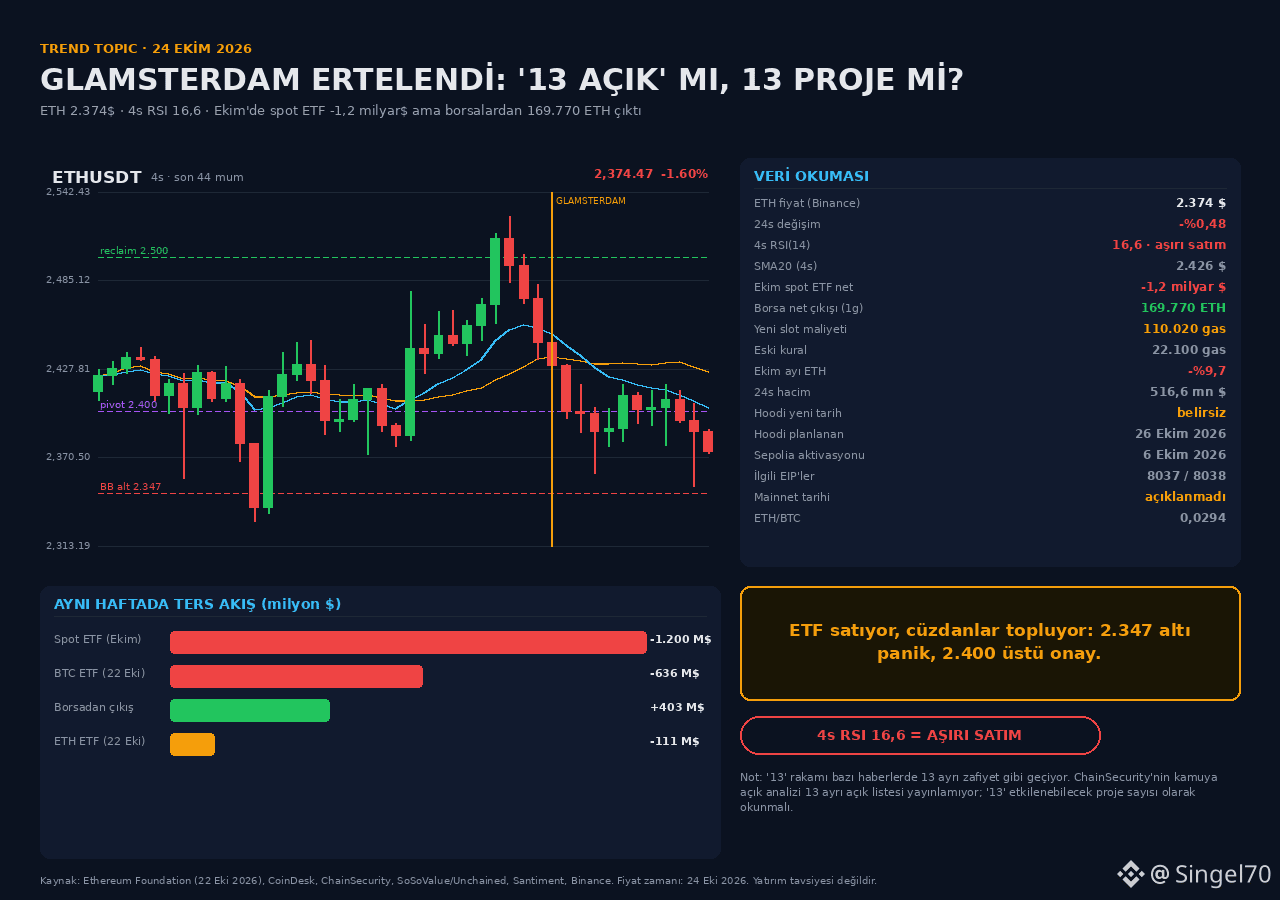
1
78
·
--
#LiquidationHeatmap BTC at the $81,431 floor: everyone is looking down, but the liquidity map points up.
📌 The real numbers (Oct 23, 2026, 06:21 UTC)
• Binance BTCUSDT: $81,944 | 24h low $80,939 | 24h -0.97%
• CoinGlass (Oct 22, 17:15 UTC): $458M liquidated in 24h, $417.9M of it from longs (91.2%), 103,000+ traders
• Oct 22: Nasdaq -2.60%, S&P 500 -1.21%; BTC fell with high beta
• 4h RSI 40.6; SMA20 at $82,565 above price; price above the lower Bollinger Band at $80,581
📉 Technical read
The $81,431 level has been tested 8 separate times since February 2025. Yesterday's daily close at $81,416 was just below the floor and the lowest in 30 days; today it was reclaimed at $81,944. So this is not a breakdown, but a defense of the floor. Critical levels: a close above $83,708 opens the way to $87,396; a close below $79,800 leaves room to $75,000.
🐋 Liquidity map (Glassnode, Oct 7)
The main short liquidation cluster is at $87,100–$95,900 (densest around 92K). The long cluster is at $81,700–$83,300, just above the current price. $458M in longs has been liquidated, but the price is still below the SMA20: no confirmation of a recovery.
🎯 Plan
• Upside: daily close above $83,708 → $87,100–$87,396, stop below $81,431
• Downside: daily close below $79,800 → $75,000
• Bottom line: No trade until there's a trigger. The upside squeeze scenario is more compelling because the short cluster overhead is large and the long side has just been cleared; but I won't chase longs without a close above 83.7K.
📌 Which side are you waiting for: an 87K squeeze or 79.8K?
#Bitcoin #BTC #CryptoMarket #RiskManagement
$BTC
Not financial advice.
#LiquidationHeatmap BTC at the $81,431 floor: everyone is looking down, but the liquidity map points up.
📌 The real numbers (Oct 23, 2026, 06:21 UTC)
• Binance BTCUSDT: $81,944 | 24h low $80,939 | 24h -0.97%
• CoinGlass (Oct 22, 17:15 UTC): $458M liquidated in 24h, $417.9M of it from longs (91.2%), 103,000+ traders
• Oct 22: Nasdaq -2.60%, S&P 500 -1.21%; BTC fell with high beta
• 4h RSI 40.6; SMA20 at $82,565 above price; price above the lower Bollinger Band at $80,581
📉 Technical read
The $81,431 level has been tested 8 separate times since February 2025. Yesterday's daily close at $81,416 was just below the floor and the lowest in 30 days; today it was reclaimed at $81,944. So this is not a breakdown, but a defense of the floor. Critical levels: a close above $83,708 opens the way to $87,396; a close below $79,800 leaves room to $75,000.
🐋 Liquidity map (Glassnode, Oct 7)
The main short liquidation cluster is at $87,100–$95,900 (densest around 92K). The long cluster is at $81,700–$83,300, just above the current price. $458M in longs has been liquidated, but the price is still below the SMA20: no confirmation of a recovery.
🎯 Plan
• Upside: daily close above $83,708 → $87,100–$87,396, stop below $81,431
• Downside: daily close below $79,800 → $75,000
• Bottom line: No trade until there's a trigger. The upside squeeze scenario is more compelling because the short cluster overhead is large and the long side has just been cleared; but I won't chase longs without a close above 83.7K.
📌 Which side are you waiting for: an 87K squeeze or 79.8K?
#Bitcoin #BTC #CryptoMarket #RiskManagement
$BTC
Not financial advice.
📌 The real numbers (Oct 23, 2026, 06:21 UTC)
• Binance BTCUSDT: $81,944 | 24h low $80,939 | 24h -0.97%
• CoinGlass (Oct 22, 17:15 UTC): $458M liquidated in 24h, $417.9M of it from longs (91.2%), 103,000+ traders
• Oct 22: Nasdaq -2.60%, S&P 500 -1.21%; BTC fell with high beta
• 4h RSI 40.6; SMA20 at $82,565 above price; price above the lower Bollinger Band at $80,581
📉 Technical read
The $81,431 level has been tested 8 separate times since February 2025. Yesterday's daily close at $81,416 was just below the floor and the lowest in 30 days; today it was reclaimed at $81,944. So this is not a breakdown, but a defense of the floor. Critical levels: a close above $83,708 opens the way to $87,396; a close below $79,800 leaves room to $75,000.
🐋 Liquidity map (Glassnode, Oct 7)
The main short liquidation cluster is at $87,100–$95,900 (densest around 92K). The long cluster is at $81,700–$83,300, just above the current price. $458M in longs has been liquidated, but the price is still below the SMA20: no confirmation of a recovery.
🎯 Plan
• Upside: daily close above $83,708 → $87,100–$87,396, stop below $81,431
• Downside: daily close below $79,800 → $75,000
• Bottom line: No trade until there's a trigger. The upside squeeze scenario is more compelling because the short cluster overhead is large and the long side has just been cleared; but I won't chase longs without a close above 83.7K.
📌 Which side are you waiting for: an 87K squeeze or 79.8K?
#Bitcoin #BTC #CryptoMarket #RiskManagement
$BTC
Not financial advice.
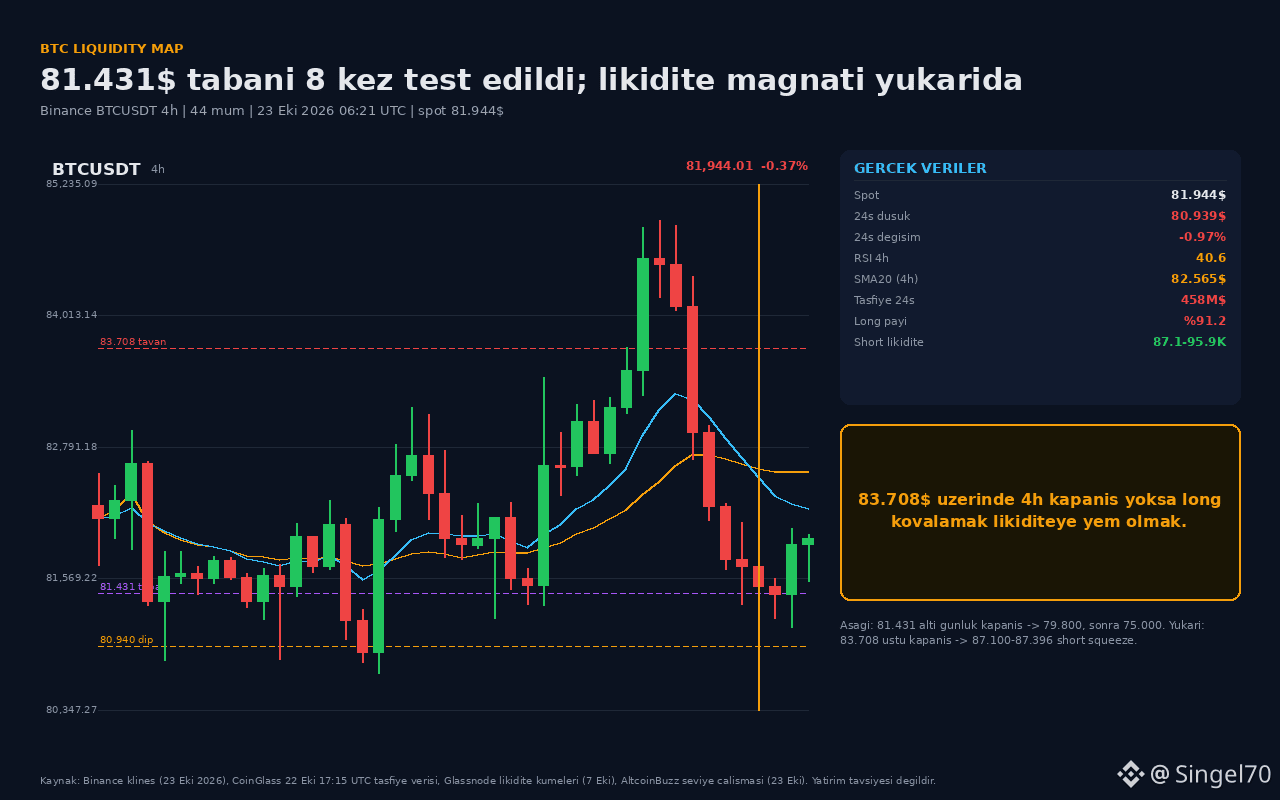
1
38
Log in to explore more content
Join global crypto users on Binance Square
⚡️ Get latest and useful information about crypto.
💬 Trusted by the world’s largest crypto exchange.
👍 Discover real insights from verified creators.
Email / Phone number
Trending Topics
BinanceWithdrawalScamWarning
55,648 views
730 Discussing
Binance Warns Users of Withdrawal Scams as Services Resume: It Will Never Charge Fees, Sell Queue Spots or Ask You to Move Funds to a “Vault”
Binance News
·15 Likes
·8.6k views
USMidtermElections
627,709 views
3,297 Discussing
USOctoberNFP-AreRateCutsStillPossible
60,247 views
584 Discussing