
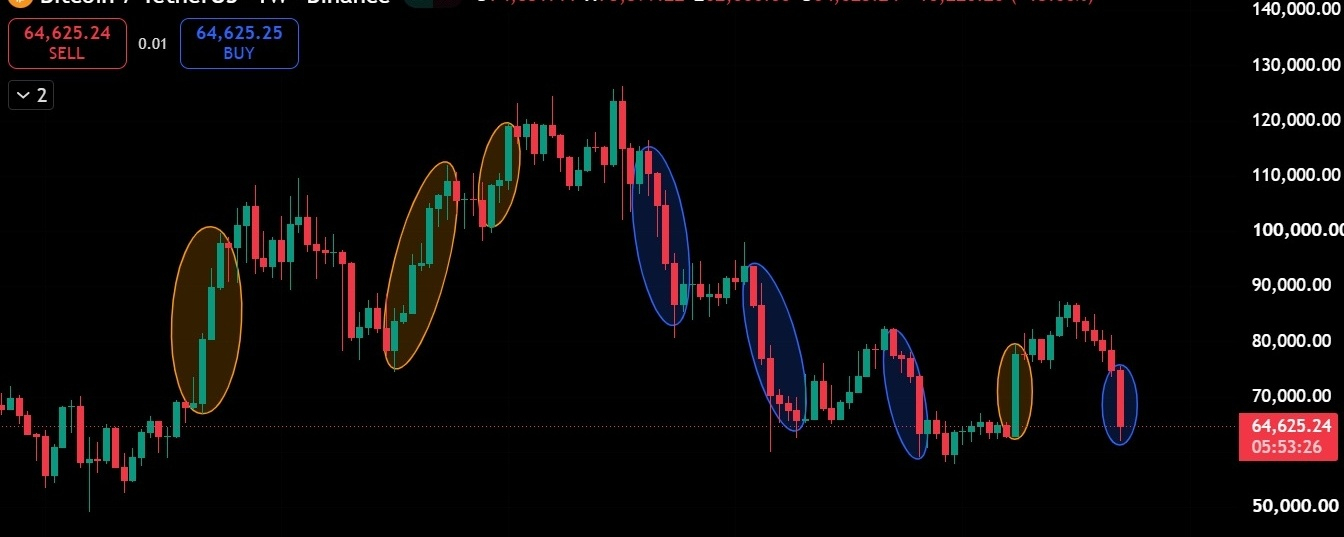


$BTC is showing a concerning change in its weekly price structure, and the relationship between bullish rallies and bearish corrections tells an important story about the current market.
Looking closely at the BTC/USDT weekly chart, the orange and blue highlighted regions reveal a recurring pattern of strong bullish expansion followed by aggressive bearish price movements. However, the most significant development is not simply that Bitcoin is falling. It is that the strength, duration, and sustainability of bullish rallies appear to be deteriorating while bearish pressure continues to dominate the broader structure.
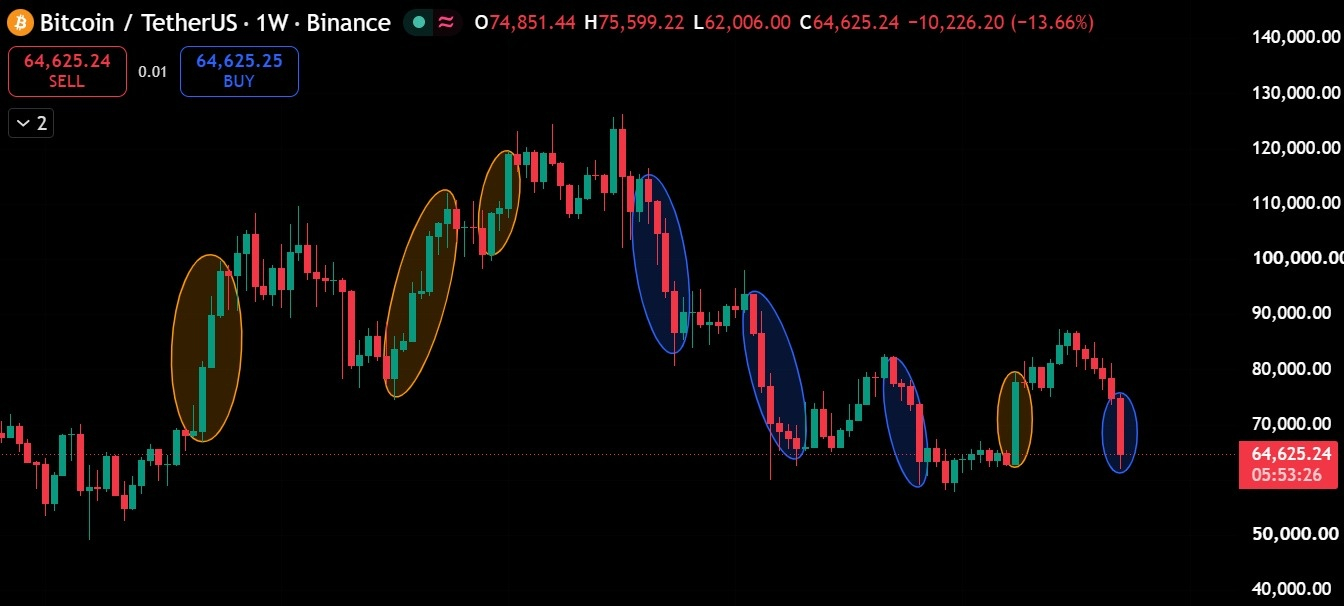
🟠 The Orange Circles: How Bullish Momentum Has Changed
During the earlier stages of the chart, Bitcoin experienced powerful upward movements characterized by consecutive bullish weekly candles and relatively limited interruptions. These rallies demonstrated strong buying conviction, with buyers successfully pushing prices through resistance levels and maintaining upward momentum.
The first highlighted bullish expansion carried Bitcoin from approximately $70,000 toward $100,000, establishing an important upward impulse. Subsequent bullish movements extended the broader advance toward the $110,000–$120,000 region.
These earlier rallies were significant because buyers were not merely defending support; they were actively establishing higher price levels.
However, the most recent orange-highlighted movement presents a different picture.
After Bitcoin consolidated around the $63,000–$66,000 region, buyers briefly regained control and pushed prices toward $80,000. Although this recovery initially appeared constructive, it failed to develop into a sustained bullish trend.
Instead of establishing a new major high, Bitcoin encountered selling pressure and reversed.
This is an important sign of weakening bullish momentum. The market is still capable of producing sharp upward movements, but those movements are increasingly struggling to overcome the broader bearish structure.
🔵 The Blue Circles: Why Bearish Movements Are Becoming More Important
The blue-highlighted regions reveal the opposite behavior.
Following Bitcoin's major peak around the $120,000 region, the chart began displaying increasingly aggressive downward movements. Large bearish weekly candles emerged, important support levels were broken, and subsequent recoveries failed to restore the previous bullish structure.
One particularly important feature is the repeated formation of lower highs.
After the major market peak, Bitcoin recovered toward approximately $90,000–$95,000 before experiencing another substantial decline. A later recovery approached the $80,000 region, but this movement also failed to sustain itself.
This sequence suggests that sellers are becoming active at progressively lower price levels.
In technical analysis, this behavior often reflects a market where supply is overwhelming demand during recovery attempts.
The latest blue-highlighted candle reinforces this concern.
According to the supplied chart, Bitcoin opened the week around $74,851, reached approximately $75,599, and subsequently declined toward $62,006, with the displayed price near $64,625.
That represents a weekly decline of approximately 13.66% at the moment captured in the screenshot.
The magnitude of this decline is particularly important because it follows a failed recovery rather than an extended bullish breakout.
In other words, Bitcoin's recent recovery has been almost completely reversed, suggesting that sellers remain in control of the immediate market structure.
📉 The Bigger Picture: A Transition From Bullish Expansion to Bearish Dominance
When the orange and blue regions are examined together, a broader market transition becomes visible.
Earlier in the chart, bullish impulses were capable of establishing substantial new highs. Corrections occurred, but buyers eventually recovered control and extended the upward trend.
In the later portion, the relationship changes.
Bullish recoveries become less effective at establishing higher highs, while bearish impulses repeatedly push Bitcoin back toward previous support zones.
This creates a sequence of lower highs and renewed downward pressure.
The contrast is especially noticeable between the earlier rallies toward $100,000–$120,000 and the latest recovery toward $80,000.
Although the chart alone cannot establish institutional positioning or the precise cause of selling, the price action is consistent with a market experiencing persistent supply during rallies.
The crucial issue is whether Bitcoin is undergoing a prolonged bearish continuation or approaching a support region where demand can eventually absorb the selling pressure.
🎯 Why the $62,000–$65,000 Zone Matters
Bitcoin is now trading near one of the most important regions visible on the weekly chart.
The $62,000–$65,000 area has repeatedly attracted price reactions, making it a significant technical decision zone.
If buyers successfully defend this region, Bitcoin could stabilize and attempt another recovery toward $68,000–$70,000. A sustained move above that area would improve the short-term outlook and potentially create room for a recovery toward $74,000–$76,000.
However, reclaiming these levels would not automatically confirm a new bullish market structure. Bitcoin would still need to overcome the sequence of lower highs that has developed across the weekly timeframe.
The bearish scenario becomes more concerning if Bitcoin records a decisive weekly close below $62,000.
Such a development would indicate that the current support region has failed and could expose the psychological $60,000 level, followed by the broader $58,000 area.
These are potential technical reaction zones, not guaranteed price targets.
🔥 What Makes the Current Weekly Candle Especially Important?
The current weekly candle has a relatively small upper wick and a substantial bearish body.
This indicates that the market briefly traded above its opening price before sellers drove it significantly lower.
However, the candle also shows some recovery from its weekly low, meaning buyers have not completely disappeared.
The key question is whether that buying interest can produce a meaningful recovery before the weekly candle closes.
A strong rebound that leaves a substantial lower wick would suggest that demand is emerging around support.
Conversely, a weekly close near the lower portion of the candle would strengthen the interpretation of sustained bearish pressure.
The weekly closing price matters more than temporary intrawEEK movement because it helps distinguish a support rejection from a confirmed breakdown.
⚠️ Final Outlook: Bitcoin Is at a Critical Structural Crossroads
The most important message from this chart is not that every bearish candle guarantees further downside.
It is that Bitcoin's market behavior has changed.
Earlier bullish expansions established higher price levels and demonstrated strong follow-through. Recent bullish recoveries have been shorter-lived and have repeatedly encountered selling pressure before reclaiming previous highs.
Meanwhile, bearish movements have continued to challenge the same major support region.
For now, the weekly structure favors a cautious bearish interpretation.
A confirmed breakdown below $62,000 would strengthen the bearish continuation scenario, while a sustained recovery above $70,000 would provide the first meaningful indication that short-term selling pressure may be weakening.
Until either development occurs, Bitcoin remains in a technically vulnerable position near critical support.
The next major directional move may depend on whether buyers can defend the $62,000 region or whether another failed recovery gives sellers an opportunity to extend the decline.
💬 What do you think comes next for Bitcoin: a breakdown toward $58K or a strong recovery toward $75K?
#Bitcoin #BTC #BTCUSDT #CryptoMarket
