



First see how much of the rebound was recovered, then check whether selling pressure followed
BTC fell for two consecutive candles, and trading volume on the second was down by about 40%. When you see the volume bar shrink, can you worry a little less about the risk of further declines? #BTC
When reading the original book’s “low-level distribution case,” I think the most important takeaway is this: after volume decreases, does the price become easier to recover? Let’s look further at this question using a separate stretch of real-market data.
Volume contracted at B, but the price still moved noticeably lower
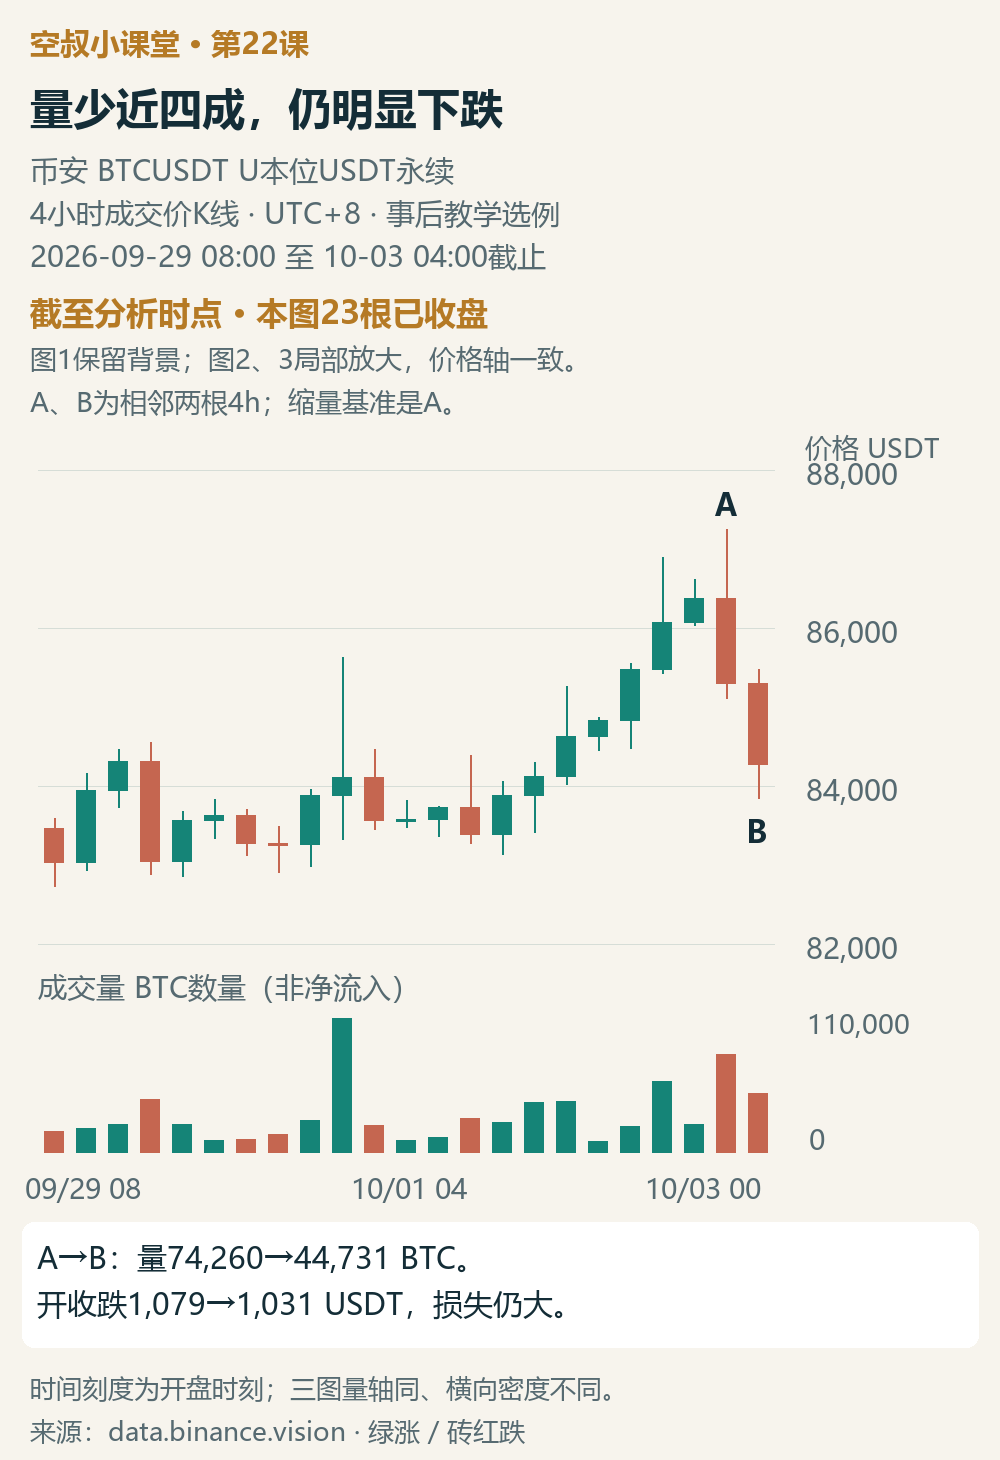
This is a 4-hour candlestick chart of Binance BTCUSDT USDT-margined perpetual contract trade prices, with all times in UTC+8. It is a real-market example selected for educational purposes after the fact. Figure 1 starts at 08:00 on September 29, 2026, and shows only the 23 closed candles up to 04:00 on October 3.
Price had repeatedly moved higher earlier, but at A it rose and then closed lower. B is the bar that opened at 00:00 on October 3: volume fell from about 74,300 BTC at A to about 44,700, while the open-to-close decline was still about 1,031 USDT, not far from A’s roughly 1,079.
B’s volume fell by nearly 40%, yet its open-to-close decline was still close to A’s. Although its high-low range was smaller than A’s, it still closed lower, near 84,267. Price was still moving markedly downward; lower volume alone was not enough to conclude that the risk of continued declines had eased.
At this point, it is worth questioning whether buyers are still providing insufficient support below. Lower total volume neither directly proves that selling pressure has disappeared nor tells us exactly how much demand has decreased. We also need to see how price responds.
In Figure 3-19 of the original book, the author remained uncertain about the long down bar after b: volume did not increase during the decline, so the author did not interpret it as expanding supply, but rather as a lack of demand. If so, there was still a chance for buyers to lift the price later. Whether that chance materialized would be answered by the subsequent rebound.
For this BTC move, I’ll note two known levels: B opened near 85,298, and A opened near 86,377. Only if price gradually recovers these starting points of the declines and holds above them is it making up lost ground. If the rebound is weak and price later closes below B’s low of 83,841.9 again, concern will increase. These are reference points for observing this example, not buy or sell levels prescribed by the original book.
C and D did rebound, but the recovery has not gone very far yet
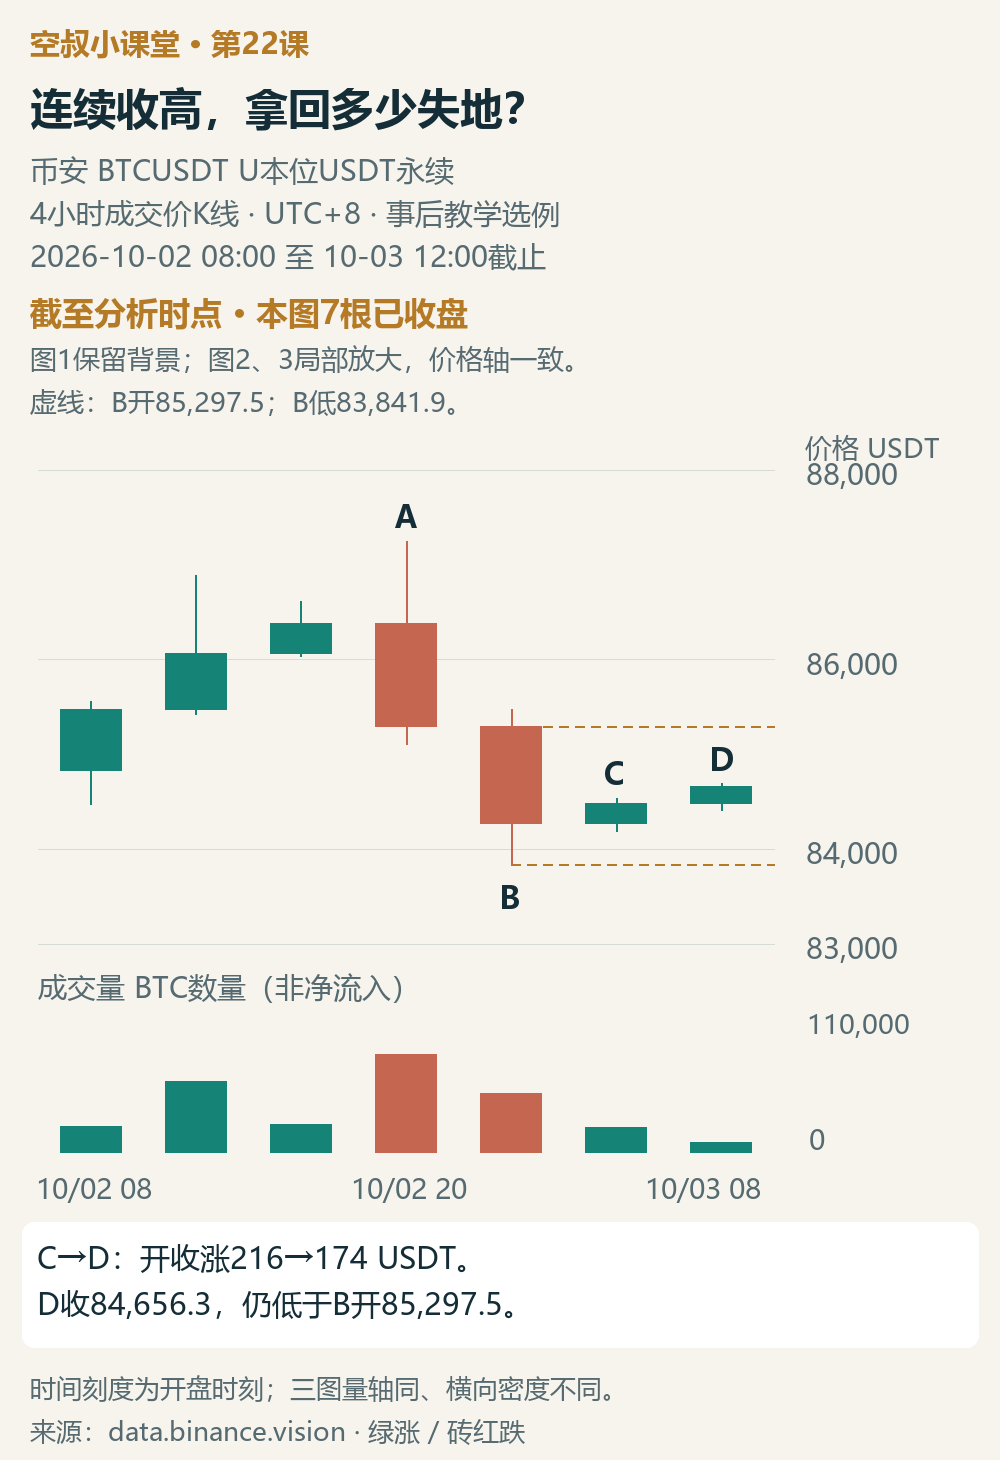
For now, we can see only as far as 12:00 on October 3. Chart 2 enlarges the seven bars from 08:00 on October 2 onward. Its price axis is narrower than Chart 1’s; Charts 2 and 3 use the same price axis, and all three charts use the same volume axis, but their horizontal densities differ.
After B, C and D both closed higher. Consider the two rebounds together: D had lower volume, a narrower high-low range, and a smaller open-to-close rise, shrinking from about 216 to 174 USDT. D closed near 84,656, still short of recovering the starting point of B’s decline.
That is the specific question “quality of the rebound” is meant to answer: price rose, but how much lost ground did it recover? The consecutive decline has paused for now, which can ease concern somewhat; but compared with B’s decline, these two bars have not recovered much.
D also closed near its high, which is another sign of improvement. If price continues to rise and holds, concern can ease further as the recovery progresses. If the rebound is pushed back down, price closes below B’s low again, and fails to recover, the evidence that selling pressure is following through will increase.
The original book also continued to test its interpretation by looking at the rebound and whether selling pressure followed. The low-volume, narrow-range rebound failed to restore the uptrend; later, the sharp upward move failed to continue, and selling followed. Only then did the author strengthen the explanation that supply was expanding. “Supply has not expanded” in the earlier section and “supply is expanding” in the later section refer to different stages; the judgment changes as new evidence emerges.
What followed did not continue in the direction suggested by the weak price action
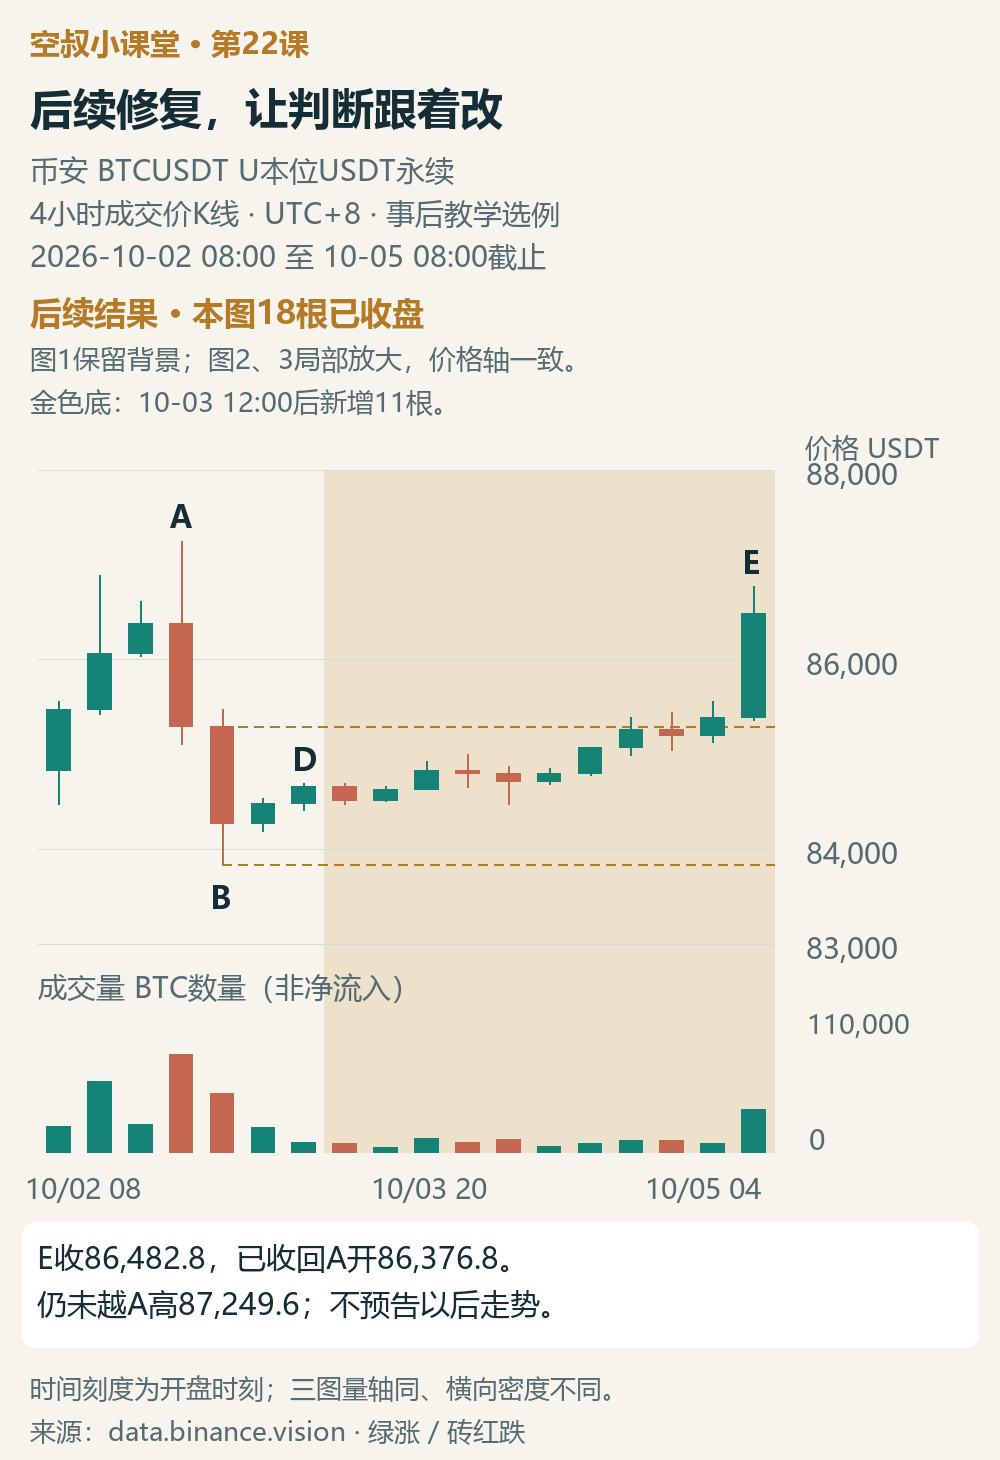
The outcome through October 5 at 08:00 is revealed separately at the end. The gold section adds the 11 bars after D; the first two charts did not use this information.
At first, price moved back and forth modestly, and the rebound was not smooth. It did not break below B’s low again, then gradually recovered B’s opening level. At E, volume increased compared with the immediately preceding bar, and the open-to-close rise was about 1,095 USDT. It ultimately closed at 86,482.8, recovering even A’s opening level.
At this point, there is stronger evidence for easing concerns about continued downward pressure. The recovery has gone further—from C and D’s modest rebounds to E recovering the starting point of the two-bar decline—and the feared further downward pressure did not materialize. The later improvement should not keep being explained away as a bull trap just because the initial rebound was weak.
E has not yet exceeded A’s high, and whether the recovery can hold afterward is beyond the scope of this result. So this section shows only that the recovery has made progress; it does not prove that the uptrend has fully resumed.
The original book’s example later weakened, while this BTC move recovered. Keeping that difference in mind is a good reminder: chart reading means testing an interpretation against new evidence, not finding a few similar candlesticks and copying the outcome.
My learning summary
What I want to remember from this lesson is that concern can ease gradually as a recovery progresses; it does not have to be a choice between “dangerous” and “safe.” The evidence lies in how much lost ground price recovers, whether those gains hold, and whether selling pressure continues to follow through.
Traders already holding long positions do not need to wait for distribution to be definitively confirmed if a pre-established risk exit condition is triggered; exiting a long position does not automatically mean going short. This is an additional note for the series; this lesson does not provide new entry or stop-loss parameters.
A short exercise
Look only at Chart 2, without using Chart 3: compared with when B had just closed, how should your concern about further declines change after C and D appear? Point to one sign of improvement and one sign that the recovery remains limited, then describe one subsequent change that would make your concern rise again.
Share the evidence behind your answer in the comments; don’t just say “up” or “down.” A reference analysis will be added to the comments on this post later.
On the trading journey, Uncle Short is here to grow alongside you.#空叔小课堂 #威科夫供需量价