
Mira小白桃
594 Posts

Mira小白桃
Report
Block User
推特X:xiaobaitao05,越南胡志明,边学Web3边看市场。开播时间:周一到周五:下午16:30,周六周日:6点后陪你聊行情和热点, 分享学习心得, 陪新手一起成长
High-Frequency Trader
4.3 Months
265 Following
17.6K+ Followers
2.5K+ Liked
Posts
All
Quotes
Videos
Live
PINNED
·
--
📈 The broad market is surging hard—can it really be only because the “bad news has been fully digested”?
But I think we can’t just look at this one point.
What’s more worth paying attention to is:
price structure, fund flows, and changes in market selling pressure.
$BTC has moved back above the 50-week moving average. In the historical data, after recapturing this line, many times it means the market’s weakest phase may have already passed.
At the same time, recently BTC spot ETFs have seen renewed inflows, and the selling pace from long-term holders has also clearly slowed.
In short:
Selling pressure is weakening, and buyers are starting to take the initiative again.
So right now I’m actually not very willing to short directly on Monday.
So how should we look at this week?
My idea is very simple:
Don’t rush to short on Monday—wait for trend confirmation on Tuesday and Wednesday.
For BTC support, I’m mainly watching around the 79K area.
As long as after a pullback it can hold, the strong structure hasn’t been broken.
On the upside, I’m watching the resistance zone at 82K—83K.
If it can break through effectively and hold above it, the market may continue seeking room toward higher levels.
So don’t, just because it’s already risen a lot, immediately guess the top.
Rising a lot doesn’t mean it’s going to drop right away.
$ETH is the same as well.
The second coin (二饼) has returned to around 2700. On top, the key focus is the 2700—2800 region.
Because a bull market doesn’t rise in a straight line every day.
In a real uptrend, there will definitely be pullbacks in between.
It might rally high and then fall back, or it might suddenly wick upward to wash out the chasing long positions.
So my approach is still:
First look for longs → hit the resistance zone → guard against a shakeout → pullback and confirm.
If the structure hasn’t broken, then we look at the next leg.
So what I want to say right now is just one sentence:
Wait for shorts.
It’s not that there’s no chance to short—it's that we’re not at the level where I want to short yet.
If BTC and ETH continue to hold key support, it means the bulls are still in control.
Wait until you reach the big resistance overhead and see a clear stall and a volume-backed pullback—then observe the short opportunity.
Trading isn’t about starting to guess the top just because it’s gone up a lot.
What matters is knowing when to act and when to wait.
My plan for this week:
Bias is bullish—wait for confirmation by levels.
Be patient on Monday; confirm on Tuesday and Wednesday.
When the bull run comes, it won’t move only one step.
After the rally, the pullback/shakeout is actually the opportunity we should be waiting for.
📈 The broad market is surging hard—can it really be only because the “bad news has been fully digested”?
But I think we can’t just look at this one point.
What’s more worth paying attention to is:
price structure, fund flows, and changes in market selling pressure.
$BTC has moved back above the 50-week moving average. In the historical data, after recapturing this line, many times it means the market’s weakest phase may have already passed.
At the same time, recently BTC spot ETFs have seen renewed inflows, and the selling pace from long-term holders has also clearly slowed.
In short:
Selling pressure is weakening, and buyers are starting to take the initiative again.
So right now I’m actually not very willing to short directly on Monday.
So how should we look at this week?
My idea is very simple:
Don’t rush to short on Monday—wait for trend confirmation on Tuesday and Wednesday.
For BTC support, I’m mainly watching around the 79K area.
As long as after a pullback it can hold, the strong structure hasn’t been broken.
On the upside, I’m watching the resistance zone at 82K—83K.
If it can break through effectively and hold above it, the market may continue seeking room toward higher levels.
So don’t, just because it’s already risen a lot, immediately guess the top.
Rising a lot doesn’t mean it’s going to drop right away.
$ETH is the same as well.
The second coin (二饼) has returned to around 2700. On top, the key focus is the 2700—2800 region.
Because a bull market doesn’t rise in a straight line every day.
In a real uptrend, there will definitely be pullbacks in between.
It might rally high and then fall back, or it might suddenly wick upward to wash out the chasing long positions.
So my approach is still:
First look for longs → hit the resistance zone → guard against a shakeout → pullback and confirm.
If the structure hasn’t broken, then we look at the next leg.
So what I want to say right now is just one sentence:
Wait for shorts.
It’s not that there’s no chance to short—it's that we’re not at the level where I want to short yet.
If BTC and ETH continue to hold key support, it means the bulls are still in control.
Wait until you reach the big resistance overhead and see a clear stall and a volume-backed pullback—then observe the short opportunity.
Trading isn’t about starting to guess the top just because it’s gone up a lot.
What matters is knowing when to act and when to wait.
My plan for this week:
Bias is bullish—wait for confirmation by levels.
Be patient on Monday; confirm on Tuesday and Wednesday.
When the bull run comes, it won’t move only one step.
After the rally, the pullback/shakeout is actually the opportunity we should be waiting for.
But I think we can’t just look at this one point.
What’s more worth paying attention to is:
price structure, fund flows, and changes in market selling pressure.
$BTC has moved back above the 50-week moving average. In the historical data, after recapturing this line, many times it means the market’s weakest phase may have already passed.
At the same time, recently BTC spot ETFs have seen renewed inflows, and the selling pace from long-term holders has also clearly slowed.
In short:
Selling pressure is weakening, and buyers are starting to take the initiative again.
So right now I’m actually not very willing to short directly on Monday.
So how should we look at this week?
My idea is very simple:
Don’t rush to short on Monday—wait for trend confirmation on Tuesday and Wednesday.
For BTC support, I’m mainly watching around the 79K area.
As long as after a pullback it can hold, the strong structure hasn’t been broken.
On the upside, I’m watching the resistance zone at 82K—83K.
If it can break through effectively and hold above it, the market may continue seeking room toward higher levels.
So don’t, just because it’s already risen a lot, immediately guess the top.
Rising a lot doesn’t mean it’s going to drop right away.
$ETH is the same as well.
The second coin (二饼) has returned to around 2700. On top, the key focus is the 2700—2800 region.
Because a bull market doesn’t rise in a straight line every day.
In a real uptrend, there will definitely be pullbacks in between.
It might rally high and then fall back, or it might suddenly wick upward to wash out the chasing long positions.
So my approach is still:
First look for longs → hit the resistance zone → guard against a shakeout → pullback and confirm.
If the structure hasn’t broken, then we look at the next leg.
So what I want to say right now is just one sentence:
Wait for shorts.
It’s not that there’s no chance to short—it's that we’re not at the level where I want to short yet.
If BTC and ETH continue to hold key support, it means the bulls are still in control.
Wait until you reach the big resistance overhead and see a clear stall and a volume-backed pullback—then observe the short opportunity.
Trading isn’t about starting to guess the top just because it’s gone up a lot.
What matters is knowing when to act and when to wait.
My plan for this week:
Bias is bullish—wait for confirmation by levels.
Be patient on Monday; confirm on Tuesday and Wednesday.
When the bull run comes, it won’t move only one step.
After the rally, the pullback/shakeout is actually the opportunity we should be waiting for.

1.7k
21
83
1.7k
PINNED
·
--
When you’re bored, feel free to come chat in the group and bullsh*t a bit 🍑
We can also discuss and exchange interesting news and market hotspots~
See you every afternoon in the live room—don’t be a stranger ❤️
When you’re bored, feel free to come chat in the group and bullsh*t a bit 🍑
We can also discuss and exchange interesting news and market hotspots~
See you every afternoon in the live room—don’t be a stranger ❤️
We can also discuss and exchange interesting news and market hotspots~
See you every afternoon in the live room—don’t be a stranger ❤️


17
6
79
135
·
--

CJ_GraceWang1688
·
--
🚀🚀🚀
$DOGE
#狗狗币上涨15%
Will Dogecoin reach $1 in 2027?
$DOGE
#狗狗币上涨15%
Will Dogecoin reach $1 in 2027?
1
3
·
--

长得帅不如跑的快1688
·
--
🚨 Bitcoin’s next big move may not be decided by Bitcoin.
It may be decided by the FED.
Crypto has already delivered a powerful breakout.
But now the biggest variable for risk assets is moving back to:
INTEREST RATES.
If the Fed stays hawkish:
💵 The dollar could remain strong
📈 Treasury yields stay elevated
💧 Global liquidity stays tight
₿ BTC faces more pressure at higher levels
But if markets begin pricing a real policy shift:
💰 Liquidity expectations improve
📉 Yields could cool further
🔥 Capital returns to risk assets
₿ Bitcoin’s breakout could enter a second phase
So the real question isn’t:
“Does BTC go up or down tomorrow?”
It’s:
WHAT IS THE FED’S NEXT MOVE?
For Bitcoin,
the breakout is only step one.
What could determine how far this rally ultimately goes is still:
GLOBAL LIQUIDITY.
Now I’m watching:
🏦 The Fed’s next signal
📈 U.S. Treasury yields
💵 The U.S. dollar
₿ Whether BTC holds its breakout zone
👇 Your take?
POLICY EASING → BTC HIGHER 🟢
or
HIGHER RATES → MORE PRESSURE 🔴?
#BTC #ETH #BNB
It may be decided by the FED.
Crypto has already delivered a powerful breakout.
But now the biggest variable for risk assets is moving back to:
INTEREST RATES.
If the Fed stays hawkish:
💵 The dollar could remain strong
📈 Treasury yields stay elevated
💧 Global liquidity stays tight
₿ BTC faces more pressure at higher levels
But if markets begin pricing a real policy shift:
💰 Liquidity expectations improve
📉 Yields could cool further
🔥 Capital returns to risk assets
₿ Bitcoin’s breakout could enter a second phase
So the real question isn’t:
“Does BTC go up or down tomorrow?”
It’s:
WHAT IS THE FED’S NEXT MOVE?
For Bitcoin,
the breakout is only step one.
What could determine how far this rally ultimately goes is still:
GLOBAL LIQUIDITY.
Now I’m watching:
🏦 The Fed’s next signal
📈 U.S. Treasury yields
💵 The U.S. dollar
₿ Whether BTC holds its breakout zone
👇 Your take?
POLICY EASING → BTC HIGHER 🟢
or
HIGHER RATES → MORE PRESSURE 🔴?
#BTC #ETH #BNB

18
·
--


帮帮Bonnie
·
--
BullishCross hardships with composure, view gains and losses indifferently. No resentment, no obsession.
Cross hardships with composure, view gains and losses indifferently. No resentment, no obsession.
#AI股持续上涨还有哪些投资机会
$CRCL
Cross hardships with composure, view gains and losses indifferently. No resentment, no obsession.
#AI股持续上涨还有哪些投资机会
$CRCL

1
484
·
--

SabTheTrader
·
--
BullishToday Dogecoin is stealing the spotlight. 🐶
$DOGE 24H It once surged more than 15%, climbing back up to $0.10, with its gains leading among major coins; $BTC , by contrast, has stayed steady around $85,000.
The rotation of funds these days is really fast—yesterday I was watching BTC, and today the main character has already switched to DOGE. 👀
#狗狗币上涨15%
$DOGE 24H It once surged more than 15%, climbing back up to $0.10, with its gains leading among major coins; $BTC , by contrast, has stayed steady around $85,000.
The rotation of funds these days is really fast—yesterday I was watching BTC, and today the main character has already switched to DOGE. 👀
#狗狗币上涨15%

163
·
--

慢就是快Mike
·
--
$BTC Has Bitcoin got a major crash coming?
Connection Capital founder warns: Bitcoin could pull back 50% in Q4 2026, falling to $30K–$40K According to Connection Capital founder and former research director for Coin Bureau, Dan Krupka, if Bitcoin rises to $96,000, it may face a significant correction in Q4 2026, with a pullback of as much as 50%—down to the $30,000 to $40,000 range. Krupka warns that although current technical indicators look strong, the underlying pattern is more like a “textbook relief rebound” rather than the start of a new bull market. He notes that Bitcoin’s total market capitalization is nearing the monthly Bollinger Band resistance level, which is typically used to distinguish between a distribution phase and a sustained bull-market trend. Meanwhile, macro resistance is emerging: the U.S. Dollar Index (DXY) is nearing the monthly Bollinger Band resistance level, persistent energy shortages in Europe and Asia are keeping the euro and yen weak, driving global capital inflows into the dollar and potentially triggering a sell-off in risk assets.
Connection Capital founder warns: Bitcoin could pull back 50% in Q4 2026, falling to $30K–$40K According to Connection Capital founder and former research director for Coin Bureau, Dan Krupka, if Bitcoin rises to $96,000, it may face a significant correction in Q4 2026, with a pullback of as much as 50%—down to the $30,000 to $40,000 range. Krupka warns that although current technical indicators look strong, the underlying pattern is more like a “textbook relief rebound” rather than the start of a new bull market. He notes that Bitcoin’s total market capitalization is nearing the monthly Bollinger Band resistance level, which is typically used to distinguish between a distribution phase and a sustained bull-market trend. Meanwhile, macro resistance is emerging: the U.S. Dollar Index (DXY) is nearing the monthly Bollinger Band resistance level, persistent energy shortages in Europe and Asia are keeping the euro and yen weak, driving global capital inflows into the dollar and potentially triggering a sell-off in risk assets.

1
199
·
--
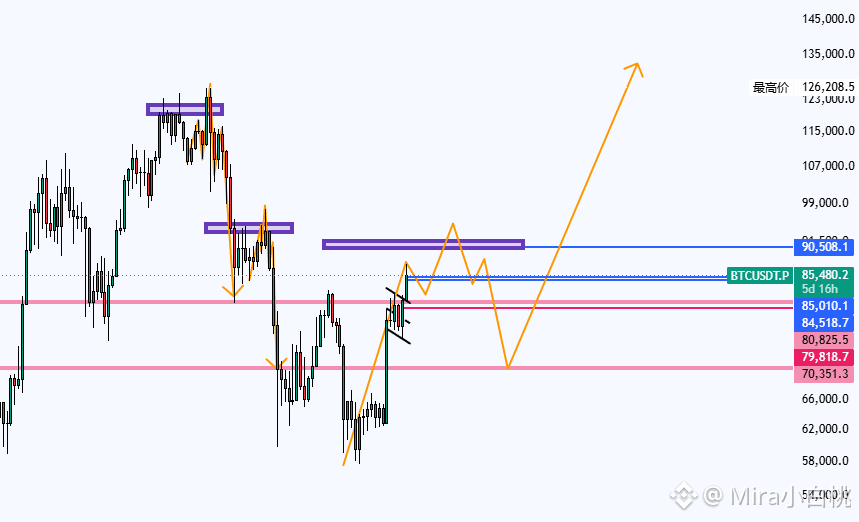
📈 $BTC This rally is underway, and for now I haven’t seen an end yet.
Based on the current structure, after BTC (the “big coin”) broke above the prior key resistance, it has already returned to a strong phase.
Today, BTC’s high already came close to 86,000, and this move isn’t driven purely by sentiment. ETF inflows returning, short covering, and improvements in technical structure are all providing support for this rebound.
So my approach is simple:
I’m bullish first, focusing on waiting for confirmation of the breakout.
The most important level right now is around 85K.
If price can hold above it, then the short-term structure is still leaning bullish.
The first resistance zone above is around 85.5K–86K.
If it continues to break out there on increased volume, then the next targets are:
88K → the 90K–91K area.
Some analysts also see 89K as the next major resistance, and higher up to watch are 90K and even the 96K region.
So don’t start guessing the top just because BTC has already risen a lot.
Rising high doesn’t automatically mean an immediate top.
Of course, during a strong uptrend there will also be pullbacks.
If BTC quickly drops after hitting the upper resistance, I would actually first look at whether it can hold around 84.5K.
Below that, 80K–81K is still very important structural support.
As long as the key support hasn’t been broken, I interpret a pullback as:
profit-taking / shakeout during the up-move, not an end to the trend.
That’s also why I don’t really want to chase shorts right now.
My trading logic is still the same:
Big picture: bullish. Short term: wait for confirmation.
Hold 85K, then watch 86K.
Break 86K, then look to 88K.
After a break above 88K, the market can begin to truly challenge the 90K–91K big range.
And if 90K can also complete a breakout and hold, then the room ahead will open up even more.
So the focus right now isn’t:
“BTC has risen so much—can it still go up?”
But rather:
“Can each key resistance turn into new support?”
As long as this structure keeps being confirmed,
this rally hasn’t finished yet.
{future}(BTCUSDT)
📈 $BTC This rally is underway, and for now I haven’t seen an end yet.
Based on the current structure, after BTC (the “big coin”) broke above the prior key resistance, it has already returned to a strong phase.
Today, BTC’s high already came close to 86,000, and this move isn’t driven purely by sentiment. ETF inflows returning, short covering, and improvements in technical structure are all providing support for this rebound.
So my approach is simple:
I’m bullish first, focusing on waiting for confirmation of the breakout.
The most important level right now is around 85K.
If price can hold above it, then the short-term structure is still leaning bullish.
The first resistance zone above is around 85.5K–86K.
If it continues to break out there on increased volume, then the next targets are:
88K → the 90K–91K area.
Some analysts also see 89K as the next major resistance, and higher up to watch are 90K and even the 96K region.
So don’t start guessing the top just because BTC has already risen a lot.
Rising high doesn’t automatically mean an immediate top.
Of course, during a strong uptrend there will also be pullbacks.
If BTC quickly drops after hitting the upper resistance, I would actually first look at whether it can hold around 84.5K.
Below that, 80K–81K is still very important structural support.
As long as the key support hasn’t been broken, I interpret a pullback as:
profit-taking / shakeout during the up-move, not an end to the trend.
That’s also why I don’t really want to chase shorts right now.
My trading logic is still the same:
Big picture: bullish. Short term: wait for confirmation.
Hold 85K, then watch 86K.
Break 86K, then look to 88K.
After a break above 88K, the market can begin to truly challenge the 90K–91K big range.
And if 90K can also complete a breakout and hold, then the room ahead will open up even more.
So the focus right now isn’t:
“BTC has risen so much—can it still go up?”
But rather:
“Can each key resistance turn into new support?”
As long as this structure keeps being confirmed,
this rally hasn’t finished yet.
Based on the current structure, after BTC (the “big coin”) broke above the prior key resistance, it has already returned to a strong phase.
Today, BTC’s high already came close to 86,000, and this move isn’t driven purely by sentiment. ETF inflows returning, short covering, and improvements in technical structure are all providing support for this rebound.
So my approach is simple:
I’m bullish first, focusing on waiting for confirmation of the breakout.
The most important level right now is around 85K.
If price can hold above it, then the short-term structure is still leaning bullish.
The first resistance zone above is around 85.5K–86K.
If it continues to break out there on increased volume, then the next targets are:
88K → the 90K–91K area.
Some analysts also see 89K as the next major resistance, and higher up to watch are 90K and even the 96K region.
So don’t start guessing the top just because BTC has already risen a lot.
Rising high doesn’t automatically mean an immediate top.
Of course, during a strong uptrend there will also be pullbacks.
If BTC quickly drops after hitting the upper resistance, I would actually first look at whether it can hold around 84.5K.
Below that, 80K–81K is still very important structural support.
As long as the key support hasn’t been broken, I interpret a pullback as:
profit-taking / shakeout during the up-move, not an end to the trend.
That’s also why I don’t really want to chase shorts right now.
My trading logic is still the same:
Big picture: bullish. Short term: wait for confirmation.
Hold 85K, then watch 86K.
Break 86K, then look to 88K.
After a break above 88K, the market can begin to truly challenge the 90K–91K big range.
And if 90K can also complete a breakout and hold, then the room ahead will open up even more.
So the focus right now isn’t:
“BTC has risen so much—can it still go up?”
But rather:
“Can each key resistance turn into new support?”
As long as this structure keeps being confirmed,
this rally hasn’t finished yet.
539
·
--
$ORDI 小白桃看好你嘿嘿
{spot}(ORDIUSDT)
$ORDI 小白桃看好你嘿嘿

Mira小白桃
·
--
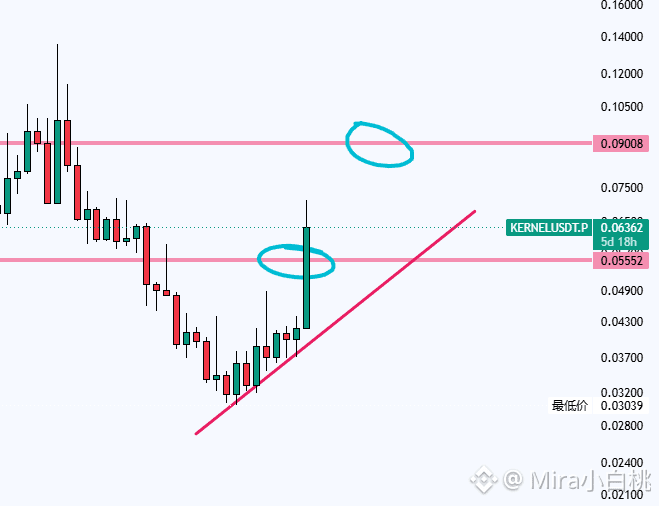
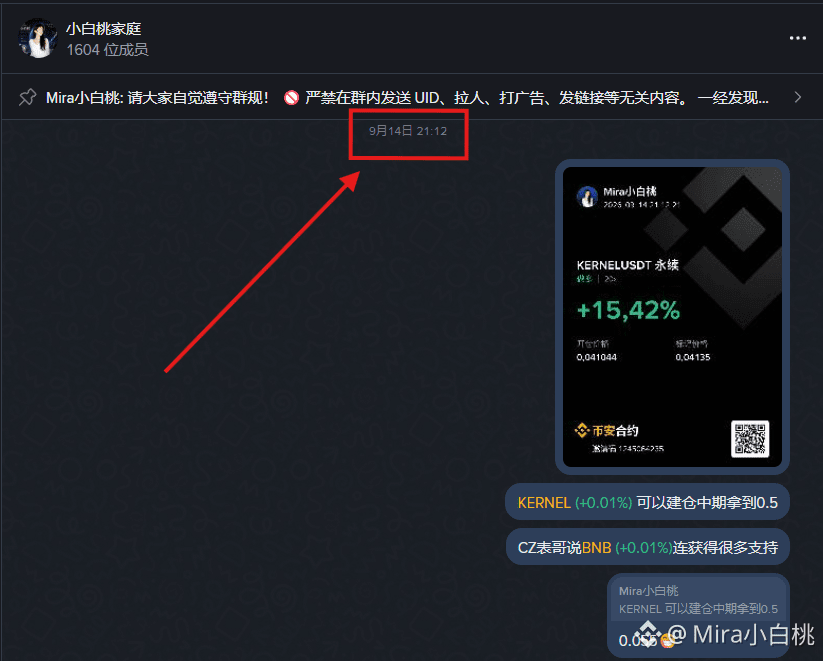
$KERNEL 9月14th buy, today’s small goal perfect exceeded, continue holding
Don’t wait until everything has already flown before you buy; $SUI is the most obvious example
Family, what’s the next target worth paying attention to?
Don’t wait until everything has already flown before you buy; $SUI is the most obvious example
Family, what’s the next target worth paying attention to?
517
·
--
$KERNEL 9月14th buy, today’s small goal perfect exceeded, continue holding
Don’t wait until everything has already flown before you buy; $SUI is the most obvious example
Family, what’s the next target worth paying attention to?
{future}(SUIUSDT)
{future}(KERNELUSDT)
$KERNEL 9月14th buy, today’s small goal perfect exceeded, continue holding
Don’t wait until everything has already flown before you buy; $SUI is the most obvious example
Family, what’s the next target worth paying attention to?
Don’t wait until everything has already flown before you buy; $SUI is the most obvious example
Family, what’s the next target worth paying attention to?
1
1
584
·
--
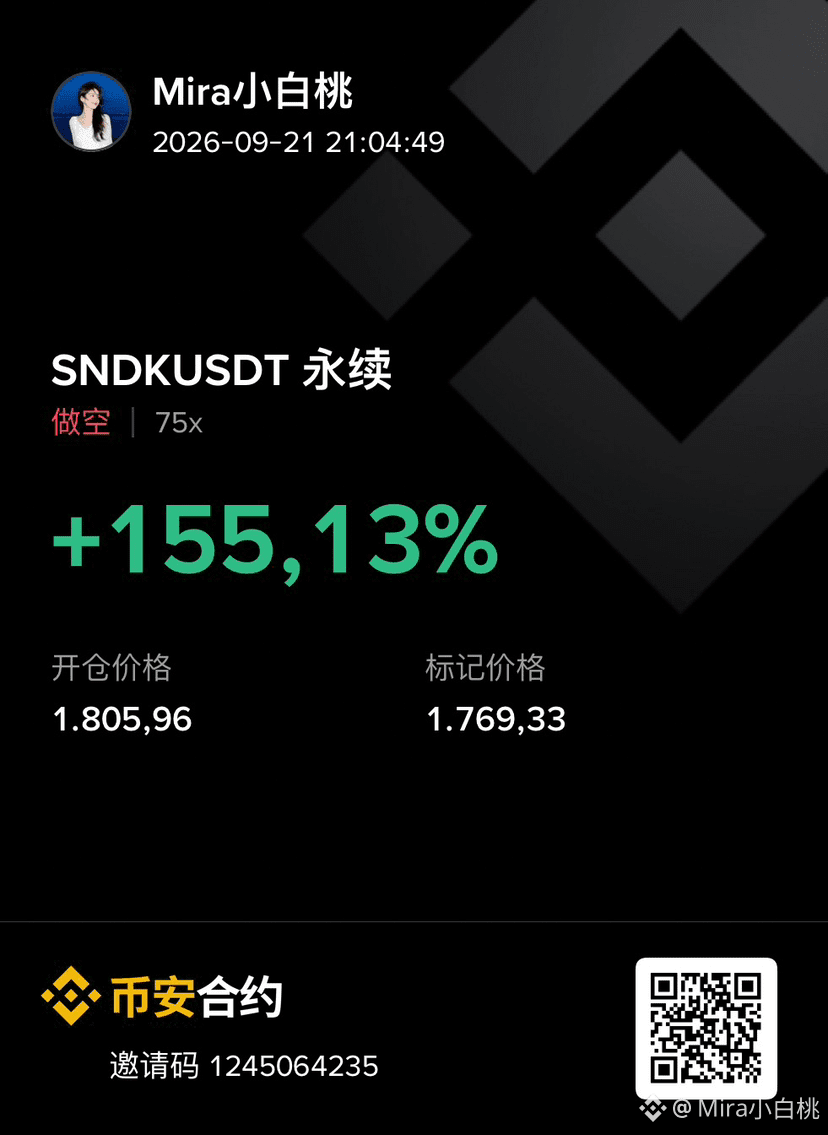
$SNDK SanDisk give it a little more power 😁
{future}(SNDKUSDT)
$SNDK SanDisk give it a little more power 😁
3
663
·
--
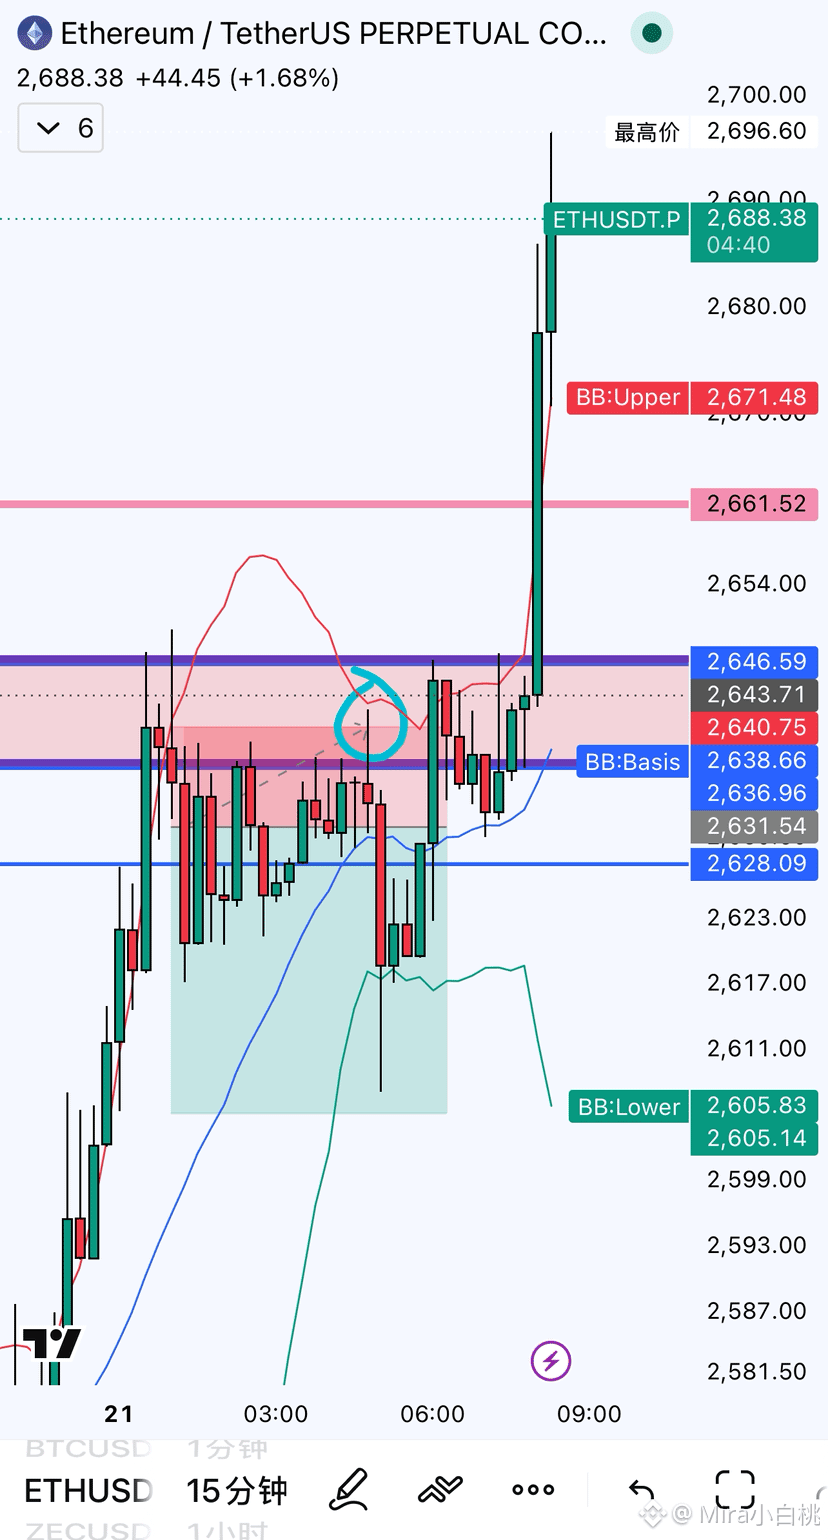
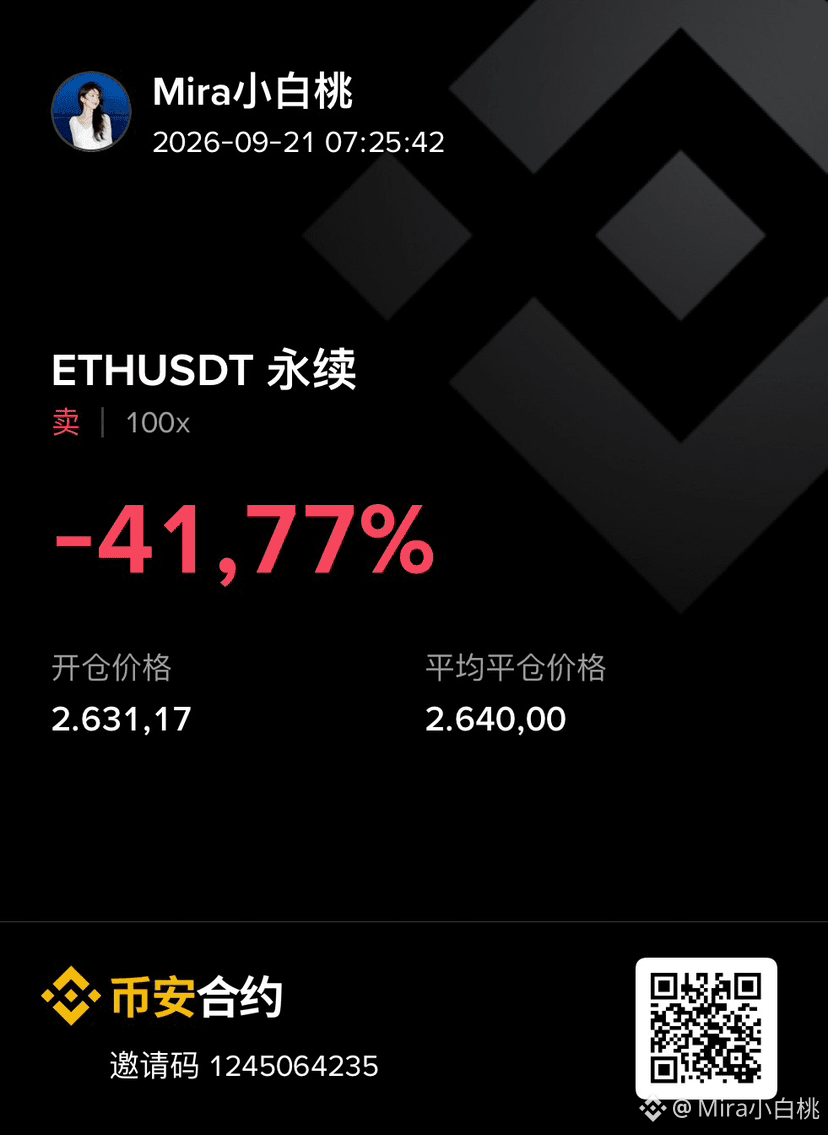
Why does the market seem to be running only at midnight lately?
Next time I trade short-term, I can’t sleep—I won’t take positions while sleeping.
My luck is a bit bad. I took profit after being down 3%, and then I ended up paying tuition again 😅
Why does the market seem to be running only at midnight lately?
Next time I trade short-term, I can’t sleep—I won’t take positions while sleeping.
My luck is a bit bad. I took profit after being down 3%, and then I ended up paying tuition again 😅
Next time I trade short-term, I can’t sleep—I won’t take positions while sleeping.
My luck is a bit bad. I took profit after being down 3%, and then I ended up paying tuition again 😅
1
801
·
--
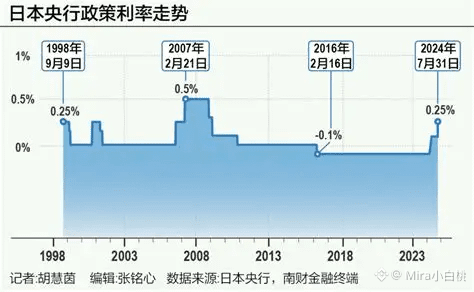
The Bank of Japan raises rates to a 31-year high—where does the market go next?
The Bank of Japan has just raised its policy rate to 1.25%, the highest level since 1995.
And just a couple of days ago, the Federal Reserve also completed a rate hike.
So this time, the market situation is somewhat special:
Fed rate hike + Bank of Japan rate hike
The global liquidity environment is changing.
Many people’s first reaction might be:
“Japan is hiking rates—won’t risk assets fall?”
But I think it’s not that simple.
Because this rate hike itself was already largely anticipated by the market, and after the news hit, the yen actually weakened, while BTC didn’t show a clear one-way selloff.
So what really matters now isn’t this rate hike itself.
Instead, it’s:
Will the Bank of Japan continue tightening further?
If it keeps sending hawkish signals going forward, the cost of yen funding could rise again, potentially affecting global capital flows and increasing volatility in risk assets like BTC and ETH.
But if the Bank of Japan maintains a more cautious pace afterward, concerns about further rate hikes may gradually get priced in.
So my thinking is quite simple:
In the short term, don’t automatically go bearish on BTC just because of the phrase “Japan rate hike.”
What matters more now is to look at:
Whether there’s a risk of capital withdrawing from risk assets, whether BTC’s key support can hold, and the Bank of Japan’s policy stance going forward.
After the news is released, how the price moves is always more important than the headline itself.
Trading news isn’t just about looking at two words like “bad news”—it’s about whether the market actually confirms it with a selloff.
$BTC $ETH $BNB
{future}(SOLUSDT)
{future}(ETHUSDT)
{future}(BTCUSDT)
#日本央行加息至31年高位
The Bank of Japan raises rates to a 31-year high—where does the market go next?
The Bank of Japan has just raised its policy rate to 1.25%, the highest level since 1995.
And just a couple of days ago, the Federal Reserve also completed a rate hike.
So this time, the market situation is somewhat special:
Fed rate hike + Bank of Japan rate hike
The global liquidity environment is changing.
Many people’s first reaction might be:
“Japan is hiking rates—won’t risk assets fall?”
But I think it’s not that simple.
Because this rate hike itself was already largely anticipated by the market, and after the news hit, the yen actually weakened, while BTC didn’t show a clear one-way selloff.
So what really matters now isn’t this rate hike itself.
Instead, it’s:
Will the Bank of Japan continue tightening further?
If it keeps sending hawkish signals going forward, the cost of yen funding could rise again, potentially affecting global capital flows and increasing volatility in risk assets like BTC and ETH.
But if the Bank of Japan maintains a more cautious pace afterward, concerns about further rate hikes may gradually get priced in.
So my thinking is quite simple:
In the short term, don’t automatically go bearish on BTC just because of the phrase “Japan rate hike.”
What matters more now is to look at:
Whether there’s a risk of capital withdrawing from risk assets, whether BTC’s key support can hold, and the Bank of Japan’s policy stance going forward.
After the news is released, how the price moves is always more important than the headline itself.
Trading news isn’t just about looking at two words like “bad news”—it’s about whether the market actually confirms it with a selloff.
$BTC $ETH $BNB
#日本央行加息至31年高位
The Bank of Japan has just raised its policy rate to 1.25%, the highest level since 1995.
And just a couple of days ago, the Federal Reserve also completed a rate hike.
So this time, the market situation is somewhat special:
Fed rate hike + Bank of Japan rate hike
The global liquidity environment is changing.
Many people’s first reaction might be:
“Japan is hiking rates—won’t risk assets fall?”
But I think it’s not that simple.
Because this rate hike itself was already largely anticipated by the market, and after the news hit, the yen actually weakened, while BTC didn’t show a clear one-way selloff.
So what really matters now isn’t this rate hike itself.
Instead, it’s:
Will the Bank of Japan continue tightening further?
If it keeps sending hawkish signals going forward, the cost of yen funding could rise again, potentially affecting global capital flows and increasing volatility in risk assets like BTC and ETH.
But if the Bank of Japan maintains a more cautious pace afterward, concerns about further rate hikes may gradually get priced in.
So my thinking is quite simple:
In the short term, don’t automatically go bearish on BTC just because of the phrase “Japan rate hike.”
What matters more now is to look at:
Whether there’s a risk of capital withdrawing from risk assets, whether BTC’s key support can hold, and the Bank of Japan’s policy stance going forward.
After the news is released, how the price moves is always more important than the headline itself.
Trading news isn’t just about looking at two words like “bad news”—it’s about whether the market actually confirms it with a selloff.
$BTC $ETH $BNB
#日本央行加息至31年高位
4
263
·
--
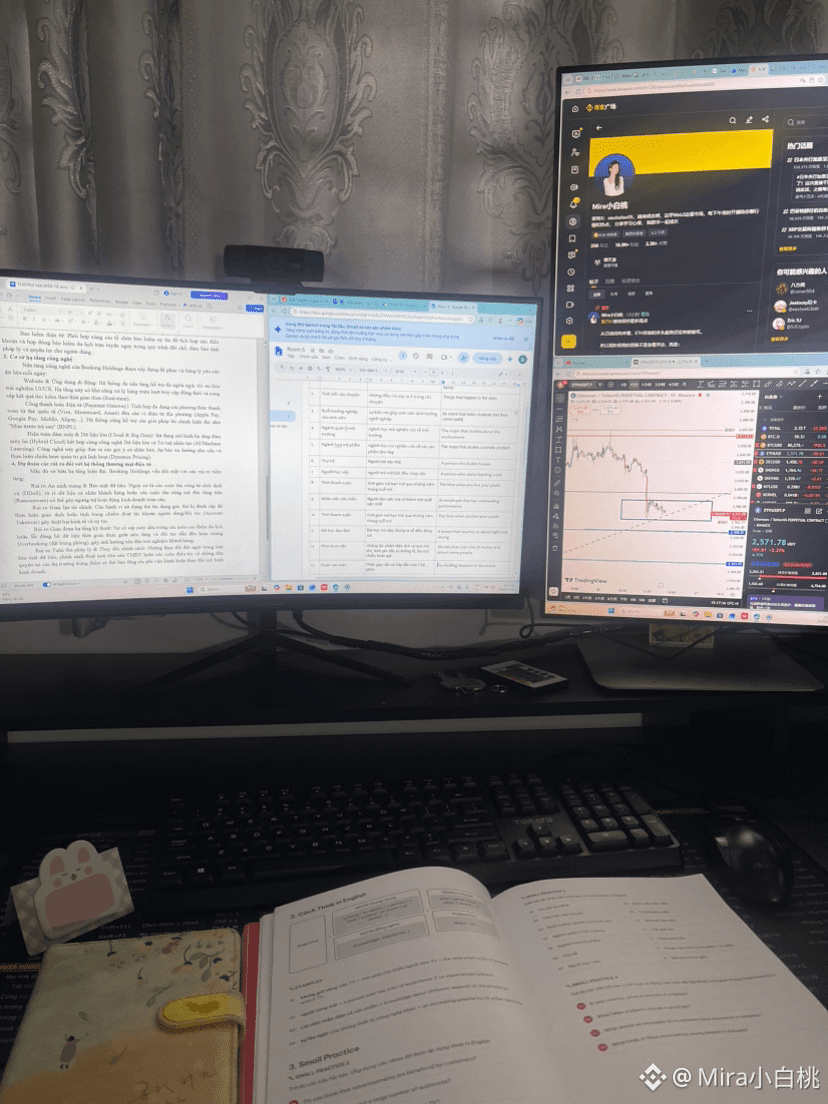
I don’t seem to have a concept of weekends 🥹
How’s the trading going, family members? Tune in at 6 o’clock this weekend—see you then!
I don’t seem to have a concept of weekends 🥹
How’s the trading going, family members? Tune in at 6 o’clock this weekend—see you then!
How’s the trading going, family members? Tune in at 6 o’clock this weekend—see you then!
2
4
585
·
--
Bullish
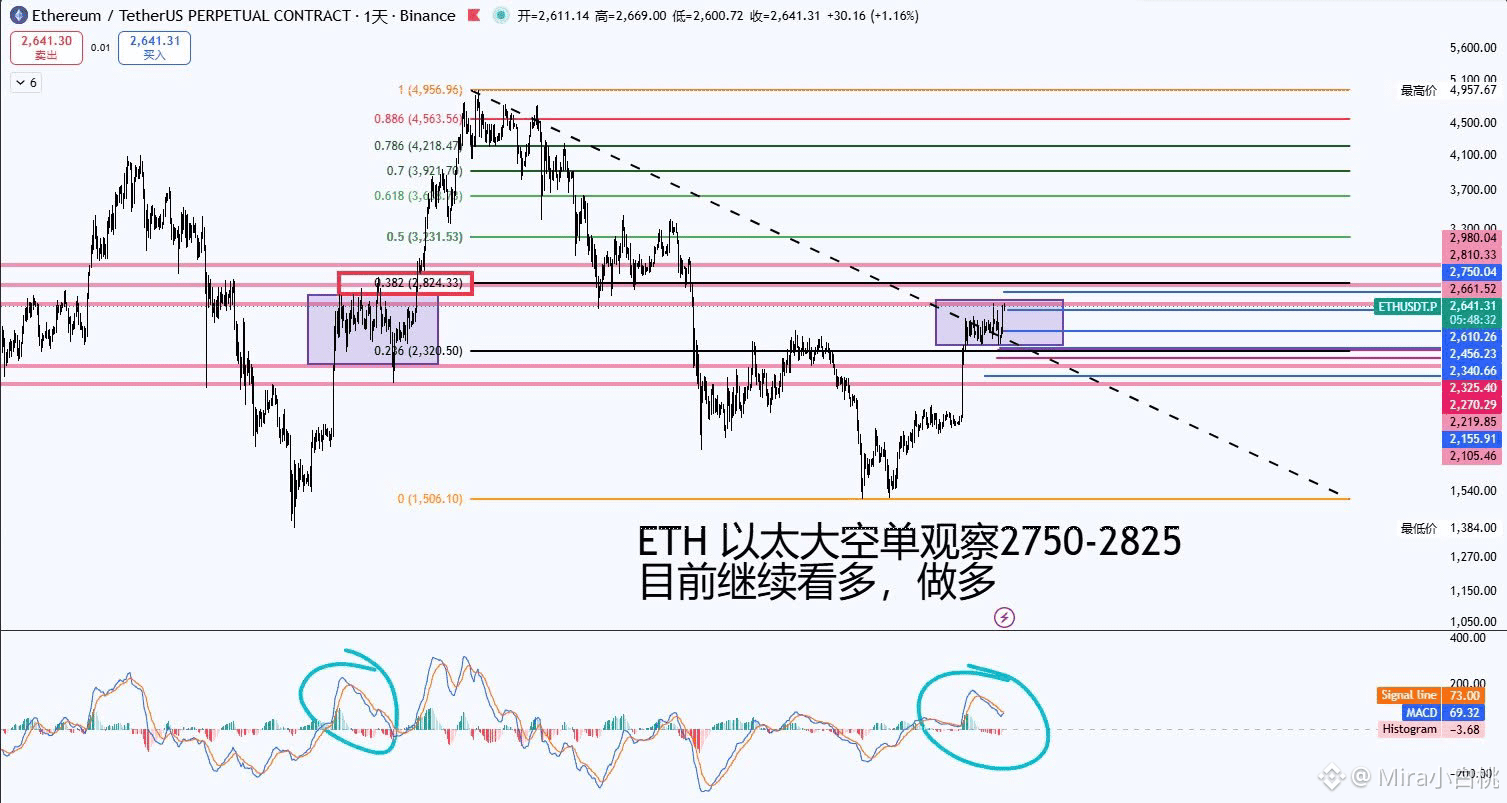
$ETH continues to maintain a bullish outlook
From the daily chart structure, ETH’s current uptrend hasn’t been broken yet.
So at this stage, my thinking isn’t to rush into shorting. Instead, it’s:
Go long first—see how much further it can push up.
Based on the current market analysts’ focus on key resistance zones, I believe ETH still has room to continue testing higher, larger resistance areas.
If this round continues to break through the previous resistance with increased volume, market sentiment can easily heat up again.
But!
When it truly reaches the major resistance zone, I’ll actually start preparing for a big shakeout.
Why?
Because the higher the price goes, the more chase-buying capital there is.
Those who missed the earlier entry will start FOMO, while those who are already in profit will begin to take profits, and leveraged longs will become increasingly crowded.
At that point, if ETH shows in the major resistance zone:
Price spikes but gets rejected → quickly pulls back → breaks below short-term support
…it’s very likely to trigger a relatively large shakeout.
So my scenario is actually quite simple:
Right now, keep looking to go long.
First, see whether ETH can continue pushing upward to hit an even higher resistance area.
Once it reaches the major resistance zone, don’t chase the price—start watching for signals of a higher-timeframe pullback.
If a deeper shakeout really does happen, I’d actually refocus on the support below.
Because for me:
A shakeout doesn’t necessarily mean the bull market is over.
As long as the core structure hasn’t been broken, after the pullback, if it regains and holds key areas again, it could instead be preparation for the next leg of the rally.
So now:
Go long first → push higher → guard against a major shakeout → pull back → then reassess for the bull run.
That’s the clearest ETH trading scenario I have right now.
$ETH continues to maintain a bullish outlook
From the daily chart structure, ETH’s current uptrend hasn’t been broken yet.
So at this stage, my thinking isn’t to rush into shorting. Instead, it’s:
Go long first—see how much further it can push up.
Based on the current market analysts’ focus on key resistance zones, I believe ETH still has room to continue testing higher, larger resistance areas.
If this round continues to break through the previous resistance with increased volume, market sentiment can easily heat up again.
But!
When it truly reaches the major resistance zone, I’ll actually start preparing for a big shakeout.
Why?
Because the higher the price goes, the more chase-buying capital there is.
Those who missed the earlier entry will start FOMO, while those who are already in profit will begin to take profits, and leveraged longs will become increasingly crowded.
At that point, if ETH shows in the major resistance zone:
Price spikes but gets rejected → quickly pulls back → breaks below short-term support
…it’s very likely to trigger a relatively large shakeout.
So my scenario is actually quite simple:
Right now, keep looking to go long.
First, see whether ETH can continue pushing upward to hit an even higher resistance area.
Once it reaches the major resistance zone, don’t chase the price—start watching for signals of a higher-timeframe pullback.
If a deeper shakeout really does happen, I’d actually refocus on the support below.
Because for me:
A shakeout doesn’t necessarily mean the bull market is over.
As long as the core structure hasn’t been broken, after the pullback, if it regains and holds key areas again, it could instead be preparation for the next leg of the rally.
So now:
Go long first → push higher → guard against a major shakeout → pull back → then reassess for the bull run.
That’s the clearest ETH trading scenario I have right now.
From the daily chart structure, ETH’s current uptrend hasn’t been broken yet.
So at this stage, my thinking isn’t to rush into shorting. Instead, it’s:
Go long first—see how much further it can push up.
Based on the current market analysts’ focus on key resistance zones, I believe ETH still has room to continue testing higher, larger resistance areas.
If this round continues to break through the previous resistance with increased volume, market sentiment can easily heat up again.
But!
When it truly reaches the major resistance zone, I’ll actually start preparing for a big shakeout.
Why?
Because the higher the price goes, the more chase-buying capital there is.
Those who missed the earlier entry will start FOMO, while those who are already in profit will begin to take profits, and leveraged longs will become increasingly crowded.
At that point, if ETH shows in the major resistance zone:
Price spikes but gets rejected → quickly pulls back → breaks below short-term support
…it’s very likely to trigger a relatively large shakeout.
So my scenario is actually quite simple:
Right now, keep looking to go long.
First, see whether ETH can continue pushing upward to hit an even higher resistance area.
Once it reaches the major resistance zone, don’t chase the price—start watching for signals of a higher-timeframe pullback.
If a deeper shakeout really does happen, I’d actually refocus on the support below.
Because for me:
A shakeout doesn’t necessarily mean the bull market is over.
As long as the core structure hasn’t been broken, after the pullback, if it regains and holds key areas again, it could instead be preparation for the next leg of the rally.
So now:
Go long first → push higher → guard against a major shakeout → pull back → then reassess for the bull run.
That’s the clearest ETH trading scenario I have right now.
1.6k
16
86
1.6k
·
--
Bitcoin has broken back above $80,000!
This rebound has a particular point that I think is especially worth noting:
After the market experienced rate hikes and regulatory news, BTC did not continue falling. Instead, it managed to regain a key area.
What does that indicate?
At least for now, the market has digested the earlier negative news to some extent.
Also, recently, US spot BTC ETFs have seen renewed capital inflows. On Thursday alone, net inflows were about $160 million, which has provided some funding support for this rebound.
But now, I won’t jump to the conclusion that because BTC broke through $80,000, the trend has completely reversed.
What really matters next is this: can $80,000 turn from resistance into support?
Right now, market analysts are paying close attention to the supply pressure zone overhead.
If BTC can stabilize above $80,000 and then gradually break through the upper supply zone, then this rebound would have a chance to extend further into higher price areas.
However, if after breaking through it falls back below $80,000 again:
Then you need to be careful about a false breakout.
In that case, I would actually focus more on whether the prior support zone below can hold.
So my thinking is very simple right now:
Hold above $80,000 → see whether the overhead resistance can continue to be broken.
Break the supply zone → watch for further trend extension.
Fall back below $80,000 again → prevent getting pulled back into another range-bound retracement.
This market move is no longer just about whether it’s “going up” or not—it’s about:
After the breakout, whether the market can truly turn key resistance into support.
So I’ll say it again:
I still lean bullish on direction, but don’t chase positions recklessly.
#比特币突破8万美元大关 #比特币市值超越特斯拉
Bitcoin has broken back above $80,000!
This rebound has a particular point that I think is especially worth noting:
After the market experienced rate hikes and regulatory news, BTC did not continue falling. Instead, it managed to regain a key area.
What does that indicate?
At least for now, the market has digested the earlier negative news to some extent.
Also, recently, US spot BTC ETFs have seen renewed capital inflows. On Thursday alone, net inflows were about $160 million, which has provided some funding support for this rebound.
But now, I won’t jump to the conclusion that because BTC broke through $80,000, the trend has completely reversed.
What really matters next is this: can $80,000 turn from resistance into support?
Right now, market analysts are paying close attention to the supply pressure zone overhead.
If BTC can stabilize above $80,000 and then gradually break through the upper supply zone, then this rebound would have a chance to extend further into higher price areas.
However, if after breaking through it falls back below $80,000 again:
Then you need to be careful about a false breakout.
In that case, I would actually focus more on whether the prior support zone below can hold.
So my thinking is very simple right now:
Hold above $80,000 → see whether the overhead resistance can continue to be broken.
Break the supply zone → watch for further trend extension.
Fall back below $80,000 again → prevent getting pulled back into another range-bound retracement.
This market move is no longer just about whether it’s “going up” or not—it’s about:
After the breakout, whether the market can truly turn key resistance into support.
So I’ll say it again:
I still lean bullish on direction, but don’t chase positions recklessly.
#比特币突破8万美元大关 #比特币市值超越特斯拉
This rebound has a particular point that I think is especially worth noting:
After the market experienced rate hikes and regulatory news, BTC did not continue falling. Instead, it managed to regain a key area.
What does that indicate?
At least for now, the market has digested the earlier negative news to some extent.
Also, recently, US spot BTC ETFs have seen renewed capital inflows. On Thursday alone, net inflows were about $160 million, which has provided some funding support for this rebound.
But now, I won’t jump to the conclusion that because BTC broke through $80,000, the trend has completely reversed.
What really matters next is this: can $80,000 turn from resistance into support?
Right now, market analysts are paying close attention to the supply pressure zone overhead.
If BTC can stabilize above $80,000 and then gradually break through the upper supply zone, then this rebound would have a chance to extend further into higher price areas.
However, if after breaking through it falls back below $80,000 again:
Then you need to be careful about a false breakout.
In that case, I would actually focus more on whether the prior support zone below can hold.
So my thinking is very simple right now:
Hold above $80,000 → see whether the overhead resistance can continue to be broken.
Break the supply zone → watch for further trend extension.
Fall back below $80,000 again → prevent getting pulled back into another range-bound retracement.
This market move is no longer just about whether it’s “going up” or not—it’s about:
After the breakout, whether the market can truly turn key resistance into support.
So I’ll say it again:
I still lean bullish on direction, but don’t chase positions recklessly.
#比特币突破8万美元大关 #比特币市值超越特斯拉
442
·
--
$NEAR Breaks $3.45, up more than 26% in a single day—how far can this move go?
NEAR is truly strong this time.
The key zone that had been suppressing the price was finally broken. After that, the price quickly surged in a short time, and we’ve now entered a spot where it’s very easy for divergence to appear.
This rally isn’t driven by sentiment alone.
On the one hand, NEAR’s @3.33 incentive mechanism and recent progress with Confidential Intents have given the market a new narrative;
On the other hand, after the technical breakout of key resistance, capital has clearly started chasing this trend. Recently, NEAR’s open interest has also risen to around its year-to-date high.
So now, instead of guessing:
“Can NEAR keep surging wildly?”
I care more about whether it can hold up after the breakout.
In current market analysis, one fairly important change is:
The prior pressure zone has shifted from “resistance above” to a “support area to watch” going forward.
If, after breaking out, the pullback can hold and the market then re-accumulates volume to move upward again, there’s still room for this trend to expand further.
But if it spikes high and then quickly falls back below the breakout zone, be careful:
False breakout + profit-taking + leveraged longs getting concentrated liquidations.
Earlier, some analysts also warned that if NEAR’s rally loses key support, liquidation could amplify the risk of a deeper pullback.
So my approach is very simple:
Breakout → see if it can stand firm.
Stand firm → keep watching for trend extension.
Fall back into the breakout zone → wait for re-confirmation; don’t chase.
NEAR has already climbed very fast.
Strong trends can be followed, but in exactly these kinds of blow-off-style rallies, you can’t succumb to FOMO.
$NEAR
{future}(NEARUSDT)
#NEAR涨超26%突破3.45美元
$NEAR Breaks $3.45, up more than 26% in a single day—how far can this move go?
NEAR is truly strong this time.
The key zone that had been suppressing the price was finally broken. After that, the price quickly surged in a short time, and we’ve now entered a spot where it’s very easy for divergence to appear.
This rally isn’t driven by sentiment alone.
On the one hand, NEAR’s @3.33 incentive mechanism and recent progress with Confidential Intents have given the market a new narrative;
On the other hand, after the technical breakout of key resistance, capital has clearly started chasing this trend. Recently, NEAR’s open interest has also risen to around its year-to-date high.
So now, instead of guessing:
“Can NEAR keep surging wildly?”
I care more about whether it can hold up after the breakout.
In current market analysis, one fairly important change is:
The prior pressure zone has shifted from “resistance above” to a “support area to watch” going forward.
If, after breaking out, the pullback can hold and the market then re-accumulates volume to move upward again, there’s still room for this trend to expand further.
But if it spikes high and then quickly falls back below the breakout zone, be careful:
False breakout + profit-taking + leveraged longs getting concentrated liquidations.
Earlier, some analysts also warned that if NEAR’s rally loses key support, liquidation could amplify the risk of a deeper pullback.
So my approach is very simple:
Breakout → see if it can stand firm.
Stand firm → keep watching for trend extension.
Fall back into the breakout zone → wait for re-confirmation; don’t chase.
NEAR has already climbed very fast.
Strong trends can be followed, but in exactly these kinds of blow-off-style rallies, you can’t succumb to FOMO.
$NEAR
#NEAR涨超26%突破3.45美元
NEAR is truly strong this time.
The key zone that had been suppressing the price was finally broken. After that, the price quickly surged in a short time, and we’ve now entered a spot where it’s very easy for divergence to appear.
This rally isn’t driven by sentiment alone.
On the one hand, NEAR’s @3.33 incentive mechanism and recent progress with Confidential Intents have given the market a new narrative;
On the other hand, after the technical breakout of key resistance, capital has clearly started chasing this trend. Recently, NEAR’s open interest has also risen to around its year-to-date high.
So now, instead of guessing:
“Can NEAR keep surging wildly?”
I care more about whether it can hold up after the breakout.
In current market analysis, one fairly important change is:
The prior pressure zone has shifted from “resistance above” to a “support area to watch” going forward.
If, after breaking out, the pullback can hold and the market then re-accumulates volume to move upward again, there’s still room for this trend to expand further.
But if it spikes high and then quickly falls back below the breakout zone, be careful:
False breakout + profit-taking + leveraged longs getting concentrated liquidations.
Earlier, some analysts also warned that if NEAR’s rally loses key support, liquidation could amplify the risk of a deeper pullback.
So my approach is very simple:
Breakout → see if it can stand firm.
Stand firm → keep watching for trend extension.
Fall back into the breakout zone → wait for re-confirmation; don’t chase.
NEAR has already climbed very fast.
Strong trends can be followed, but in exactly these kinds of blow-off-style rallies, you can’t succumb to FOMO.
$NEAR
#NEAR涨超26%突破3.45美元

351
·
--
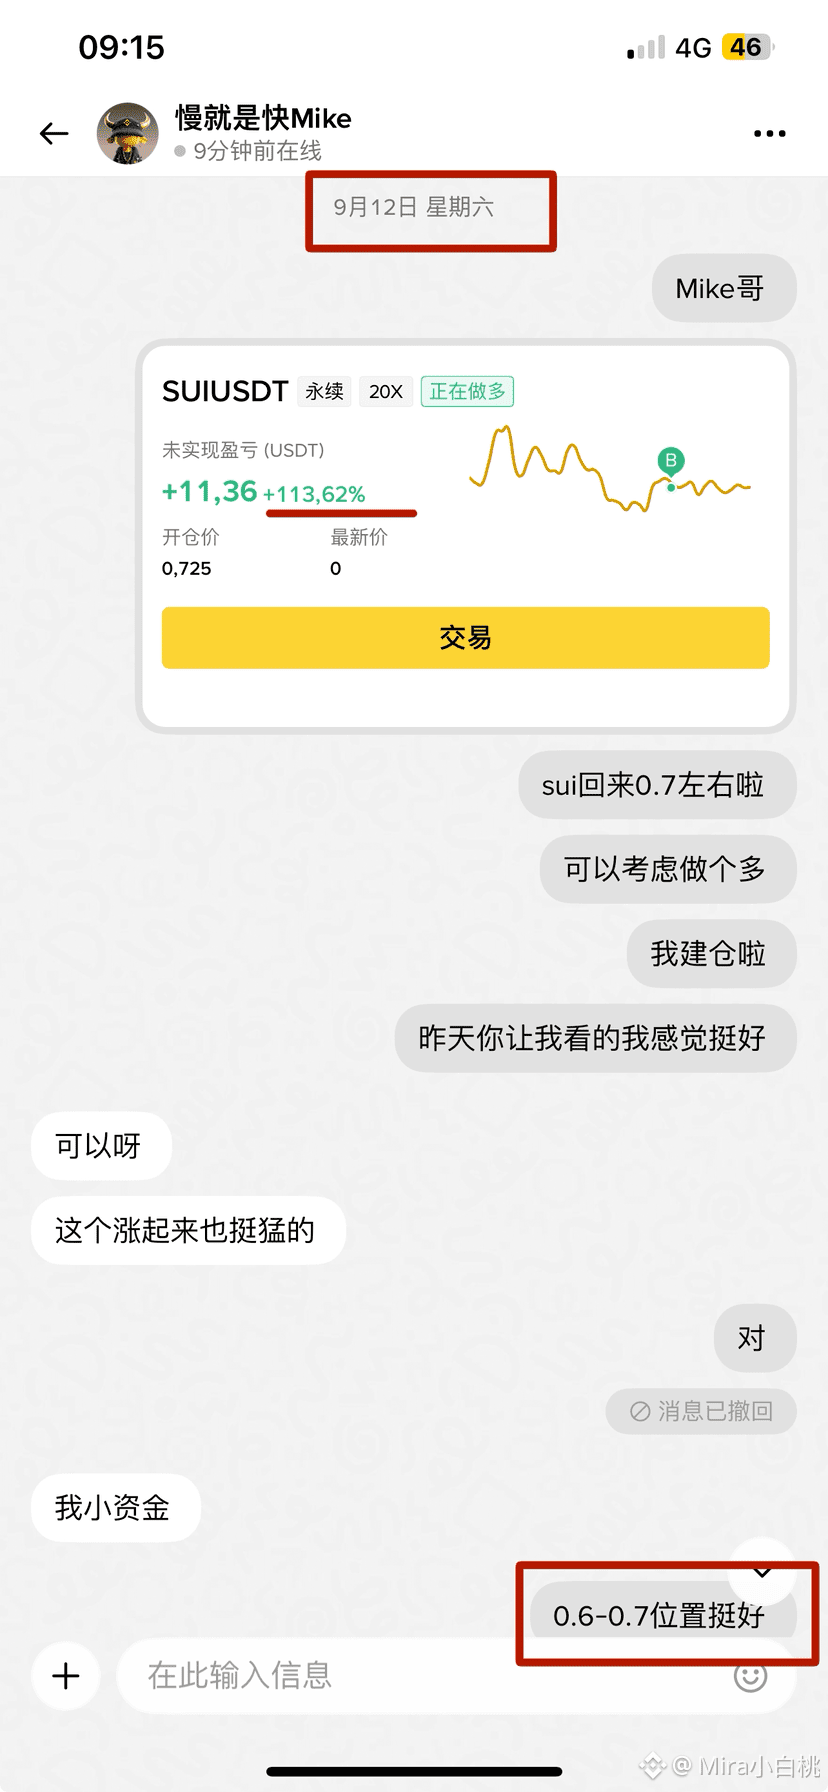
$SUI Above small targets of 0.8, worth holding
Keep paying more attention to the market that @Square-Creator-0da66bfb00d9 ’s big brother has been providing—it's always been very strong
$SUI keeps taking off 🛫
{future}(SUIUSDT)
$SUI Above small targets of 0.8, worth holding
Keep paying more attention to the market that @慢就是快Mike ’s big brother has been providing—it's always been very strong
$SUI keeps taking off 🛫
Keep paying more attention to the market that @慢就是快Mike ’s big brother has been providing—it's always been very strong
$SUI keeps taking off 🛫
3
643
·
--
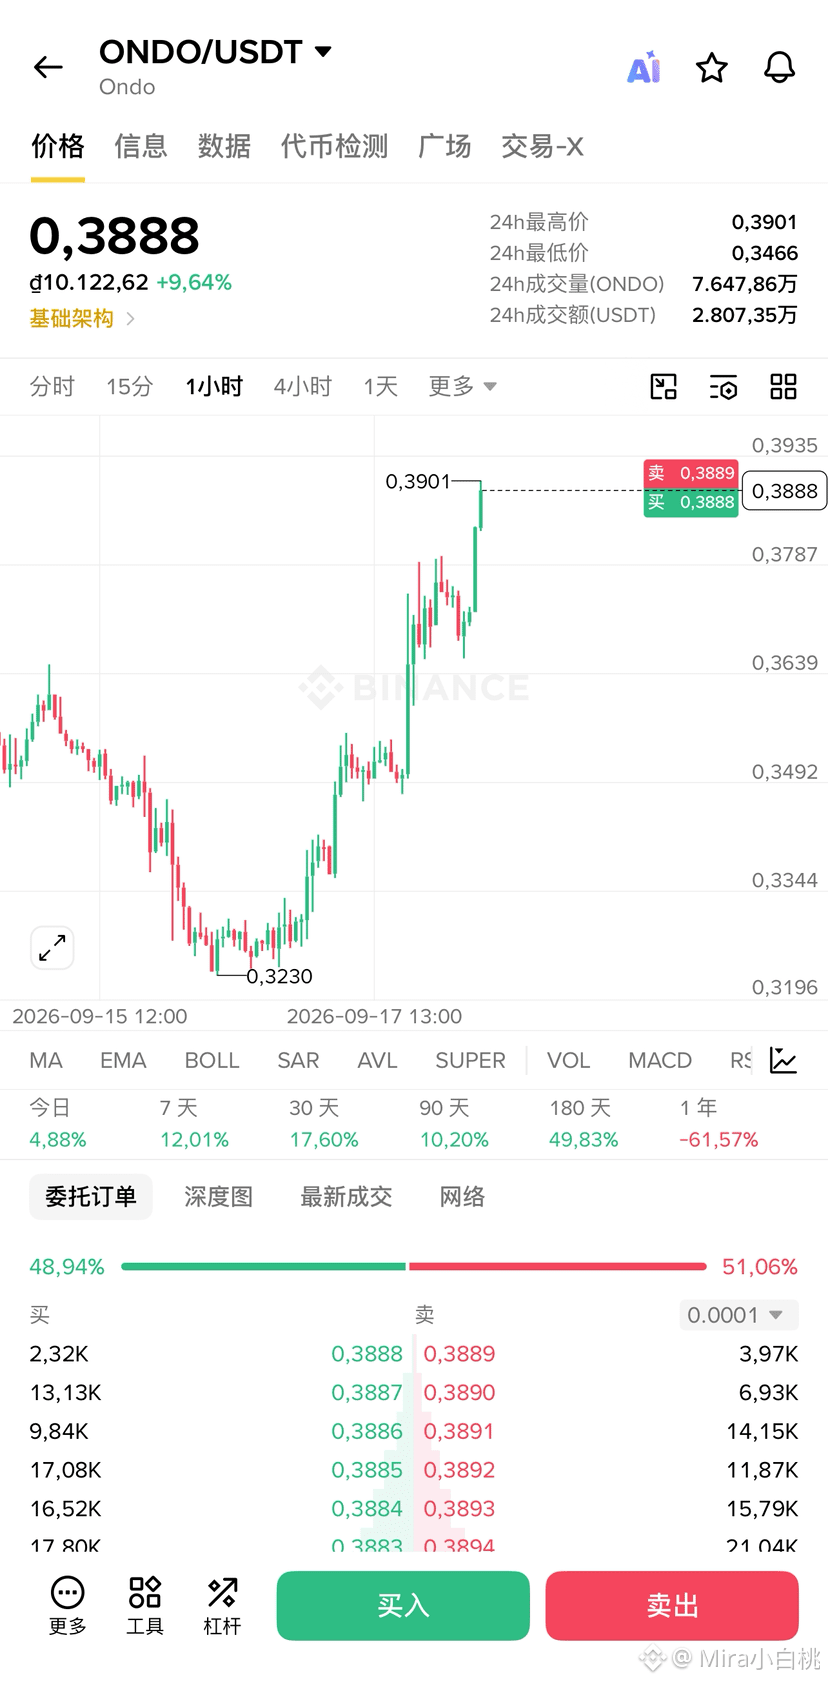
Thanks, boss, for the wealth code. I’m holding $ONDO with @Square-Creator-a7b6c2b8fe744
That day you said ONDO could be worth keeping an eye on. I thought, I’ll just buy a little first—turns out today it just took off directly
I originally only wanted to get a little taste, but I didn’t expect this wave to serve me a full-course meal
ONDO this time—yeah, it’s really smooth~
{future}(ONDOUSDT)
Thanks, boss, for the wealth code. I’m holding $ONDO with @稳健选手
That day you said ONDO could be worth keeping an eye on. I thought, I’ll just buy a little first—turns out today it just took off directly
I originally only wanted to get a little taste, but I didn’t expect this wave to serve me a full-course meal
ONDO this time—yeah, it’s really smooth~
That day you said ONDO could be worth keeping an eye on. I thought, I’ll just buy a little first—turns out today it just took off directly
I originally only wanted to get a little taste, but I didn’t expect this wave to serve me a full-course meal
ONDO this time—yeah, it’s really smooth~
3
2
477
·
--
🔥$ZEC has rushed to 1500—can it still move higher from here?
This round of ZEC’s strength has indeed gone beyond many people’s expectations.
From breaking through a key resistance level and continuously setting new highs, it has now entered a very critical position:
The uptrend hasn’t shown obvious signs of being broken, but the short-term market has already entered a high-level standoff.
Currently, the market has a few viewpoints that are quite interesting.
Some traders believe that ZEC now looks more like high-level consolidation within a strong trend. As long as the core breakout zone can be defended, there’s still a possibility for further upward expansion.
But some analysts are starting to warn:
Rising too fast is itself a risk.
Derivatives positioning continues to increase, and technical indicators have also moved into a clearly overheated area.
So going forward, I won’t simply chase the number “1500.”
I’m watching three areas instead:
First, the breakout zone overhead.
If ZEC can continue to break the prior high with expanding volume, and after breaking out it can turn this zone into a new support level, then the strong uptrend still has room to continue.
For the next phase above, keep an eye on higher integer psychological levels.
Second, the pressure around 1500.
This is a very important psychological level.
If it spikes up and then quickly falls back, it suggests that profit-taking from higher levels has started to cash in.
In that case, the short term is more likely to enter consolidation rather than immediately pushing higher.
Third, the core support zone below.
Right now, market analysis is focused on the earlier breakout zone.
As long as this zone holds, ZEC is still in a strong structure.
But if it breaks down and the subsequent retest can’t reclaim it, then be careful—this rally may be entering a deeper correction. Earlier analysis also pointed to the next lower layer of support as an observation area if the trend starts to weaken.
So my conclusion is simple:
ZEC still has upside potential, but the risk of chasing after a spike is getting higher.
Strong breakout and holding firm → continue to look for trend extension.
Push high and then pull back at high levels → wait for the dip to confirm.
If core support is lost → guard against the uptrend structure weakening.
When the market is strong, you can’t rely on emotion to chase.
I’d rather wait for a comfortable entry point than FOMO just because I see 1500.{future}(ZECUSDT)
🔥$ZEC has rushed to 1500—can it still move higher from here?
This round of ZEC’s strength has indeed gone beyond many people’s expectations.
From breaking through a key resistance level and continuously setting new highs, it has now entered a very critical position:
The uptrend hasn’t shown obvious signs of being broken, but the short-term market has already entered a high-level standoff.
Currently, the market has a few viewpoints that are quite interesting.
Some traders believe that ZEC now looks more like high-level consolidation within a strong trend. As long as the core breakout zone can be defended, there’s still a possibility for further upward expansion.
But some analysts are starting to warn:
Rising too fast is itself a risk.
Derivatives positioning continues to increase, and technical indicators have also moved into a clearly overheated area.
So going forward, I won’t simply chase the number “1500.”
I’m watching three areas instead:
First, the breakout zone overhead.
If ZEC can continue to break the prior high with expanding volume, and after breaking out it can turn this zone into a new support level, then the strong uptrend still has room to continue.
For the next phase above, keep an eye on higher integer psychological levels.
Second, the pressure around 1500.
This is a very important psychological level.
If it spikes up and then quickly falls back, it suggests that profit-taking from higher levels has started to cash in.
In that case, the short term is more likely to enter consolidation rather than immediately pushing higher.
Third, the core support zone below.
Right now, market analysis is focused on the earlier breakout zone.
As long as this zone holds, ZEC is still in a strong structure.
But if it breaks down and the subsequent retest can’t reclaim it, then be careful—this rally may be entering a deeper correction. Earlier analysis also pointed to the next lower layer of support as an observation area if the trend starts to weaken.
So my conclusion is simple:
ZEC still has upside potential, but the risk of chasing after a spike is getting higher.
Strong breakout and holding firm → continue to look for trend extension.
Push high and then pull back at high levels → wait for the dip to confirm.
If core support is lost → guard against the uptrend structure weakening.
When the market is strong, you can’t rely on emotion to chase.
I’d rather wait for a comfortable entry point than FOMO just because I see 1500.
This round of ZEC’s strength has indeed gone beyond many people’s expectations.
From breaking through a key resistance level and continuously setting new highs, it has now entered a very critical position:
The uptrend hasn’t shown obvious signs of being broken, but the short-term market has already entered a high-level standoff.
Currently, the market has a few viewpoints that are quite interesting.
Some traders believe that ZEC now looks more like high-level consolidation within a strong trend. As long as the core breakout zone can be defended, there’s still a possibility for further upward expansion.
But some analysts are starting to warn:
Rising too fast is itself a risk.
Derivatives positioning continues to increase, and technical indicators have also moved into a clearly overheated area.
So going forward, I won’t simply chase the number “1500.”
I’m watching three areas instead:
First, the breakout zone overhead.
If ZEC can continue to break the prior high with expanding volume, and after breaking out it can turn this zone into a new support level, then the strong uptrend still has room to continue.
For the next phase above, keep an eye on higher integer psychological levels.
Second, the pressure around 1500.
This is a very important psychological level.
If it spikes up and then quickly falls back, it suggests that profit-taking from higher levels has started to cash in.
In that case, the short term is more likely to enter consolidation rather than immediately pushing higher.
Third, the core support zone below.
Right now, market analysis is focused on the earlier breakout zone.
As long as this zone holds, ZEC is still in a strong structure.
But if it breaks down and the subsequent retest can’t reclaim it, then be careful—this rally may be entering a deeper correction. Earlier analysis also pointed to the next lower layer of support as an observation area if the trend starts to weaken.
So my conclusion is simple:
ZEC still has upside potential, but the risk of chasing after a spike is getting higher.
Strong breakout and holding firm → continue to look for trend extension.
Push high and then pull back at high levels → wait for the dip to confirm.
If core support is lost → guard against the uptrend structure weakening.
When the market is strong, you can’t rely on emotion to chase.
I’d rather wait for a comfortable entry point than FOMO just because I see 1500.

990
14
54
1.3k
Log in to explore more content
Join global crypto users on Binance Square
⚡️ Get latest and useful information about crypto.
💬 Trusted by the world’s largest crypto exchange.
👍 Discover real insights from verified creators.
Email / Phone number
Trending Topics
AIStocksWhatNext
288,007 views
2,685 Discussing
Share & Win Traffic Reward in our Trending Hashtag Campaign
✨Topic: What Other Investment Opportunities Remain as AI Stocks Keep Rising?
👉How to Join:
Publish a short post or article with hashtag #AIStocksWhatNext
Share whether you’re bullish or bearish, and post your AI stock holdings or trade — using the trade widget may improve your eligibility.
You can also strengthen your post by sharing data or charts, and avoiding AI-generated images.
✍️Create content based on the below angles:
- Nvidia says chip sales will double next year, and top AI companies keep hitting record revenue, the compute spend behind it is just as staggering. Is AI demand really taking off? And how long can it last? AI stocks are up across the board. Is this a real breakout, or just a short-term bounce?
- Industry leaders are calling to slow down AI development, while Trump plans to build an “AI Force”, claiming AI could account for 25% of U.S. GDP in the future. Whose side are you on? Will state-level backing be a long-term win for AI stocks?
- Are you buying AI stocks? Share your AI-related trade/holdings with our trade sharing widget.
⏰Campaign Period:
- 2026-09-22 7:00 - 2026-09-24 4:00 UTC
🎁Reward:
- Qualified posts that comply with the above guidelines and contain more than 100 words will be reviewed and may receive a random traffic boost of 500 to 3,000 views. You will receive a notification from your feed secretary if your post is selected.
- Get a chance to have your article featured on Binance Square Official
Need ideas for your post? Visit the topic page #AIStocksWhatNext or the Square Guide on How to Post for Better Reach.
Binance Square Official
·336 Likes
·771k views
BitcoinBreaksAboveMayHighNears$86K
10,570 views
161 Discussing
DogecoinRises15%
30,420 views
862 Discussing