

#ethergains70
ethergains70
1,974 views
92 Discussing
Hot
Latest

🚀 Ethereum's explosive 70.9% surge in Q3 is proof that the crypto market is far from over! With #ETH leading the charge, investors must ask: Are we witnessing the dawn of a new bull run? What are your thoughts on the future of $ETH and its potential? #EtherGains70.9%InQ3
📈 Follow for more real-time market breakdowns!
🚀 Ethereum's explosive 70.9% surge in Q3 is proof that the crypto market is far from over! With #ETH leading the charge, investors must ask: Are we witnessing the dawn of a new bull run? What are your thoughts on the future of $ETH and its potential? #EtherGains70.9%InQ3
📈 Follow for more real-time market breakdowns!
📈 Follow for more real-time market breakdowns!
62

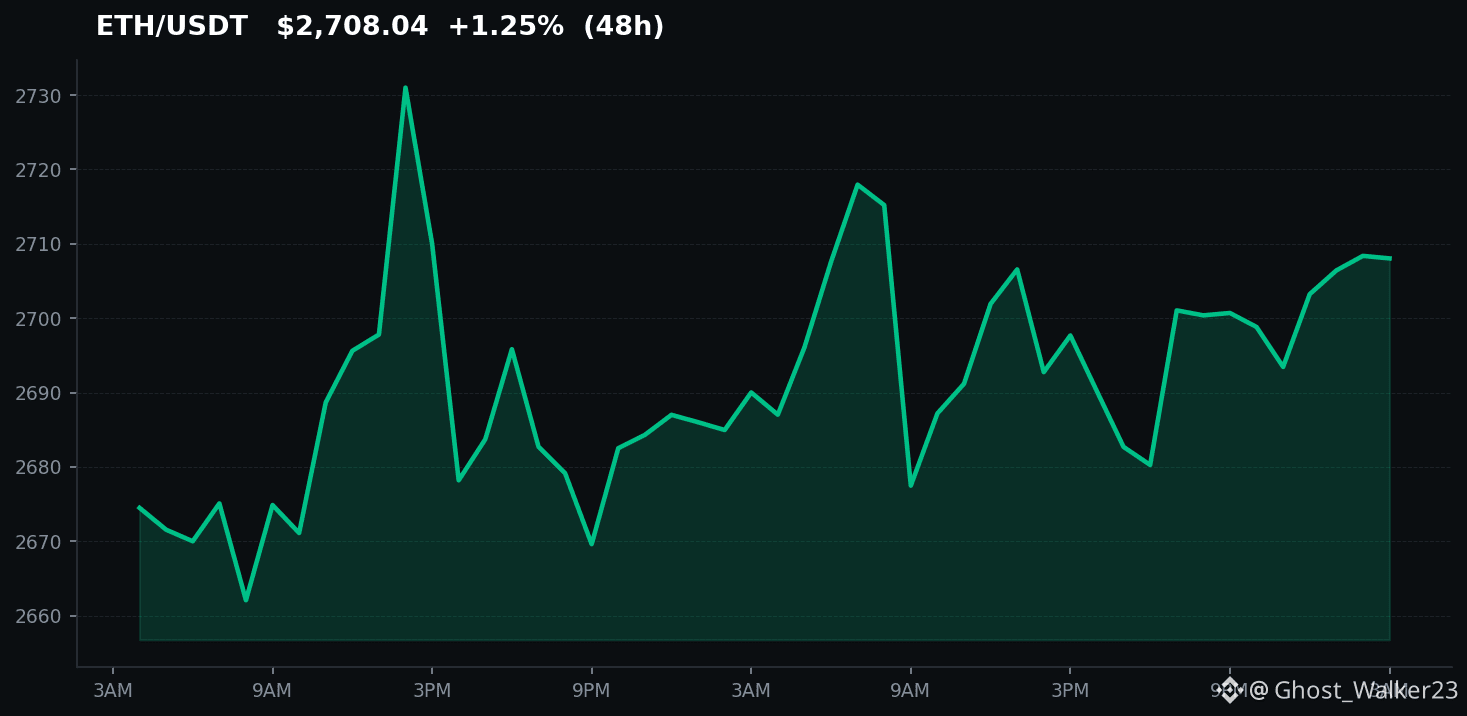
Here's what happened when Ethereum quietly put together a 70 percent gain while most people were still debating whether any L1 besides Bitcoin even mattered.
The pain is familiar. You either sold too soon, missed the entry after months of sideways action, or now feel that itch to chase because sitting out a $ETH move like this stings more than a small loss.
This one reads like a case study in patience versus panic. The 70 percent stretch did not come from a single catalyst. Staking locked supply, L2 activity picked up, and some of the same institutions that piled into Bitcoin ETFs started treating Ethereum as the next liquid bet.
It looks closer to the 2020 grind than the 2021 mania, when everything went vertical at once. Compare that to $NEAR, which printed bigger daily candles but failed to hold the same kind of follow-through. Ethereum's move had more of a slow accumulation feel, which is why so many traders stayed on the sidelines until it was already up.
What we can take from similar past events is the checkpoint nature of a 70 percent run. In 2017 and again in 2020, these percentages often marked a pause rather than the end. With the Fear and Greed Index sitting at 69, greed is already in the room. $AAVE volumes and DeFi activity usually trail these ETH legs, so the next few weeks will tell us if this is rotation or just another relief bounce that fades when yields stay elevated.
Where do you think $ETH goes from here after stretching 70 percent like this?
#EtherGains70 #BitcoinETFsTake #US10YearYieldNears5
Here's what happened when Ethereum quietly put together a 70 percent gain while most people were still debating whether any L1 besides Bitcoin even mattered.
The pain is familiar. You either sold too soon, missed the entry after months of sideways action, or now feel that itch to chase because sitting out a $ETH move like this stings more than a small loss.
This one reads like a case study in patience versus panic. The 70 percent stretch did not come from a single catalyst. Staking locked supply, L2 activity picked up, and some of the same institutions that piled into Bitcoin ETFs started treating Ethereum as the next liquid bet.
It looks closer to the 2020 grind than the 2021 mania, when everything went vertical at once. Compare that to $NEAR , which printed bigger daily candles but failed to hold the same kind of follow-through. Ethereum's move had more of a slow accumulation feel, which is why so many traders stayed on the sidelines until it was already up.
What we can take from similar past events is the checkpoint nature of a 70 percent run. In 2017 and again in 2020, these percentages often marked a pause rather than the end. With the Fear and Greed Index sitting at 69, greed is already in the room. $AAVE volumes and DeFi activity usually trail these ETH legs, so the next few weeks will tell us if this is rotation or just another relief bounce that fades when yields stay elevated.
Where do you think $ETH goes from here after stretching 70 percent like this?
#EtherGains70 #BitcoinETFsTake #US10YearYieldNears5
The pain is familiar. You either sold too soon, missed the entry after months of sideways action, or now feel that itch to chase because sitting out a $ETH move like this stings more than a small loss.
This one reads like a case study in patience versus panic. The 70 percent stretch did not come from a single catalyst. Staking locked supply, L2 activity picked up, and some of the same institutions that piled into Bitcoin ETFs started treating Ethereum as the next liquid bet.
It looks closer to the 2020 grind than the 2021 mania, when everything went vertical at once. Compare that to $NEAR , which printed bigger daily candles but failed to hold the same kind of follow-through. Ethereum's move had more of a slow accumulation feel, which is why so many traders stayed on the sidelines until it was already up.
What we can take from similar past events is the checkpoint nature of a 70 percent run. In 2017 and again in 2020, these percentages often marked a pause rather than the end. With the Fear and Greed Index sitting at 69, greed is already in the room. $AAVE volumes and DeFi activity usually trail these ETH legs, so the next few weeks will tell us if this is rotation or just another relief bounce that fades when yields stay elevated.
Where do you think $ETH goes from here after stretching 70 percent like this?
#EtherGains70 #BitcoinETFsTake #US10YearYieldNears5
10

·
--
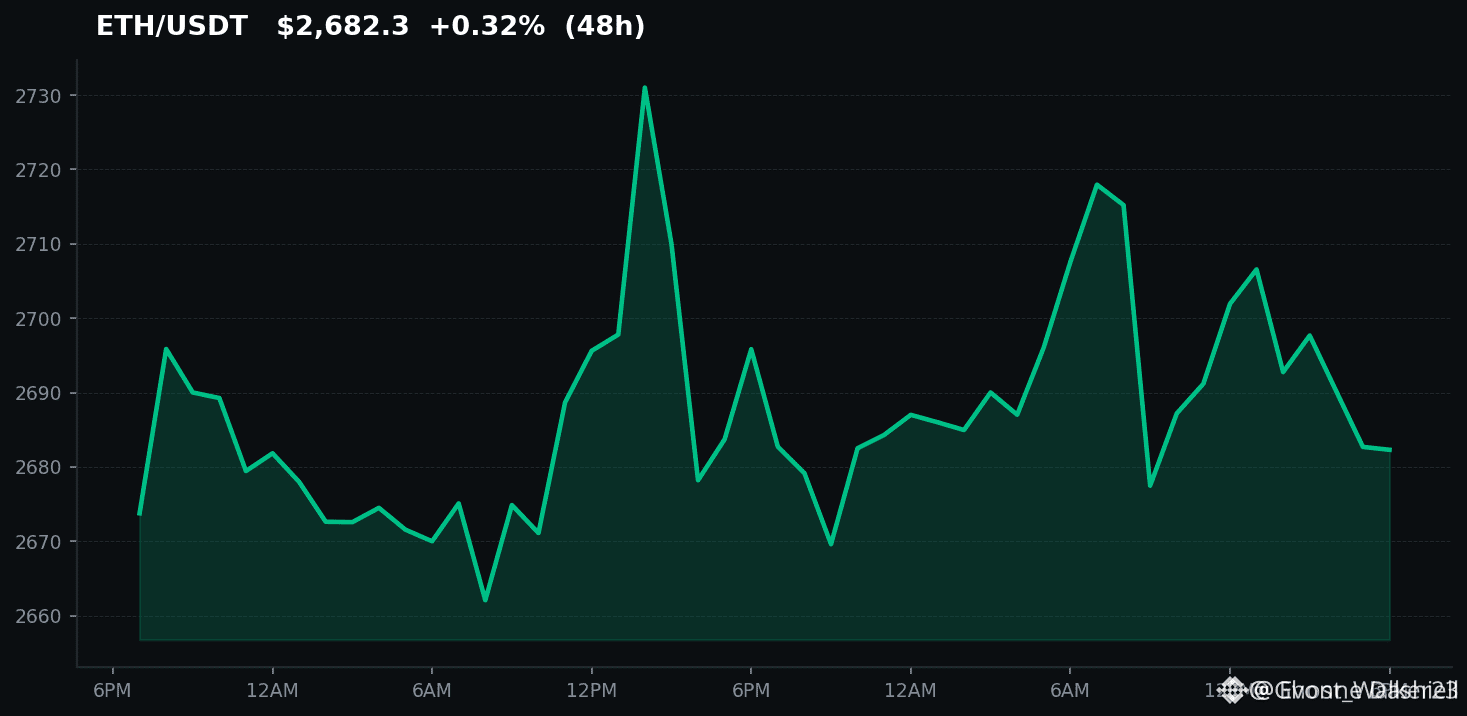
Have you noticed nobody is asking whether ETH's 70 percent run is actually sustainable, or just another relief rally dressed up as a comeback?
Traders keep getting chopped up on these moves. They buy the breakout, then freeze when it stalls because they never defined an exit.
Treat this as a case study. $ETH ripping 70 percent from the lows looks explosive until you remember how these setups played out in 2022 and 2023. The move is real. The interpretation is lazy.
$AAVE and the rest of DeFi are catching a bid because they always do when ETH volatility spikes, not because fundamentals suddenly flipped. Fear and Greed sitting at 69 tells you retail is already leaning in. That is usually when the people who bought $USDT on the way down start distributing into strength.
The mainstream story is that this is the beginning of a new ETH cycle. I see a crowded trade. The dollar and yields are not the backdrop you want for a clean continuation. A 70 percent gain does not erase a multi-year range. It just creates a better place for larger players to sell.
Where do you think this $ETH move actually tops from here?
#EtherGains70 #US10YearYieldNears5 #DollarIndexHitsHighestSinceMay2025
Have you noticed nobody is asking whether ETH's 70 percent run is actually sustainable, or just another relief rally dressed up as a comeback?
Traders keep getting chopped up on these moves. They buy the breakout, then freeze when it stalls because they never defined an exit.
Treat this as a case study. $ETH ripping 70 percent from the lows looks explosive until you remember how these setups played out in 2022 and 2023. The move is real. The interpretation is lazy.
$AAVE and the rest of DeFi are catching a bid because they always do when ETH volatility spikes, not because fundamentals suddenly flipped. Fear and Greed sitting at 69 tells you retail is already leaning in. That is usually when the people who bought $USDT on the way down start distributing into strength.
The mainstream story is that this is the beginning of a new ETH cycle. I see a crowded trade. The dollar and yields are not the backdrop you want for a clean continuation. A 70 percent gain does not erase a multi-year range. It just creates a better place for larger players to sell.
Where do you think this $ETH move actually tops from here?
#EtherGains70 #US10YearYieldNears5 #DollarIndexHitsHighestSinceMay2025
Traders keep getting chopped up on these moves. They buy the breakout, then freeze when it stalls because they never defined an exit.
Treat this as a case study. $ETH ripping 70 percent from the lows looks explosive until you remember how these setups played out in 2022 and 2023. The move is real. The interpretation is lazy.
$AAVE and the rest of DeFi are catching a bid because they always do when ETH volatility spikes, not because fundamentals suddenly flipped. Fear and Greed sitting at 69 tells you retail is already leaning in. That is usually when the people who bought $USDT on the way down start distributing into strength.
The mainstream story is that this is the beginning of a new ETH cycle. I see a crowded trade. The dollar and yields are not the backdrop you want for a clean continuation. A 70 percent gain does not erase a multi-year range. It just creates a better place for larger players to sell.
Where do you think this $ETH move actually tops from here?
#EtherGains70 #US10YearYieldNears5 #DollarIndexHitsHighestSinceMay2025
13
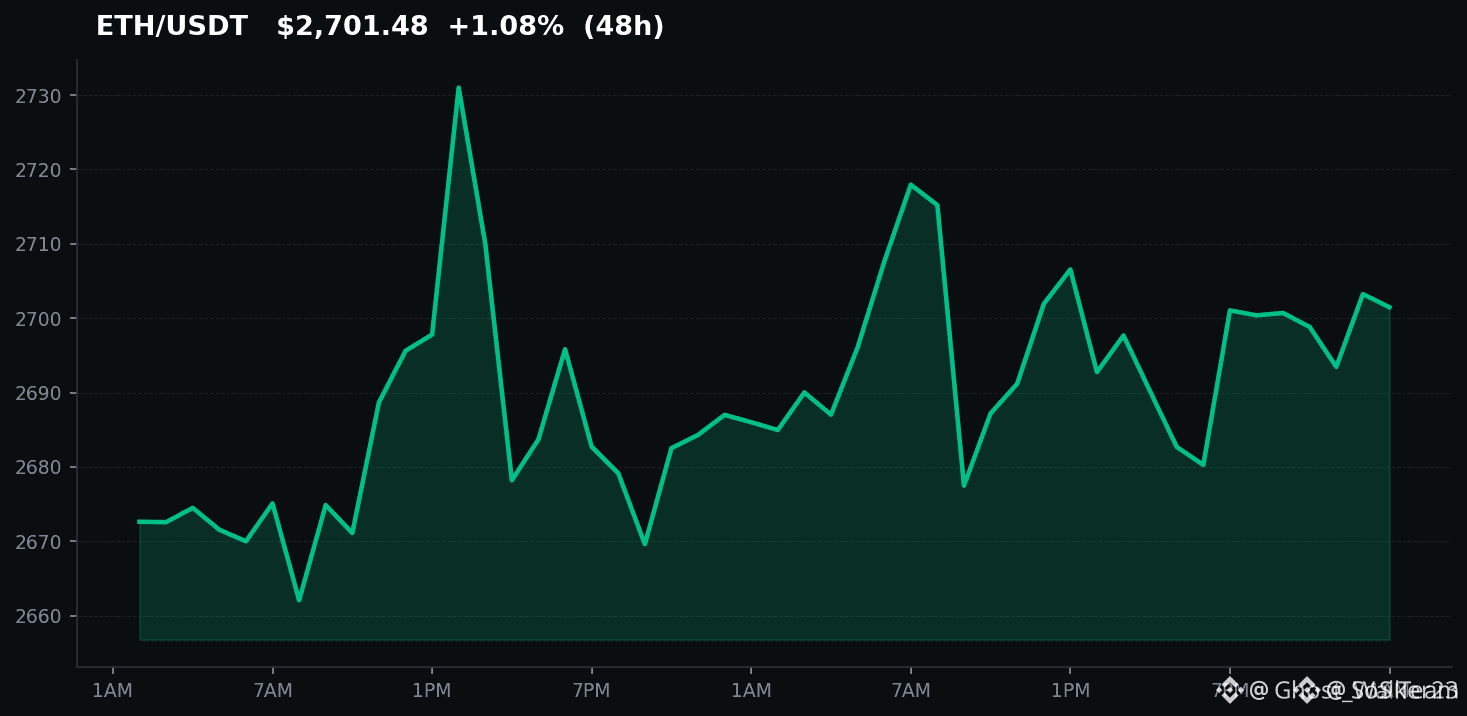
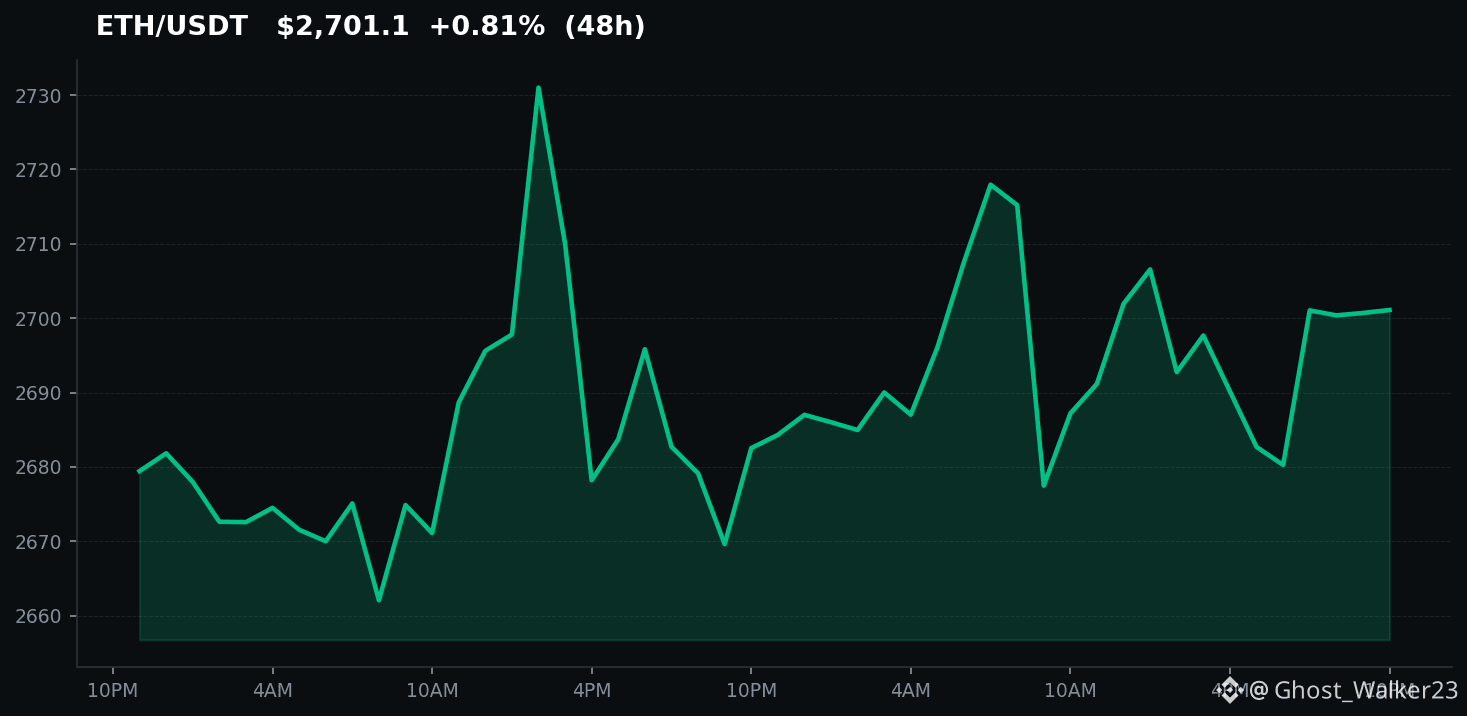
🚀 As we dive into #EtherGains70.9%InQ3, let's compare $ETH and $SOL. ETH's been on a steady rise, now at $2,701.83 (+0.56%), while SOL sits at $118.22 (+0.06%). 🚀
With ETH gaining 70.9% this quarter, is it poised for more growth than SOL? 🧐 Check the chart below and let me know your thoughts! 📊
🚀 Like + Follow si quieres más contenido como este!
🚀 As we dive into #EtherGains70.9%InQ3, let's compare $ETH and $SOL . ETH's been on a steady rise, now at $2,701.83 (+0.56%), while SOL sits at $118.22 (+0.06%). 🚀
With ETH gaining 70.9% this quarter, is it poised for more growth than SOL? 🧐 Check the chart below and let me know your thoughts! 📊
🚀 Like + Follow si quieres más contenido como este!
With ETH gaining 70.9% this quarter, is it poised for more growth than SOL? 🧐 Check the chart below and let me know your thoughts! 📊
🚀 Like + Follow si quieres más contenido como este!
3
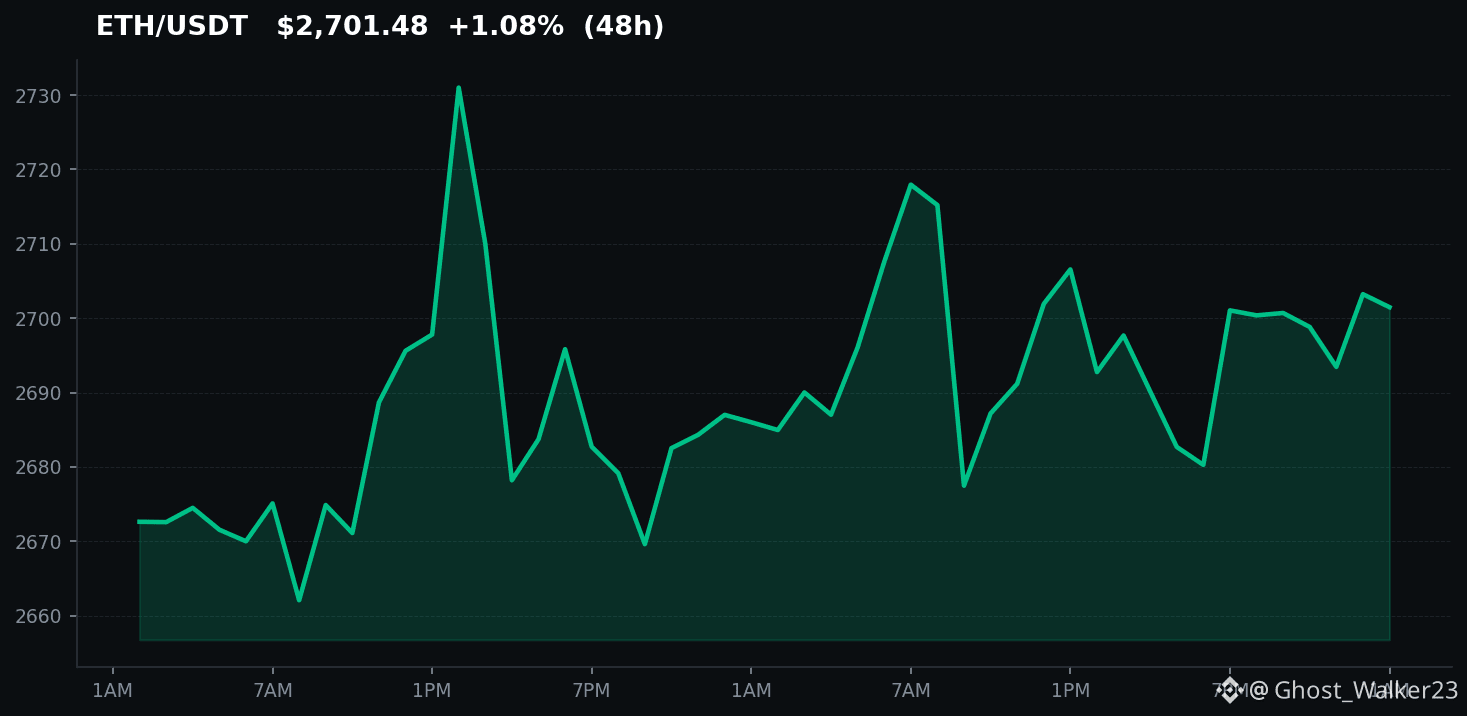
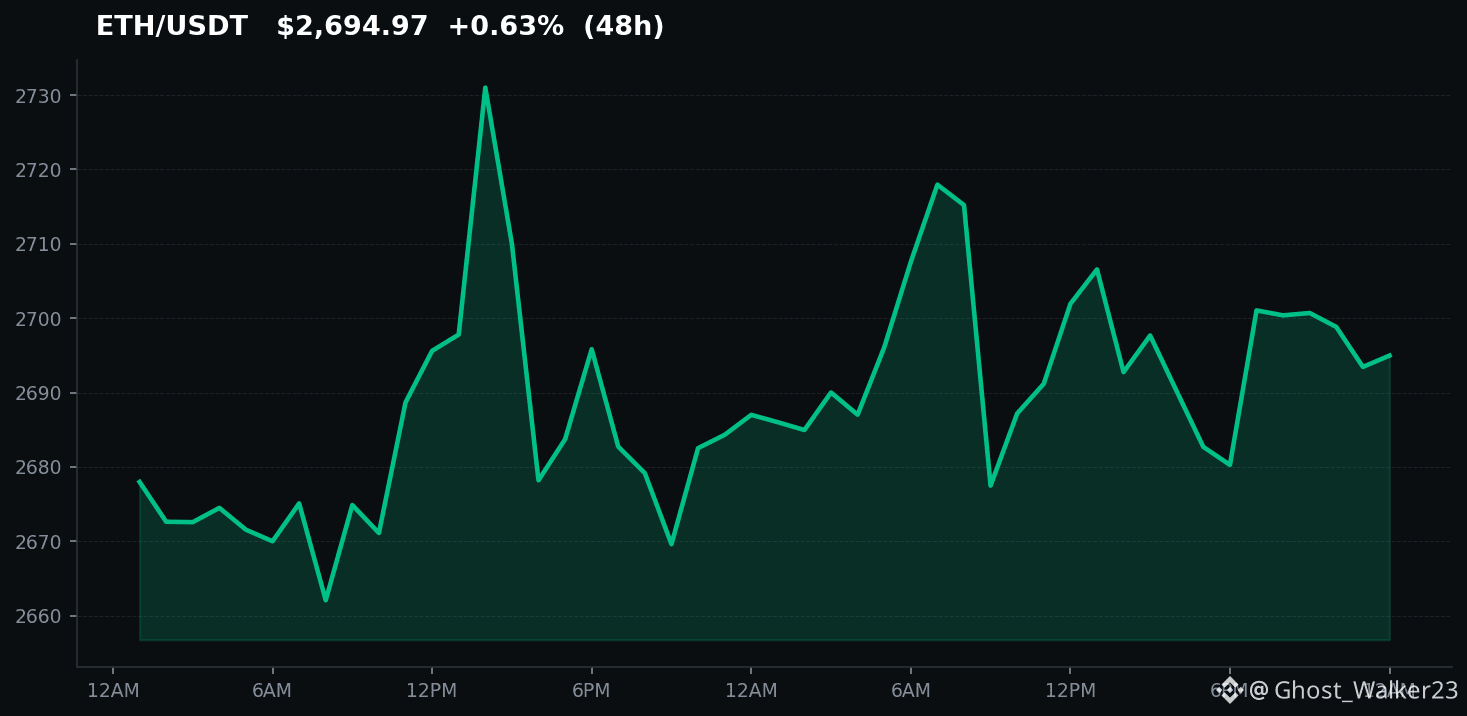
🚀 As we dive into Q3, $ETH has shown remarkable resilience, gaining 70.9%! This surge is backed by increased institutional interest and developments in the Ethereum network. As you can see below, this trend isn't just a blip—it's part of a larger shift in the market. 🌟
Will $ETH continue its ascent, or is a pullback imminent? Let’s discuss! #EtherGains70.9%InQ3
👀 Síguenos para estar pendiente de las próximas oportunidades.
🚀 As we dive into Q3, $ETH has shown remarkable resilience, gaining 70.9%! This surge is backed by increased institutional interest and developments in the Ethereum network. As you can see below, this trend isn't just a blip—it's part of a larger shift in the market. 🌟
Will $ETH continue its ascent, or is a pullback imminent? Let’s discuss! #EtherGains70.9%InQ3
👀 Síguenos para estar pendiente de las próximas oportunidades.
Will $ETH continue its ascent, or is a pullback imminent? Let’s discuss! #EtherGains70.9%InQ3
👀 Síguenos para estar pendiente de las próximas oportunidades.
9

·
--
Ether (ETH) has demonstrated remarkable performance, achieving a 70.9% gain in the third quarter. This significant upward movement indicates strong buying interest and positive market sentiment surrounding the second-largest cryptocurrency. Several factors likely contributed to this surge, including ongoing developments in the Ethereum network, anticipation of future upgrades, and broader market trends. Investors are now closely watching to see if this momentum can be sustained into the final quarter of the year, with many speculating on potential price targets and the impact of continued network evolution. The strong Q3 performance positions ETH for further potential upside, but the market remains dynamic and subject to various influencing factors.
Disclaimer: This content is for informational purposes only and does not constitute investment advice. Trading cryptocurrencies involves significant risk.
#EtherGains70.9%InQ3 $ETH
Ether (ETH) has demonstrated remarkable performance, achieving a 70.9% gain in the third quarter. This significant upward movement indicates strong buying interest and positive market sentiment surrounding the second-largest cryptocurrency. Several factors likely contributed to this surge, including ongoing developments in the Ethereum network, anticipation of future upgrades, and broader market trends. Investors are now closely watching to see if this momentum can be sustained into the final quarter of the year, with many speculating on potential price targets and the impact of continued network evolution. The strong Q3 performance positions ETH for further potential upside, but the market remains dynamic and subject to various influencing factors.
Disclaimer: This content is for informational purposes only and does not constitute investment advice. Trading cryptocurrencies involves significant risk.
#EtherGains70.9%InQ3 $ETH
Disclaimer: This content is for informational purposes only and does not constitute investment advice. Trading cryptocurrencies involves significant risk.
#EtherGains70.9%InQ3 $ETH

1
1
1
57

·
--
In recent times, Ethereum’s price performance has been strong, with an astonishing increase in the third quarter. According to CoinMarketCap data, in the third quarter of 2023, the price of Ethereum (ETH) rose from about $1,950 to about $3,300, achieving a gain of 70.9%. This remarkable growth is largely driven by the growing adoption of Ethereum Layer 2 solutions and the continued entry of institutional investors. Data shows that Ethereum’s trading volume in the third quarter increased year over year by 120%, reaching approximately $28 billion per day. In addition, the average network status fee (Gas fee) on the Ethereum network also rose by 50%, reflecting increased network activity. These figures indicate that Ethereum is not only performing exceptionally well in price, but its ecosystem is also continually expanding. Market analysis believes that, as the Ethereum 2.0 upgrade progresses and more compliant applications are launched, its long-term growth potential is huge. #EtherGains70.9%InQ3
$ETH #ETH
In recent times, Ethereum’s price performance has been strong, with an astonishing increase in the third quarter. According to CoinMarketCap data, in the third quarter of 2023, the price of Ethereum (ETH) rose from about $1,950 to about $3,300, achieving a gain of 70.9%. This remarkable growth is largely driven by the growing adoption of Ethereum Layer 2 solutions and the continued entry of institutional investors. Data shows that Ethereum’s trading volume in the third quarter increased year over year by 120%, reaching approximately $28 billion per day. In addition, the average network status fee (Gas fee) on the Ethereum network also rose by 50%, reflecting increased network activity. These figures indicate that Ethereum is not only performing exceptionally well in price, but its ecosystem is also continually expanding. Market analysis believes that, as the Ethereum 2.0 upgrade progresses and more compliant applications are launched, its long-term growth potential is huge. #EtherGains70.9%InQ3
$ETH #ETH
$ETH #ETH
154
🚀 Ethereum's remarkable 70.9% surge in Q3 signifies a strong market recovery! With #ETH leading the charge, it's clear that investor confidence is returning. Are we witnessing the dawn of a new bull market? 💰 What are your thoughts? #EtherGains70.9%InQ3
$ETH
💬 Join and follow us—we keep analyzing the market for you.
🚀 Ethereum's remarkable 70.9% surge in Q3 signifies a strong market recovery! With #ETH leading the charge, it's clear that investor confidence is returning. Are we witnessing the dawn of a new bull market? 💰 What are your thoughts? #EtherGains70.9%InQ3
$ETH
💬 Join and follow us—we keep analyzing the market for you.
$ETH
💬 Join and follow us—we keep analyzing the market for you.
10

·
--
ETH Q3 gain is about 70.9% and tops the hot list|A new quarter doesn’t equal automatic continued gains|Around $2,685 I’ll wait for incremental buy-side orders
My attitude is to respect the existing gains, but not to use a quarterly report as today’s buy order. Binance Square’s current trending topics show #EtherGains70.9%InQ3. I independently compute using publicly available Binance ETH/USDT monthly chart data: the July open is about $1,572, and the September close is about $2,686.01. Calculated using the same trading pair and the same quarter start/end, the gain is about 70.9%. This verifies the magnitude of the hot headline, but it’s only historical spot returns on Binance denominated in USDT; if you switch to other exchanges, a USD-based benchmark, or different start/end timestamps, the numbers may differ slightly—and you definitely can’t write it as realized gains already achieved in Q4.
Why is this topic worth watching? Quarterly gains affect the cost distribution of existing holders and the decisions they make for rebalancing: funds sitting on thicker unrealized profits may lock in gains in the new quarter, while trend-following funds may also keep adding. Both forces can exist at the same time. The historical quarterly gain itself is not new capital inflow. I’ve discussed the last round of ETH fund subscriptions/redemptions, the Glamdsterdam testnet preparation, and US employment data before; this time I’ll only focus on the difference between the “hot list return rate” and current tradable conditions, not treating the testnet schedule as a mainnet upgrade that’s already live, and not turning a single hot-list headline into ETF net subscriptions.
The immediate market reaction is nowhere near as exaggerated as the headline. When sampling Binance ETH/USDT around $2,685, the last 24-hour high is $2,722 and the low is $2,667.94—about a 0.17% move. In other words, the big quarterly rally has already been written into the prices from the past three months, while today we’re still roughly tugging around the $2,700 area. What I want to observe is whether $2,722 can become a new support, not chasing the 70.9% “rear-view mirror” number. If it falls below $2,668 and can’t rebound, the intraday range weakens and the view of “upward momentum following the new quarter” should be withdrawn. Only if it holds above $2,722 and the spot liquidity and fund net flows subsequently cooperate do we have stronger evidence of continuation.
If it were my own trade, I wouldn’t participate right now; I’d keep an empty position. If the hourly close breaks above $2,722, and the pullback still holds and is not a single-candle spike, then I’d use no more than 5% of total capital to probe a spot long. The entry trigger is the confirmed pullback; the first target is $2,780. Once reached, I’d cut half, and keep the remainder to watch around $2,820, but I wouldn’t assume it must get there. The stop-loss is placed at the point where the pullback structure fails; if the hourly close falls back below $2,700, I’ll execute the stop-loss and close the position rather than turning it into a long-term bag-holding situation. If price first loses $2,668, I won’t guess the bottom—I’ll wait for it to stand back up or for a new range to form. Each trade’s maximum preset risk is no more than 0.5%, and I don’t use high leverage. If the conditions aren’t met, there’s no trade and no profit worth reviewing.
Quarterly statistics are facts; the next step is to test the hypothesis with price action, and position size is only handed to the trigger conditions. #EtherGains70.9%InQ3 #ETH
The above is only my personal market observation and does not constitute investment advice.
ETH Q3 gain is about 70.9% and tops the hot list|A new quarter doesn’t equal automatic continued gains|Around $2,685 I’ll wait for incremental buy-side orders
My attitude is to respect the existing gains, but not to use a quarterly report as today’s buy order. Binance Square’s current trending topics show #EtherGains70.9%InQ3. I independently compute using publicly available Binance ETH/USDT monthly chart data: the July open is about $1,572, and the September close is about $2,686.01. Calculated using the same trading pair and the same quarter start/end, the gain is about 70.9%. This verifies the magnitude of the hot headline, but it’s only historical spot returns on Binance denominated in USDT; if you switch to other exchanges, a USD-based benchmark, or different start/end timestamps, the numbers may differ slightly—and you definitely can’t write it as realized gains already achieved in Q4.
Why is this topic worth watching? Quarterly gains affect the cost distribution of existing holders and the decisions they make for rebalancing: funds sitting on thicker unrealized profits may lock in gains in the new quarter, while trend-following funds may also keep adding. Both forces can exist at the same time. The historical quarterly gain itself is not new capital inflow. I’ve discussed the last round of ETH fund subscriptions/redemptions, the Glamdsterdam testnet preparation, and US employment data before; this time I’ll only focus on the difference between the “hot list return rate” and current tradable conditions, not treating the testnet schedule as a mainnet upgrade that’s already live, and not turning a single hot-list headline into ETF net subscriptions.
The immediate market reaction is nowhere near as exaggerated as the headline. When sampling Binance ETH/USDT around $2,685, the last 24-hour high is $2,722 and the low is $2,667.94—about a 0.17% move. In other words, the big quarterly rally has already been written into the prices from the past three months, while today we’re still roughly tugging around the $2,700 area. What I want to observe is whether $2,722 can become a new support, not chasing the 70.9% “rear-view mirror” number. If it falls below $2,668 and can’t rebound, the intraday range weakens and the view of “upward momentum following the new quarter” should be withdrawn. Only if it holds above $2,722 and the spot liquidity and fund net flows subsequently cooperate do we have stronger evidence of continuation.
If it were my own trade, I wouldn’t participate right now; I’d keep an empty position. If the hourly close breaks above $2,722, and the pullback still holds and is not a single-candle spike, then I’d use no more than 5% of total capital to probe a spot long. The entry trigger is the confirmed pullback; the first target is $2,780. Once reached, I’d cut half, and keep the remainder to watch around $2,820, but I wouldn’t assume it must get there. The stop-loss is placed at the point where the pullback structure fails; if the hourly close falls back below $2,700, I’ll execute the stop-loss and close the position rather than turning it into a long-term bag-holding situation. If price first loses $2,668, I won’t guess the bottom—I’ll wait for it to stand back up or for a new range to form. Each trade’s maximum preset risk is no more than 0.5%, and I don’t use high leverage. If the conditions aren’t met, there’s no trade and no profit worth reviewing.
Quarterly statistics are facts; the next step is to test the hypothesis with price action, and position size is only handed to the trigger conditions. #EtherGains70.9%InQ3 #ETH
The above is only my personal market observation and does not constitute investment advice.
My attitude is to respect the existing gains, but not to use a quarterly report as today’s buy order. Binance Square’s current trending topics show #EtherGains70.9%InQ3. I independently compute using publicly available Binance ETH/USDT monthly chart data: the July open is about $1,572, and the September close is about $2,686.01. Calculated using the same trading pair and the same quarter start/end, the gain is about 70.9%. This verifies the magnitude of the hot headline, but it’s only historical spot returns on Binance denominated in USDT; if you switch to other exchanges, a USD-based benchmark, or different start/end timestamps, the numbers may differ slightly—and you definitely can’t write it as realized gains already achieved in Q4.
Why is this topic worth watching? Quarterly gains affect the cost distribution of existing holders and the decisions they make for rebalancing: funds sitting on thicker unrealized profits may lock in gains in the new quarter, while trend-following funds may also keep adding. Both forces can exist at the same time. The historical quarterly gain itself is not new capital inflow. I’ve discussed the last round of ETH fund subscriptions/redemptions, the Glamdsterdam testnet preparation, and US employment data before; this time I’ll only focus on the difference between the “hot list return rate” and current tradable conditions, not treating the testnet schedule as a mainnet upgrade that’s already live, and not turning a single hot-list headline into ETF net subscriptions.
The immediate market reaction is nowhere near as exaggerated as the headline. When sampling Binance ETH/USDT around $2,685, the last 24-hour high is $2,722 and the low is $2,667.94—about a 0.17% move. In other words, the big quarterly rally has already been written into the prices from the past three months, while today we’re still roughly tugging around the $2,700 area. What I want to observe is whether $2,722 can become a new support, not chasing the 70.9% “rear-view mirror” number. If it falls below $2,668 and can’t rebound, the intraday range weakens and the view of “upward momentum following the new quarter” should be withdrawn. Only if it holds above $2,722 and the spot liquidity and fund net flows subsequently cooperate do we have stronger evidence of continuation.
If it were my own trade, I wouldn’t participate right now; I’d keep an empty position. If the hourly close breaks above $2,722, and the pullback still holds and is not a single-candle spike, then I’d use no more than 5% of total capital to probe a spot long. The entry trigger is the confirmed pullback; the first target is $2,780. Once reached, I’d cut half, and keep the remainder to watch around $2,820, but I wouldn’t assume it must get there. The stop-loss is placed at the point where the pullback structure fails; if the hourly close falls back below $2,700, I’ll execute the stop-loss and close the position rather than turning it into a long-term bag-holding situation. If price first loses $2,668, I won’t guess the bottom—I’ll wait for it to stand back up or for a new range to form. Each trade’s maximum preset risk is no more than 0.5%, and I don’t use high leverage. If the conditions aren’t met, there’s no trade and no profit worth reviewing.
Quarterly statistics are facts; the next step is to test the hypothesis with price action, and position size is only handed to the trigger conditions. #EtherGains70.9%InQ3 #ETH
The above is only my personal market observation and does not constitute investment advice.

95
Bitcoin ETF attracts $6.3 billion in net inflows in a single quarter; easing inflation opens up new opportunities for the October rally
I. Market Overview: Institutional Capital Accelerates Into the Market
In the third quarter of 2026, U.S. spot Bitcoin ETFs recorded $6.34 billion in net inflows, setting the highest quarterly record of the year. Behind this figure, Bitcoin surged by about 43% in September, closing near $83,784 at month-end. Citi subsequently raised its 12-month target price for Bitcoin to $113,000 and for Ethereum to $3,028, indicating that Wall Street confidence in crypto assets is continuing to strengthen.
According to the Plaza, Bitcoin was mentioned more than 18,000 times over the past 24 hours, with more than 8,300 independent authors; bullish sentiment is clearly higher than bearish sentiment. Ethereum also performed strongly: in Q3 it rose 70.9%, becoming one of the Plaza’s trending topic tags.
II. Easing Inflation: Key Signals of the Federal Reserve’s Policy Shift
In August, the U.S. core PCE price index increased 3.0% year over year, below the market expectation of 3.3% and hitting a six-month low. This data significantly reduced the probability of the Federal Reserve raising rates in October. Goldman Sachs and JPMorgan have pushed their expectations for the next rate hike back to December.
What does easing inflation mean for the crypto market? Simply put, expectations of tighter liquidity weaken, giving risk assets room to breathe. After the data release, Bitcoin briefly spiked to $85,500 before pulling back. Ten-year U.S. Treasury yields remain around 5.28%, providing some restraint on the rebound. But based on historical patterns, October is Bitcoin’s best-performing month, with an average return close to 20%.
III. Safety Warning: Record-Setting Hacker Attacks in September
However, the market is not entirely optimistic. In September, the crypto industry suffered more than 55 major security incidents, with total losses reaching $766 million to $768 million—up 462% from August. Among them, the Bitget exchange was hacked for $388 million, and Liquid Network lost $320 million; these two events accounted for the vast majority of the losses.
Cumulative security losses in the third quarter exceeded $1.26 billion, up 53.9% year over year. Even more worrying is that the NEAR Intents protocol lost $3.86 million due to a cross-chain vulnerability; the attackers were traced to ties with the North Korean Lazarus hacking group. The stolen funds were bridged to Bitcoin via KuCoin. Although the protocol has already patched the vulnerability and pledged full compensation to users, this incident once again reminds us: while institutional capital is rushing in, the security of DeFi infrastructure remains the industry’s biggest weak link.
IV. Tokenized U.S. Stocks: Traditional Assets Moving On-Chain Faster
On another track where traditional finance and crypto are converging, tokenized U.S. stocks are developing rapidly. Currently, several tokenized versions of U.S. stocks are already trading on-chain, including Emerging Markets ETF (EEM), Moderna (MRNA), and others, covering both BSC and Ethereum main chains.
Tokenized U.S. stocks allow global investors to trade traditional stock assets 24 hours a day without relying on the trading-hours limitations of traditional brokers. With the UK FCA formally opening the crypto authorization application channel on September 30, more traditional financial products are expected to enter the crypto market in tokenized form.
V. Regulatory Developments: The UK Opens the Door to Compliance
The UK’s Financial Conduct Authority began accepting crypto authorization applications on September 30, requiring all crypto firms operating in the UK to submit applications by February 28, 2027. Starting October 25, 2027, crypto activities without a license will be considered illegal.
The rollout of this regulatory framework signals that the UK is shifting from watching and waiting to actively embracing. For the global crypto industry, clearer regulation in major economies will attract more institutional capital and help move the industry from reckless growth toward mature, compliant development.
VI. October Outlook: Opportunities and Risks Coexist
As October arrives, the market faces multiple variables. On one hand, Bitcoin ETFs continue to draw capital, inflation cools, and historical seasonality tailwinds provide support for an upward trend. On the other hand, on October 1, there was a net outflow from ETFs of $150 million in a single day, showing that near-term profit-taking pressure is still present.
For investors, the current stage calls for focusing on three core indicators: the trend in U.S. Treasury yields, ETF fund flows, and the follow-on impact of major security events. With the market’s level of institutionalization rising, crypto is shifting from speculation-driven to value-driven—but security issues and regulatory uncertainty remain the ever-present sword of Damocles.
#EtherGains70.9%InQ3 #TreasuryLetsStatesFileStablecoinCertificationsEarly #BitcoinETF
Bitcoin ETF attracts $6.3 billion in net inflows in a single quarter; easing inflation opens up new opportunities for the October rally
I. Market Overview: Institutional Capital Accelerates Into the Market
In the third quarter of 2026, U.S. spot Bitcoin ETFs recorded $6.34 billion in net inflows, setting the highest quarterly record of the year. Behind this figure, Bitcoin surged by about 43% in September, closing near $83,784 at month-end. Citi subsequently raised its 12-month target price for Bitcoin to $113,000 and for Ethereum to $3,028, indicating that Wall Street confidence in crypto assets is continuing to strengthen.
According to the Plaza, Bitcoin was mentioned more than 18,000 times over the past 24 hours, with more than 8,300 independent authors; bullish sentiment is clearly higher than bearish sentiment. Ethereum also performed strongly: in Q3 it rose 70.9%, becoming one of the Plaza’s trending topic tags.
II. Easing Inflation: Key Signals of the Federal Reserve’s Policy Shift
In August, the U.S. core PCE price index increased 3.0% year over year, below the market expectation of 3.3% and hitting a six-month low. This data significantly reduced the probability of the Federal Reserve raising rates in October. Goldman Sachs and JPMorgan have pushed their expectations for the next rate hike back to December.
What does easing inflation mean for the crypto market? Simply put, expectations of tighter liquidity weaken, giving risk assets room to breathe. After the data release, Bitcoin briefly spiked to $85,500 before pulling back. Ten-year U.S. Treasury yields remain around 5.28%, providing some restraint on the rebound. But based on historical patterns, October is Bitcoin’s best-performing month, with an average return close to 20%.
III. Safety Warning: Record-Setting Hacker Attacks in September
However, the market is not entirely optimistic. In September, the crypto industry suffered more than 55 major security incidents, with total losses reaching $766 million to $768 million—up 462% from August. Among them, the Bitget exchange was hacked for $388 million, and Liquid Network lost $320 million; these two events accounted for the vast majority of the losses.
Cumulative security losses in the third quarter exceeded $1.26 billion, up 53.9% year over year. Even more worrying is that the NEAR Intents protocol lost $3.86 million due to a cross-chain vulnerability; the attackers were traced to ties with the North Korean Lazarus hacking group. The stolen funds were bridged to Bitcoin via KuCoin. Although the protocol has already patched the vulnerability and pledged full compensation to users, this incident once again reminds us: while institutional capital is rushing in, the security of DeFi infrastructure remains the industry’s biggest weak link.
IV. Tokenized U.S. Stocks: Traditional Assets Moving On-Chain Faster
On another track where traditional finance and crypto are converging, tokenized U.S. stocks are developing rapidly. Currently, several tokenized versions of U.S. stocks are already trading on-chain, including Emerging Markets ETF (EEM), Moderna (MRNA), and others, covering both BSC and Ethereum main chains.
Tokenized U.S. stocks allow global investors to trade traditional stock assets 24 hours a day without relying on the trading-hours limitations of traditional brokers. With the UK FCA formally opening the crypto authorization application channel on September 30, more traditional financial products are expected to enter the crypto market in tokenized form.
V. Regulatory Developments: The UK Opens the Door to Compliance
The UK’s Financial Conduct Authority began accepting crypto authorization applications on September 30, requiring all crypto firms operating in the UK to submit applications by February 28, 2027. Starting October 25, 2027, crypto activities without a license will be considered illegal.
The rollout of this regulatory framework signals that the UK is shifting from watching and waiting to actively embracing. For the global crypto industry, clearer regulation in major economies will attract more institutional capital and help move the industry from reckless growth toward mature, compliant development.
VI. October Outlook: Opportunities and Risks Coexist
As October arrives, the market faces multiple variables. On one hand, Bitcoin ETFs continue to draw capital, inflation cools, and historical seasonality tailwinds provide support for an upward trend. On the other hand, on October 1, there was a net outflow from ETFs of $150 million in a single day, showing that near-term profit-taking pressure is still present.
For investors, the current stage calls for focusing on three core indicators: the trend in U.S. Treasury yields, ETF fund flows, and the follow-on impact of major security events. With the market’s level of institutionalization rising, crypto is shifting from speculation-driven to value-driven—but security issues and regulatory uncertainty remain the ever-present sword of Damocles.
#EtherGains70.9%InQ3 #TreasuryLetsStatesFileStablecoinCertificationsEarly #BitcoinETF
I. Market Overview: Institutional Capital Accelerates Into the Market
In the third quarter of 2026, U.S. spot Bitcoin ETFs recorded $6.34 billion in net inflows, setting the highest quarterly record of the year. Behind this figure, Bitcoin surged by about 43% in September, closing near $83,784 at month-end. Citi subsequently raised its 12-month target price for Bitcoin to $113,000 and for Ethereum to $3,028, indicating that Wall Street confidence in crypto assets is continuing to strengthen.
According to the Plaza, Bitcoin was mentioned more than 18,000 times over the past 24 hours, with more than 8,300 independent authors; bullish sentiment is clearly higher than bearish sentiment. Ethereum also performed strongly: in Q3 it rose 70.9%, becoming one of the Plaza’s trending topic tags.
II. Easing Inflation: Key Signals of the Federal Reserve’s Policy Shift
In August, the U.S. core PCE price index increased 3.0% year over year, below the market expectation of 3.3% and hitting a six-month low. This data significantly reduced the probability of the Federal Reserve raising rates in October. Goldman Sachs and JPMorgan have pushed their expectations for the next rate hike back to December.
What does easing inflation mean for the crypto market? Simply put, expectations of tighter liquidity weaken, giving risk assets room to breathe. After the data release, Bitcoin briefly spiked to $85,500 before pulling back. Ten-year U.S. Treasury yields remain around 5.28%, providing some restraint on the rebound. But based on historical patterns, October is Bitcoin’s best-performing month, with an average return close to 20%.
III. Safety Warning: Record-Setting Hacker Attacks in September
However, the market is not entirely optimistic. In September, the crypto industry suffered more than 55 major security incidents, with total losses reaching $766 million to $768 million—up 462% from August. Among them, the Bitget exchange was hacked for $388 million, and Liquid Network lost $320 million; these two events accounted for the vast majority of the losses.
Cumulative security losses in the third quarter exceeded $1.26 billion, up 53.9% year over year. Even more worrying is that the NEAR Intents protocol lost $3.86 million due to a cross-chain vulnerability; the attackers were traced to ties with the North Korean Lazarus hacking group. The stolen funds were bridged to Bitcoin via KuCoin. Although the protocol has already patched the vulnerability and pledged full compensation to users, this incident once again reminds us: while institutional capital is rushing in, the security of DeFi infrastructure remains the industry’s biggest weak link.
IV. Tokenized U.S. Stocks: Traditional Assets Moving On-Chain Faster
On another track where traditional finance and crypto are converging, tokenized U.S. stocks are developing rapidly. Currently, several tokenized versions of U.S. stocks are already trading on-chain, including Emerging Markets ETF (EEM), Moderna (MRNA), and others, covering both BSC and Ethereum main chains.
Tokenized U.S. stocks allow global investors to trade traditional stock assets 24 hours a day without relying on the trading-hours limitations of traditional brokers. With the UK FCA formally opening the crypto authorization application channel on September 30, more traditional financial products are expected to enter the crypto market in tokenized form.
V. Regulatory Developments: The UK Opens the Door to Compliance
The UK’s Financial Conduct Authority began accepting crypto authorization applications on September 30, requiring all crypto firms operating in the UK to submit applications by February 28, 2027. Starting October 25, 2027, crypto activities without a license will be considered illegal.
The rollout of this regulatory framework signals that the UK is shifting from watching and waiting to actively embracing. For the global crypto industry, clearer regulation in major economies will attract more institutional capital and help move the industry from reckless growth toward mature, compliant development.
VI. October Outlook: Opportunities and Risks Coexist
As October arrives, the market faces multiple variables. On one hand, Bitcoin ETFs continue to draw capital, inflation cools, and historical seasonality tailwinds provide support for an upward trend. On the other hand, on October 1, there was a net outflow from ETFs of $150 million in a single day, showing that near-term profit-taking pressure is still present.
For investors, the current stage calls for focusing on three core indicators: the trend in U.S. Treasury yields, ETF fund flows, and the follow-on impact of major security events. With the market’s level of institutionalization rising, crypto is shifting from speculation-driven to value-driven—but security issues and regulatory uncertainty remain the ever-present sword of Damocles.
#EtherGains70.9%InQ3 #TreasuryLetsStatesFileStablecoinCertificationsEarly #BitcoinETF
11

·
--
Is 'ethergains70 9 inq3' a new signal for the market?
Lately on Binance Square, I’ve seen people talking a lot about the topic 'ethergains70 9 inq3'. It feels like there’s an underlying current quietly stirring things up, making the community’s mood noticeably more excited.
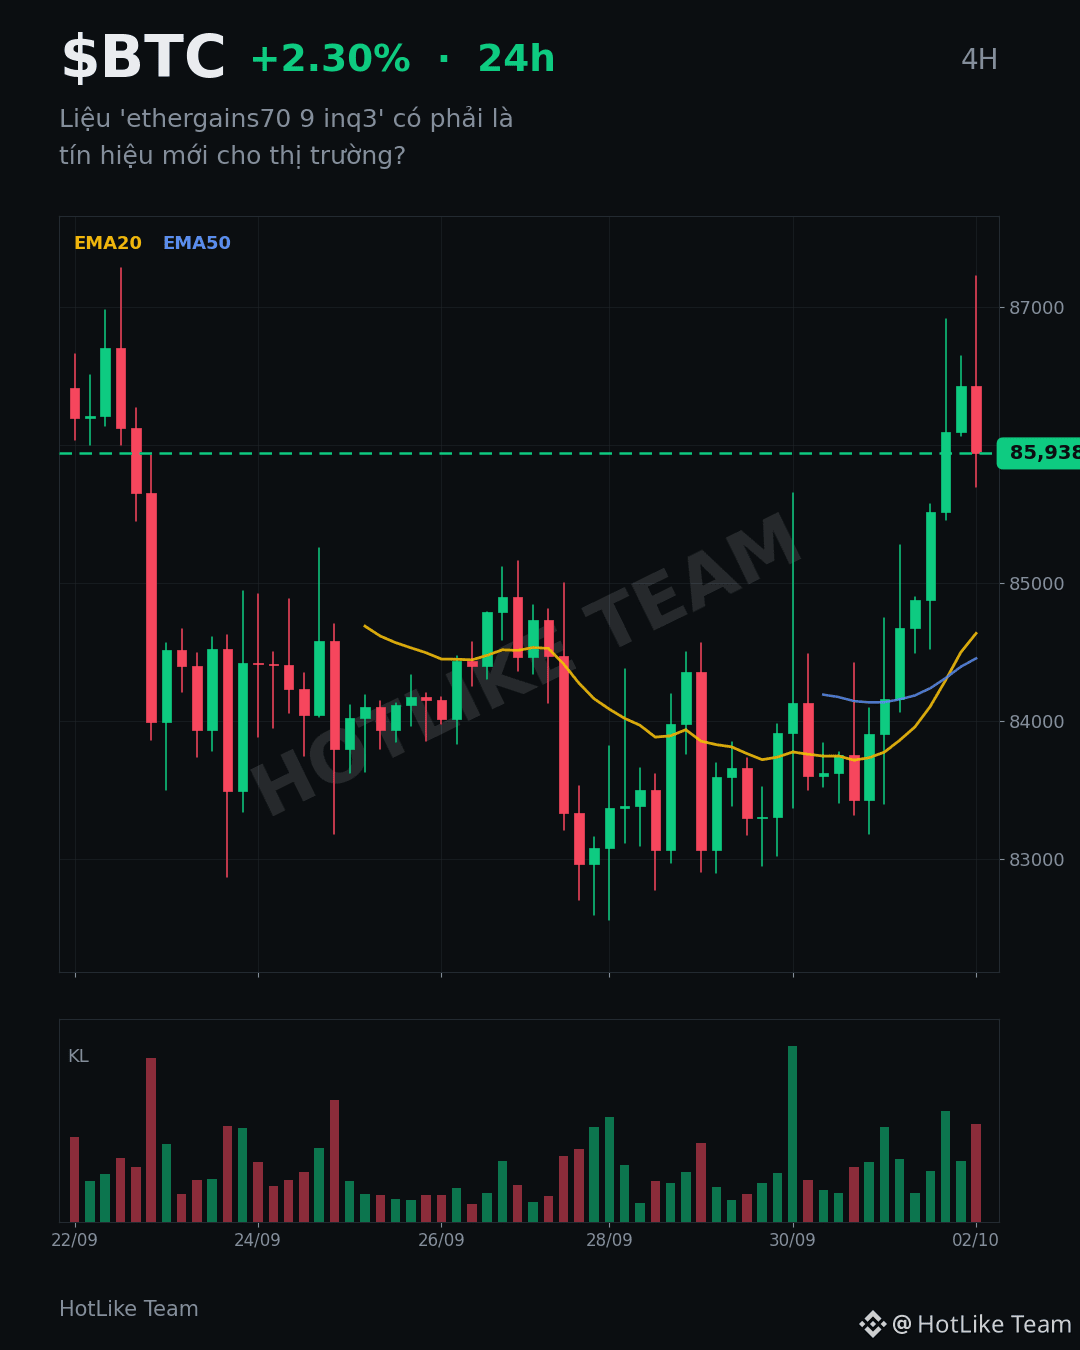
Looking at Bitcoin ($BTC), even though the overall market still has its share of pullbacks, this morning BTC is up 2.30% with fairly strong trading volume. This makes me wonder: could topics like 'ethergains70 9 inq3' be reflecting new interest—an unseen flow of money quietly shifting in, looking for opportunities after the strong growth waves of major coin(s)?
Reference information only, not investment advice. DYOR.
#BTC #ethergains70.9%inq3
Is 'ethergains70 9 inq3' a new signal for the market?
Lately on Binance Square, I’ve seen people talking a lot about the topic 'ethergains70 9 inq3'. It feels like there’s an underlying current quietly stirring things up, making the community’s mood noticeably more excited.
Looking at Bitcoin ($BTC ), even though the overall market still has its share of pullbacks, this morning BTC is up 2.30% with fairly strong trading volume. This makes me wonder: could topics like 'ethergains70 9 inq3' be reflecting new interest—an unseen flow of money quietly shifting in, looking for opportunities after the strong growth waves of major coin(s)?
Reference information only, not investment advice. DYOR.
#BTC #ethergains70.9%inq3
Lately on Binance Square, I’ve seen people talking a lot about the topic 'ethergains70 9 inq3'. It feels like there’s an underlying current quietly stirring things up, making the community’s mood noticeably more excited.
Looking at Bitcoin ($BTC ), even though the overall market still has its share of pullbacks, this morning BTC is up 2.30% with fairly strong trading volume. This makes me wonder: could topics like 'ethergains70 9 inq3' be reflecting new interest—an unseen flow of money quietly shifting in, looking for opportunities after the strong growth waves of major coin(s)?
Reference information only, not investment advice. DYOR.
#BTC #ethergains70.9%inq3
111
Acceleration of Institutional Inflow and a Macro Turn: Key Signals for the Crypto Market in Q4 2026
1. Wall Street Giants Collectively Raise Their Crypto Asset Price Targets
With the end of Q3 2026, major financial institutions on Wall Street have released their latest outlooks on the crypto market. Citigroup was the first to act, raising its 12-month target price for Bitcoin from $82,000 to $113,000, and increasing its Ethereum target price from $2,240 to $3,028. The magnitude of this adjustment reflects a significant boost in institutional investors’ confidence in crypto assets.
In its research report, Citigroup said the main factors driving the upward revision include three aspects: rising activity levels in the crypto market, a macroeconomic environment that is becoming more supportive, and strong momentum in ETF inflows. Data shows that U.S. spot Bitcoin ETFs recorded a net inflow of $6.34 billion in Q3, the best single-quarter performance since 2026. This strongly indicates that traditional financial capital is accelerating its shift toward the crypto market.
2. Cooling Inflation Gives the Market Breathing Room
Positive macro developments are also not to be overlooked. In the U.S., August’s core PCE inflation year-over-year growth slowed to 3.0%, below market expectations of 3.3%, and reaching a six-month low. This data directly eased concerns about the Fed raising rates in October. After the release, Bitcoin briefly touched $85,500.
Goldman Sachs subsequently adjusted its forecast, pushing the timing of the next rate hike back from October to December. Fed officials such as Vice Chair Jefferson also sent signals of patience, saying they would closely monitor subsequent data before making decisions. This easing of policy expectations provides a short-term macro tailwind for the crypto market. For risk assets, reduced uncertainty around the interest-rate path often means valuation pressure is also easing.
3. Tokenized U.S. Stocks Bridging the Traditional Finance–Crypto Divide
Against the backdrop of the long-term trend toward integration between traditional finance and crypto markets, tokenized U.S. stocks are becoming an important bridge connecting the two worlds. At present, the Binance Web3 platform has launched multiple tokenized U.S. stock products, including EEM, MRNA, LIN, and other tickers, allowing investors to indirectly hold U.S. stock assets through on-chain tokens.
The significance of this innovation is twofold: on one hand, it provides native crypto users with a convenient channel to access traditional stocks; on the other hand, it lowers the barrier for traditional investors entering the crypto ecosystem. As regulatory frameworks gradually become clearer, more U.S. stock tickers are expected to appear in tokenized form in the future, further blurring the boundaries between traditional finance and DeFi.
4. Global Tightening of Regulation and Moves Toward Standardization
On the regulatory front, the UK Financial Conduct Authority opened the crypto authorization pathway on September 30. It requires all crypto firms operating in the UK to submit applications by February 28, 2027, or face illegal-operations risk starting October 25, 2027. This framework uses stringent standards similar to bank licensing, signaling that UK crypto regulation has entered a substantive enforcement phase.
Meanwhile, the U.S. Department of the Treasury also allows states to submit stablecoin certification applications early, paving the way for the development of compliant stablecoins. Global regulation is shifting from observation to proactive rulemaking. While this may increase compliance costs in the short term, in the long run it is beneficial for healthy industry development and for large-scale institutional capital inflows.
5. Security Risks Still Need Vigilance
Even though the market outlook is optimistic, security risks remain the sword of Damocles hanging over the industry. In September, the crypto industry suffered its most severe hacking attack of the year. Losses totaled as much as $768 million in a single month, involving 55 or more major security incidents—up 462% compared with August. Among them, Bitget was hacked for $388 million and Liquid Network suffered a $320 million attack; these two incidents accounted for the vast majority of the losses.
Entering October, security incidents are still ongoing. NEAR Intents experienced a $3.8 million hack on October 1, and the attackers were linked to the North Korea-based Lazarus organization. This is a reminder to all market participants that while pursuing returns, asset security must come first. Choosing audited protocols, using hardware wallets, and storing assets in a diversified manner are basic security rules.
6. Market Sentiment and Community Hype
Based on Binance Square community data, BTC led in mentions with 18,538, including 994 bullish mentions and only 202 bearish mentions, giving a long-to-short ratio close to 5:1. BNB and SOL followed with 18,039 and 16,276 mentions, respectively. Although ETH ranked fourth with 8,201 mentions, bullish sentiment was the most concentrated: 604 bullish mentions versus 95 bearish mentions, showing strong community confidence in Ethereum.
For popular topic hashtags, EtherGains70.9%InQ3 generated 1,134 pieces of content and 151,000 views, reflecting widespread attention to Ethereum’s performance in Q3. TreasuryLetsStatesFileStablecoinCertificationsEarly focuses on progress in stablecoin regulation, showing the community’s high sensitivity to policy developments.
7. Outlook for Q4
Overall, Q4 2026 presents multiple positives for the crypto market: raised institutional price targets, continued ETF inflows, cooling inflation that eases pressure from rate hikes, and the expansion of tokenized products into broader use cases. At the same time, investors should still pay attention to security risks, regulatory compliance costs, and the pressure of short-term profit-taking.
On October 1, Bitcoin ETFs saw a single-day net outflow of $150 million, ending the prior streak of net inflows lasting 10 consecutive trading days. However, the 7-day net inflow remains positive at $259 million, suggesting this is more like short-term profit-taking rather than a trend reversal. Investors should stay rational, focus on fundamental changes, and avoid chasing rallies or panic selling.
For ordinary investors, the current environment may be suitable for a dollar-cost averaging (DCA) strategy—diversifying across major assets—while closely monitoring the evolution of regulatory policies and security safeguards. The crypto market is moving from the fringe toward the mainstream, and every bout of volatility along this transition is a test of investors’ patience and discipline.
#EtherGains70.9%InQ3 #TreasuryLetsStatesFileStablecoinCertificationsEarly #BTCETFInflows
Acceleration of Institutional Inflow and a Macro Turn: Key Signals for the Crypto Market in Q4 2026
1. Wall Street Giants Collectively Raise Their Crypto Asset Price Targets
With the end of Q3 2026, major financial institutions on Wall Street have released their latest outlooks on the crypto market. Citigroup was the first to act, raising its 12-month target price for Bitcoin from $82,000 to $113,000, and increasing its Ethereum target price from $2,240 to $3,028. The magnitude of this adjustment reflects a significant boost in institutional investors’ confidence in crypto assets.
In its research report, Citigroup said the main factors driving the upward revision include three aspects: rising activity levels in the crypto market, a macroeconomic environment that is becoming more supportive, and strong momentum in ETF inflows. Data shows that U.S. spot Bitcoin ETFs recorded a net inflow of $6.34 billion in Q3, the best single-quarter performance since 2026. This strongly indicates that traditional financial capital is accelerating its shift toward the crypto market.
2. Cooling Inflation Gives the Market Breathing Room
Positive macro developments are also not to be overlooked. In the U.S., August’s core PCE inflation year-over-year growth slowed to 3.0%, below market expectations of 3.3%, and reaching a six-month low. This data directly eased concerns about the Fed raising rates in October. After the release, Bitcoin briefly touched $85,500.
Goldman Sachs subsequently adjusted its forecast, pushing the timing of the next rate hike back from October to December. Fed officials such as Vice Chair Jefferson also sent signals of patience, saying they would closely monitor subsequent data before making decisions. This easing of policy expectations provides a short-term macro tailwind for the crypto market. For risk assets, reduced uncertainty around the interest-rate path often means valuation pressure is also easing.
3. Tokenized U.S. Stocks Bridging the Traditional Finance–Crypto Divide
Against the backdrop of the long-term trend toward integration between traditional finance and crypto markets, tokenized U.S. stocks are becoming an important bridge connecting the two worlds. At present, the Binance Web3 platform has launched multiple tokenized U.S. stock products, including EEM, MRNA, LIN, and other tickers, allowing investors to indirectly hold U.S. stock assets through on-chain tokens.
The significance of this innovation is twofold: on one hand, it provides native crypto users with a convenient channel to access traditional stocks; on the other hand, it lowers the barrier for traditional investors entering the crypto ecosystem. As regulatory frameworks gradually become clearer, more U.S. stock tickers are expected to appear in tokenized form in the future, further blurring the boundaries between traditional finance and DeFi.
4. Global Tightening of Regulation and Moves Toward Standardization
On the regulatory front, the UK Financial Conduct Authority opened the crypto authorization pathway on September 30. It requires all crypto firms operating in the UK to submit applications by February 28, 2027, or face illegal-operations risk starting October 25, 2027. This framework uses stringent standards similar to bank licensing, signaling that UK crypto regulation has entered a substantive enforcement phase.
Meanwhile, the U.S. Department of the Treasury also allows states to submit stablecoin certification applications early, paving the way for the development of compliant stablecoins. Global regulation is shifting from observation to proactive rulemaking. While this may increase compliance costs in the short term, in the long run it is beneficial for healthy industry development and for large-scale institutional capital inflows.
5. Security Risks Still Need Vigilance
Even though the market outlook is optimistic, security risks remain the sword of Damocles hanging over the industry. In September, the crypto industry suffered its most severe hacking attack of the year. Losses totaled as much as $768 million in a single month, involving 55 or more major security incidents—up 462% compared with August. Among them, Bitget was hacked for $388 million and Liquid Network suffered a $320 million attack; these two incidents accounted for the vast majority of the losses.
Entering October, security incidents are still ongoing. NEAR Intents experienced a $3.8 million hack on October 1, and the attackers were linked to the North Korea-based Lazarus organization. This is a reminder to all market participants that while pursuing returns, asset security must come first. Choosing audited protocols, using hardware wallets, and storing assets in a diversified manner are basic security rules.
6. Market Sentiment and Community Hype
Based on Binance Square community data, BTC led in mentions with 18,538, including 994 bullish mentions and only 202 bearish mentions, giving a long-to-short ratio close to 5:1. BNB and SOL followed with 18,039 and 16,276 mentions, respectively. Although ETH ranked fourth with 8,201 mentions, bullish sentiment was the most concentrated: 604 bullish mentions versus 95 bearish mentions, showing strong community confidence in Ethereum.
For popular topic hashtags, EtherGains70.9%InQ3 generated 1,134 pieces of content and 151,000 views, reflecting widespread attention to Ethereum’s performance in Q3. TreasuryLetsStatesFileStablecoinCertificationsEarly focuses on progress in stablecoin regulation, showing the community’s high sensitivity to policy developments.
7. Outlook for Q4
Overall, Q4 2026 presents multiple positives for the crypto market: raised institutional price targets, continued ETF inflows, cooling inflation that eases pressure from rate hikes, and the expansion of tokenized products into broader use cases. At the same time, investors should still pay attention to security risks, regulatory compliance costs, and the pressure of short-term profit-taking.
On October 1, Bitcoin ETFs saw a single-day net outflow of $150 million, ending the prior streak of net inflows lasting 10 consecutive trading days. However, the 7-day net inflow remains positive at $259 million, suggesting this is more like short-term profit-taking rather than a trend reversal. Investors should stay rational, focus on fundamental changes, and avoid chasing rallies or panic selling.
For ordinary investors, the current environment may be suitable for a dollar-cost averaging (DCA) strategy—diversifying across major assets—while closely monitoring the evolution of regulatory policies and security safeguards. The crypto market is moving from the fringe toward the mainstream, and every bout of volatility along this transition is a test of investors’ patience and discipline.
#EtherGains70.9%InQ3 #TreasuryLetsStatesFileStablecoinCertificationsEarly #BTCETFInflows
1. Wall Street Giants Collectively Raise Their Crypto Asset Price Targets
With the end of Q3 2026, major financial institutions on Wall Street have released their latest outlooks on the crypto market. Citigroup was the first to act, raising its 12-month target price for Bitcoin from $82,000 to $113,000, and increasing its Ethereum target price from $2,240 to $3,028. The magnitude of this adjustment reflects a significant boost in institutional investors’ confidence in crypto assets.
In its research report, Citigroup said the main factors driving the upward revision include three aspects: rising activity levels in the crypto market, a macroeconomic environment that is becoming more supportive, and strong momentum in ETF inflows. Data shows that U.S. spot Bitcoin ETFs recorded a net inflow of $6.34 billion in Q3, the best single-quarter performance since 2026. This strongly indicates that traditional financial capital is accelerating its shift toward the crypto market.
2. Cooling Inflation Gives the Market Breathing Room
Positive macro developments are also not to be overlooked. In the U.S., August’s core PCE inflation year-over-year growth slowed to 3.0%, below market expectations of 3.3%, and reaching a six-month low. This data directly eased concerns about the Fed raising rates in October. After the release, Bitcoin briefly touched $85,500.
Goldman Sachs subsequently adjusted its forecast, pushing the timing of the next rate hike back from October to December. Fed officials such as Vice Chair Jefferson also sent signals of patience, saying they would closely monitor subsequent data before making decisions. This easing of policy expectations provides a short-term macro tailwind for the crypto market. For risk assets, reduced uncertainty around the interest-rate path often means valuation pressure is also easing.
3. Tokenized U.S. Stocks Bridging the Traditional Finance–Crypto Divide
Against the backdrop of the long-term trend toward integration between traditional finance and crypto markets, tokenized U.S. stocks are becoming an important bridge connecting the two worlds. At present, the Binance Web3 platform has launched multiple tokenized U.S. stock products, including EEM, MRNA, LIN, and other tickers, allowing investors to indirectly hold U.S. stock assets through on-chain tokens.
The significance of this innovation is twofold: on one hand, it provides native crypto users with a convenient channel to access traditional stocks; on the other hand, it lowers the barrier for traditional investors entering the crypto ecosystem. As regulatory frameworks gradually become clearer, more U.S. stock tickers are expected to appear in tokenized form in the future, further blurring the boundaries between traditional finance and DeFi.
4. Global Tightening of Regulation and Moves Toward Standardization
On the regulatory front, the UK Financial Conduct Authority opened the crypto authorization pathway on September 30. It requires all crypto firms operating in the UK to submit applications by February 28, 2027, or face illegal-operations risk starting October 25, 2027. This framework uses stringent standards similar to bank licensing, signaling that UK crypto regulation has entered a substantive enforcement phase.
Meanwhile, the U.S. Department of the Treasury also allows states to submit stablecoin certification applications early, paving the way for the development of compliant stablecoins. Global regulation is shifting from observation to proactive rulemaking. While this may increase compliance costs in the short term, in the long run it is beneficial for healthy industry development and for large-scale institutional capital inflows.
5. Security Risks Still Need Vigilance
Even though the market outlook is optimistic, security risks remain the sword of Damocles hanging over the industry. In September, the crypto industry suffered its most severe hacking attack of the year. Losses totaled as much as $768 million in a single month, involving 55 or more major security incidents—up 462% compared with August. Among them, Bitget was hacked for $388 million and Liquid Network suffered a $320 million attack; these two incidents accounted for the vast majority of the losses.
Entering October, security incidents are still ongoing. NEAR Intents experienced a $3.8 million hack on October 1, and the attackers were linked to the North Korea-based Lazarus organization. This is a reminder to all market participants that while pursuing returns, asset security must come first. Choosing audited protocols, using hardware wallets, and storing assets in a diversified manner are basic security rules.
6. Market Sentiment and Community Hype
Based on Binance Square community data, BTC led in mentions with 18,538, including 994 bullish mentions and only 202 bearish mentions, giving a long-to-short ratio close to 5:1. BNB and SOL followed with 18,039 and 16,276 mentions, respectively. Although ETH ranked fourth with 8,201 mentions, bullish sentiment was the most concentrated: 604 bullish mentions versus 95 bearish mentions, showing strong community confidence in Ethereum.
For popular topic hashtags, EtherGains70.9%InQ3 generated 1,134 pieces of content and 151,000 views, reflecting widespread attention to Ethereum’s performance in Q3. TreasuryLetsStatesFileStablecoinCertificationsEarly focuses on progress in stablecoin regulation, showing the community’s high sensitivity to policy developments.
7. Outlook for Q4
Overall, Q4 2026 presents multiple positives for the crypto market: raised institutional price targets, continued ETF inflows, cooling inflation that eases pressure from rate hikes, and the expansion of tokenized products into broader use cases. At the same time, investors should still pay attention to security risks, regulatory compliance costs, and the pressure of short-term profit-taking.
On October 1, Bitcoin ETFs saw a single-day net outflow of $150 million, ending the prior streak of net inflows lasting 10 consecutive trading days. However, the 7-day net inflow remains positive at $259 million, suggesting this is more like short-term profit-taking rather than a trend reversal. Investors should stay rational, focus on fundamental changes, and avoid chasing rallies or panic selling.
For ordinary investors, the current environment may be suitable for a dollar-cost averaging (DCA) strategy—diversifying across major assets—while closely monitoring the evolution of regulatory policies and security safeguards. The crypto market is moving from the fringe toward the mainstream, and every bout of volatility along this transition is a test of investors’ patience and discipline.
#EtherGains70.9%InQ3 #TreasuryLetsStatesFileStablecoinCertificationsEarly #BTCETFInflows
302
Tokenized U.S. stocks soar 390%: the convergence of Wall Street and the crypto world is accelerating
1. Tokenized stocks see explosive growth
In the third quarter of 2026, the global tokenized stock market delivered an impressive performance. Binance CEO Changpeng Zhao said in his latest public remarks that tokenized stocks surged 390% over the past year. Even so, tokenized stocks currently account for only 0.0029% of the total market capitalization of globally listed stocks, which stands at $1.519 trillion. The figure not only highlights the astonishing growth rate of this track, but also reveals the enormous untapped potential behind it.
Even more noteworthy are structural changes. In September, tokenized stocks’ share of trading volume on decentralized exchanges reached 11%, quickly narrowing the gap with memecoins’ 17% share. This indicates that on-chain capital is rotating structurally from speculative assets to real-world assets—tokenized U.S. stocks are becoming the new main storyline in the crypto market.
2. U.S. inflation cooling opens a window for risk assets
On the macro front, the U.S. August core PCE price index rose 3.0% year over year, below market expectations of 3.3%, hitting a new low since February. This data directly pushed Goldman Sachs to move its Federal Reserve rate-hike outlook from October to December, giving risk assets a valuable time window.
The softer inflation data significantly improved market sentiment. Bitcoin spot ETFs have recorded net inflows for multiple consecutive days, and traders are repricing the expected path of monetary policy ahead of year-end. For tokenized U.S. stocks, a more accommodative macro outlook suggests that more traditional capital may allocate to U.S. equities via on-chain channels, further boosting trading activity in tokenized stocks.
3. Institutional-grade infrastructure accelerates rollout
On the infrastructure side, several major developments are paving the way for tokenized U.S. stocks. OUSD stablecoin, issued by Bridge under Stripe and custodied by BlackRock and Bank of New York Mellon, was officially launched. It supports multi-chain deployment across Base, Ethereum, Solana, and more, and will connect to Coinbase on October 1. This infrastructure, backed by major players from traditional finance, provides an institutional-level foundation of trust for the settlement and circulation of tokenized assets.
Meanwhile, on September 30, the UK Financial Conduct Authority officially opened the application channel for crypto licenses. Firms will be required to obtain full licenses by October 25, 2027, or else they must stop providing regulated crypto services in the UK. Applicants must segregate customers’ crypto assets, meet a 40% capital requirement, and demonstrate operational and risk-control capabilities comparable to those of traditional financial institutions. As this regulatory framework takes effect, it will open a compliant pathway for tokenized U.S. stocks to enter the European market.
4. Plaza community enthusiasm keeps rising
According to community data from Binance Square, BNB leads the hottest token list with 3,801 mentions, followed by BTC with 3,687 mentions, and SOL with 2,046 mentions in third place. Notably, BTC’s bullish sentiment is clearly stronger than its bearish sentiment: the bullish-to-bearish ratio is 3 to 1, reflecting that the community remains optimistic about the outlook.
In terms of topic tags, Ethereum’s 70.9% gain in the third quarter and the U.S. 10-year Treasury yield nearing 5.3% are the two most discussed themes. They respectively represent bullish sentiment in the crypto market and interest-rate pressure in traditional financial markets. The parallel rise of these two topics mirrors the market’s central tension: crypto assets are accelerating upward amid institutionalization, while the traditional interest-rate environment still constrains overall risk appetite.
5. Outlook and risk warnings
A 390% growth in tokenized U.S. stocks is undoubtedly a milestone, but the 0.0029% penetration rate also reminds us that this track is still in a very early stage. With the rollout of institutional-grade stablecoins like OUSD, with regulatory frameworks in markets such as the UK becoming clearer step by step, and with further clarification of the Fed’s policy path, tokenized U.S. stocks are expected to continue expanding their influence in the crypto ecosystem into the fourth quarter of 2026.
However, investors also need to stay clear-headed. In September, the crypto industry suffered $768 million in hacker attacks, setting the highest single-month record of the year. The frequency of security incidents serves as a reminder that while pursuing innovation, the safety of assets and risk management cannot be overlooked.
#EtherGains70.9%InQ3 #US10YearYieldNears5.3% #TokenizedEquities
Tokenized U.S. stocks soar 390%: the convergence of Wall Street and the crypto world is accelerating
1. Tokenized stocks see explosive growth
In the third quarter of 2026, the global tokenized stock market delivered an impressive performance. Binance CEO Changpeng Zhao said in his latest public remarks that tokenized stocks surged 390% over the past year. Even so, tokenized stocks currently account for only 0.0029% of the total market capitalization of globally listed stocks, which stands at $1.519 trillion. The figure not only highlights the astonishing growth rate of this track, but also reveals the enormous untapped potential behind it.
Even more noteworthy are structural changes. In September, tokenized stocks’ share of trading volume on decentralized exchanges reached 11%, quickly narrowing the gap with memecoins’ 17% share. This indicates that on-chain capital is rotating structurally from speculative assets to real-world assets—tokenized U.S. stocks are becoming the new main storyline in the crypto market.
2. U.S. inflation cooling opens a window for risk assets
On the macro front, the U.S. August core PCE price index rose 3.0% year over year, below market expectations of 3.3%, hitting a new low since February. This data directly pushed Goldman Sachs to move its Federal Reserve rate-hike outlook from October to December, giving risk assets a valuable time window.
The softer inflation data significantly improved market sentiment. Bitcoin spot ETFs have recorded net inflows for multiple consecutive days, and traders are repricing the expected path of monetary policy ahead of year-end. For tokenized U.S. stocks, a more accommodative macro outlook suggests that more traditional capital may allocate to U.S. equities via on-chain channels, further boosting trading activity in tokenized stocks.
3. Institutional-grade infrastructure accelerates rollout
On the infrastructure side, several major developments are paving the way for tokenized U.S. stocks. OUSD stablecoin, issued by Bridge under Stripe and custodied by BlackRock and Bank of New York Mellon, was officially launched. It supports multi-chain deployment across Base, Ethereum, Solana, and more, and will connect to Coinbase on October 1. This infrastructure, backed by major players from traditional finance, provides an institutional-level foundation of trust for the settlement and circulation of tokenized assets.
Meanwhile, on September 30, the UK Financial Conduct Authority officially opened the application channel for crypto licenses. Firms will be required to obtain full licenses by October 25, 2027, or else they must stop providing regulated crypto services in the UK. Applicants must segregate customers’ crypto assets, meet a 40% capital requirement, and demonstrate operational and risk-control capabilities comparable to those of traditional financial institutions. As this regulatory framework takes effect, it will open a compliant pathway for tokenized U.S. stocks to enter the European market.
4. Plaza community enthusiasm keeps rising
According to community data from Binance Square, BNB leads the hottest token list with 3,801 mentions, followed by BTC with 3,687 mentions, and SOL with 2,046 mentions in third place. Notably, BTC’s bullish sentiment is clearly stronger than its bearish sentiment: the bullish-to-bearish ratio is 3 to 1, reflecting that the community remains optimistic about the outlook.
In terms of topic tags, Ethereum’s 70.9% gain in the third quarter and the U.S. 10-year Treasury yield nearing 5.3% are the two most discussed themes. They respectively represent bullish sentiment in the crypto market and interest-rate pressure in traditional financial markets. The parallel rise of these two topics mirrors the market’s central tension: crypto assets are accelerating upward amid institutionalization, while the traditional interest-rate environment still constrains overall risk appetite.
5. Outlook and risk warnings
A 390% growth in tokenized U.S. stocks is undoubtedly a milestone, but the 0.0029% penetration rate also reminds us that this track is still in a very early stage. With the rollout of institutional-grade stablecoins like OUSD, with regulatory frameworks in markets such as the UK becoming clearer step by step, and with further clarification of the Fed’s policy path, tokenized U.S. stocks are expected to continue expanding their influence in the crypto ecosystem into the fourth quarter of 2026.
However, investors also need to stay clear-headed. In September, the crypto industry suffered $768 million in hacker attacks, setting the highest single-month record of the year. The frequency of security incidents serves as a reminder that while pursuing innovation, the safety of assets and risk management cannot be overlooked.
#EtherGains70.9%InQ3 #US10YearYieldNears5.3% #TokenizedEquities
1. Tokenized stocks see explosive growth
In the third quarter of 2026, the global tokenized stock market delivered an impressive performance. Binance CEO Changpeng Zhao said in his latest public remarks that tokenized stocks surged 390% over the past year. Even so, tokenized stocks currently account for only 0.0029% of the total market capitalization of globally listed stocks, which stands at $1.519 trillion. The figure not only highlights the astonishing growth rate of this track, but also reveals the enormous untapped potential behind it.
Even more noteworthy are structural changes. In September, tokenized stocks’ share of trading volume on decentralized exchanges reached 11%, quickly narrowing the gap with memecoins’ 17% share. This indicates that on-chain capital is rotating structurally from speculative assets to real-world assets—tokenized U.S. stocks are becoming the new main storyline in the crypto market.
2. U.S. inflation cooling opens a window for risk assets
On the macro front, the U.S. August core PCE price index rose 3.0% year over year, below market expectations of 3.3%, hitting a new low since February. This data directly pushed Goldman Sachs to move its Federal Reserve rate-hike outlook from October to December, giving risk assets a valuable time window.
The softer inflation data significantly improved market sentiment. Bitcoin spot ETFs have recorded net inflows for multiple consecutive days, and traders are repricing the expected path of monetary policy ahead of year-end. For tokenized U.S. stocks, a more accommodative macro outlook suggests that more traditional capital may allocate to U.S. equities via on-chain channels, further boosting trading activity in tokenized stocks.
3. Institutional-grade infrastructure accelerates rollout
On the infrastructure side, several major developments are paving the way for tokenized U.S. stocks. OUSD stablecoin, issued by Bridge under Stripe and custodied by BlackRock and Bank of New York Mellon, was officially launched. It supports multi-chain deployment across Base, Ethereum, Solana, and more, and will connect to Coinbase on October 1. This infrastructure, backed by major players from traditional finance, provides an institutional-level foundation of trust for the settlement and circulation of tokenized assets.
Meanwhile, on September 30, the UK Financial Conduct Authority officially opened the application channel for crypto licenses. Firms will be required to obtain full licenses by October 25, 2027, or else they must stop providing regulated crypto services in the UK. Applicants must segregate customers’ crypto assets, meet a 40% capital requirement, and demonstrate operational and risk-control capabilities comparable to those of traditional financial institutions. As this regulatory framework takes effect, it will open a compliant pathway for tokenized U.S. stocks to enter the European market.
4. Plaza community enthusiasm keeps rising
According to community data from Binance Square, BNB leads the hottest token list with 3,801 mentions, followed by BTC with 3,687 mentions, and SOL with 2,046 mentions in third place. Notably, BTC’s bullish sentiment is clearly stronger than its bearish sentiment: the bullish-to-bearish ratio is 3 to 1, reflecting that the community remains optimistic about the outlook.
In terms of topic tags, Ethereum’s 70.9% gain in the third quarter and the U.S. 10-year Treasury yield nearing 5.3% are the two most discussed themes. They respectively represent bullish sentiment in the crypto market and interest-rate pressure in traditional financial markets. The parallel rise of these two topics mirrors the market’s central tension: crypto assets are accelerating upward amid institutionalization, while the traditional interest-rate environment still constrains overall risk appetite.
5. Outlook and risk warnings
A 390% growth in tokenized U.S. stocks is undoubtedly a milestone, but the 0.0029% penetration rate also reminds us that this track is still in a very early stage. With the rollout of institutional-grade stablecoins like OUSD, with regulatory frameworks in markets such as the UK becoming clearer step by step, and with further clarification of the Fed’s policy path, tokenized U.S. stocks are expected to continue expanding their influence in the crypto ecosystem into the fourth quarter of 2026.
However, investors also need to stay clear-headed. In September, the crypto industry suffered $768 million in hacker attacks, setting the highest single-month record of the year. The frequency of security incidents serves as a reminder that while pursuing innovation, the safety of assets and risk management cannot be overlooked.
#EtherGains70.9%InQ3 #US10YearYieldNears5.3% #TokenizedEquities
218
·
--
Everyone thinks a dip in $NEAR is just a cheap entry you should jump on, but actually it can be the start of a longer slide if the setup isn't right.
Too many traders load up on what looks like a bargain only to watch it keep falling, locking in that sinking feeling of capital stuck in red while the rest of the market sits in greed. It is the classic trap of buying hope instead of waiting for real support.
Picture the market like a rubber band stretched tight after a run. When $BTC holds but alts start giving back gains, $NEAR often snaps back harder because liquidity thins out first on the smaller names. A drop to around recent levels is not automatically a fire sale. Check the volume on those bounce attempts. If it stays quiet, that is your cue the move is not done yet. Treat it like planting seeds in a storm instead of waiting for the clouds to pass. The same rotation can pull in names like $AAVE when DeFi sentiment cools, so having your levels mapped out ahead of time keeps you from guessing under pressure.
Where do you think $NEAR heads from these levels?
#NEARFallsToAround #SECProposesCryptoCustodyFramework #EtherGains70
Everyone thinks a dip in $NEAR is just a cheap entry you should jump on, but actually it can be the start of a longer slide if the setup isn't right.
Too many traders load up on what looks like a bargain only to watch it keep falling, locking in that sinking feeling of capital stuck in red while the rest of the market sits in greed. It is the classic trap of buying hope instead of waiting for real support.
Picture the market like a rubber band stretched tight after a run. When $BTC holds but alts start giving back gains, $NEAR often snaps back harder because liquidity thins out first on the smaller names. A drop to around recent levels is not automatically a fire sale. Check the volume on those bounce attempts. If it stays quiet, that is your cue the move is not done yet. Treat it like planting seeds in a storm instead of waiting for the clouds to pass. The same rotation can pull in names like $AAVE when DeFi sentiment cools, so having your levels mapped out ahead of time keeps you from guessing under pressure.
Where do you think $NEAR heads from these levels?
#NEARFallsToAround #SECProposesCryptoCustodyFramework #EtherGains70
Too many traders load up on what looks like a bargain only to watch it keep falling, locking in that sinking feeling of capital stuck in red while the rest of the market sits in greed. It is the classic trap of buying hope instead of waiting for real support.
Picture the market like a rubber band stretched tight after a run. When $BTC holds but alts start giving back gains, $NEAR often snaps back harder because liquidity thins out first on the smaller names. A drop to around recent levels is not automatically a fire sale. Check the volume on those bounce attempts. If it stays quiet, that is your cue the move is not done yet. Treat it like planting seeds in a storm instead of waiting for the clouds to pass. The same rotation can pull in names like $AAVE when DeFi sentiment cools, so having your levels mapped out ahead of time keeps you from guessing under pressure.
Where do you think $NEAR heads from these levels?
#NEARFallsToAround #SECProposesCryptoCustodyFramework #EtherGains70

27
·
--
If you're still skipping Ethereum infrastructure news because it doesn't come with a new ticker, stop now.
That habit is how traders miss the cheap part of the cycle and then overpay once the narrative finally shows up. I've done it, you've done it. We all pretended a GitHub commit wasn't a catalyst until the chart disagreed.
The Ethereum Foundation just put zkAPI live on mainnet. Devs can call zero-knowledge proofs like a normal API instead of assembling a cryptography team. We've seen this exact shrug before. First zk rollup launches were treated like academic side projects, then they ate the entire L2 conversation. $MINA has been the ZK specialist for years and still gets sidelined while Ethereum just absorbs the idea into the base layer. That's the L1 playbook. Copy the homework, own the classroom.
Greed index sitting at 70, search bar stuffed with $USDT and whatever pumped overnight. Meanwhile Ether already ran hard and an API launch is the last thing anyone wants to discuss. Which is usually when it actually matters.
Does this change how you think about $ETH versus the dedicated ZK names, or does price just ignore it until it doesn't?
#EthereumFoundationLaunchesZkAPIOnMainnet #EtherGains70
If you're still skipping Ethereum infrastructure news because it doesn't come with a new ticker, stop now.
That habit is how traders miss the cheap part of the cycle and then overpay once the narrative finally shows up. I've done it, you've done it. We all pretended a GitHub commit wasn't a catalyst until the chart disagreed.
The Ethereum Foundation just put zkAPI live on mainnet. Devs can call zero-knowledge proofs like a normal API instead of assembling a cryptography team. We've seen this exact shrug before. First zk rollup launches were treated like academic side projects, then they ate the entire L2 conversation. $MINA has been the ZK specialist for years and still gets sidelined while Ethereum just absorbs the idea into the base layer. That's the L1 playbook. Copy the homework, own the classroom.
Greed index sitting at 70, search bar stuffed with $USDT and whatever pumped overnight. Meanwhile Ether already ran hard and an API launch is the last thing anyone wants to discuss. Which is usually when it actually matters.
Does this change how you think about $ETH versus the dedicated ZK names, or does price just ignore it until it doesn't?
#EthereumFoundationLaunchesZkAPIOnMainnet #EtherGains70
That habit is how traders miss the cheap part of the cycle and then overpay once the narrative finally shows up. I've done it, you've done it. We all pretended a GitHub commit wasn't a catalyst until the chart disagreed.
The Ethereum Foundation just put zkAPI live on mainnet. Devs can call zero-knowledge proofs like a normal API instead of assembling a cryptography team. We've seen this exact shrug before. First zk rollup launches were treated like academic side projects, then they ate the entire L2 conversation. $MINA has been the ZK specialist for years and still gets sidelined while Ethereum just absorbs the idea into the base layer. That's the L1 playbook. Copy the homework, own the classroom.
Greed index sitting at 70, search bar stuffed with $USDT and whatever pumped overnight. Meanwhile Ether already ran hard and an API launch is the last thing anyone wants to discuss. Which is usually when it actually matters.
Does this change how you think about $ETH versus the dedicated ZK names, or does price just ignore it until it doesn't?
#EthereumFoundationLaunchesZkAPIOnMainnet #EtherGains70

123

·
--
$ZRO ZRO is showing bullish movement: 12.80% (Crypto).
Volume: 25.08M | Last: $1.84
Key signals: strong momentum, high volatility, high trader activity.
Bias Daily: BULLISH 🟢 | Weekly: BULLISH 🟢
ZRO rose 13.5% in 24h propelled by ATLAS buyback plans and token migration, despite impending unlock risks.
**Infrastructure & Buyback Catalysts (High)**: ATLAS protocol progress allocating 75% of net trading fees to ZRO buybacks and burns → reinforces long-term supply contraction narratives.
- **Token Reissue Consolidation (High)**: Major exchange integration for STG to ZRO conversion at 1:0.08634 → channels cross-chain ecosystem liquidity directly into ZRO.
- **Bullish Trend Breakout (Medium)**: Price crossed above EMA 7/25/99 with MACD maintaining positive territory → technical momentum supported run to $1.907 high.
#ZRO #ethergains70.9%inq3 #altcoins #nfpwatch #Crypto
$ZRO ZRO is showing bullish movement: 12.80% (Crypto).
Volume: 25.08M | Last: $1.84
Key signals: strong momentum, high volatility, high trader activity.
Bias Daily: BULLISH 🟢 | Weekly: BULLISH 🟢
ZRO rose 13.5% in 24h propelled by ATLAS buyback plans and token migration, despite impending unlock risks.
**Infrastructure & Buyback Catalysts (High)**: ATLAS protocol progress allocating 75% of net trading fees to ZRO buybacks and burns → reinforces long-term supply contraction narratives.
- **Token Reissue Consolidation (High)**: Major exchange integration for STG to ZRO conversion at 1:0.08634 → channels cross-chain ecosystem liquidity directly into ZRO.
- **Bullish Trend Breakout (Medium)**: Price crossed above EMA 7/25/99 with MACD maintaining positive territory → technical momentum supported run to $1.907 high.
#ZRO #ethergains70.9%inq3 #altcoins #nfpwatch #Crypto
Volume: 25.08M | Last: $1.84
Key signals: strong momentum, high volatility, high trader activity.
Bias Daily: BULLISH 🟢 | Weekly: BULLISH 🟢
ZRO rose 13.5% in 24h propelled by ATLAS buyback plans and token migration, despite impending unlock risks.
**Infrastructure & Buyback Catalysts (High)**: ATLAS protocol progress allocating 75% of net trading fees to ZRO buybacks and burns → reinforces long-term supply contraction narratives.
- **Token Reissue Consolidation (High)**: Major exchange integration for STG to ZRO conversion at 1:0.08634 → channels cross-chain ecosystem liquidity directly into ZRO.
- **Bullish Trend Breakout (Medium)**: Price crossed above EMA 7/25/99 with MACD maintaining positive territory → technical momentum supported run to $1.907 high.
#ZRO #ethergains70.9%inq3 #altcoins #nfpwatch #Crypto
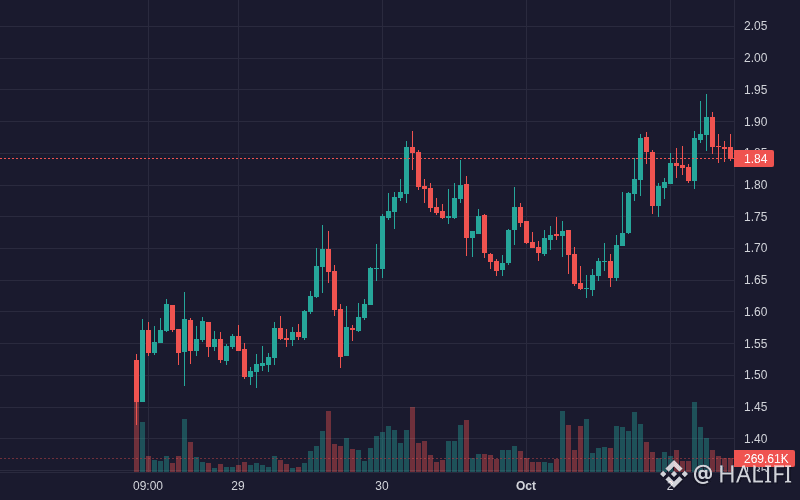
1
8
·
--
$TIA TIA is showing bullish movement: 7.51% (Crypto).
Volume: 9.13M | Last: $0.469600
Key signals: strong momentum, high volatility, high trader activity.
Bias Daily: BULLISH 🟢 | Weekly: BULLISH 🟢
TIA gained 5.9% in 24h following record Fibre throughput test results and sudden institutional buy volume.
**Fibre benchmark breakthrough (High)**: Celestia reported reaching 3.07 Tb/s throughput and nearly 2B TPS in Fibre testing → catalysed strong bullish sentiment
- **Whale spot accumulation (High)**: Large orders generated +$549.7K net inflow within an hour → drove an aggressive breakout above $0.46
- **Technical momentum expansion (Medium)**: MACD executed a bullish crossover alongside 6-hour RSI rising past 80 → triggered rapid short covering and momentum buying
#TIA #ethergains70.9%inq3 #altcoins #nfpwatch #Crypto
$TIA TIA is showing bullish movement: 7.51% (Crypto).
Volume: 9.13M | Last: $0.469600
Key signals: strong momentum, high volatility, high trader activity.
Bias Daily: BULLISH 🟢 | Weekly: BULLISH 🟢
TIA gained 5.9% in 24h following record Fibre throughput test results and sudden institutional buy volume.
**Fibre benchmark breakthrough (High)**: Celestia reported reaching 3.07 Tb/s throughput and nearly 2B TPS in Fibre testing → catalysed strong bullish sentiment
- **Whale spot accumulation (High)**: Large orders generated +$549.7K net inflow within an hour → drove an aggressive breakout above $0.46
- **Technical momentum expansion (Medium)**: MACD executed a bullish crossover alongside 6-hour RSI rising past 80 → triggered rapid short covering and momentum buying
#TIA #ethergains70.9%inq3 #altcoins #nfpwatch #Crypto
Volume: 9.13M | Last: $0.469600
Key signals: strong momentum, high volatility, high trader activity.
Bias Daily: BULLISH 🟢 | Weekly: BULLISH 🟢
TIA gained 5.9% in 24h following record Fibre throughput test results and sudden institutional buy volume.
**Fibre benchmark breakthrough (High)**: Celestia reported reaching 3.07 Tb/s throughput and nearly 2B TPS in Fibre testing → catalysed strong bullish sentiment
- **Whale spot accumulation (High)**: Large orders generated +$549.7K net inflow within an hour → drove an aggressive breakout above $0.46
- **Technical momentum expansion (Medium)**: MACD executed a bullish crossover alongside 6-hour RSI rising past 80 → triggered rapid short covering and momentum buying
#TIA #ethergains70.9%inq3 #altcoins #nfpwatch #Crypto
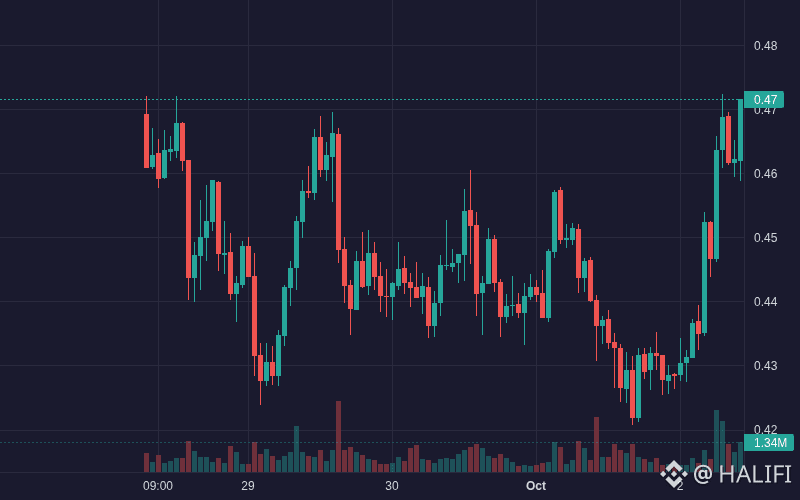
1
14
·
--
$MANA MANA is showing bullish movement: 18.81% (Crypto).
Volume: 8.18M | Last: $0.105500
Key signals: strong momentum, high volatility, high trader activity.
Bias Daily: BULLISH 🟢 | Weekly: BULLISH 🟢
MANA surged 15.2% over 24 hours to $0.1022 on heavy volume, though overbought RSI signals near-term pullback risks.
**Volume breakout & capital influx (High)**: Hourly turnover expanded from ~$106K to over $8.69M with +$875K net inflow → propelled price from $0.0903 to $0.1022
- **Technical indicator expansion (Medium)**: MACD histogram expanded to +0.00148 alongside moving average alignment (EMA 7 > EMA 25 > EMA 99) → confirmed short-term bullish trend continuation
- **Sector rotation & regulatory sentiment (Medium)**: Proposed SEC custody framework and metaverse sector rotation renewed interest across gaming tokens
#MANA #ethergains70.9%inq3 #altcoins #nfpwatch #Crypto
$MANA MANA is showing bullish movement: 18.81% (Crypto).
Volume: 8.18M | Last: $0.105500
Key signals: strong momentum, high volatility, high trader activity.
Bias Daily: BULLISH 🟢 | Weekly: BULLISH 🟢
MANA surged 15.2% over 24 hours to $0.1022 on heavy volume, though overbought RSI signals near-term pullback risks.
**Volume breakout & capital influx (High)**: Hourly turnover expanded from ~$106K to over $8.69M with +$875K net inflow → propelled price from $0.0903 to $0.1022
- **Technical indicator expansion (Medium)**: MACD histogram expanded to +0.00148 alongside moving average alignment (EMA 7 > EMA 25 > EMA 99) → confirmed short-term bullish trend continuation
- **Sector rotation & regulatory sentiment (Medium)**: Proposed SEC custody framework and metaverse sector rotation renewed interest across gaming tokens
#MANA #ethergains70.9%inq3 #altcoins #nfpwatch #Crypto
Volume: 8.18M | Last: $0.105500
Key signals: strong momentum, high volatility, high trader activity.
Bias Daily: BULLISH 🟢 | Weekly: BULLISH 🟢
MANA surged 15.2% over 24 hours to $0.1022 on heavy volume, though overbought RSI signals near-term pullback risks.
**Volume breakout & capital influx (High)**: Hourly turnover expanded from ~$106K to over $8.69M with +$875K net inflow → propelled price from $0.0903 to $0.1022
- **Technical indicator expansion (Medium)**: MACD histogram expanded to +0.00148 alongside moving average alignment (EMA 7 > EMA 25 > EMA 99) → confirmed short-term bullish trend continuation
- **Sector rotation & regulatory sentiment (Medium)**: Proposed SEC custody framework and metaverse sector rotation renewed interest across gaming tokens
#MANA #ethergains70.9%inq3 #altcoins #nfpwatch #Crypto
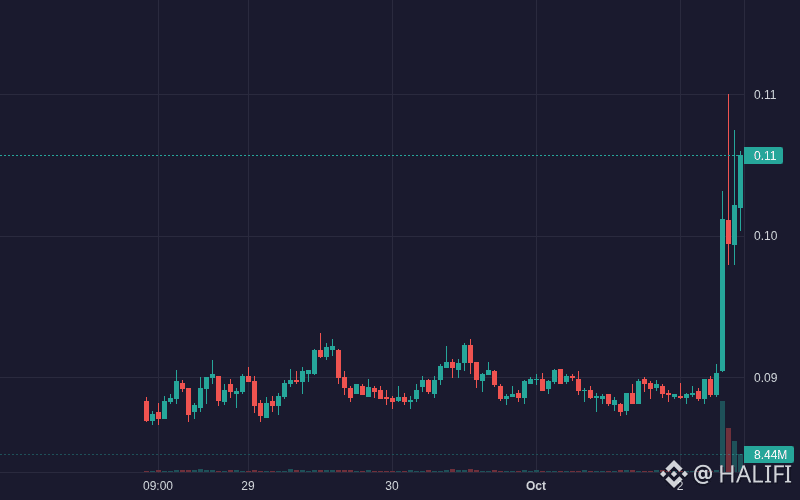
1
23
·
--
$ENJ ENJ is showing bullish movement: 10.23% (Crypto).
Volume: 3.81M | Last: $0.032230
Key signals: strong momentum, high volatility, high trader activity.
Bias Daily: BULLISH 🟢 | Weekly: BULLISH 🟢
ENJ rallied 12.1% over 24h behind a massive surge in speculative trading volume and rotation inflows.
**Volume breakout & speculative rotation (High)**: Legacy gaming sector rotation ignited explosive trading volume, surging past $3.6M per hour → price spiked from $0.0291 to $0.0326
- **Aggressive net inflows (High)**: Spot buying accelerated late in the session, logging +$107K in hourly net total inflows alongside +$55.5K in large-order accumulation
- **Technical momentum expansion (Medium)**: Price pierced the upper Bollinger Band as hourly RSI pushed past 93, confirming intense upward momentum
#ENJ #ethergains70.9%inq3 #altcoins #nfpwatch #Crypto
$ENJ ENJ is showing bullish movement: 10.23% (Crypto).
Volume: 3.81M | Last: $0.032230
Key signals: strong momentum, high volatility, high trader activity.
Bias Daily: BULLISH 🟢 | Weekly: BULLISH 🟢
ENJ rallied 12.1% over 24h behind a massive surge in speculative trading volume and rotation inflows.
**Volume breakout & speculative rotation (High)**: Legacy gaming sector rotation ignited explosive trading volume, surging past $3.6M per hour → price spiked from $0.0291 to $0.0326
- **Aggressive net inflows (High)**: Spot buying accelerated late in the session, logging +$107K in hourly net total inflows alongside +$55.5K in large-order accumulation
- **Technical momentum expansion (Medium)**: Price pierced the upper Bollinger Band as hourly RSI pushed past 93, confirming intense upward momentum
#ENJ #ethergains70.9%inq3 #altcoins #nfpwatch #Crypto
Volume: 3.81M | Last: $0.032230
Key signals: strong momentum, high volatility, high trader activity.
Bias Daily: BULLISH 🟢 | Weekly: BULLISH 🟢
ENJ rallied 12.1% over 24h behind a massive surge in speculative trading volume and rotation inflows.
**Volume breakout & speculative rotation (High)**: Legacy gaming sector rotation ignited explosive trading volume, surging past $3.6M per hour → price spiked from $0.0291 to $0.0326
- **Aggressive net inflows (High)**: Spot buying accelerated late in the session, logging +$107K in hourly net total inflows alongside +$55.5K in large-order accumulation
- **Technical momentum expansion (Medium)**: Price pierced the upper Bollinger Band as hourly RSI pushed past 93, confirming intense upward momentum
#ENJ #ethergains70.9%inq3 #altcoins #nfpwatch #Crypto
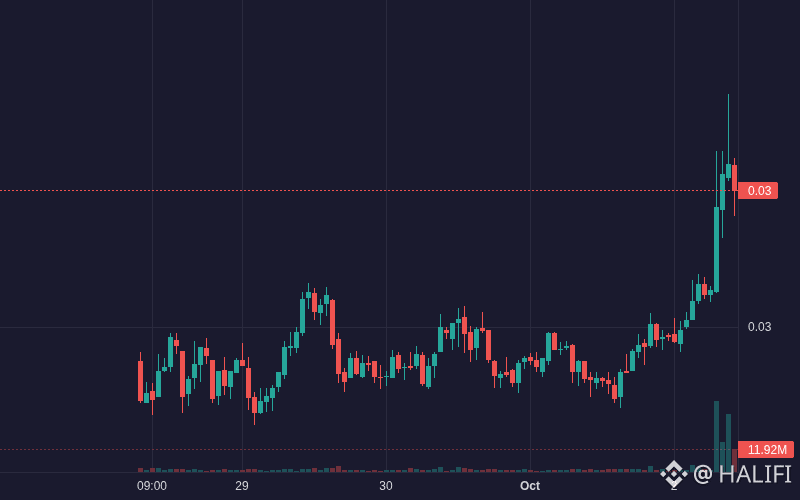
1
17
·
--
$MSTRB MSTRB is showing bullish movement: 6.79% (Crypto).
Volume: 16.28M | Last: $165.51
Key signals: strong momentum, high volatility, high trader activity.
Bias Daily: BULLISH 🟢 | Weekly: BULLISH 🟢
MSTRB gained 6.9% over the past 24 hours to $165.36, driven by corporate treasury Bitcoin acquisitions and share repurchases.
**Treasury expansion (High)**: Strategy purchased 1,665 additional BTC for $142.7M → total holdings reached 847,666 BTC, boosting token asset backing.
- **Capital structuring (Medium)**: $1.28B deployed from the repurchase facility alongside Strive's $50M preferred stock purchase → strengthened secondary market liquidity.
- **Technical breakout (Low)**: MACD histogram turned positive and price crossed the upper Bollinger Band → accelerating momentum toward a $166.07 peak.
#MSTRB #ethergains70.9%inq3 #altcoins #nfpwatch #Crypto
$MSTRB MSTRB is showing bullish movement: 6.79% (Crypto).
Volume: 16.28M | Last: $165.51
Key signals: strong momentum, high volatility, high trader activity.
Bias Daily: BULLISH 🟢 | Weekly: BULLISH 🟢
MSTRB gained 6.9% over the past 24 hours to $165.36, driven by corporate treasury Bitcoin acquisitions and share repurchases.
**Treasury expansion (High)**: Strategy purchased 1,665 additional BTC for $142.7M → total holdings reached 847,666 BTC, boosting token asset backing.
- **Capital structuring (Medium)**: $1.28B deployed from the repurchase facility alongside Strive's $50M preferred stock purchase → strengthened secondary market liquidity.
- **Technical breakout (Low)**: MACD histogram turned positive and price crossed the upper Bollinger Band → accelerating momentum toward a $166.07 peak.
#MSTRB #ethergains70.9%inq3 #altcoins #nfpwatch #Crypto
Volume: 16.28M | Last: $165.51
Key signals: strong momentum, high volatility, high trader activity.
Bias Daily: BULLISH 🟢 | Weekly: BULLISH 🟢
MSTRB gained 6.9% over the past 24 hours to $165.36, driven by corporate treasury Bitcoin acquisitions and share repurchases.
**Treasury expansion (High)**: Strategy purchased 1,665 additional BTC for $142.7M → total holdings reached 847,666 BTC, boosting token asset backing.
- **Capital structuring (Medium)**: $1.28B deployed from the repurchase facility alongside Strive's $50M preferred stock purchase → strengthened secondary market liquidity.
- **Technical breakout (Low)**: MACD histogram turned positive and price crossed the upper Bollinger Band → accelerating momentum toward a $166.07 peak.
#MSTRB #ethergains70.9%inq3 #altcoins #nfpwatch #Crypto
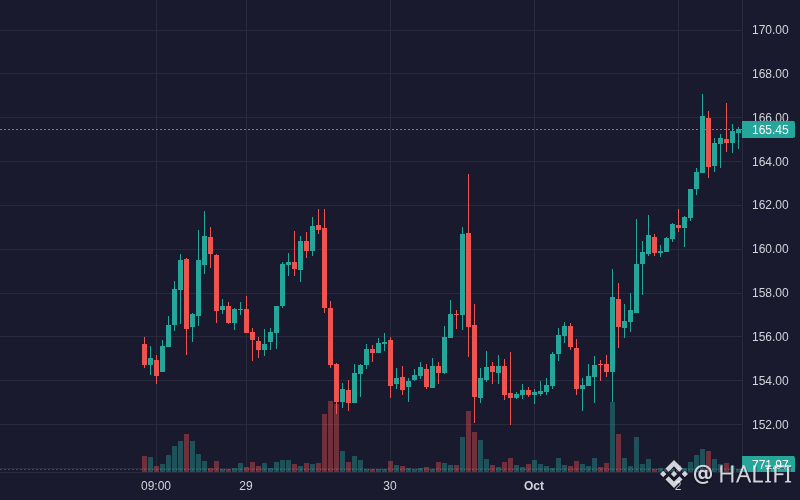
12
Log in to explore more content
Join global crypto users on Binance Square
⚡️ Get latest and useful information about crypto.
💬 Trusted by the world’s largest crypto exchange.
👍 Discover real insights from verified creators.
Email / Phone number
Trending Topics
1
#NFPWatch
10.7M views
18,543 Discussing
2
#BitcoinFundingRateTriplesTo10%
61,189 views
696 Discussing
3
#BitcoinSurpasses$86KUp2.99%
17,650 views
72 Discussing
4
#ZcashFalls21%FromSeptemberPeak
41,648 views
553 Discussing
5
#USSeptemberPayrollsAdd29KUnemploymentRises4.2%
33,619 views
331 Discussing
6
#XRPPostsFirstThreeGreenMonthsInQ3
30,619 views
518 Discussing
7
#BNBChainTokenizedStocksTop$1BAt30%Share
8,617 views
28 Discussing
8
#BitcoinRisesToward$85K
77,727 views
137 Discussing
9
#AmazonPlansToSell$8BNvidiaChips
6,757 views
83 Discussing
10
#NEARFallsToAround$4.70Down14%
44,090 views
108 Discussing