
#criptoanalisis
criptoanalisis
102,094 views
256 Discussing
Hot
Latest

·
--
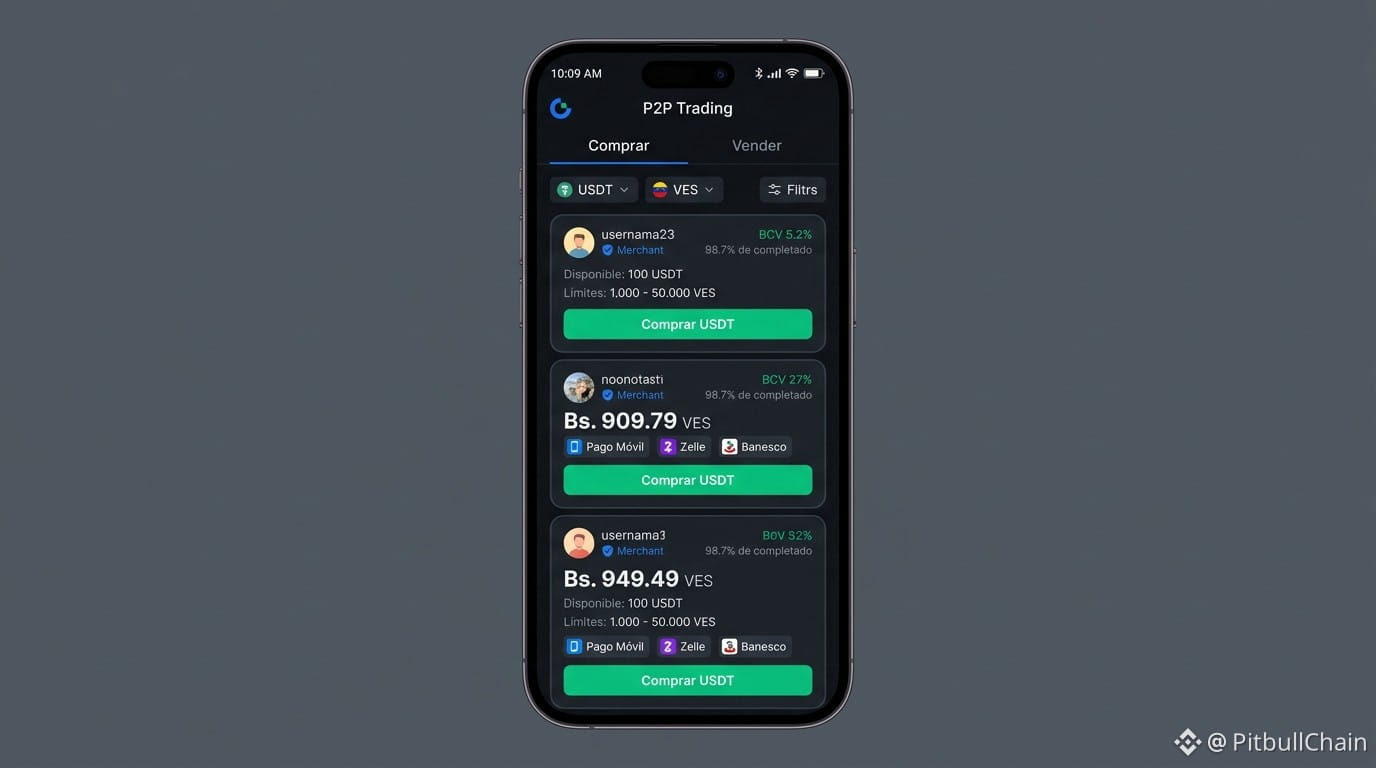
Did they tell you the gap would drop to 12%? The numbers on screen show a different dynamic.
Today, USDT for buying is around Bs. 949.49 versus a BCV price of Bs. 785.07, maintaining a real premium of 20.94%. With 223 active orders and a spread of Bs. 24.09 (2.60%), the P2P market on Binance continues to show high turnover and operational strength.
When you move capital today, don’t rely on theoretical averages: analyze the order book depth, trade with verified users, and calculate your real cost per order.
📊 Live rates and analysis at pitbullchain.com
#BinanceP2P #VenezuelaCrypto #USDT #CriptoAnalisis
Did they tell you the gap would drop to 12%? The numbers on screen show a different dynamic.
Today, USDT for buying is around Bs. 949.49 versus a BCV price of Bs. 785.07, maintaining a real premium of 20.94%. With 223 active orders and a spread of Bs. 24.09 (2.60%), the P2P market on Binance continues to show high turnover and operational strength.
When you move capital today, don’t rely on theoretical averages: analyze the order book depth, trade with verified users, and calculate your real cost per order.
📊 Live rates and analysis at pitbullchain.com
#BinanceP2P #VenezuelaCrypto #USDT #CriptoAnalisis
Today, USDT for buying is around Bs. 949.49 versus a BCV price of Bs. 785.07, maintaining a real premium of 20.94%. With 223 active orders and a spread of Bs. 24.09 (2.60%), the P2P market on Binance continues to show high turnover and operational strength.
When you move capital today, don’t rely on theoretical averages: analyze the order book depth, trade with verified users, and calculate your real cost per order.
📊 Live rates and analysis at pitbullchain.com
#BinanceP2P #VenezuelaCrypto #USDT #CriptoAnalisis
50

Article
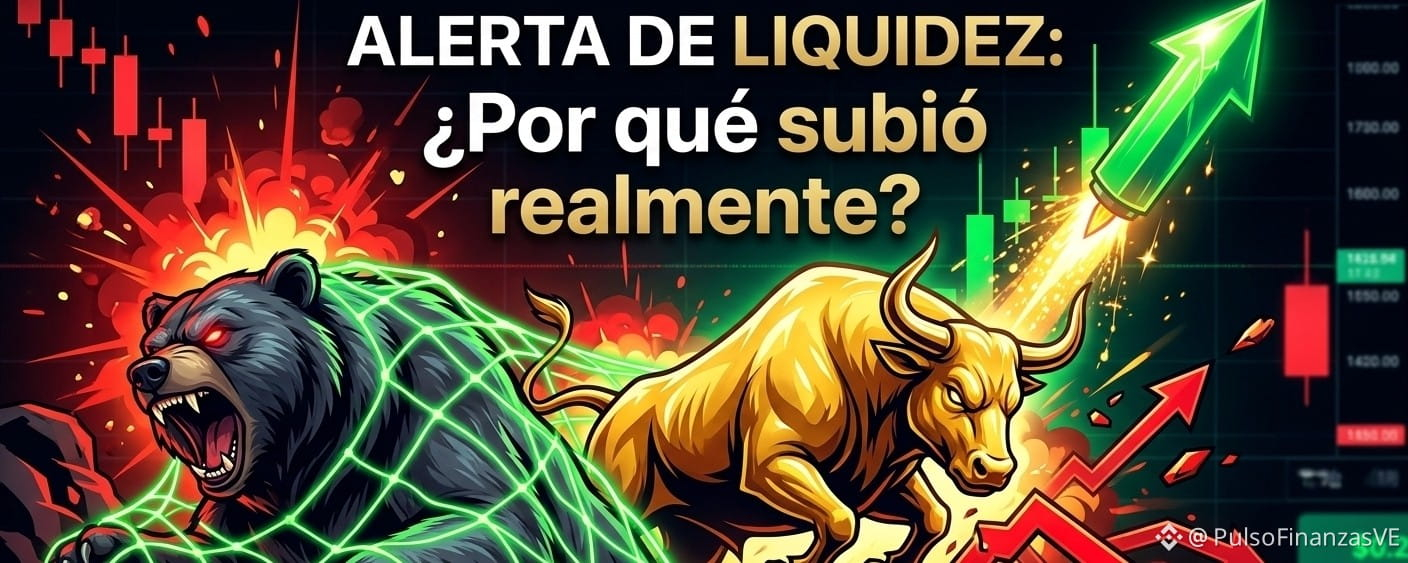
LIQUIDITY ALERT: The Truth Behind the Pump and How to Avoid Being the “Exit Liquidity”Hey, community and Binance Square degens! If you’re reading this while watching Bitcoin flirt with $80,000+, you’re definitely in one of two camps: either celebrating your longs or wondering why you got liquidated on that short at $64k.
I’m not here to sell you hype or 5-minute charts. Let’s break down mathematically why the market went up, where the smart money is on-chain, and why the current FOMO is the perfect trap if you’re not careful.
1. The Anatomy of a Brutal Short Squeeze
LIQUIDITY ALERT: The Truth Behind the Pump and How to Avoid Being the “Exit Liquidity”
Hey, community and Binance Square degens! If you’re reading this while watching Bitcoin flirt with $80,000+, you’re definitely in one of two camps: either celebrating your longs or wondering why you got liquidated on that short at $64k.
I’m not here to sell you hype or 5-minute charts. Let’s break down mathematically why the market went up, where the smart money is on-chain, and why the current FOMO is the perfect trap if you’re not careful.
1. The Anatomy of a Brutal Short Squeeze
I’m not here to sell you hype or 5-minute charts. Let’s break down mathematically why the market went up, where the smart money is on-chain, and why the current FOMO is the perfect trap if you’re not careful.
1. The Anatomy of a Brutal Short Squeeze
113

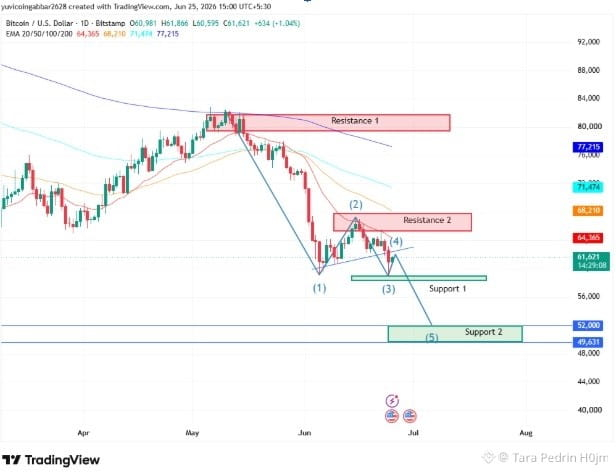
Strategy Analysis: Data on BTC/USDT volatility this week.
*The current market demands more than intuition; it requires a clear read of technical indicators.
*As part of the approach, this week we have been monitoring the BTC/USDT pair, applying analysis techniques that prioritize data management over emotional speculation.
Just like in optimizing trading strategies, success here lies in consistency: identifying patterns, adjusting the "dashboard" of our decisions, and maintaining a long-term perspective.
What patterns are you seeing in your current positions?
Comment below so we can analyze the metrics together.
Recommended hashtags: #BinanceSquare #Trading #Datos #JGSelecto #CriptoAnalisis
Strategy Analysis: Data on BTC/USDT volatility this week.
*The current market demands more than intuition; it requires a clear read of technical indicators.
*As part of the approach, this week we have been monitoring the BTC/USDT pair, applying analysis techniques that prioritize data management over emotional speculation.
Just like in optimizing trading strategies, success here lies in consistency: identifying patterns, adjusting the "dashboard" of our decisions, and maintaining a long-term perspective.
What patterns are you seeing in your current positions?
Comment below so we can analyze the metrics together.
Recommended hashtags: #BinanceSquare #Trading #Datos #JGSelecto #CriptoAnalisis
*The current market demands more than intuition; it requires a clear read of technical indicators.
*As part of the approach, this week we have been monitoring the BTC/USDT pair, applying analysis techniques that prioritize data management over emotional speculation.
Just like in optimizing trading strategies, success here lies in consistency: identifying patterns, adjusting the "dashboard" of our decisions, and maintaining a long-term perspective.
What patterns are you seeing in your current positions?
Comment below so we can analyze the metrics together.
Recommended hashtags: #BinanceSquare #Trading #Datos #JGSelecto #CriptoAnalisis
98
$ARIA HAVE YOU SEEN THE LIQUIDITY MAP?
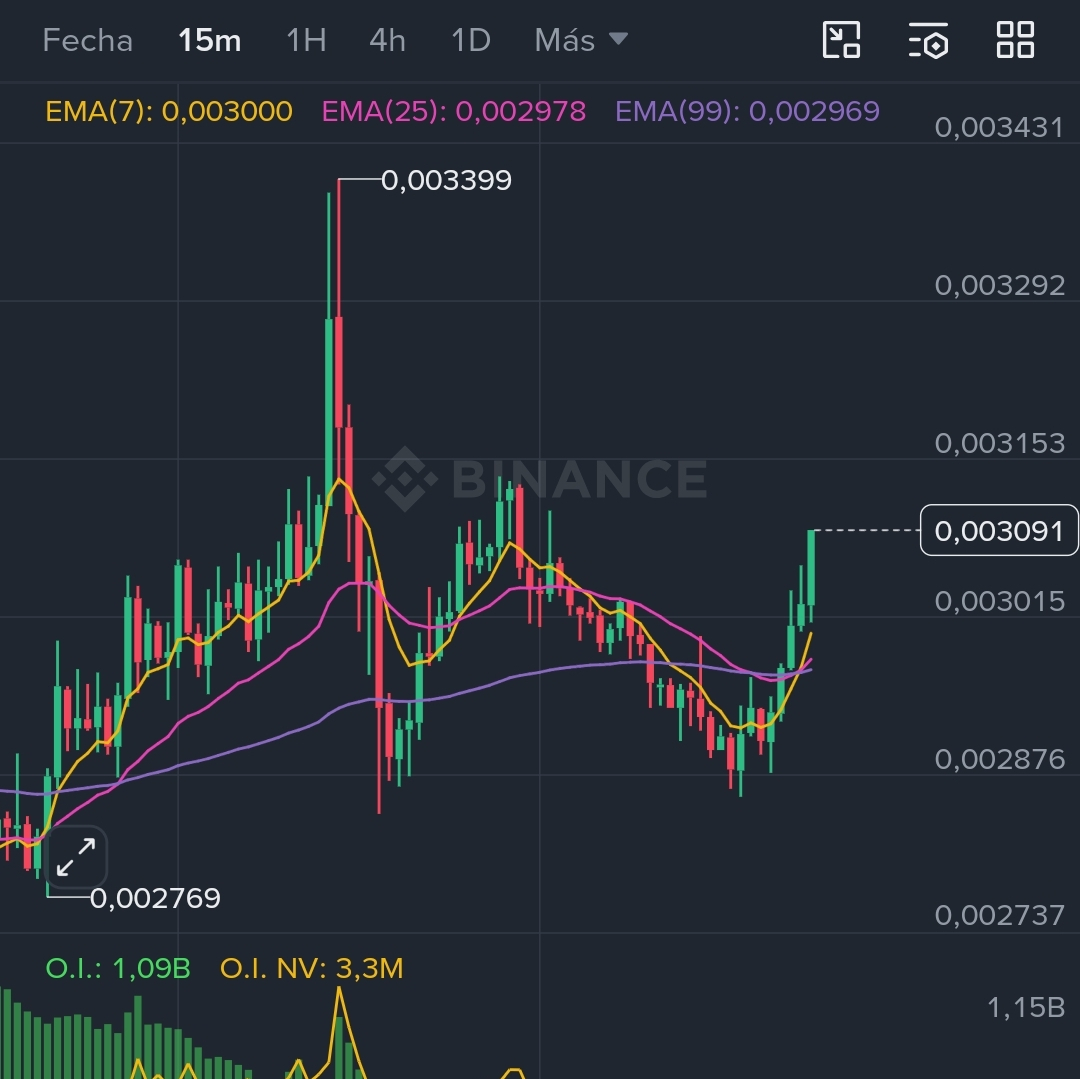
🚨 LIQUIDITY ANALYSIS: $ARIA (ARIAUSDT) 🚨
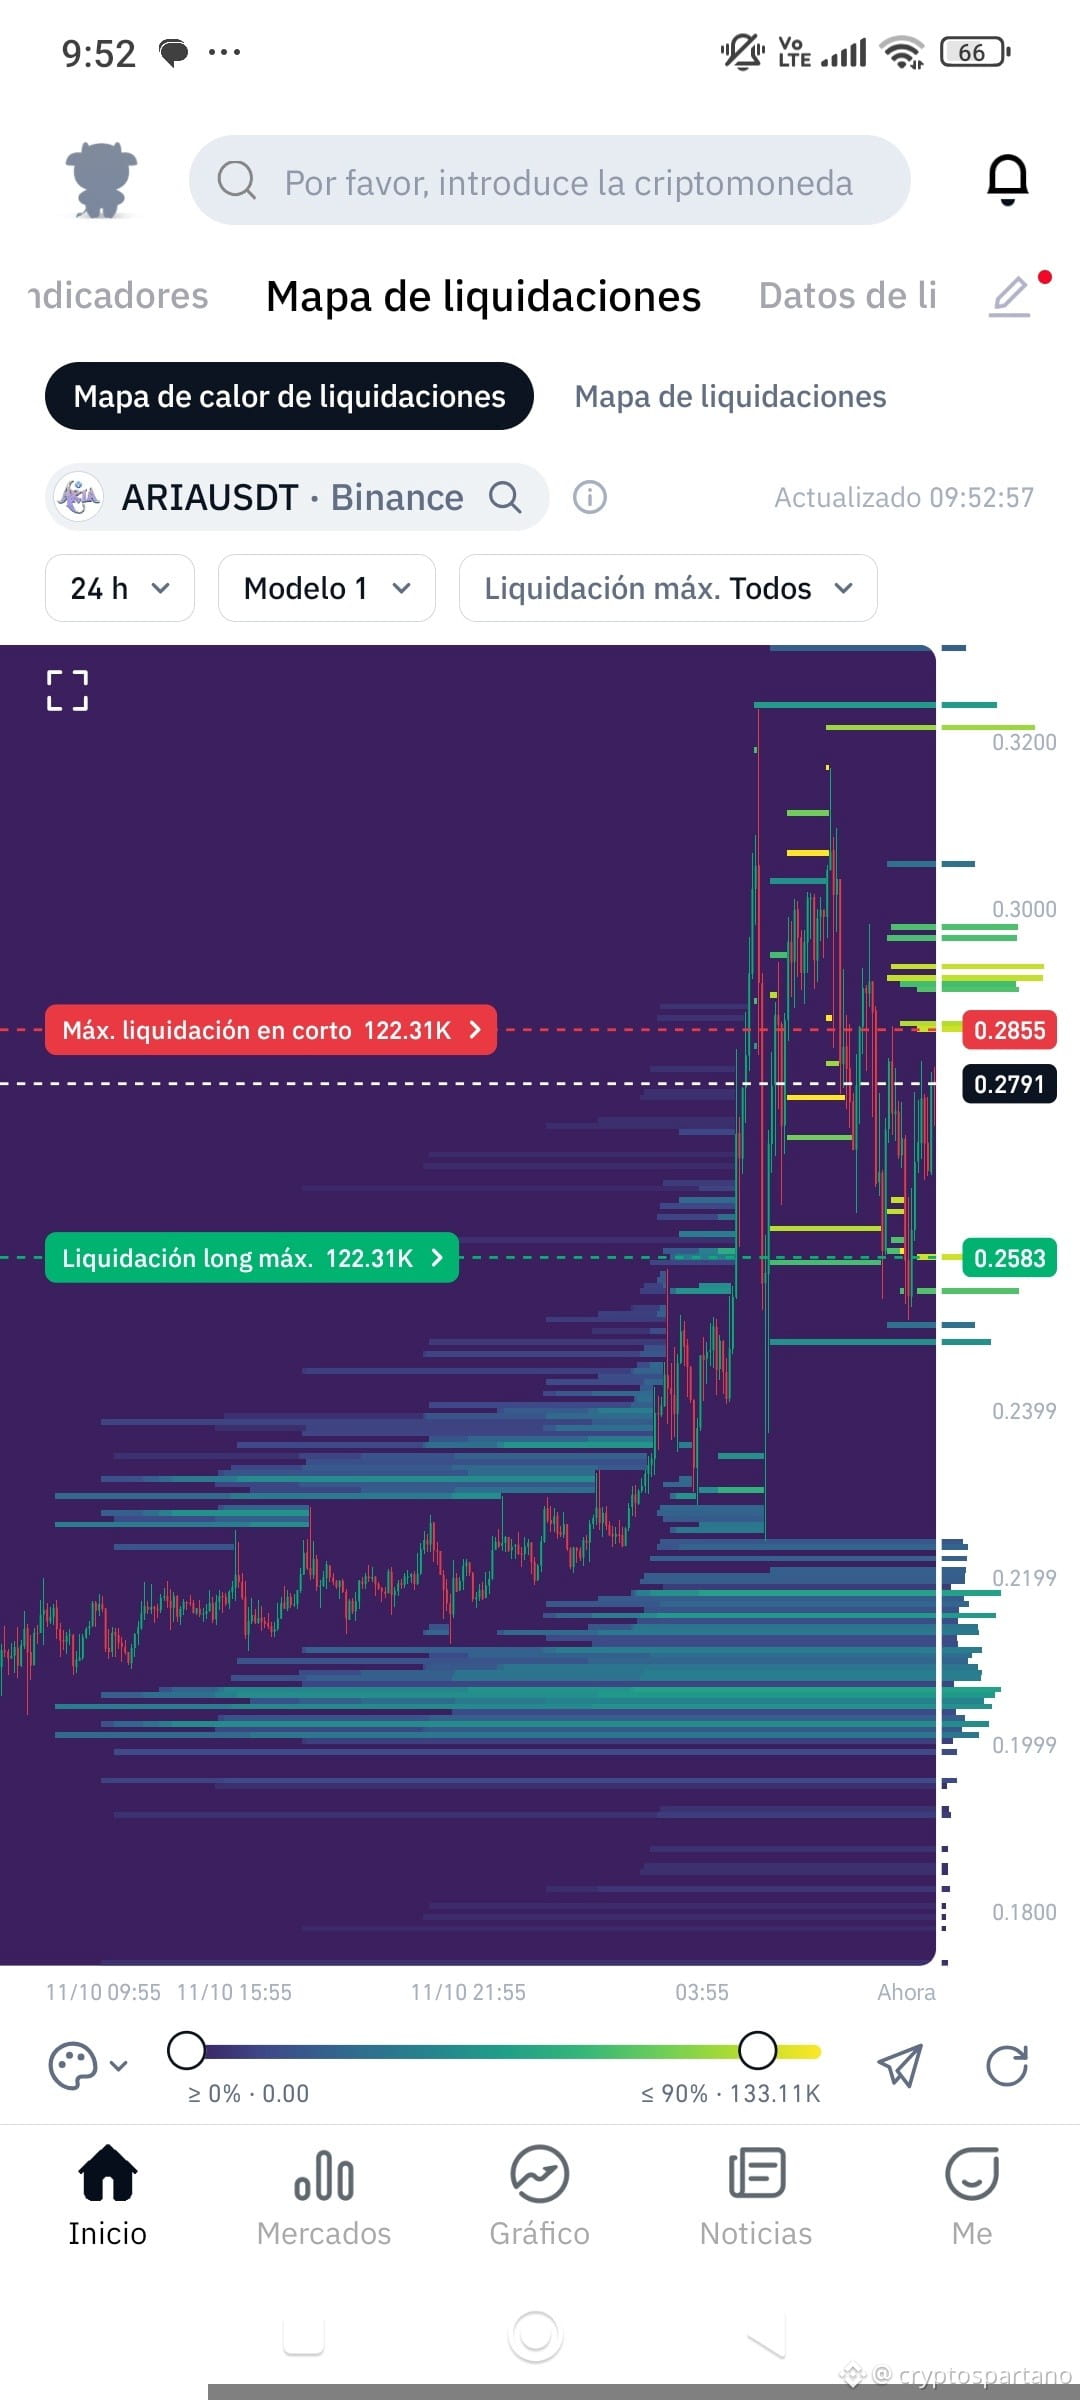
The price ($0.2799) is trapped in a classic liquidity trap after rising from $0.2199. Heatmap data shows exactly the same amount of money at stake on both sides: $122.31K.
Here’s how the board looks right now:
📊 1. The Technicals (Structure)
• Liquidation ceiling (Shorts): $0.2855 ($122.31K).
• Liquidation floor (Longs): $0.2583 ($122.31K).
• Price is consolidating in the middle, looking for which way to break first.
🧠 2. The Psychology (Retail Traders)
• Above: Buyers entering late out of FOMO, leaving their stops exposed below.
• Below: Sellers opening premature shorts, thinking it “has already gone up too much,” with their liquidation price just a step away from the current price.
🦈 3. Market Mechanics (Liquidity Hunting)
In pairs with little depth, big money doesn’t guess the future: it goes straight for visible liquidity.
• Pushing the price just +2% to $0.2855 sweeps the shorts and provides liquidity to sell at a high price.
• Watch out for a double sweep: it’s very common to liquidate the positions above first ($0.2855), then plunge the price to sweep the longs below ($0.2583).
💡 Concrete plan:
❌ Avoid trading in the middle ($0.2799); it’s a zone for quick wicks.
✅ Wait for one of the two extremes ($0.2855 or $0.2583) to be swept, and watch for rejection or confirmation before entering.
🛡️ Use low leverage.
Which do you think we’ll see first: an upside sweep or a direct drop? 👇
#ARIA #ARIAUSDT #Trading #Liquidez #CriptoAnalisis
$ARIA HAVE YOU SEEN THE LIQUIDITY MAP?
🚨 LIQUIDITY ANALYSIS: $ARIA (ARIAUSDT) 🚨
The price ($0.2799) is trapped in a classic liquidity trap after rising from $0.2199. Heatmap data shows exactly the same amount of money at stake on both sides: $122.31K.
Here’s how the board looks right now:
📊 1. The Technicals (Structure)
• Liquidation ceiling (Shorts): $0.2855 ($122.31K).
• Liquidation floor (Longs): $0.2583 ($122.31K).
• Price is consolidating in the middle, looking for which way to break first.
🧠 2. The Psychology (Retail Traders)
• Above: Buyers entering late out of FOMO, leaving their stops exposed below.
• Below: Sellers opening premature shorts, thinking it “has already gone up too much,” with their liquidation price just a step away from the current price.
🦈 3. Market Mechanics (Liquidity Hunting)
In pairs with little depth, big money doesn’t guess the future: it goes straight for visible liquidity.
• Pushing the price just +2% to $0.2855 sweeps the shorts and provides liquidity to sell at a high price.
• Watch out for a double sweep: it’s very common to liquidate the positions above first ($0.2855), then plunge the price to sweep the longs below ($0.2583).
💡 Concrete plan:
❌ Avoid trading in the middle ($0.2799); it’s a zone for quick wicks.
✅ Wait for one of the two extremes ($0.2855 or $0.2583) to be swept, and watch for rejection or confirmation before entering.
🛡️ Use low leverage.
Which do you think we’ll see first: an upside sweep or a direct drop? 👇
#ARIA #ARIAUSDT #Trading #Liquidez #CriptoAnalisis
🚨 LIQUIDITY ANALYSIS: $ARIA (ARIAUSDT) 🚨
The price ($0.2799) is trapped in a classic liquidity trap after rising from $0.2199. Heatmap data shows exactly the same amount of money at stake on both sides: $122.31K.
Here’s how the board looks right now:
📊 1. The Technicals (Structure)
• Liquidation ceiling (Shorts): $0.2855 ($122.31K).
• Liquidation floor (Longs): $0.2583 ($122.31K).
• Price is consolidating in the middle, looking for which way to break first.
🧠 2. The Psychology (Retail Traders)
• Above: Buyers entering late out of FOMO, leaving their stops exposed below.
• Below: Sellers opening premature shorts, thinking it “has already gone up too much,” with their liquidation price just a step away from the current price.
🦈 3. Market Mechanics (Liquidity Hunting)
In pairs with little depth, big money doesn’t guess the future: it goes straight for visible liquidity.
• Pushing the price just +2% to $0.2855 sweeps the shorts and provides liquidity to sell at a high price.
• Watch out for a double sweep: it’s very common to liquidate the positions above first ($0.2855), then plunge the price to sweep the longs below ($0.2583).
💡 Concrete plan:
❌ Avoid trading in the middle ($0.2799); it’s a zone for quick wicks.
✅ Wait for one of the two extremes ($0.2855 or $0.2583) to be swept, and watch for rejection or confirmation before entering.
🛡️ Use low leverage.
Which do you think we’ll see first: an upside sweep or a direct drop? 👇
#ARIA #ARIAUSDT #Trading #Liquidez #CriptoAnalisis
johnny camero:
Bajo estas premisas que debemos esperar
2
521

🛡️ NEAR TRADE: The liquidity magnet has worked 🏹
Attention, crew! Keep your eyes peeled. While retail traders are panicking over the midday dip, the Sniper is smiling because the plan is unfolding as expected. 🕵️♂️
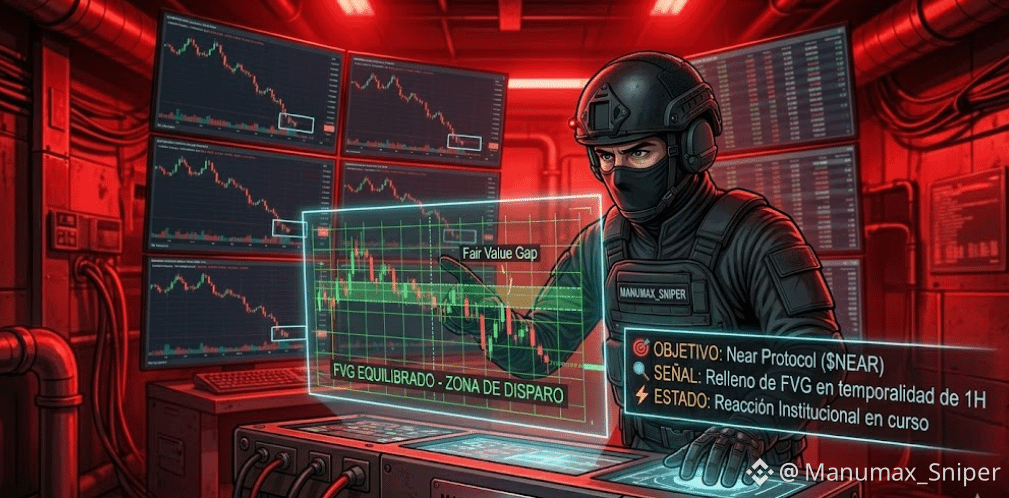
$NEAR (Near Protocol) just did exactly what we projected on the Sunday radar: it came back to seek the Fair Value Gap (FVG) that was left open. That liquidity 'gap' acted like a perfect magnet, bringing the price back to balance the orders of Smart Money.
The price touched the inefficiency zone, and the reaction has been immediate. It's not a coincidence; it's market mechanics. Institutions needed to fill that void before continuing with the trend of Week 19.
We're observing rejection volume in this zone. If the wicks of the candlesticks start leaving traces below, the bear trap has been set.
Don't shoot in desperation. If you're already positioned in the widget below, maintain discipline. If you haven't entered, wait for the re-test. The Sniper doesn't chase the price; it intercepts it in its kill zone. 🏹📉
Who among my 64 followers identified this FVG using yesterday's technique? The market rewards those who can read the gaps.
#SmartMoney #NEAR #liquidez #CriptoAnalisis #Manumax_Sniper
🛡️ NEAR TRADE: The liquidity magnet has worked 🏹
Attention, crew! Keep your eyes peeled. While retail traders are panicking over the midday dip, the Sniper is smiling because the plan is unfolding as expected. 🕵️♂️
$NEAR (Near Protocol) just did exactly what we projected on the Sunday radar: it came back to seek the Fair Value Gap (FVG) that was left open. That liquidity 'gap' acted like a perfect magnet, bringing the price back to balance the orders of Smart Money.
The price touched the inefficiency zone, and the reaction has been immediate. It's not a coincidence; it's market mechanics. Institutions needed to fill that void before continuing with the trend of Week 19.
We're observing rejection volume in this zone. If the wicks of the candlesticks start leaving traces below, the bear trap has been set.
Don't shoot in desperation. If you're already positioned in the widget below, maintain discipline. If you haven't entered, wait for the re-test. The Sniper doesn't chase the price; it intercepts it in its kill zone. 🏹📉
Who among my 64 followers identified this FVG using yesterday's technique? The market rewards those who can read the gaps.
#SmartMoney #NEAR #liquidez #CriptoAnalisis #Manumax_Sniper
Attention, crew! Keep your eyes peeled. While retail traders are panicking over the midday dip, the Sniper is smiling because the plan is unfolding as expected. 🕵️♂️
$NEAR (Near Protocol) just did exactly what we projected on the Sunday radar: it came back to seek the Fair Value Gap (FVG) that was left open. That liquidity 'gap' acted like a perfect magnet, bringing the price back to balance the orders of Smart Money.
The price touched the inefficiency zone, and the reaction has been immediate. It's not a coincidence; it's market mechanics. Institutions needed to fill that void before continuing with the trend of Week 19.
We're observing rejection volume in this zone. If the wicks of the candlesticks start leaving traces below, the bear trap has been set.
Don't shoot in desperation. If you're already positioned in the widget below, maintain discipline. If you haven't entered, wait for the re-test. The Sniper doesn't chase the price; it intercepts it in its kill zone. 🏹📉
Who among my 64 followers identified this FVG using yesterday's technique? The market rewards those who can read the gaps.
#SmartMoney #NEAR #liquidez #CriptoAnalisis #Manumax_Sniper
1
1.8k

·
--
Bullish
$CETUS ¡Cetus Protocol on the radar! Opportunity? 📈🤔
$CETUS is making headlines. After observing the recent market behavior, here is the technical summary you need to make informed decisions:
📊 Key Data:
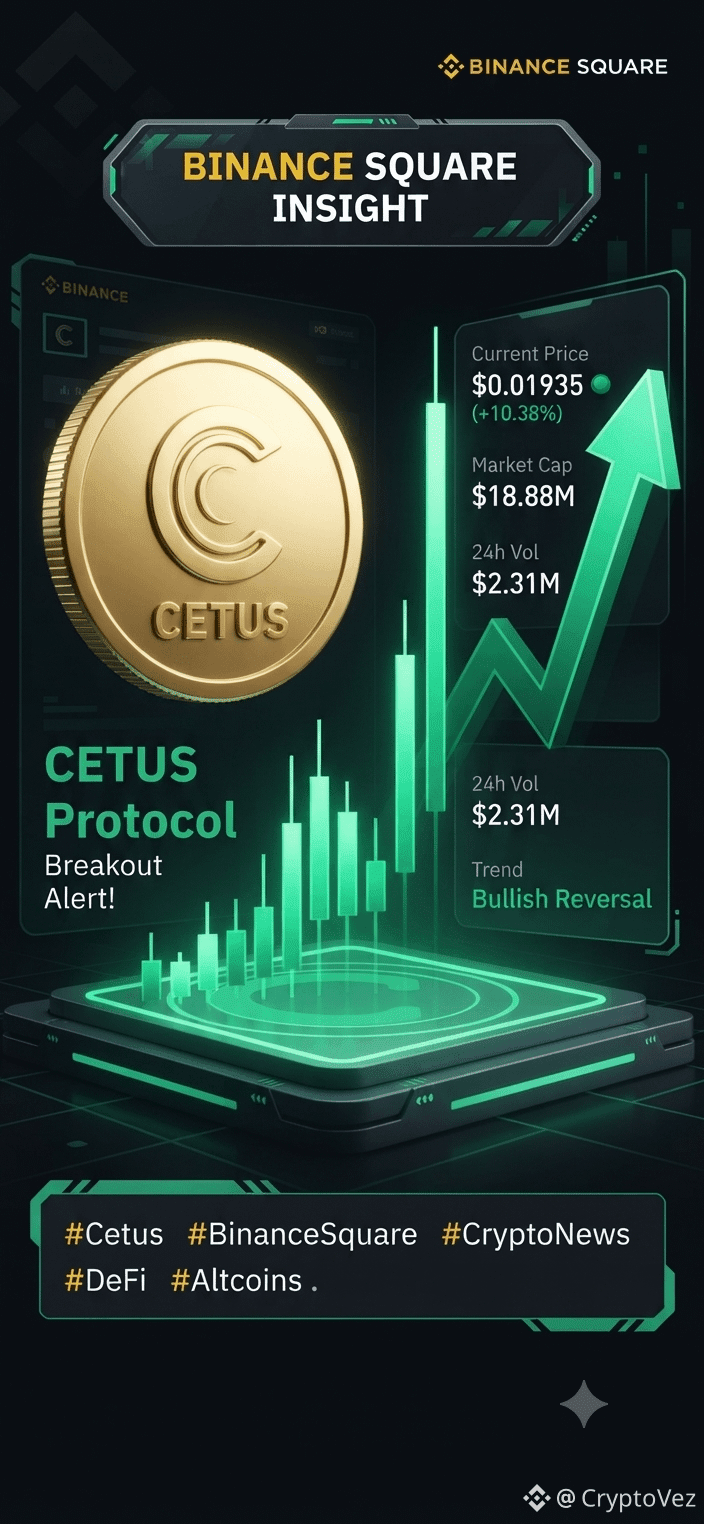
Current Price: $0.01935 - $0.01940 (+10.38% - 10.67%)
Market Cap: $18.88M (Rank: No. 666)👈👀😱😱
24h High: $0.02394 | 24h Low: $0.01728
All-Time High: $0.49237 | All-Time Low: $0.01415
🔍 Technical Analysis (Candles & Trend):
Volatility: The daily and 4-hour chart shows a very strong bullish breakout, with a substantial increase in trading volume, suggesting a significant inflow of capital in the latest sessions. 🟢
Indicators: Moving averages and Bollinger Bands are reacting upward. The stochastic (STOCHRSI) is in a high-activity zone, indicating bullish momentum in the short term.
Structure: After a prolonged bearish trend from its highs, the asset is trying to build a base and break through key resistances. The key now will be maintaining volume to consolidate these levels.
💡 Outlook: We’re looking at an interesting reversal move with high volume. It’s crucial to watch whether it can stay above the current support levels to confirm a real trend change.
Disclaimer: This is not financial advice. Do your own research before investing.
#Cetus #CetusProtocol #BinanceSquare #CriptoAnalisis #DeFi $CETUS
{future}(CETUSUSDT)
$CETUS ¡Cetus Protocol on the radar! Opportunity? 📈🤔
$CETUS is making headlines. After observing the recent market behavior, here is the technical summary you need to make informed decisions:
📊 Key Data:
Current Price: $0.01935 - $0.01940 (+10.38% - 10.67%)
Market Cap: $18.88M (Rank: No. 666)👈👀😱😱
24h High: $0.02394 | 24h Low: $0.01728
All-Time High: $0.49237 | All-Time Low: $0.01415
🔍 Technical Analysis (Candles & Trend):
Volatility: The daily and 4-hour chart shows a very strong bullish breakout, with a substantial increase in trading volume, suggesting a significant inflow of capital in the latest sessions. 🟢
Indicators: Moving averages and Bollinger Bands are reacting upward. The stochastic (STOCHRSI) is in a high-activity zone, indicating bullish momentum in the short term.
Structure: After a prolonged bearish trend from its highs, the asset is trying to build a base and break through key resistances. The key now will be maintaining volume to consolidate these levels.
💡 Outlook: We’re looking at an interesting reversal move with high volume. It’s crucial to watch whether it can stay above the current support levels to confirm a real trend change.
Disclaimer: This is not financial advice. Do your own research before investing.
#Cetus #CetusProtocol #BinanceSquare #CriptoAnalisis #DeFi $CETUS
$CETUS is making headlines. After observing the recent market behavior, here is the technical summary you need to make informed decisions:
📊 Key Data:
Current Price: $0.01935 - $0.01940 (+10.38% - 10.67%)
Market Cap: $18.88M (Rank: No. 666)👈👀😱😱
24h High: $0.02394 | 24h Low: $0.01728
All-Time High: $0.49237 | All-Time Low: $0.01415
🔍 Technical Analysis (Candles & Trend):
Volatility: The daily and 4-hour chart shows a very strong bullish breakout, with a substantial increase in trading volume, suggesting a significant inflow of capital in the latest sessions. 🟢
Indicators: Moving averages and Bollinger Bands are reacting upward. The stochastic (STOCHRSI) is in a high-activity zone, indicating bullish momentum in the short term.
Structure: After a prolonged bearish trend from its highs, the asset is trying to build a base and break through key resistances. The key now will be maintaining volume to consolidate these levels.
💡 Outlook: We’re looking at an interesting reversal move with high volume. It’s crucial to watch whether it can stay above the current support levels to confirm a real trend change.
Disclaimer: This is not financial advice. Do your own research before investing.
#Cetus #CetusProtocol #BinanceSquare #CriptoAnalisis #DeFi $CETUS
132
🛡️ RADAR LINK: The data nexus is primed for a breakout 🏹🎯
Heads up! While many are distracted by meme coins, the real Smart Money is positioning itself in the backbone of the infrastructure: Chainlink ($LINK ). 🕵️♂️
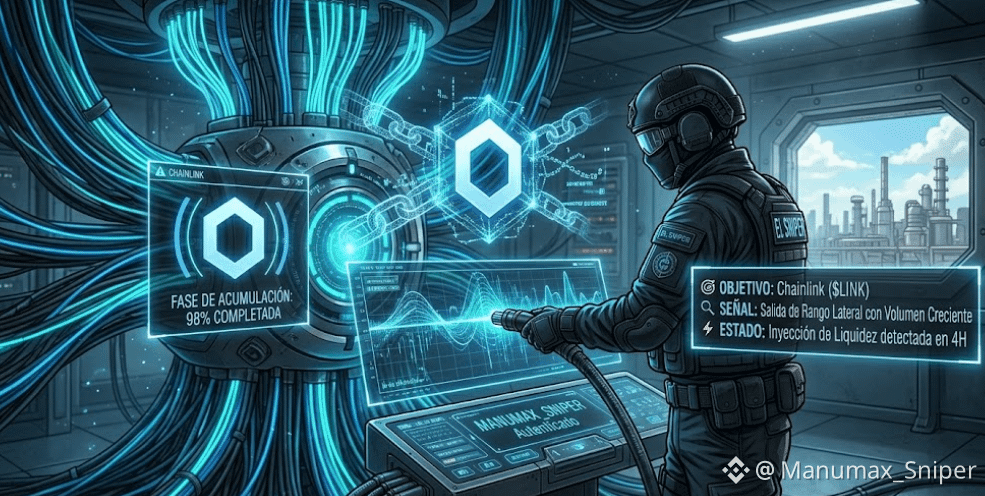
The bunker radar detects that the sideways accumulation phase is coming to an end. High-caliber traders are eyeing the ignition point, and whales have left a trail of massive buy orders in the daily Order Block.
$LINK doesn’t move on hype; it moves on utility and institutional flow. We're witnessing price compression that often precedes explosive moves. Search volume has surged by 40% in recent hours; the crew is on alert.
We're watching the key resistance level. If the price breaks with an intention candlestick and volume confirms, the shot will be inevitable. This isn’t guesswork; it’s tracking footprints.
Stay calm at noon. The Sniper doesn’t rush to enter; he waits for the price to break its structure. If the data nexus activates, we’ll be positioned. 🏹📈
Who's monitoring the trail of $$LINK for the closing session? The market rewards those who keep an eye on the pillars.
#Chainlink #LINK #Manumax_square #Web3 #CryptoAnalysis
🛡️ RADAR LINK: The data nexus is primed for a breakout 🏹🎯
Heads up! While many are distracted by meme coins, the real Smart Money is positioning itself in the backbone of the infrastructure: Chainlink ($LINK ). 🕵️♂️
The bunker radar detects that the sideways accumulation phase is coming to an end. High-caliber traders are eyeing the ignition point, and whales have left a trail of massive buy orders in the daily Order Block.
$LINK doesn’t move on hype; it moves on utility and institutional flow. We're witnessing price compression that often precedes explosive moves. Search volume has surged by 40% in recent hours; the crew is on alert.
We're watching the key resistance level. If the price breaks with an intention candlestick and volume confirms, the shot will be inevitable. This isn’t guesswork; it’s tracking footprints.
Stay calm at noon. The Sniper doesn’t rush to enter; he waits for the price to break its structure. If the data nexus activates, we’ll be positioned. 🏹📈
Who's monitoring the trail of $$LINK for the closing session? The market rewards those who keep an eye on the pillars.
#Chainlink #LINK #Manumax_square #Web3 #CryptoAnalysis
Heads up! While many are distracted by meme coins, the real Smart Money is positioning itself in the backbone of the infrastructure: Chainlink ($LINK ). 🕵️♂️
The bunker radar detects that the sideways accumulation phase is coming to an end. High-caliber traders are eyeing the ignition point, and whales have left a trail of massive buy orders in the daily Order Block.
$LINK doesn’t move on hype; it moves on utility and institutional flow. We're witnessing price compression that often precedes explosive moves. Search volume has surged by 40% in recent hours; the crew is on alert.
We're watching the key resistance level. If the price breaks with an intention candlestick and volume confirms, the shot will be inevitable. This isn’t guesswork; it’s tracking footprints.
Stay calm at noon. The Sniper doesn’t rush to enter; he waits for the price to break its structure. If the data nexus activates, we’ll be positioned. 🏹📈
Who's monitoring the trail of $$LINK for the closing session? The market rewards those who keep an eye on the pillars.
#Chainlink #LINK #Manumax_square #Web3 #CryptoAnalysis
1
1.1k

·
--
Bullish
🚀 RoboInu ($ROBO): Beyond Speculation, a Growing Ecosystem
Content:
In the world of digital assets, true innovation is what separates fleeting projects from future-proof ecosystems. Today, I focus on RoboInu ($ROBO), a project that is proving to be much more than just a currency.
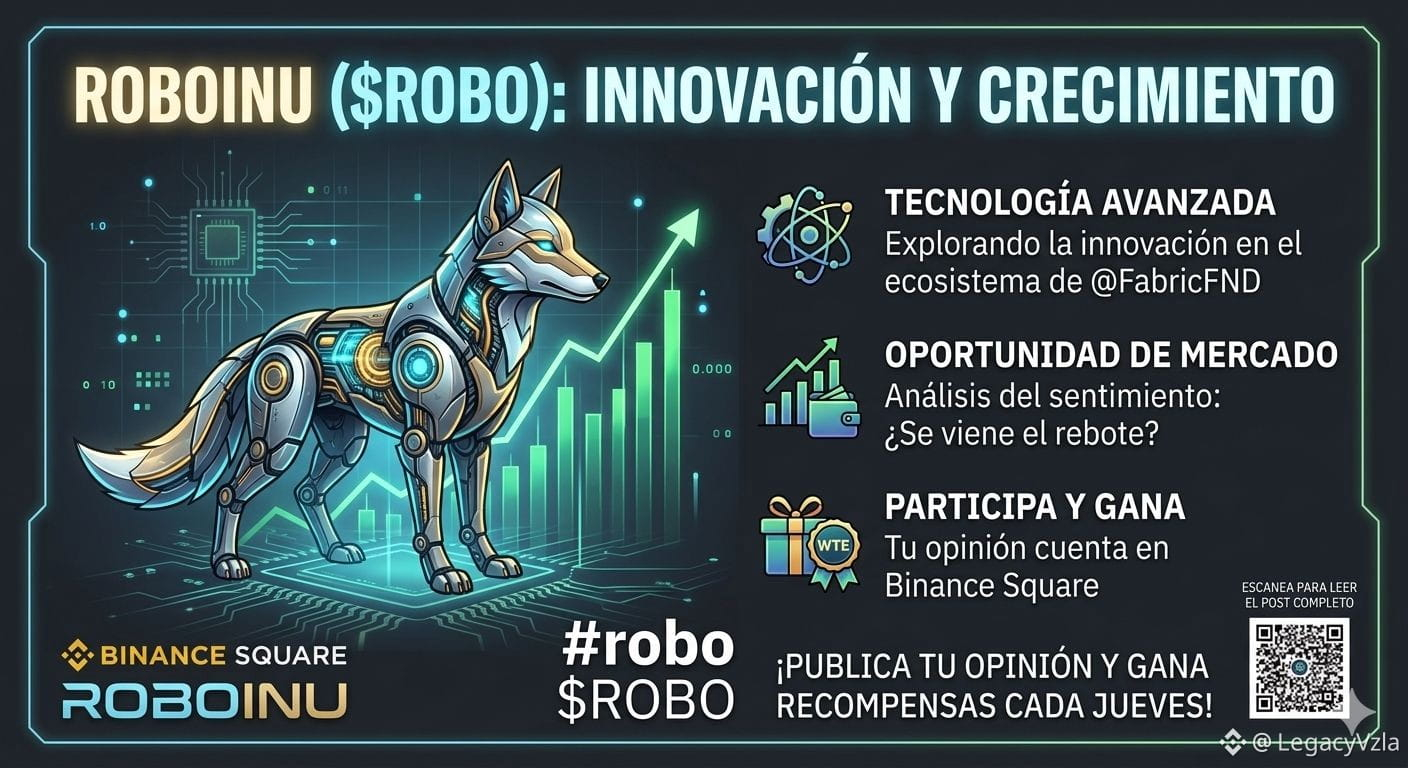
As shown in the image I've designed (above), the growth of $ROBO is supported by fundamental pillars that every investor should consider:
Advanced Technology: It is fascinating to see how RoboInu is exploring innovation within the ecosystem of @FabricFND. This technological connection suggests solid development and real use cases that go beyond theory. 🧠🔧
Market Opportunity: In response to the question "Is a bounce coming?", sentiment analysis is key. The bullish chart in our image reflects a growing optimism that is worth monitoring closely. Are we at a turning point? 📈👀
Participate and Win: Don't forget that on Binance Square, your opinion matters. By sharing analysis and participating in the discussion of projects like RoboInu, you not only contribute to the community's knowledge but also have the chance to win rewards every Thursday. Interaction is power! 🎁🗣️
My vision: The future of RoboInu looks promising, integrating cutting-edge technology with strong community growth. I highly recommend researching more about its fundamentals and closely following its next steps.
What do you all think about the integration with @FabricFND? Do you believe this will push $ROBO to new highs? Share your comments and let’s discuss! 👇
#robo $ROBO #RoboInu #FabricFND #BinanceSquare #CriptoAnalisis #SmartInvestment
🚀 RoboInu ($ROBO ): Beyond Speculation, a Growing Ecosystem
Content:
In the world of digital assets, true innovation is what separates fleeting projects from future-proof ecosystems. Today, I focus on RoboInu ($ROBO ), a project that is proving to be much more than just a currency.
As shown in the image I've designed (above), the growth of $ROBO is supported by fundamental pillars that every investor should consider:
Advanced Technology: It is fascinating to see how RoboInu is exploring innovation within the ecosystem of @FabricFND. This technological connection suggests solid development and real use cases that go beyond theory. 🧠🔧
Market Opportunity: In response to the question "Is a bounce coming?", sentiment analysis is key. The bullish chart in our image reflects a growing optimism that is worth monitoring closely. Are we at a turning point? 📈👀
Participate and Win: Don't forget that on Binance Square, your opinion matters. By sharing analysis and participating in the discussion of projects like RoboInu, you not only contribute to the community's knowledge but also have the chance to win rewards every Thursday. Interaction is power! 🎁🗣️
My vision: The future of RoboInu looks promising, integrating cutting-edge technology with strong community growth. I highly recommend researching more about its fundamentals and closely following its next steps.
What do you all think about the integration with @FabricFND? Do you believe this will push $ROBO to new highs? Share your comments and let’s discuss! 👇
#robo $ROBO #RoboInu #FabricFND #BinanceSquare #CriptoAnalisis #SmartInvestment
Content:
In the world of digital assets, true innovation is what separates fleeting projects from future-proof ecosystems. Today, I focus on RoboInu ($ROBO ), a project that is proving to be much more than just a currency.
As shown in the image I've designed (above), the growth of $ROBO is supported by fundamental pillars that every investor should consider:
Advanced Technology: It is fascinating to see how RoboInu is exploring innovation within the ecosystem of @FabricFND. This technological connection suggests solid development and real use cases that go beyond theory. 🧠🔧
Market Opportunity: In response to the question "Is a bounce coming?", sentiment analysis is key. The bullish chart in our image reflects a growing optimism that is worth monitoring closely. Are we at a turning point? 📈👀
Participate and Win: Don't forget that on Binance Square, your opinion matters. By sharing analysis and participating in the discussion of projects like RoboInu, you not only contribute to the community's knowledge but also have the chance to win rewards every Thursday. Interaction is power! 🎁🗣️
My vision: The future of RoboInu looks promising, integrating cutting-edge technology with strong community growth. I highly recommend researching more about its fundamentals and closely following its next steps.
What do you all think about the integration with @FabricFND? Do you believe this will push $ROBO to new highs? Share your comments and let’s discuss! 👇
#robo $ROBO #RoboInu #FabricFND #BinanceSquare #CriptoAnalisis #SmartInvestment
1
447
Log in to explore more content
Join global crypto users on Binance Square
⚡️ Get latest and useful information about crypto.
💬 Trusted by the world’s largest crypto exchange.
👍 Discover real insights from verified creators.
Email / Phone number
Trending Topics
1
#USPPIMissMayEaseBTCPressure
90,737 views
1,155 Discussing
2
#MANTRAPausesUnstakingFor7DaysAfterKeplrSecurityIncident
309 views
13 Discussing
3
#BitcoinCoreDisclosesTorTrafficVulnerability
41,709 views
659 Discussing
4
#WhatWillDriveCryptoandStocks’NextRebound?
224,341 views
1,876 Discussing
5
#BitcoinBreaksBelow200WeekMovingAverage
88,386 views
706 Discussing
6
#SpaceXTeslaMergerTalksWouldCombine30220BTC
27,836 views
403 Discussing
7
#Anthropic’s6xIPODemandSignalsPotentialRecordRaise
83,717 views
848 Discussing
8
#USCryptoETFsLose$1.48BInFiveDays
3,724 views
59 Discussing
9
#KoreaDigitalAssetBasicActFinalDraftExpectedEarlyJanuary
4,718 views
33 Discussing
10
#RippleRLUSDMarketCapSurpassesPayPalPYUSD
17,871 views
207 Discussing