
#candlestickchart
candlestickchart
1,558 views
40 Discussing
Hot
Latest

Japanese Candlestick Guide #17
Marubozu Candle
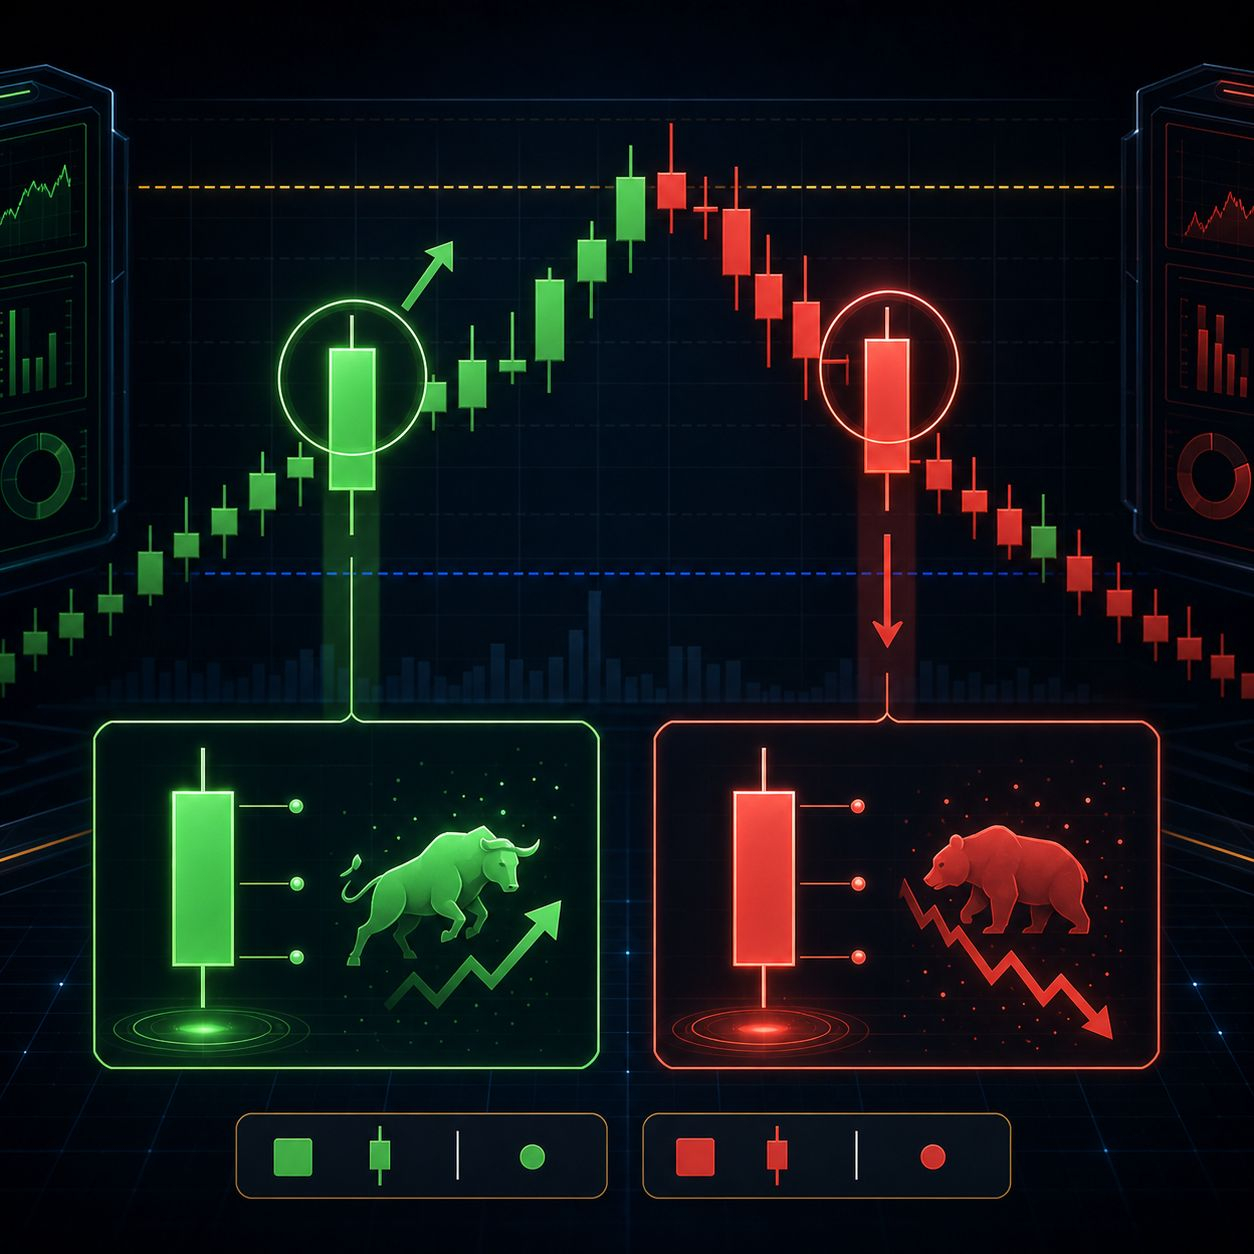
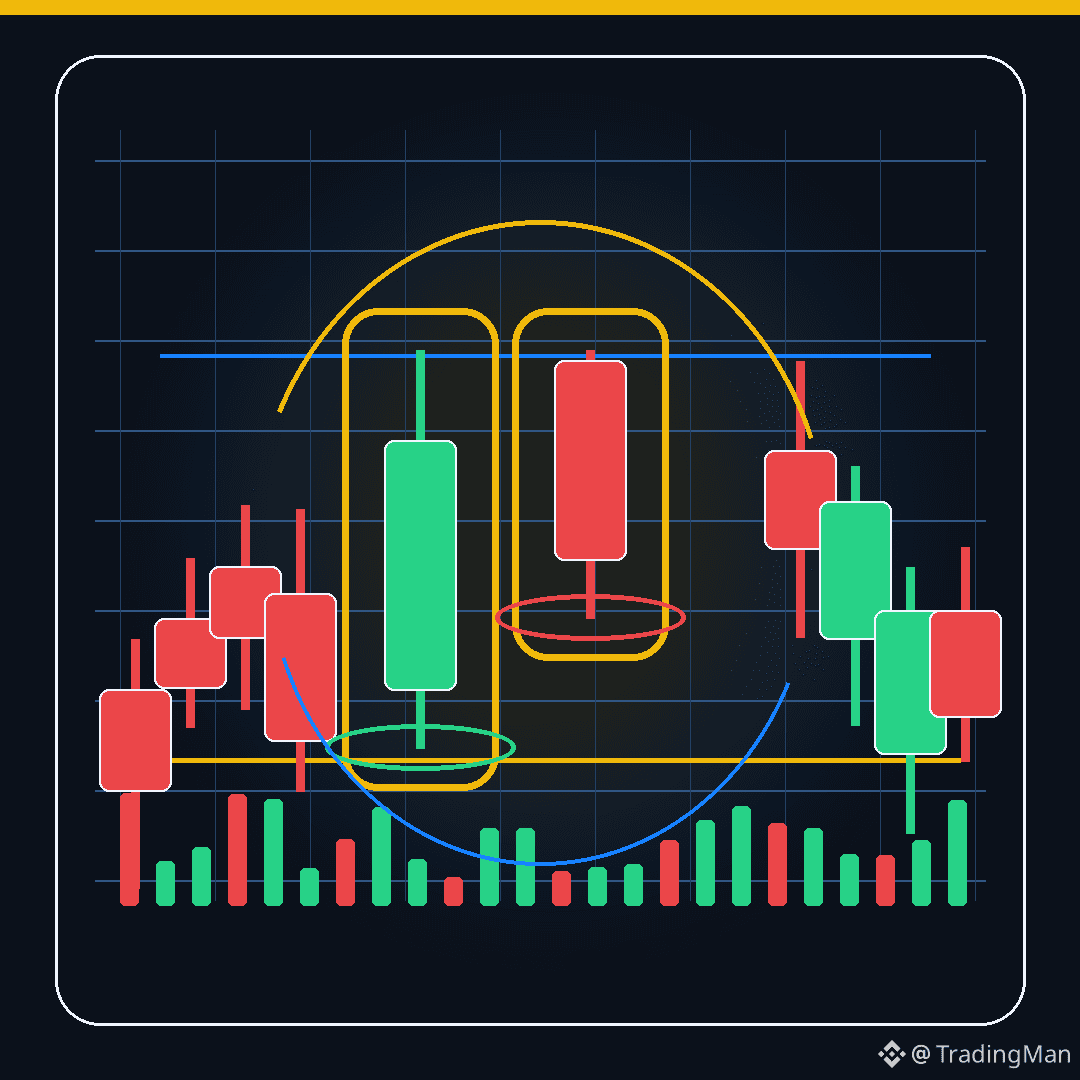
Marubozu is a candle with a very large body and almost no shadows.
If it is bullish, it indicates strong buyer control from the beginning of the period to its end.
If it is bearish, it indicates strong seller control.
But after a very strong candle, don’t chase the price randomly. Watch for retest areas or continuation of momentum.
Stay updated so you don’t miss anything new in the trading education series.
Educational content, not financial advice.
#TechnicalAnalysis #TradingBasics #CandlestickChart
Japanese Candlestick Guide #17
Marubozu Candle
Marubozu is a candle with a very large body and almost no shadows.
If it is bullish, it indicates strong buyer control from the beginning of the period to its end.
If it is bearish, it indicates strong seller control.
But after a very strong candle, don’t chase the price randomly. Watch for retest areas or continuation of momentum.
Stay updated so you don’t miss anything new in the trading education series.
Educational content, not financial advice.
#TechnicalAnalysis #TradingBasics #CandlestickChart
Marubozu Candle
Marubozu is a candle with a very large body and almost no shadows.
If it is bullish, it indicates strong buyer control from the beginning of the period to its end.
If it is bearish, it indicates strong seller control.
But after a very strong candle, don’t chase the price randomly. Watch for retest areas or continuation of momentum.
Stay updated so you don’t miss anything new in the trading education series.
Educational content, not financial advice.
#TechnicalAnalysis #TradingBasics #CandlestickChart
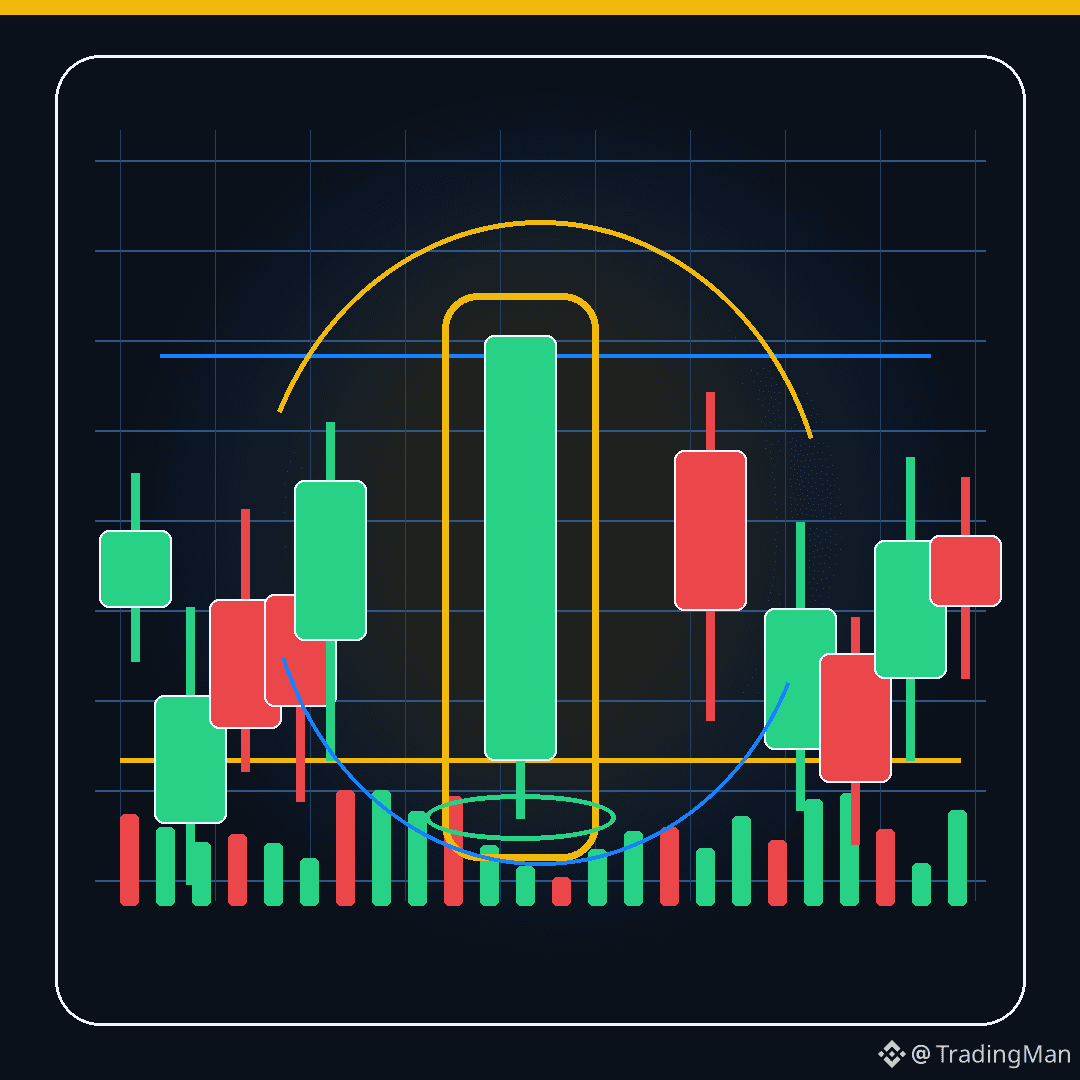
19
Japanese Candlestick Guide #5
Hammer Candlestick
The Hammer candlestick often appears after a decline or near a support area.
Its shape consists of a small body at the top and a long lower shadow.
This means that sellers pushed the price downward, but buyers strongly pushed it back up before the close.
The longer the lower shadow and the smaller the body, the clearer the signal. It’s best to wait for a confirming bullish candlestick afterward.
Follow up to get all the new updates in the trading education series.
Educational content, not financial advice.
#TechnicalAnalysis #TradingBasics #CandlestickChart
Japanese Candlestick Guide #5
Hammer Candlestick
The Hammer candlestick often appears after a decline or near a support area.
Its shape consists of a small body at the top and a long lower shadow.
This means that sellers pushed the price downward, but buyers strongly pushed it back up before the close.
The longer the lower shadow and the smaller the body, the clearer the signal. It’s best to wait for a confirming bullish candlestick afterward.
Follow up to get all the new updates in the trading education series.
Educational content, not financial advice.
#TechnicalAnalysis #TradingBasics #CandlestickChart
Hammer Candlestick
The Hammer candlestick often appears after a decline or near a support area.
Its shape consists of a small body at the top and a long lower shadow.
This means that sellers pushed the price downward, but buyers strongly pushed it back up before the close.
The longer the lower shadow and the smaller the body, the clearer the signal. It’s best to wait for a confirming bullish candlestick afterward.
Follow up to get all the new updates in the trading education series.
Educational content, not financial advice.
#TechnicalAnalysis #TradingBasics #CandlestickChart
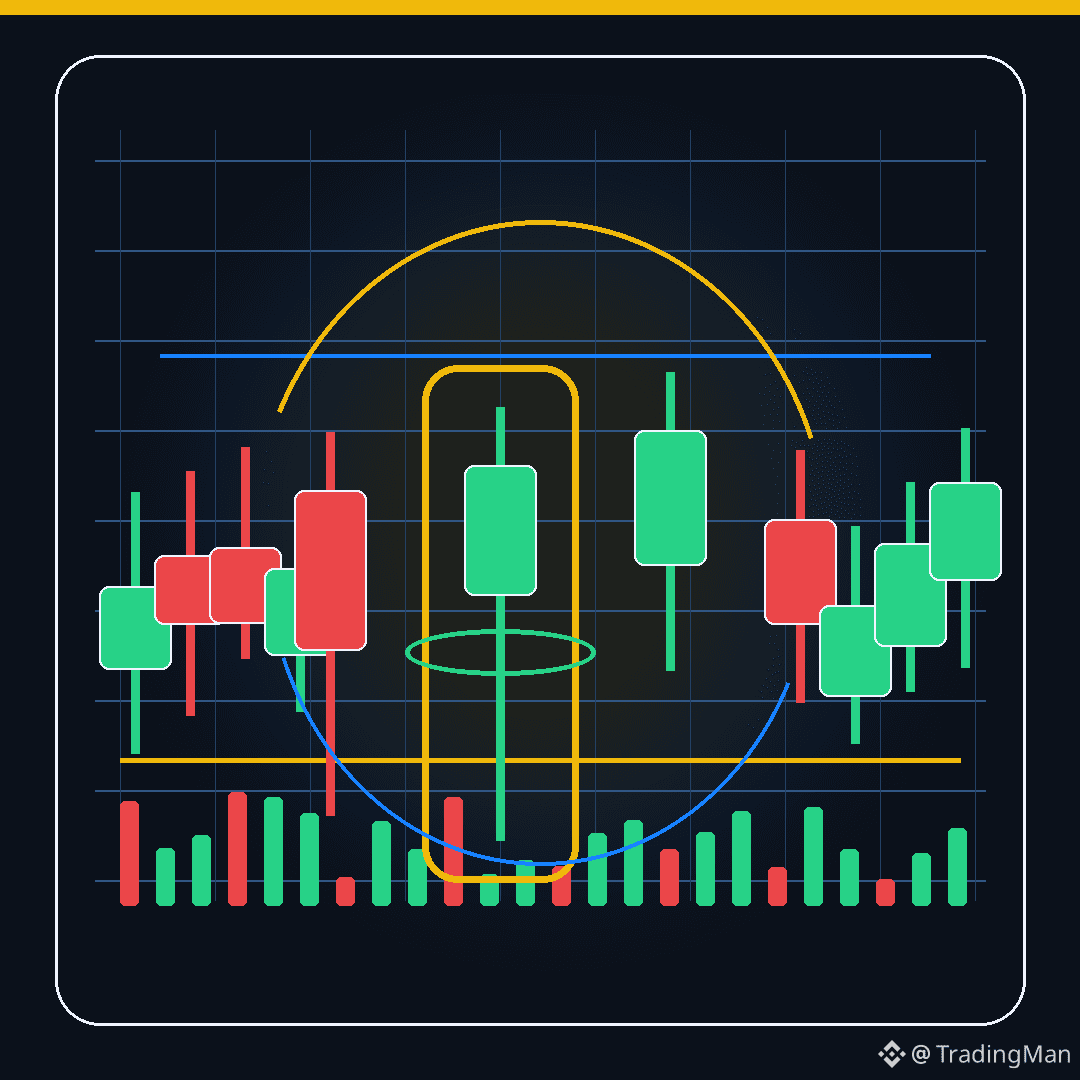
90
Japanese Candlestick Guide #26
Outside Bar
An Outside Bar is a candlestick that breaks above the high and below the low of the previous candlestick, meaning its range is larger.
It indicates strong expansion in price movement and clear conflict between buyers and sellers.
If it closes higher near the high, it tends to suggest buying strength. If it closes lower near the low, it tends to suggest selling strength.
You must distinguish between a real expansion/breakout and a false breakout within a sideways market.
Follow up to make sure you receive all new content in the trading education series.
Educational content only, not financial advice.
#TechnicalAnalysis #TradingBasics #CandlestickChart
Japanese Candlestick Guide #26
Outside Bar
An Outside Bar is a candlestick that breaks above the high and below the low of the previous candlestick, meaning its range is larger.
It indicates strong expansion in price movement and clear conflict between buyers and sellers.
If it closes higher near the high, it tends to suggest buying strength. If it closes lower near the low, it tends to suggest selling strength.
You must distinguish between a real expansion/breakout and a false breakout within a sideways market.
Follow up to make sure you receive all new content in the trading education series.
Educational content only, not financial advice.
#TechnicalAnalysis #TradingBasics #CandlestickChart
Outside Bar
An Outside Bar is a candlestick that breaks above the high and below the low of the previous candlestick, meaning its range is larger.
It indicates strong expansion in price movement and clear conflict between buyers and sellers.
If it closes higher near the high, it tends to suggest buying strength. If it closes lower near the low, it tends to suggest selling strength.
You must distinguish between a real expansion/breakout and a false breakout within a sideways market.
Follow up to make sure you receive all new content in the trading education series.
Educational content only, not financial advice.
#TechnicalAnalysis #TradingBasics #CandlestickChart
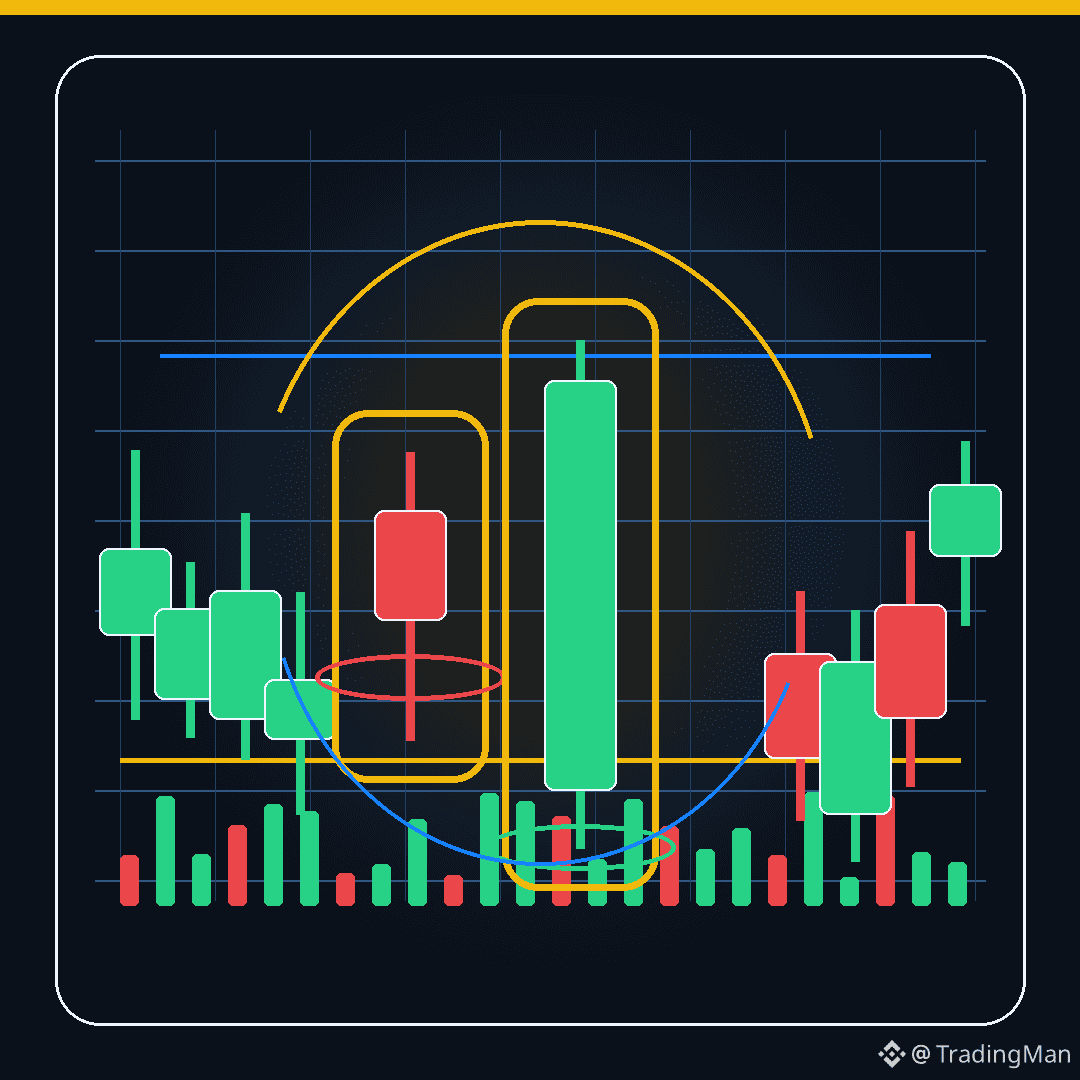
27
Japanese Candlesticks Guide #11
Morning Star
The Morning Star pattern is often seen after a decline and consists of 3 candles.
The first is a strong bearish candle, the second is small and reflects hesitation, and the third is a strong bullish candle.
Its meaning is that selling pressure begins to weaken, then buyers enter strongly.
It is strongest when there is a clear support level, after a downtrend, and with the close of the third candle above the midpoint of the first candle.
Keep an eye out so you receive every new update in the trading education series.
Educational content, not financial advice.
#TechnicalAnalysis #TradingBasics #CandlestickChart
Japanese Candlesticks Guide #11
Morning Star
The Morning Star pattern is often seen after a decline and consists of 3 candles.
The first is a strong bearish candle, the second is small and reflects hesitation, and the third is a strong bullish candle.
Its meaning is that selling pressure begins to weaken, then buyers enter strongly.
It is strongest when there is a clear support level, after a downtrend, and with the close of the third candle above the midpoint of the first candle.
Keep an eye out so you receive every new update in the trading education series.
Educational content, not financial advice.
#TechnicalAnalysis #TradingBasics #CandlestickChart
Morning Star
The Morning Star pattern is often seen after a decline and consists of 3 candles.
The first is a strong bearish candle, the second is small and reflects hesitation, and the third is a strong bullish candle.
Its meaning is that selling pressure begins to weaken, then buyers enter strongly.
It is strongest when there is a clear support level, after a downtrend, and with the close of the third candle above the midpoint of the first candle.
Keep an eye out so you receive every new update in the trading education series.
Educational content, not financial advice.
#TechnicalAnalysis #TradingBasics #CandlestickChart
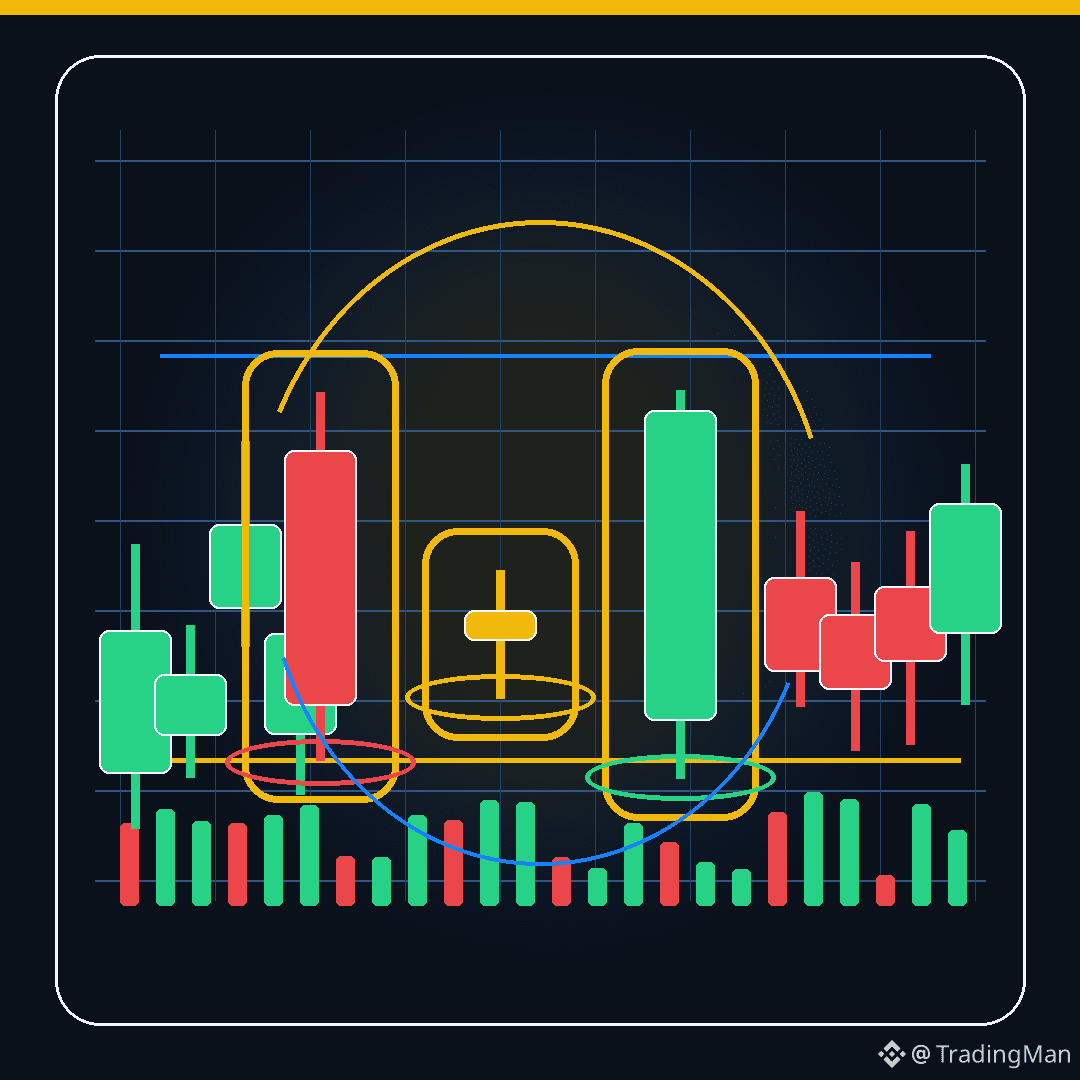
46
Japanese Candlesticks Guide #2
The Rising and Falling Candle
A rising candle appears when the closing price is higher than the opening price, and that means buyers pushed the price upward during the period.
A falling candle appears when the closing price is lower than the opening price, and that means sellers pushed the price downward.
But don’t judge by the color of just one candle. The candle’s location matters more than its shape.
A bullish candle at strong support is completely different from a random bullish candle in the middle of the move.
Follow up to get every new part in the trading education series.
Educational content, not financial advice.
#CandlestickChart #TradingBasics #TechnicalAnalysis
Japanese Candlesticks Guide #2
The Rising and Falling Candle
A rising candle appears when the closing price is higher than the opening price, and that means buyers pushed the price upward during the period.
A falling candle appears when the closing price is lower than the opening price, and that means sellers pushed the price downward.
But don’t judge by the color of just one candle. The candle’s location matters more than its shape.
A bullish candle at strong support is completely different from a random bullish candle in the middle of the move.
Follow up to get every new part in the trading education series.
Educational content, not financial advice.
#CandlestickChart #TradingBasics #TechnicalAnalysis
The Rising and Falling Candle
A rising candle appears when the closing price is higher than the opening price, and that means buyers pushed the price upward during the period.
A falling candle appears when the closing price is lower than the opening price, and that means sellers pushed the price downward.
But don’t judge by the color of just one candle. The candle’s location matters more than its shape.
A bullish candle at strong support is completely different from a random bullish candle in the middle of the move.
Follow up to get every new part in the trading education series.
Educational content, not financial advice.
#CandlestickChart #TradingBasics #TechnicalAnalysis
1
1
104
Japanese Candlestick Guide #14
Dark Cloud Cover
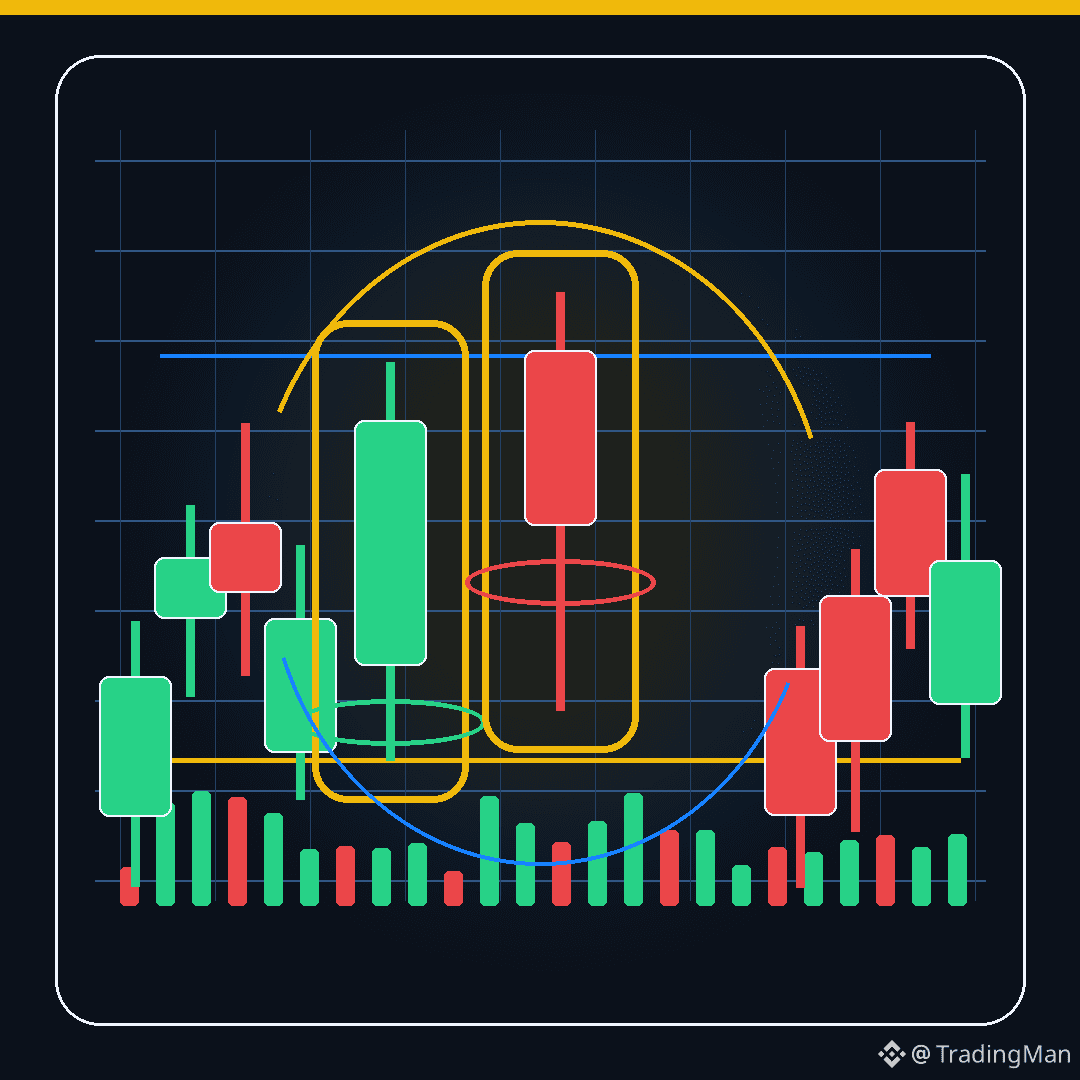
The Dark Cloud Cover pattern often appears after an uptrend.
It consists of a strong bullish candle, followed by a bearish candle that opens above it and closes within its body below the midpoint.
This means buyers started strong, but sellers reversed control during the same move.
Its strength increases when it appears at a clear resistance level or after a rapid rally.
Follow up to get all new updates in the trading education series.
Educational content, not financial advice.
#TechnicalAnalysis #TradingBasics #CandlestickChart
Japanese Candlestick Guide #14
Dark Cloud Cover
The Dark Cloud Cover pattern often appears after an uptrend.
It consists of a strong bullish candle, followed by a bearish candle that opens above it and closes within its body below the midpoint.
This means buyers started strong, but sellers reversed control during the same move.
Its strength increases when it appears at a clear resistance level or after a rapid rally.
Follow up to get all new updates in the trading education series.
Educational content, not financial advice.
#TechnicalAnalysis #TradingBasics #CandlestickChart
Dark Cloud Cover
The Dark Cloud Cover pattern often appears after an uptrend.
It consists of a strong bullish candle, followed by a bearish candle that opens above it and closes within its body below the midpoint.
This means buyers started strong, but sellers reversed control during the same move.
Its strength increases when it appears at a clear resistance level or after a rapid rally.
Follow up to get all new updates in the trading education series.
Educational content, not financial advice.
#TechnicalAnalysis #TradingBasics #CandlestickChart
1
26
Japanese Candlestick Guide #23
Bullish Pin Bar
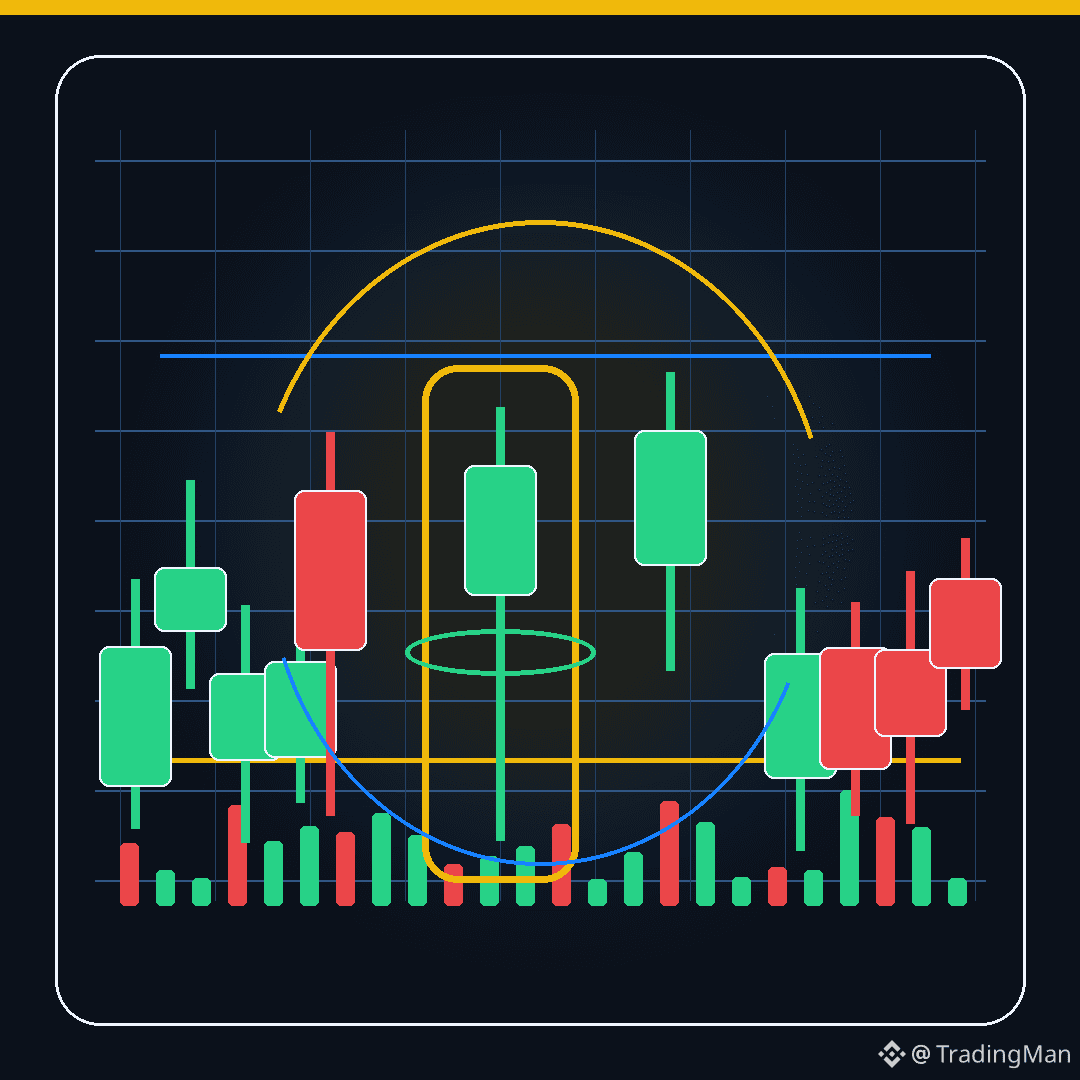
Bullish Pin Bar looks like a Hammer and is often seen at support or after a decline.
The long lower wick means the price rejected the drop, and the small body indicates that buyers returned near the close.
The best place to look for it is at a support area, an uptrend, or during a retest of a broken level.
The best entry is after confirmation, not just upon the appearance of the tail.
Follow up to get all the new content in the trading education series.
Educational content only, not financial advice.
#TechnicalAnalysis #TradingBasics #CandlestickChart
Japanese Candlestick Guide #23
Bullish Pin Bar
Bullish Pin Bar looks like a Hammer and is often seen at support or after a decline.
The long lower wick means the price rejected the drop, and the small body indicates that buyers returned near the close.
The best place to look for it is at a support area, an uptrend, or during a retest of a broken level.
The best entry is after confirmation, not just upon the appearance of the tail.
Follow up to get all the new content in the trading education series.
Educational content only, not financial advice.
#TechnicalAnalysis #TradingBasics #CandlestickChart
Bullish Pin Bar
Bullish Pin Bar looks like a Hammer and is often seen at support or after a decline.
The long lower wick means the price rejected the drop, and the small body indicates that buyers returned near the close.
The best place to look for it is at a support area, an uptrend, or during a retest of a broken level.
The best entry is after confirmation, not just upon the appearance of the tail.
Follow up to get all the new content in the trading education series.
Educational content only, not financial advice.
#TechnicalAnalysis #TradingBasics #CandlestickChart
45
Japanese Candlestick Guide #29
Confirm the next candle
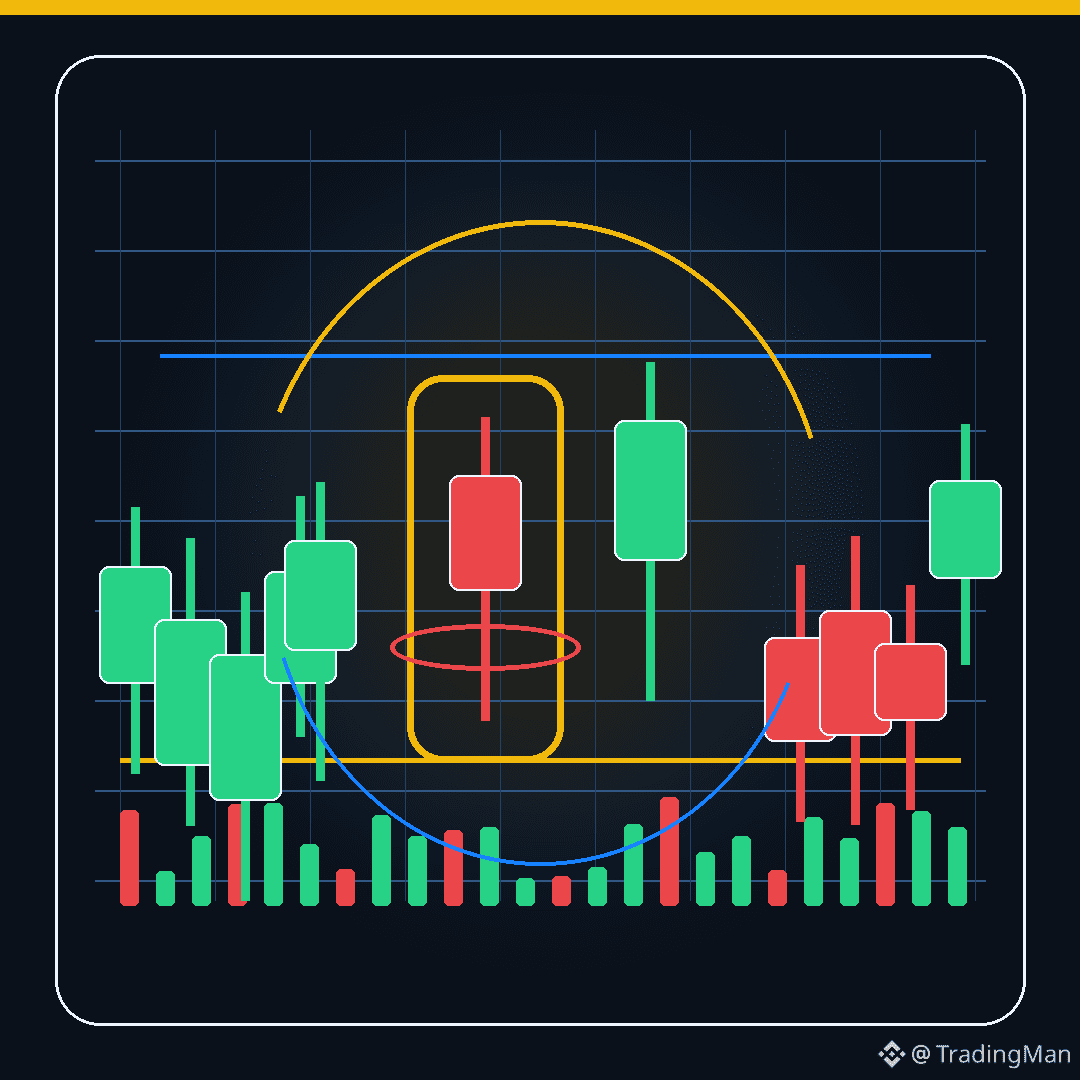
The biggest mistake when reading candles is entering as soon as the pattern appears.
The model gives a probability, not a guarantee.
Confirmation could be a subsequent candle in the same direction, breaking the top or bottom, or a clear close above/below an important level.
The longer you wait for better confirmation, the fewer random signals you’ll get, but you may enter at a slightly higher price.
Follow up to get all the new content in the trading education series.
Educational content, not financial advice.
#TechnicalAnalysis #TradingBasics #CandlestickChart
Japanese Candlestick Guide #29
Confirm the next candle
The biggest mistake when reading candles is entering as soon as the pattern appears.
The model gives a probability, not a guarantee.
Confirmation could be a subsequent candle in the same direction, breaking the top or bottom, or a clear close above/below an important level.
The longer you wait for better confirmation, the fewer random signals you’ll get, but you may enter at a slightly higher price.
Follow up to get all the new content in the trading education series.
Educational content, not financial advice.
#TechnicalAnalysis #TradingBasics #CandlestickChart
Confirm the next candle
The biggest mistake when reading candles is entering as soon as the pattern appears.
The model gives a probability, not a guarantee.
Confirmation could be a subsequent candle in the same direction, breaking the top or bottom, or a clear close above/below an important level.
The longer you wait for better confirmation, the fewer random signals you’ll get, but you may enter at a slightly higher price.
Follow up to get all the new content in the trading education series.
Educational content, not financial advice.
#TechnicalAnalysis #TradingBasics #CandlestickChart
116
Japanese Candlestick Guide #20
Tweezer Top
Tweezer Top is usually seen after a rise or at resistance.
It consists of two or more candles that touch almost the same high.
Its meaning is that the price tried to move up more than once, but a specific area rejected the upward move.
Its confirmation is stronger with a bearish candle or a break of a small bottom after the pattern.
Follow up to get every new update in the trading education series.
Educational content, not financial advice.
#TechnicalAnalysis #TradingBasics #CandlestickChart
Japanese Candlestick Guide #20
Tweezer Top
Tweezer Top is usually seen after a rise or at resistance.
It consists of two or more candles that touch almost the same high.
Its meaning is that the price tried to move up more than once, but a specific area rejected the upward move.
Its confirmation is stronger with a bearish candle or a break of a small bottom after the pattern.
Follow up to get every new update in the trading education series.
Educational content, not financial advice.
#TechnicalAnalysis #TradingBasics #CandlestickChart
Tweezer Top
Tweezer Top is usually seen after a rise or at resistance.
It consists of two or more candles that touch almost the same high.
Its meaning is that the price tried to move up more than once, but a specific area rejected the upward move.
Its confirmation is stronger with a bearish candle or a break of a small bottom after the pattern.
Follow up to get every new update in the trading education series.
Educational content, not financial advice.
#TechnicalAnalysis #TradingBasics #CandlestickChart
99

📈 Posting about $BTC
🚀 Bitcoin $BTC continues to attract traders' and investors' attention as the largest digital currency by market value.
Follow the price movement, support and resistance zones, and trading volume before making any decision.
📊 Charting tool: Add a candlestick chart to track $BTC price movement and analyze trends more clearly.
💡 Remember: Risk management matters—do not enter any trade before conducting your own analysis.
$BTC #Bitcoin #BTC #Binance #Crypto #Trading #CryptoTrading #BinanceSquare #BitcoinAnalysis #CandlestickChart #EightChineseFinancialFirmsRaise360BYuan #USStrikesIranTankersTehranRestrictsHormuz #RussiaUkraine72-hourCeasefire #USStrikesIranTankersTehranRestrictsHormuz $NVDAB $AAPLB $MSFTB
📈 Posting about $BTC
🚀 Bitcoin $BTC continues to attract traders' and investors' attention as the largest digital currency by market value.
Follow the price movement, support and resistance zones, and trading volume before making any decision.
📊 Charting tool: Add a candlestick chart to track $BTC price movement and analyze trends more clearly.
💡 Remember: Risk management matters—do not enter any trade before conducting your own analysis.
$BTC #Bitcoin #BTC #Binance #Crypto #Trading #CryptoTrading #BinanceSquare #BitcoinAnalysis #CandlestickChart #EightChineseFinancialFirmsRaise360BYuan #USStrikesIranTankersTehranRestrictsHormuz #RussiaUkraine72-hourCeasefire #USStrikesIranTankersTehranRestrictsHormuz $NVDAB $AAPLB $MSFTB
🚀 Bitcoin $BTC continues to attract traders' and investors' attention as the largest digital currency by market value.
Follow the price movement, support and resistance zones, and trading volume before making any decision.
📊 Charting tool: Add a candlestick chart to track $BTC price movement and analyze trends more clearly.
💡 Remember: Risk management matters—do not enter any trade before conducting your own analysis.
$BTC #Bitcoin #BTC #Binance #Crypto #Trading #CryptoTrading #BinanceSquare #BitcoinAnalysis #CandlestickChart #EightChineseFinancialFirmsRaise360BYuan #USStrikesIranTankersTehranRestrictsHormuz #RussiaUkraine72-hourCeasefire #USStrikesIranTankersTehranRestrictsHormuz $NVDAB $AAPLB $MSFTB
65

·
--
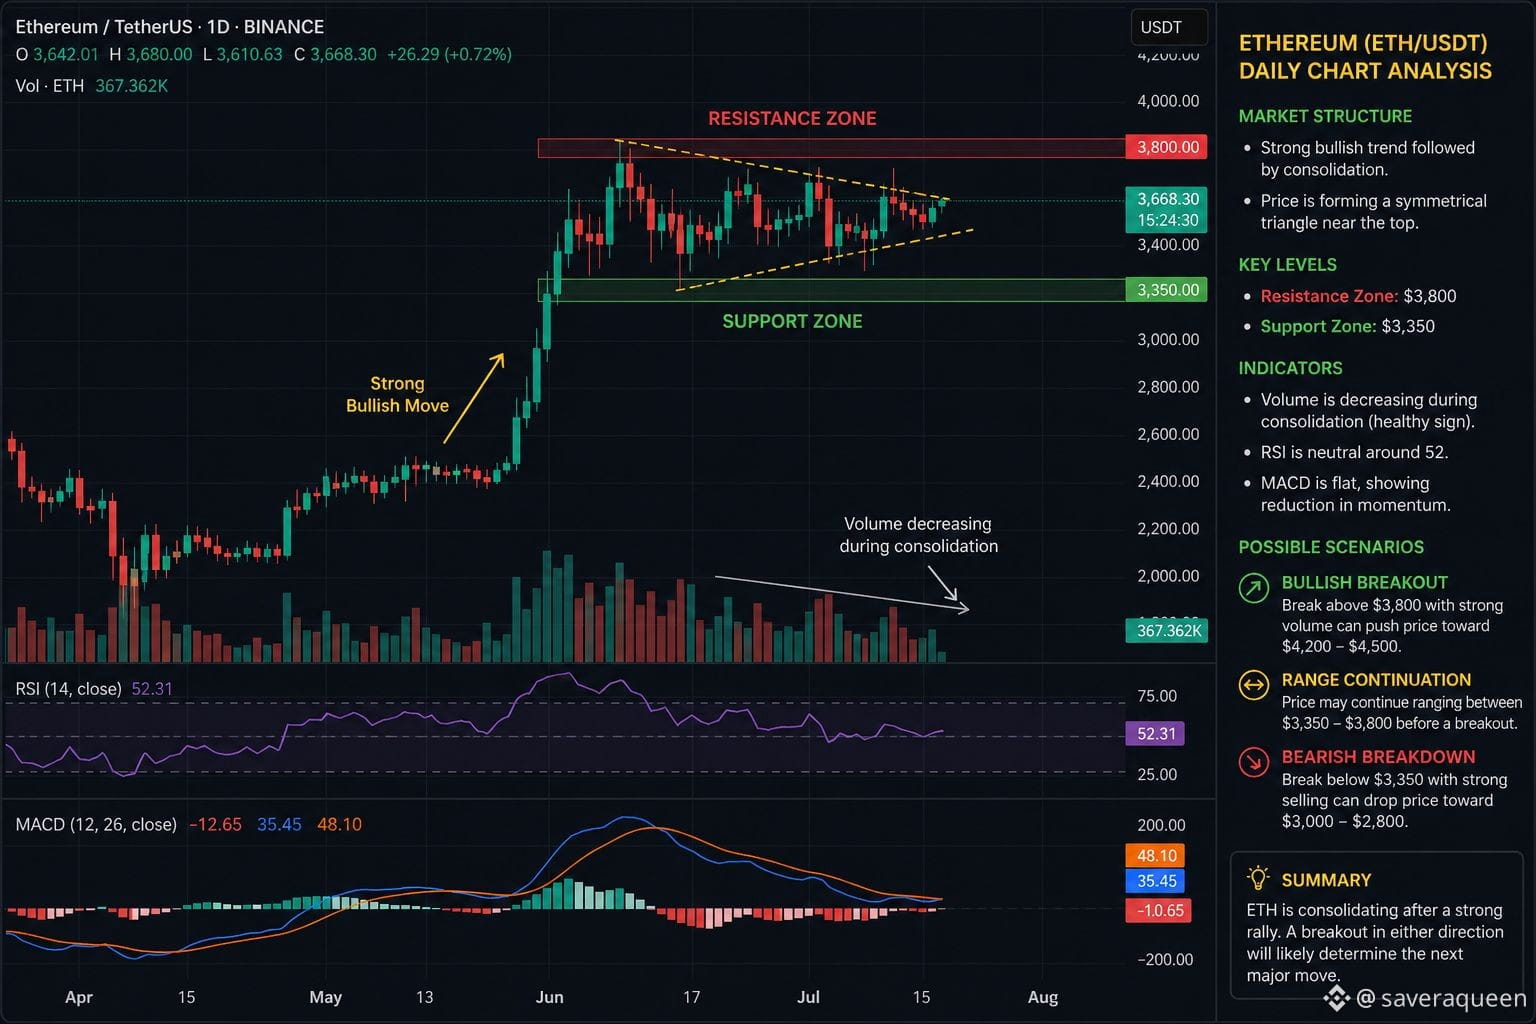
$ETH Ethereum is currently showing consolidation after a recent bullish move, which is often a sign of strength rather than weakness.
On the candlestick chart:
You’ll notice a series of green candles followed by smaller-bodied candles → this suggests momentum slowing but not reversing.
Recent candles have long wicks on both sides, indicating a battle between buyers and sellers.
Price is forming a tight range (sideways movement) — this is typically called accumulation.
🔍 Key Observations:
Support Zone: Buyers are stepping in consistently at lower levels, preventing breakdown.
Resistance Zone: Sellers are defending the upper range, causing rejection wicks.
Volume: If volume decreases during consolidation, it strengthens the case for a breakout soon.
📈 Possible Scenarios:
Bullish Breakout
If ETH breaks above resistance with strong candles (large body, low wicks)
Expect continuation of the uptrend
Fakeout / Liquidity Grab
Price may briefly break a level, then reverse
Common in ranging markets
Bearish Breakdown
If support fails with strong red candles
Could lead to a short-term correction.
$ETH
{spot}(ETHUSDT)
#Ethereum #ETH #TradingStrategies #CandlestickChart #ChartAnalysis
$ETH Ethereum is currently showing consolidation after a recent bullish move, which is often a sign of strength rather than weakness.
On the candlestick chart:
You’ll notice a series of green candles followed by smaller-bodied candles → this suggests momentum slowing but not reversing.
Recent candles have long wicks on both sides, indicating a battle between buyers and sellers.
Price is forming a tight range (sideways movement) — this is typically called accumulation.
🔍 Key Observations:
Support Zone: Buyers are stepping in consistently at lower levels, preventing breakdown.
Resistance Zone: Sellers are defending the upper range, causing rejection wicks.
Volume: If volume decreases during consolidation, it strengthens the case for a breakout soon.
📈 Possible Scenarios:
Bullish Breakout
If ETH breaks above resistance with strong candles (large body, low wicks)
Expect continuation of the uptrend
Fakeout / Liquidity Grab
Price may briefly break a level, then reverse
Common in ranging markets
Bearish Breakdown
If support fails with strong red candles
Could lead to a short-term correction.
$ETH
#Ethereum #ETH #TradingStrategies #CandlestickChart #ChartAnalysis
On the candlestick chart:
You’ll notice a series of green candles followed by smaller-bodied candles → this suggests momentum slowing but not reversing.
Recent candles have long wicks on both sides, indicating a battle between buyers and sellers.
Price is forming a tight range (sideways movement) — this is typically called accumulation.
🔍 Key Observations:
Support Zone: Buyers are stepping in consistently at lower levels, preventing breakdown.
Resistance Zone: Sellers are defending the upper range, causing rejection wicks.
Volume: If volume decreases during consolidation, it strengthens the case for a breakout soon.
📈 Possible Scenarios:
Bullish Breakout
If ETH breaks above resistance with strong candles (large body, low wicks)
Expect continuation of the uptrend
Fakeout / Liquidity Grab
Price may briefly break a level, then reverse
Common in ranging markets
Bearish Breakdown
If support fails with strong red candles
Could lead to a short-term correction.
$ETH
#Ethereum #ETH #TradingStrategies #CandlestickChart #ChartAnalysis
1
124

·
--
Bullish
🚀$BTC Market Analysis Today 🚀
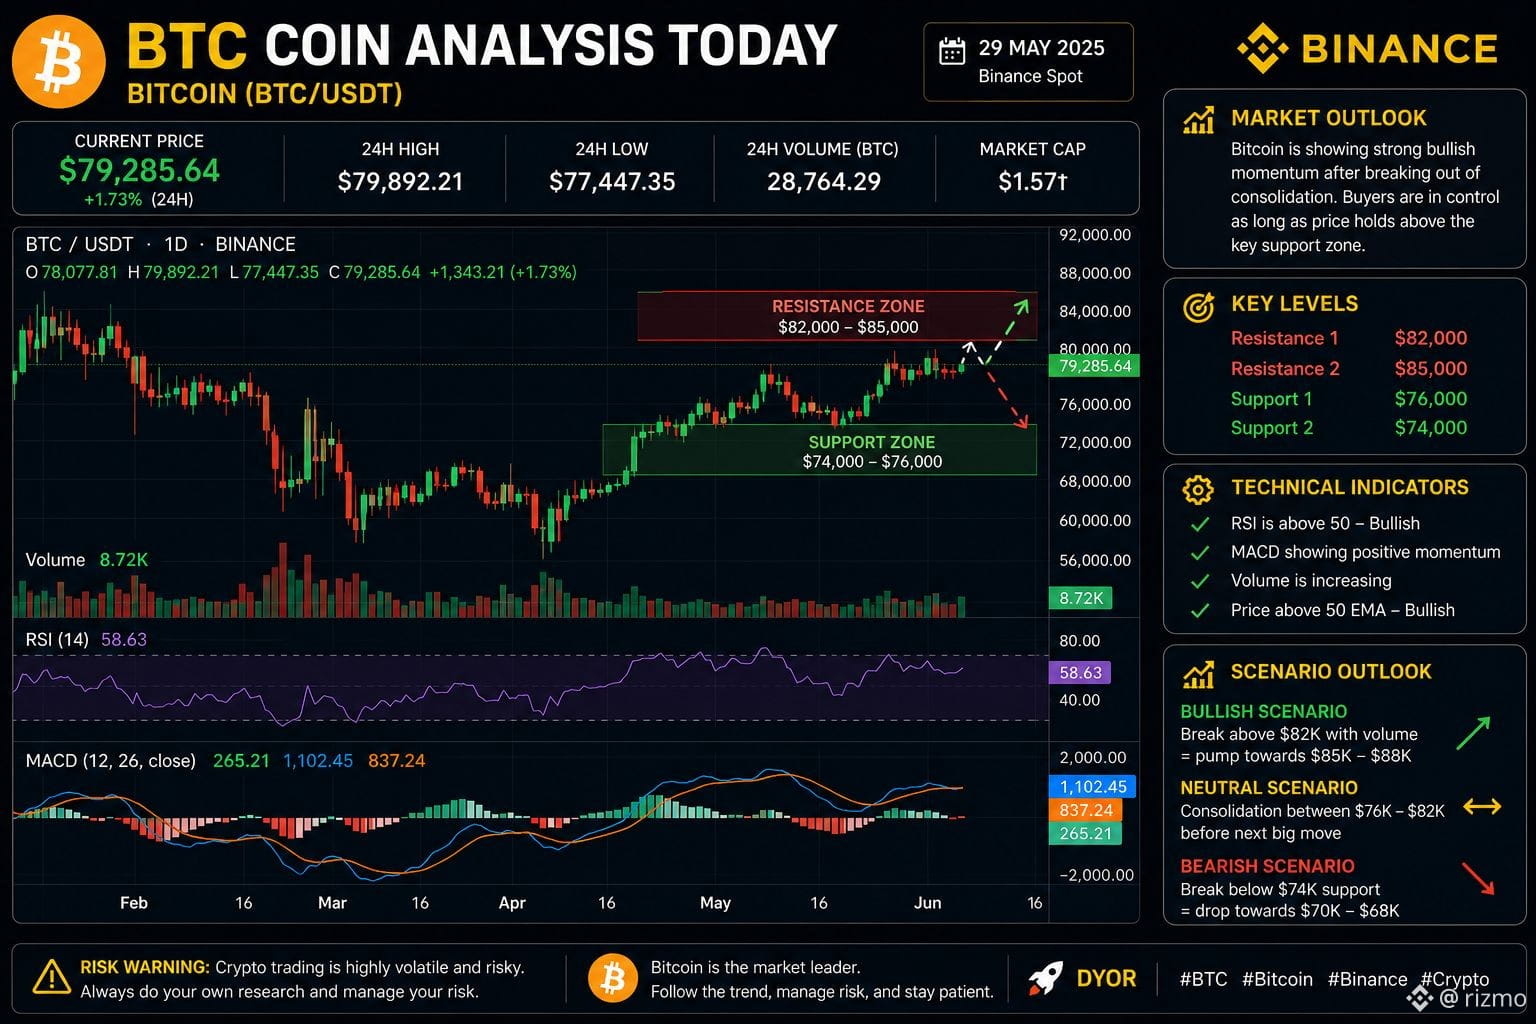
$BTC Bitcoin is currently showing strong market activity with buyers defending important support zones. The candlestick chart indicates bullish momentum building after recent consolidation, while trading volume remains active. 📈
🔹 Current trend: Bullish
🔹 Support zone: Around $74K – $76K
🔹 Resistance zone: $82K – $85K
🔹 RSI is holding above neutral levels
🔹 MACD showing signs of positive momentum
🔹 Volume spikes may trigger the next breakout
If $BTC successfully closes above the resistance zone with strong volume, another upward rally could start soon. However, rejection near resistance may lead to short-term correction before the next move. ⚠️
#BTC #Bitcoin #Crypto #Binance #CryptoTrading #Bullish #BTCUSDT #CandlestickChart
🚀$BTC Market Analysis Today 🚀
$BTC Bitcoin is currently showing strong market activity with buyers defending important support zones. The candlestick chart indicates bullish momentum building after recent consolidation, while trading volume remains active. 📈
🔹 Current trend: Bullish
🔹 Support zone: Around $74K – $76K
🔹 Resistance zone: $82K – $85K
🔹 RSI is holding above neutral levels
🔹 MACD showing signs of positive momentum
🔹 Volume spikes may trigger the next breakout
If $BTC successfully closes above the resistance zone with strong volume, another upward rally could start soon. However, rejection near resistance may lead to short-term correction before the next move. ⚠️
#BTC #Bitcoin #Crypto #Binance #CryptoTrading #Bullish #BTCUSDT #CandlestickChart
$BTC Bitcoin is currently showing strong market activity with buyers defending important support zones. The candlestick chart indicates bullish momentum building after recent consolidation, while trading volume remains active. 📈
🔹 Current trend: Bullish
🔹 Support zone: Around $74K – $76K
🔹 Resistance zone: $82K – $85K
🔹 RSI is holding above neutral levels
🔹 MACD showing signs of positive momentum
🔹 Volume spikes may trigger the next breakout
If $BTC successfully closes above the resistance zone with strong volume, another upward rally could start soon. However, rejection near resistance may lead to short-term correction before the next move. ⚠️
#BTC #Bitcoin #Crypto #Binance #CryptoTrading #Bullish #BTCUSDT #CandlestickChart
1
81
Japanese Candlestick Guide #8
Inverted Hammer Candle
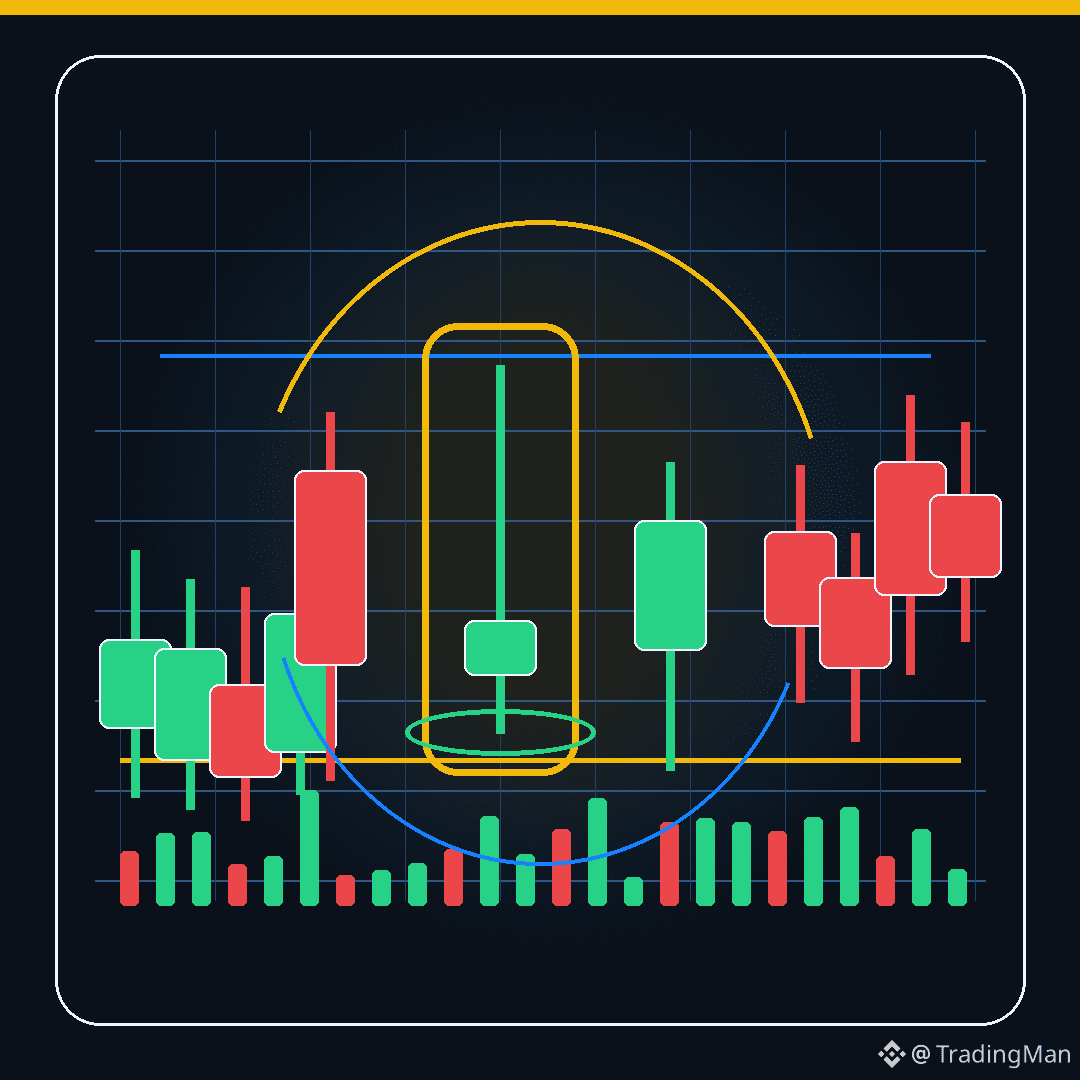
The Inverted Hammer candle often appears after a decline.
Its shape has a small body at the bottom and a long upper shadow.
Its meaning is that buyers tried to push the price up, but they have not gained full control yet.
It is a potential reversal signal, but it needs important confirmation: a bullish candle afterward, or a break of the candle’s high.
Follow up so you get every new update in the trading education series.
Educational content, not financial advice.
#TechnicalAnalysis #TradingBasics #CandlestickChart
Japanese Candlestick Guide #8
Inverted Hammer Candle
The Inverted Hammer candle often appears after a decline.
Its shape has a small body at the bottom and a long upper shadow.
Its meaning is that buyers tried to push the price up, but they have not gained full control yet.
It is a potential reversal signal, but it needs important confirmation: a bullish candle afterward, or a break of the candle’s high.
Follow up so you get every new update in the trading education series.
Educational content, not financial advice.
#TechnicalAnalysis #TradingBasics #CandlestickChart
Inverted Hammer Candle
The Inverted Hammer candle often appears after a decline.
Its shape has a small body at the bottom and a long upper shadow.
Its meaning is that buyers tried to push the price up, but they have not gained full control yet.
It is a potential reversal signal, but it needs important confirmation: a bullish candle afterward, or a break of the candle’s high.
Follow up so you get every new update in the trading education series.
Educational content, not financial advice.
#TechnicalAnalysis #TradingBasics #CandlestickChart
114
Log in to explore more content
Join global crypto users on Binance Square
⚡️ Get latest and useful information about crypto.
💬 Trusted by the world’s largest crypto exchange.
👍 Discover real insights from verified creators.
Email / Phone number
Trending Topics
1
#USAugustPPIRisesLessThanExpected
7,932 views
250 Discussing
2
#SECApprovesNasdaqTexasCommodityTrustRule
6,998 views
265 Discussing
3
#ECBRaisesRatesSecondTimeTo2.5%
4,290 views
181 Discussing
4
#USContinuingJoblessClaims1.774M
10,414 views
286 Discussing
5
#USAugustPPIYoYRisesTo5.4%
9,587 views
224 Discussing
6
#AppleDebutsFoldablePhone
76,995 views
1,290 Discussing
7
#TSMCAugustRevenueUp53.3%YoY
19,195 views
488 Discussing
8
#IranSaysReadyToEscalateWarWithUS
27,716 views
484 Discussing
9
#EUExtendsCentralContactPointToCASPs
23,439 views
491 Discussing
10
#US10YTreasuryYieldHitsHighestSinceNov2023
51,997 views
750 Discussing