
#pyth
pyth
10.7M views
21,123 Discussing
Hot
Latest

·
--
Bullish
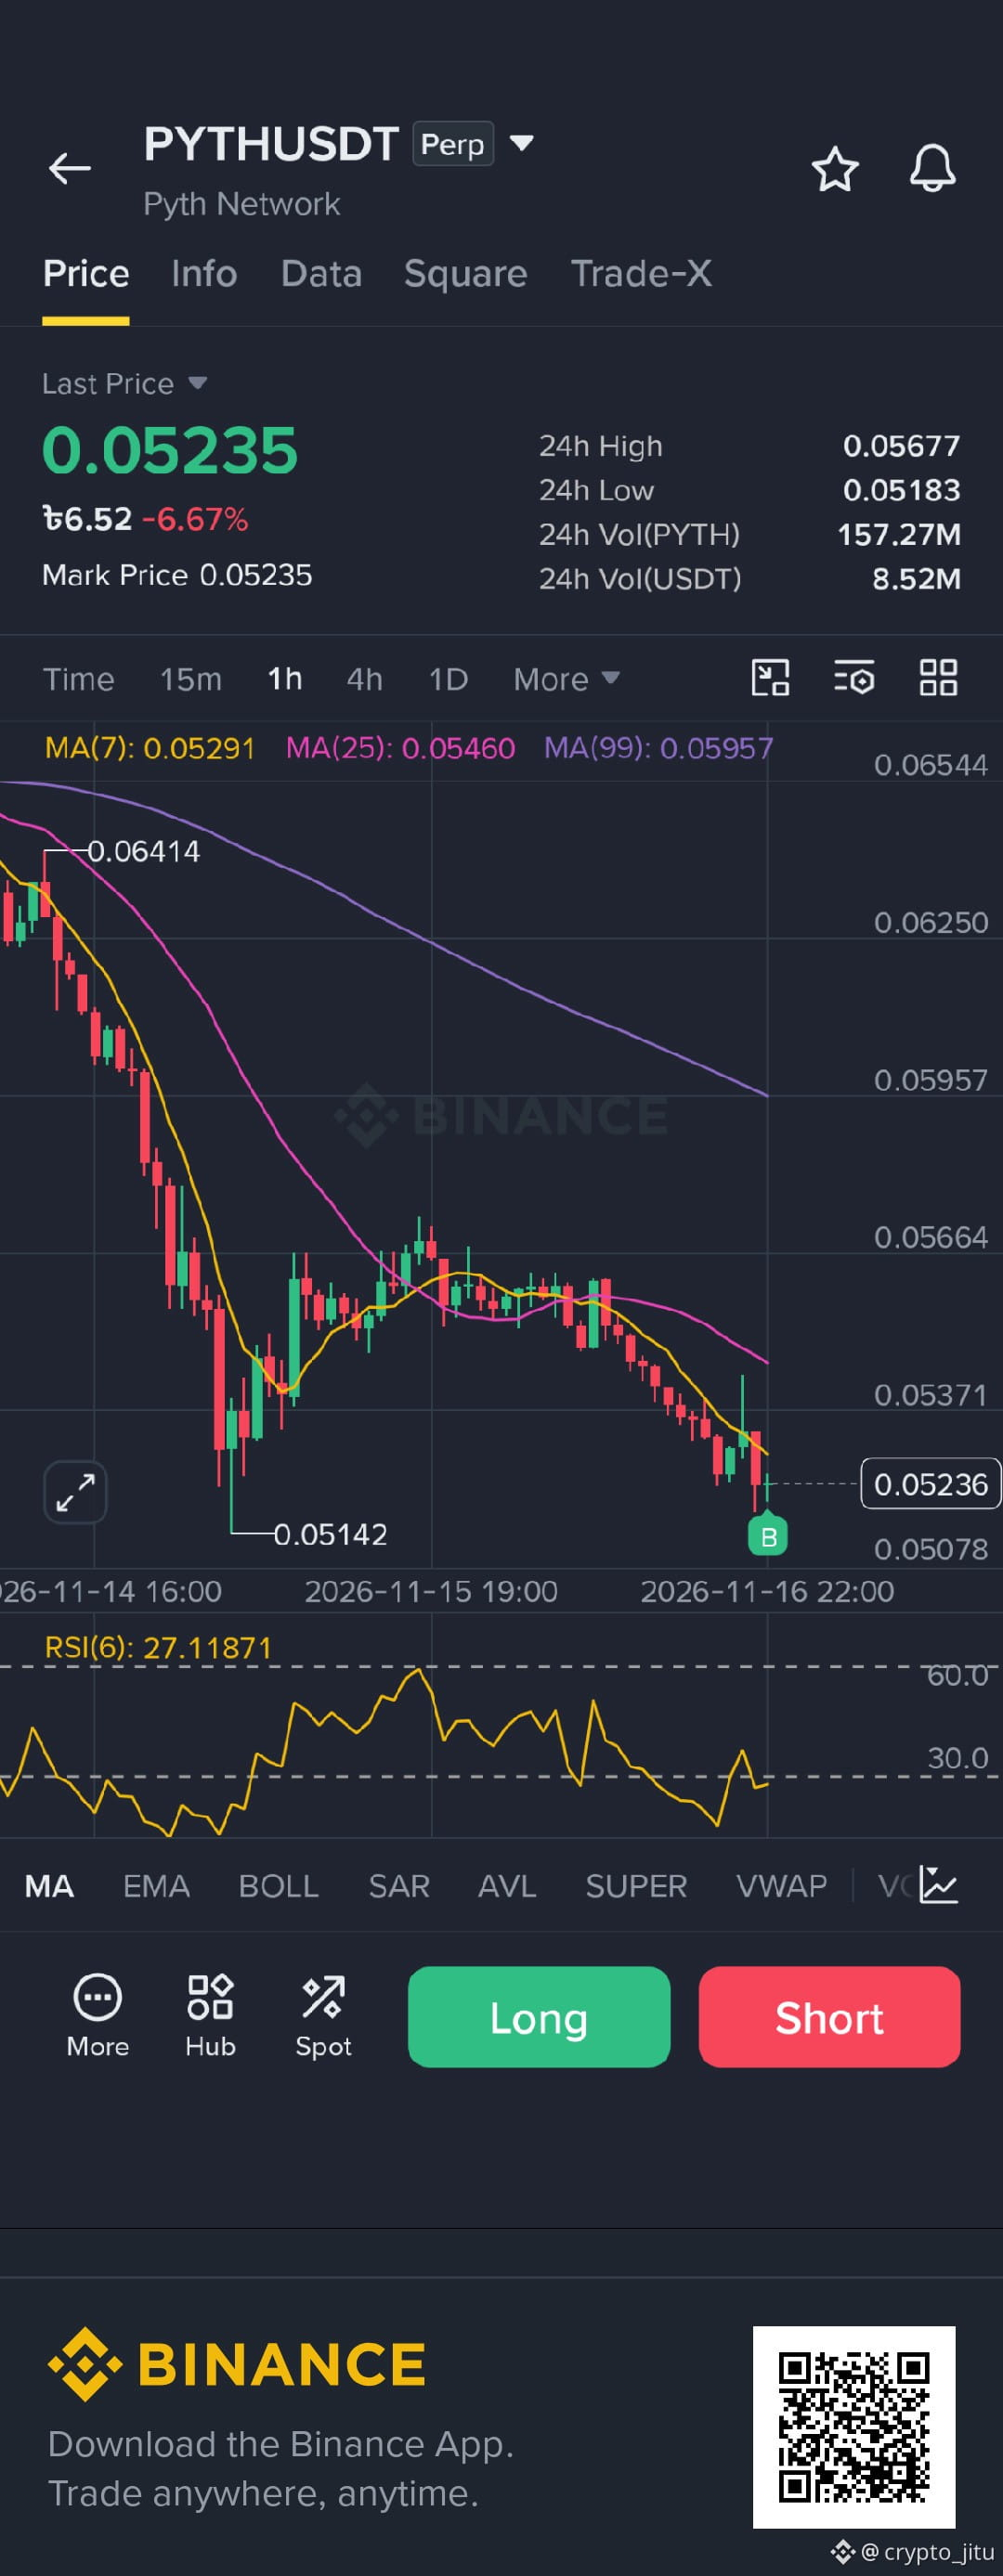
$PYTH Buy Long
TP : 0.05354, 0.05440, 0.05560, 🚀
Stop loss : 0.05175
Leverage: 50x
#PYTH #Crypto #TradingSignal #Long #Binance
Trade here $PYTH 👇
{future}(PYTHUSDT)
$PYTH Buy Long
TP : 0.05354, 0.05440, 0.05560, 🚀
Stop loss : 0.05175
Leverage: 50x
#PYTH #Crypto #TradingSignal #Long #Binance
Trade here $PYTH 👇
TP : 0.05354, 0.05440, 0.05560, 🚀
Stop loss : 0.05175
Leverage: 50x
#PYTH #Crypto #TradingSignal #Long #Binance
Trade here $PYTH 👇
110

·
--
RSI 27 is not a bottom signal: $PYTH still looks like a bleed, not a reversal. ⚠️
Down 7.64% in 24h and 6.3% in the last 4h, sitting at $0.0526 with just $1.38M volume. Ugly.
Volume is only 0.3x its 20d average, price is below both key MAs, and shorts are paying -0.009% funding. That’s crowded bearish positioning, but weak demand can stay weak longer than traders expect.
$ETH stabilizing won’t fix this chart. At $0.05, I’d consider a small speculative entry. Until then, I’m not chasing oversold candles. 🩸
#PYTH #Crypto #Web3
RSI 27 is not a bottom signal: $PYTH still looks like a bleed, not a reversal. ⚠️
Down 7.64% in 24h and 6.3% in the last 4h, sitting at $0.0526 with just $1.38M volume. Ugly.
Volume is only 0.3x its 20d average, price is below both key MAs, and shorts are paying -0.009% funding. That’s crowded bearish positioning, but weak demand can stay weak longer than traders expect.
$ETH stabilizing won’t fix this chart. At $0.05, I’d consider a small speculative entry. Until then, I’m not chasing oversold candles. 🩸
#PYTH #Crypto #Web3
Down 7.64% in 24h and 6.3% in the last 4h, sitting at $0.0526 with just $1.38M volume. Ugly.
Volume is only 0.3x its 20d average, price is below both key MAs, and shorts are paying -0.009% funding. That’s crowded bearish positioning, but weak demand can stay weak longer than traders expect.
$ETH stabilizing won’t fix this chart. At $0.05, I’d consider a small speculative entry. Until then, I’m not chasing oversold candles. 🩸
#PYTH #Crypto #Web3
50

·
--
$PYTH is down 1% and someone is selling it right into your hands
Most traders chase the greenest candle on the board without looking at the mechanics
They buy the top gainer assuming momentum keeps running forever
Someone has to be on the other side of that market order taking profit
Right now $PYTH sits at $0.05528 which is near the very bottom of its 16 percent daily range
Volume is dead at zero point four times the average meaning no fresh capital is backing the move
When you buy a dead range you are just exiting someone else who got stuck higher up
The 7 day high of $0.07034 is twenty one percent away and nobody is stepping up to bridge that gap
Wait for volume to return before you commit any capital to a stagnant chart
What is your personal rule for avoiding low volume traps
#PYTH #TradingTips
$PYTH is down 1% and someone is selling it right into your hands
Most traders chase the greenest candle on the board without looking at the mechanics
They buy the top gainer assuming momentum keeps running forever
Someone has to be on the other side of that market order taking profit
Right now $PYTH sits at $0.05528 which is near the very bottom of its 16 percent daily range
Volume is dead at zero point four times the average meaning no fresh capital is backing the move
When you buy a dead range you are just exiting someone else who got stuck higher up
The 7 day high of $0.07034 is twenty one percent away and nobody is stepping up to bridge that gap
Wait for volume to return before you commit any capital to a stagnant chart
What is your personal rule for avoiding low volume traps
#PYTH #TradingTips
Most traders chase the greenest candle on the board without looking at the mechanics
They buy the top gainer assuming momentum keeps running forever
Someone has to be on the other side of that market order taking profit
Right now $PYTH sits at $0.05528 which is near the very bottom of its 16 percent daily range
Volume is dead at zero point four times the average meaning no fresh capital is backing the move
When you buy a dead range you are just exiting someone else who got stuck higher up
The 7 day high of $0.07034 is twenty one percent away and nobody is stepping up to bridge that gap
Wait for volume to return before you commit any capital to a stagnant chart
What is your personal rule for avoiding low volume traps
#PYTH #TradingTips
13


·
--
Bullish
Verified
Come meet the Pyth team at Solana Breakpoint 🇬🇧
Our first price feeds went live on Solana in 2021.
If you’re at Olympia London, stop by the Pyth booth to talk market data and tell us what you’re building.
You can take a few putts while you’re there ⛳️
#solana #Breakpoint #pyth
Come meet the Pyth team at Solana Breakpoint 🇬🇧
Our first price feeds went live on Solana in 2021.
If you’re at Olympia London, stop by the Pyth booth to talk market data and tell us what you’re building.
You can take a few putts while you’re there ⛳️
#solana #Breakpoint #pyth
Our first price feeds went live on Solana in 2021.
If you’re at Olympia London, stop by the Pyth booth to talk market data and tell us what you’re building.
You can take a few putts while you’re there ⛳️
#solana #Breakpoint #pyth

物极必反:
我认真算过了你们的下跌投资都能赚钱,你们分阶段倍数下跌了6次,每次的下跌都有回调,回调后都能赚钱,所以每次回调后都会继续下跌。1-0.5-0.25-0.1225-0.06125-0.0305125总共这六次下跌每次回调都能赚钱并且让币价一直下跌,我在想你还有没有第七次0.015你要这样玩我真的很心寒。
1
13
14.7k

·
--
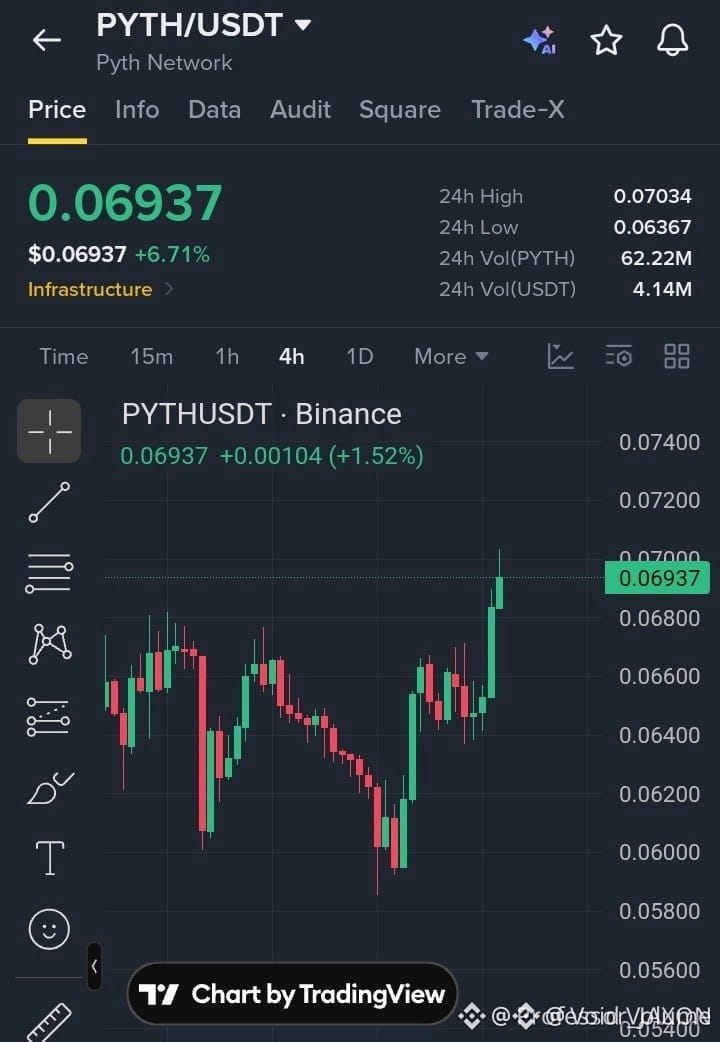
$PYTH BREAKS CONSOLIDATION AS INSTITUTIONAL BUYERS FLIP RESISTANCE TO SUPPORT 🚀
Entry: 0.06800–0.06900 ⚡
Target: 0.07100–0.07500 🚀
Stop Loss: 0.06600 ⚠️
Institutional order flow on the four-hour timeframe reveals aggressive absorption following a decisive range break. 📊 Buyers are stepping in to defend the newly claimed structural pivot, turning prior supply into a clean demand zone. ⚡
A measured retest of the current accumulation shelf offers an optimal entry profile before momentum expands toward higher liquidity pools. 💡 Are you positioning for this continuation or waiting for confirmation above the highs? 👇
⚠️ Not financial advice. Always manage your risk. 🛡️
🏷️ #PYTH #LongSetup #Breakout #Crypto
🔥 🦈
$PYTH BREAKS CONSOLIDATION AS INSTITUTIONAL BUYERS FLIP RESISTANCE TO SUPPORT 🚀
Entry: 0.06800–0.06900 ⚡
Target: 0.07100–0.07500 🚀
Stop Loss: 0.06600 ⚠️
Institutional order flow on the four-hour timeframe reveals aggressive absorption following a decisive range break. 📊 Buyers are stepping in to defend the newly claimed structural pivot, turning prior supply into a clean demand zone. ⚡
A measured retest of the current accumulation shelf offers an optimal entry profile before momentum expands toward higher liquidity pools. 💡 Are you positioning for this continuation or waiting for confirmation above the highs? 👇
⚠️ Not financial advice. Always manage your risk. 🛡️
🏷️ #PYTH #LongSetup #Breakout #Crypto
🔥 🦈
Entry: 0.06800–0.06900 ⚡
Target: 0.07100–0.07500 🚀
Stop Loss: 0.06600 ⚠️
Institutional order flow on the four-hour timeframe reveals aggressive absorption following a decisive range break. 📊 Buyers are stepping in to defend the newly claimed structural pivot, turning prior supply into a clean demand zone. ⚡
A measured retest of the current accumulation shelf offers an optimal entry profile before momentum expands toward higher liquidity pools. 💡 Are you positioning for this continuation or waiting for confirmation above the highs? 👇
⚠️ Not financial advice. Always manage your risk. 🛡️
🏷️ #PYTH #LongSetup #Breakout #Crypto
🔥 🦈
9

·
--
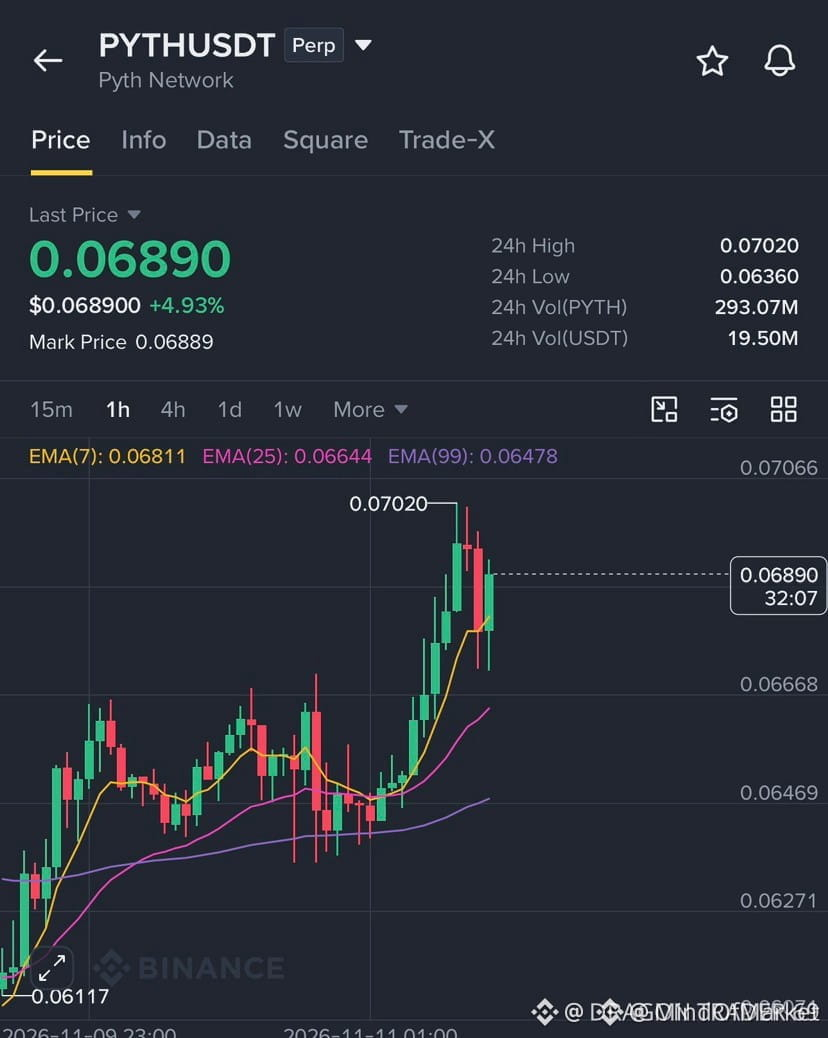
🦈 $PYTH NEARING A PRISTINE INSTITUTIONAL ACCUMULATION ZONE BEFORE THE NEXT EXPANSION! ⚡
Entry: 0.0685 - 0.0690 ⚡
Target: 0.0750 🚀
Stop Loss: 0.0665 ⚠️
Smart money is gently absorbing sell-side liquidity inside this clean demand block, printing a textbook retest of previous structural highs. 🌊
Order flow indicators show decreasing retail panic while institutional resting orders stack neatly below the range. 📊
Risk-to-reward dynamics look exceptionally clean for a measured upside push toward overhead liquidity pools. 💡 Are you scaling into this demand zone or waiting for a confirmed volume breakout? 👇
⚠️ Not financial advice. Always manage your risk. 🛡️
🏷️ #PYTH #SmartMoney #LongSetup #Crypto #OrderFlow
🦈 💎
🦈 $PYTH NEARING A PRISTINE INSTITUTIONAL ACCUMULATION ZONE BEFORE THE NEXT EXPANSION! ⚡
Entry: 0.0685 - 0.0690 ⚡
Target: 0.0750 🚀
Stop Loss: 0.0665 ⚠️
Smart money is gently absorbing sell-side liquidity inside this clean demand block, printing a textbook retest of previous structural highs. 🌊
Order flow indicators show decreasing retail panic while institutional resting orders stack neatly below the range. 📊
Risk-to-reward dynamics look exceptionally clean for a measured upside push toward overhead liquidity pools. 💡 Are you scaling into this demand zone or waiting for a confirmed volume breakout? 👇
⚠️ Not financial advice. Always manage your risk. 🛡️
🏷️ #PYTH #SmartMoney #LongSetup #Crypto #OrderFlow
🦈 💎
Entry: 0.0685 - 0.0690 ⚡
Target: 0.0750 🚀
Stop Loss: 0.0665 ⚠️
Smart money is gently absorbing sell-side liquidity inside this clean demand block, printing a textbook retest of previous structural highs. 🌊
Order flow indicators show decreasing retail panic while institutional resting orders stack neatly below the range. 📊
Risk-to-reward dynamics look exceptionally clean for a measured upside push toward overhead liquidity pools. 💡 Are you scaling into this demand zone or waiting for a confirmed volume breakout? 👇
⚠️ Not financial advice. Always manage your risk. 🛡️
🏷️ #PYTH #SmartMoney #LongSetup #Crypto #OrderFlow
🦈 💎
4
·
--
🦈 $PYTH SECURING INSTITUTIONAL ORDER FLOW ACROSS 3.25T IN CUMULATIVE VOLUME! ⚡
Smart money footprints rely entirely on razor-sharp infrastructure, and $PYTH is anchoring the institutional data layer across 125+ publishers. 📊 As 24/7 onchain markets absorb multi-trillion-dollar liquidity, real-time settlement accuracy becomes the ultimate moat for high-frequency execution. 🌊
With over 3.25 trillion in secured volume and 710 enterprise integrations, this network is rapidly capturing the structural backbone of decentralized finance. 💡 Are you tracking infrastructural data providers as foundational alpha sources for upcoming market expansions? 👇
⚠️ Not financial advice. Always manage your risk. 🛡️
🏷️ #PYTH #SmartMoney #OnchainData #DeFi #Crypto
🔥 💎
🦈 $PYTH SECURING INSTITUTIONAL ORDER FLOW ACROSS 3.25T IN CUMULATIVE VOLUME! ⚡
Smart money footprints rely entirely on razor-sharp infrastructure, and $PYTH is anchoring the institutional data layer across 125+ publishers. 📊 As 24/7 onchain markets absorb multi-trillion-dollar liquidity, real-time settlement accuracy becomes the ultimate moat for high-frequency execution. 🌊
With over 3.25 trillion in secured volume and 710 enterprise integrations, this network is rapidly capturing the structural backbone of decentralized finance. 💡 Are you tracking infrastructural data providers as foundational alpha sources for upcoming market expansions? 👇
⚠️ Not financial advice. Always manage your risk. 🛡️
🏷️ #PYTH #SmartMoney #OnchainData #DeFi #Crypto
🔥 💎
Smart money footprints rely entirely on razor-sharp infrastructure, and $PYTH is anchoring the institutional data layer across 125+ publishers. 📊 As 24/7 onchain markets absorb multi-trillion-dollar liquidity, real-time settlement accuracy becomes the ultimate moat for high-frequency execution. 🌊
With over 3.25 trillion in secured volume and 710 enterprise integrations, this network is rapidly capturing the structural backbone of decentralized finance. 💡 Are you tracking infrastructural data providers as foundational alpha sources for upcoming market expansions? 👇
⚠️ Not financial advice. Always manage your risk. 🛡️
🏷️ #PYTH #SmartMoney #OnchainData #DeFi #Crypto
🔥 💎

10

·
--
Bearish
$PYTH is retesting a key support zone around *$0.059 – $0.063* after the recent pullback.
If this area holds and bullish momentum starts coming back, the resistance levels to watch are near *$0.072*, *$0.094*, and *$0.101*, with *$0.112* as the projected upside target.
Wait for confirmation and keep your risk management tight before making any trading decisions.
NFA – This is not financial advice.
#PythNetwork #PYTH
{future}(PYTHUSDT)
$PYTH is retesting a key support zone around *$0.059 – $0.063* after the recent pullback.
If this area holds and bullish momentum starts coming back, the resistance levels to watch are near *$0.072*, *$0.094*, and *$0.101*, with *$0.112* as the projected upside target.
Wait for confirmation and keep your risk management tight before making any trading decisions.
NFA – This is not financial advice.
#PythNetwork #PYTH
If this area holds and bullish momentum starts coming back, the resistance levels to watch are near *$0.072*, *$0.094*, and *$0.101*, with *$0.112* as the projected upside target.
Wait for confirmation and keep your risk management tight before making any trading decisions.
NFA – This is not financial advice.
#PythNetwork #PYTH
2
527

$PYTH: Macro Liquidity Versus Micro Bursts in PYTH
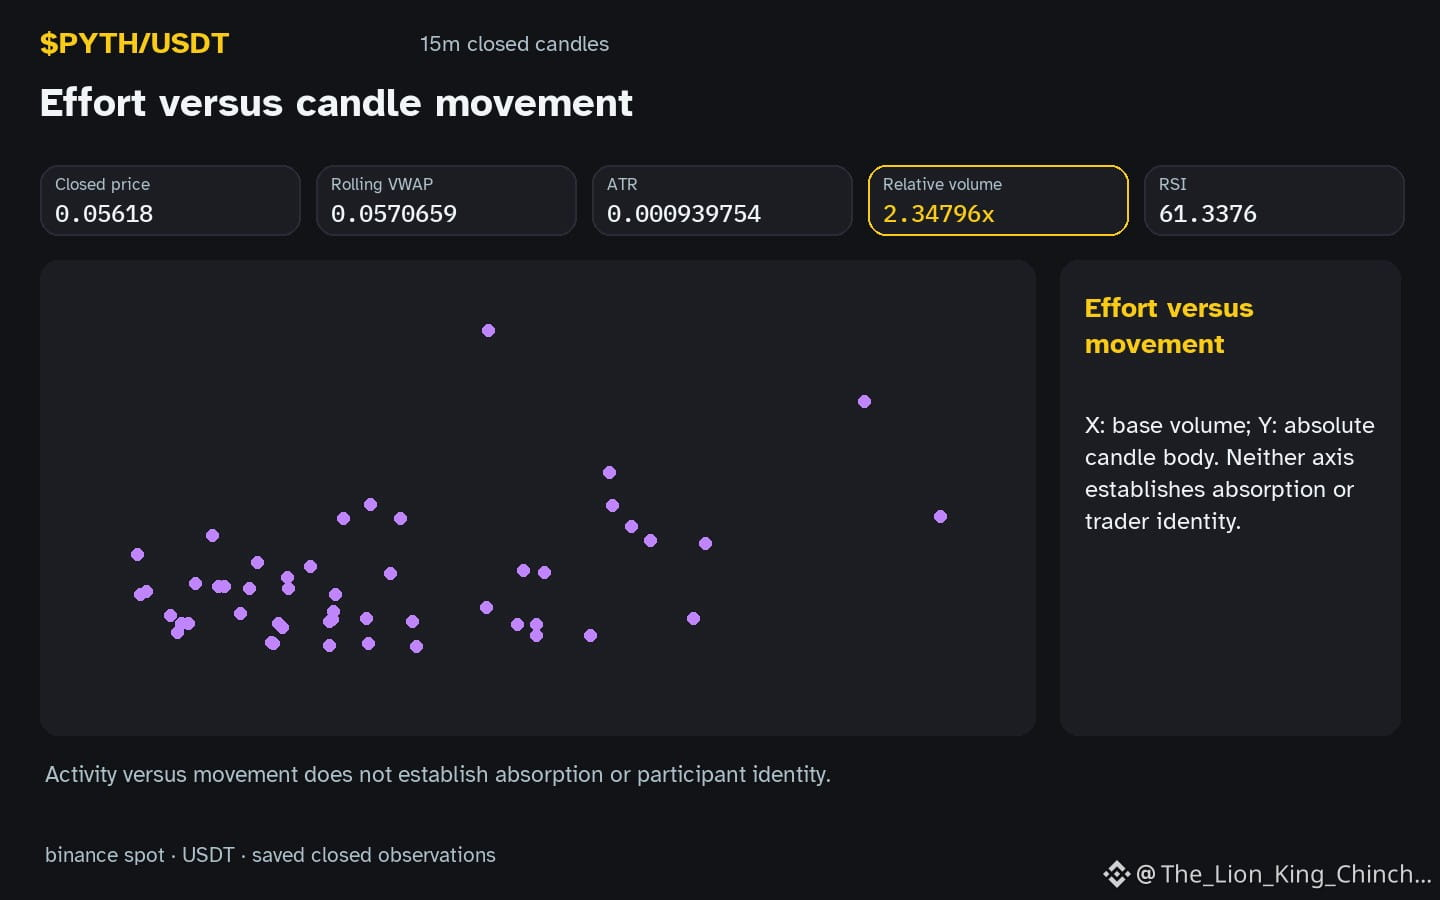
Consider $PYTH showing hourly direction up with volume above baseline. Does 2.35x baseline measure broad market liquidity or a short participation burst? The clue is that relative volume compares current activity to preceding candles. It does not reveal total market capitalization or institutional flow. An alternative reading treats the spike as a micro event. This could happen while macro liquidity remains stable elsewhere. Price may reflect local demand rather than a sector-wide shift. Candles alone cannot confirm causation between these scales. A counterexample would show $PYTH volume rising while peer assets remain quiet. This weakens the macro linkage hypothesis. Conversely, if peers also show elevated volume, the micro burst interpretation gains context. RSI 61.3 helps gauge momentum speed but does not measure liquidity depth. The support level at 0.05152 represents a local bar bound. It is not a global floor validated by macro data. A self-check asks whether the volume surge aligns with a specific time window. If the burst fades without price continuation, the micro explanation holds more weight. If price consolidates near resistance 0.05622 despite high volume, the macro thesis weakens. Reassess when the next closed candle shows volume returning to baseline. If that candle closes below 0.05152, the burst was likely noise. If it holds above 0.05152, the interpretation remains open. This approach distinguishes temporary activity from sustained interest. It avoids assuming hidden motives behind the trade size. The thought experiment holds value as a framework for comparing scales. It reminds us that volume ratios are relative, not absolute measures of asset strength.
Probabilistic market research, not a recommendation or guaranteed return.
The comparison to keep in mind: $ETH has hourly direction up and volume above its baseline; $BANANAS31 has hourly direction up and volume above its baseline. This alone does not establish correlation.
#PYTH #ETH
$PYTH : Macro Liquidity Versus Micro Bursts in PYTH
Consider $PYTH showing hourly direction up with volume above baseline. Does 2.35x baseline measure broad market liquidity or a short participation burst? The clue is that relative volume compares current activity to preceding candles. It does not reveal total market capitalization or institutional flow. An alternative reading treats the spike as a micro event. This could happen while macro liquidity remains stable elsewhere. Price may reflect local demand rather than a sector-wide shift. Candles alone cannot confirm causation between these scales. A counterexample would show $PYTH volume rising while peer assets remain quiet. This weakens the macro linkage hypothesis. Conversely, if peers also show elevated volume, the micro burst interpretation gains context. RSI 61.3 helps gauge momentum speed but does not measure liquidity depth. The support level at 0.05152 represents a local bar bound. It is not a global floor validated by macro data. A self-check asks whether the volume surge aligns with a specific time window. If the burst fades without price continuation, the micro explanation holds more weight. If price consolidates near resistance 0.05622 despite high volume, the macro thesis weakens. Reassess when the next closed candle shows volume returning to baseline. If that candle closes below 0.05152, the burst was likely noise. If it holds above 0.05152, the interpretation remains open. This approach distinguishes temporary activity from sustained interest. It avoids assuming hidden motives behind the trade size. The thought experiment holds value as a framework for comparing scales. It reminds us that volume ratios are relative, not absolute measures of asset strength.
Probabilistic market research, not a recommendation or guaranteed return.
The comparison to keep in mind: $ETH has hourly direction up and volume above its baseline; $BANANAS31 has hourly direction up and volume above its baseline. This alone does not establish correlation.
#PYTH #ETH
Consider $PYTH showing hourly direction up with volume above baseline. Does 2.35x baseline measure broad market liquidity or a short participation burst? The clue is that relative volume compares current activity to preceding candles. It does not reveal total market capitalization or institutional flow. An alternative reading treats the spike as a micro event. This could happen while macro liquidity remains stable elsewhere. Price may reflect local demand rather than a sector-wide shift. Candles alone cannot confirm causation between these scales. A counterexample would show $PYTH volume rising while peer assets remain quiet. This weakens the macro linkage hypothesis. Conversely, if peers also show elevated volume, the micro burst interpretation gains context. RSI 61.3 helps gauge momentum speed but does not measure liquidity depth. The support level at 0.05152 represents a local bar bound. It is not a global floor validated by macro data. A self-check asks whether the volume surge aligns with a specific time window. If the burst fades without price continuation, the micro explanation holds more weight. If price consolidates near resistance 0.05622 despite high volume, the macro thesis weakens. Reassess when the next closed candle shows volume returning to baseline. If that candle closes below 0.05152, the burst was likely noise. If it holds above 0.05152, the interpretation remains open. This approach distinguishes temporary activity from sustained interest. It avoids assuming hidden motives behind the trade size. The thought experiment holds value as a framework for comparing scales. It reminds us that volume ratios are relative, not absolute measures of asset strength.
Probabilistic market research, not a recommendation or guaranteed return.
The comparison to keep in mind: $ETH has hourly direction up and volume above its baseline; $BANANAS31 has hourly direction up and volume above its baseline. This alone does not establish correlation.
#PYTH #ETH
64

·
--
$PYTH #PYTH If the rebound can't hold, don't force a bottom-fishing entry—the bearish momentum is still intact.
K-line timeframe: 1h
My bias: Bearish (trade with the trend only; don't fight it on emotion)
$PYTH #PYTH Execution: Short the rebound; wait for confirmation at key levels before increasing position size.
Core rationale: 1) PYTHUSDT is down 7.178% over 24h, with a current price of about 0.052500 and 24h trading volume of about 6.83M; 2) The 1h close fell from 0.052530 to 0.052500, and the primary timeframe is still weakening. 3) The 4h close fell from 0.053220 to 0.052500; current open interest is about 103.84M, and the funding rate is about -0.0108%. The rebound looks more like an opportunity for bears.
Risk control: If the 1h price gets back above 0.052700, the bearish bias is invalidated.
$PYTH #PYTH Bottom line: The direction is clear; execution depends on discipline. For reference only; this is not investment advice.
$PYTH #PYTH If the rebound can't hold, don't force a bottom-fishing entry—the bearish momentum is still intact.
K-line timeframe: 1h
My bias: Bearish (trade with the trend only; don't fight it on emotion)
$PYTH #PYTH Execution: Short the rebound; wait for confirmation at key levels before increasing position size.
Core rationale: 1) PYTHUSDT is down 7.178% over 24h, with a current price of about 0.052500 and 24h trading volume of about 6.83M; 2) The 1h close fell from 0.052530 to 0.052500, and the primary timeframe is still weakening. 3) The 4h close fell from 0.053220 to 0.052500; current open interest is about 103.84M, and the funding rate is about -0.0108%. The rebound looks more like an opportunity for bears.
Risk control: If the 1h price gets back above 0.052700, the bearish bias is invalidated.
$PYTH #PYTH Bottom line: The direction is clear; execution depends on discipline. For reference only; this is not investment advice.
K-line timeframe: 1h
My bias: Bearish (trade with the trend only; don't fight it on emotion)
$PYTH #PYTH Execution: Short the rebound; wait for confirmation at key levels before increasing position size.
Core rationale: 1) PYTHUSDT is down 7.178% over 24h, with a current price of about 0.052500 and 24h trading volume of about 6.83M; 2) The 1h close fell from 0.052530 to 0.052500, and the primary timeframe is still weakening. 3) The 4h close fell from 0.053220 to 0.052500; current open interest is about 103.84M, and the funding rate is about -0.0108%. The rebound looks more like an opportunity for bears.
Risk control: If the 1h price gets back above 0.052700, the bearish bias is invalidated.
$PYTH #PYTH Bottom line: The direction is clear; execution depends on discipline. For reference only; this is not investment advice.
248
·
--
$PYTH #PYTH Longs and shorts haven't fully committed yet, so don't chase recklessly in the middle.
Candlestick timeframe: 1h
My direction: Wait and see (only trade with the trend; don't go head-to-head with market sentiment)
$PYTH #PYTH Execution: Wait for confirmation first; increase position only after a key level is confirmed.
Key rationale: 1) PYTHUSDT 24h change: -6.043%, current price around 0.052410, 24h trading volume around 8.65M; 2) The main timeframe and 4h timeframe have not formed a confluence in the same direction. 3) The 4h close moved from 0.052320 to 0.052400, current open interest is around 106.51M, and the funding rate is around -0.0055%.
Risk control: If the 1h price falls back below 0.052660 again, don't rush into a trade.
$PYTH #PYTH In closing: The direction is clear; execution depends on discipline. For reference only; this is not investment advice.
$PYTH #PYTH Longs and shorts haven't fully committed yet, so don't chase recklessly in the middle.
Candlestick timeframe: 1h
My direction: Wait and see (only trade with the trend; don't go head-to-head with market sentiment)
$PYTH #PYTH Execution: Wait for confirmation first; increase position only after a key level is confirmed.
Key rationale: 1) PYTHUSDT 24h change: -6.043%, current price around 0.052410, 24h trading volume around 8.65M; 2) The main timeframe and 4h timeframe have not formed a confluence in the same direction. 3) The 4h close moved from 0.052320 to 0.052400, current open interest is around 106.51M, and the funding rate is around -0.0055%.
Risk control: If the 1h price falls back below 0.052660 again, don't rush into a trade.
$PYTH #PYTH In closing: The direction is clear; execution depends on discipline. For reference only; this is not investment advice.
Candlestick timeframe: 1h
My direction: Wait and see (only trade with the trend; don't go head-to-head with market sentiment)
$PYTH #PYTH Execution: Wait for confirmation first; increase position only after a key level is confirmed.
Key rationale: 1) PYTHUSDT 24h change: -6.043%, current price around 0.052410, 24h trading volume around 8.65M; 2) The main timeframe and 4h timeframe have not formed a confluence in the same direction. 3) The 4h close moved from 0.052320 to 0.052400, current open interest is around 106.51M, and the funding rate is around -0.0055%.
Risk control: If the 1h price falls back below 0.052660 again, don't rush into a trade.
$PYTH #PYTH In closing: The direction is clear; execution depends on discipline. For reference only; this is not investment advice.
135

·
--
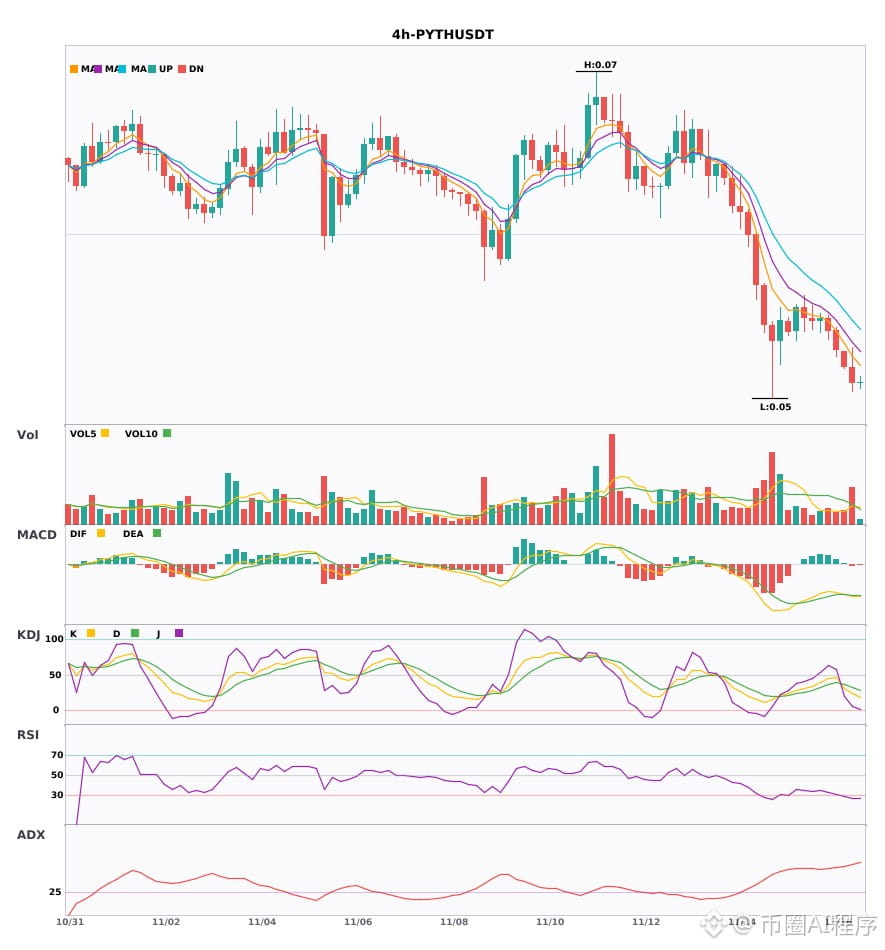
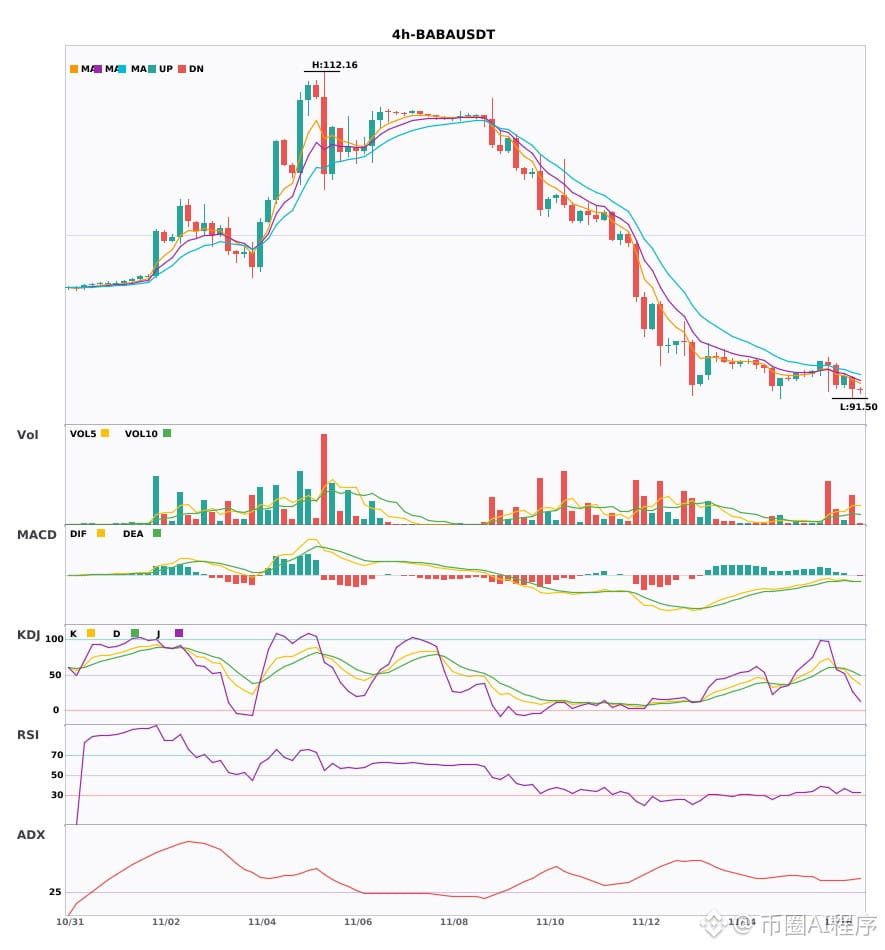
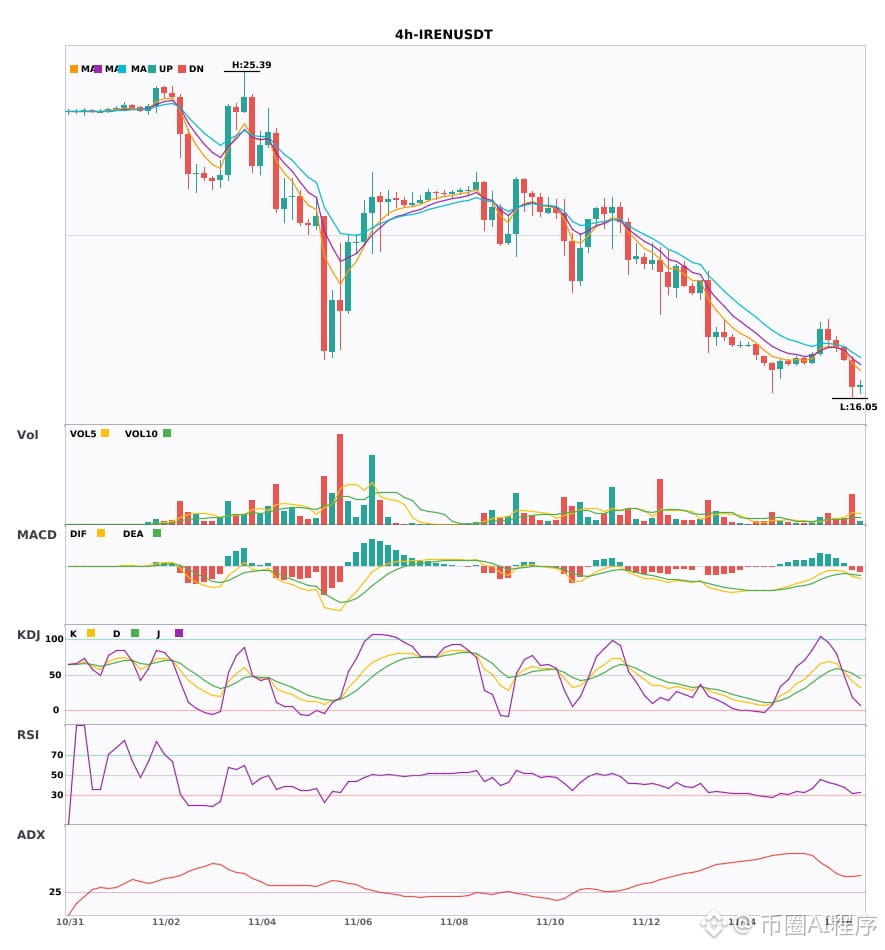
4-hour and daily charts are both decisively bearish—bearish signals are aligned across 3 coins 🔥
════════════════════
🟢 $PYTH 4-hour bearish signal
⚠️ Technical analysis: Multi-timeframe alignment: daily bearish + 4-hour bearish confirmation! MACD has formed a death cross, with expanding green bars. Moving averages are bearishly aligned and diverging downward. KDJ is weak (K23.7 D32.5), with volume up 1.8x.
════════════════════
🟢 $BABA 4-hour bearish signal
⚠️ Technical analysis: Daily bearish + 4-hour alignment confirmed! MACD has formed a death cross below zero on rising volume. Moving averages are bearishly aligned and diverging downward. Volume has surged 2.6x, and bearish momentum is accelerating.
════════════════════
🟢 $IREN 4-hour bearish signal
⚠️ Technical analysis: 4-hour bearish entry + daily bearish alignment confirmed. Multi-timeframe signals align to the downside. MACD has formed a death cross below zero on rising volume. Moving averages are bearishly aligned and diverging downward, with volume surging 4.1x.
════════════════════
🔔 Follow for first-hand market alerts 🔔
#多周期共振 #PYTH #BABA #IREN
📌 When trading, check whether the candlestick pattern confirms the setup
4-hour and daily charts are both decisively bearish—bearish signals are aligned across 3 coins 🔥
════════════════════
🟢 $PYTH 4-hour bearish signal
⚠️ Technical analysis: Multi-timeframe alignment: daily bearish + 4-hour bearish confirmation! MACD has formed a death cross, with expanding green bars. Moving averages are bearishly aligned and diverging downward. KDJ is weak (K23.7 D32.5), with volume up 1.8x.
════════════════════
🟢 $BABA 4-hour bearish signal
⚠️ Technical analysis: Daily bearish + 4-hour alignment confirmed! MACD has formed a death cross below zero on rising volume. Moving averages are bearishly aligned and diverging downward. Volume has surged 2.6x, and bearish momentum is accelerating.
════════════════════
🟢 $IREN 4-hour bearish signal
⚠️ Technical analysis: 4-hour bearish entry + daily bearish alignment confirmed. Multi-timeframe signals align to the downside. MACD has formed a death cross below zero on rising volume. Moving averages are bearishly aligned and diverging downward, with volume surging 4.1x.
════════════════════
🔔 Follow for first-hand market alerts 🔔
#多周期共振 #PYTH #BABA #IREN
📌 When trading, check whether the candlestick pattern confirms the setup
════════════════════
🟢 $PYTH 4-hour bearish signal
⚠️ Technical analysis: Multi-timeframe alignment: daily bearish + 4-hour bearish confirmation! MACD has formed a death cross, with expanding green bars. Moving averages are bearishly aligned and diverging downward. KDJ is weak (K23.7 D32.5), with volume up 1.8x.
════════════════════
🟢 $BABA 4-hour bearish signal
⚠️ Technical analysis: Daily bearish + 4-hour alignment confirmed! MACD has formed a death cross below zero on rising volume. Moving averages are bearishly aligned and diverging downward. Volume has surged 2.6x, and bearish momentum is accelerating.
════════════════════
🟢 $IREN 4-hour bearish signal
⚠️ Technical analysis: 4-hour bearish entry + daily bearish alignment confirmed. Multi-timeframe signals align to the downside. MACD has formed a death cross below zero on rising volume. Moving averages are bearishly aligned and diverging downward, with volume surging 4.1x.
════════════════════
🔔 Follow for first-hand market alerts 🔔
#多周期共振 #PYTH #BABA #IREN
📌 When trading, check whether the candlestick pattern confirms the setup

·
--
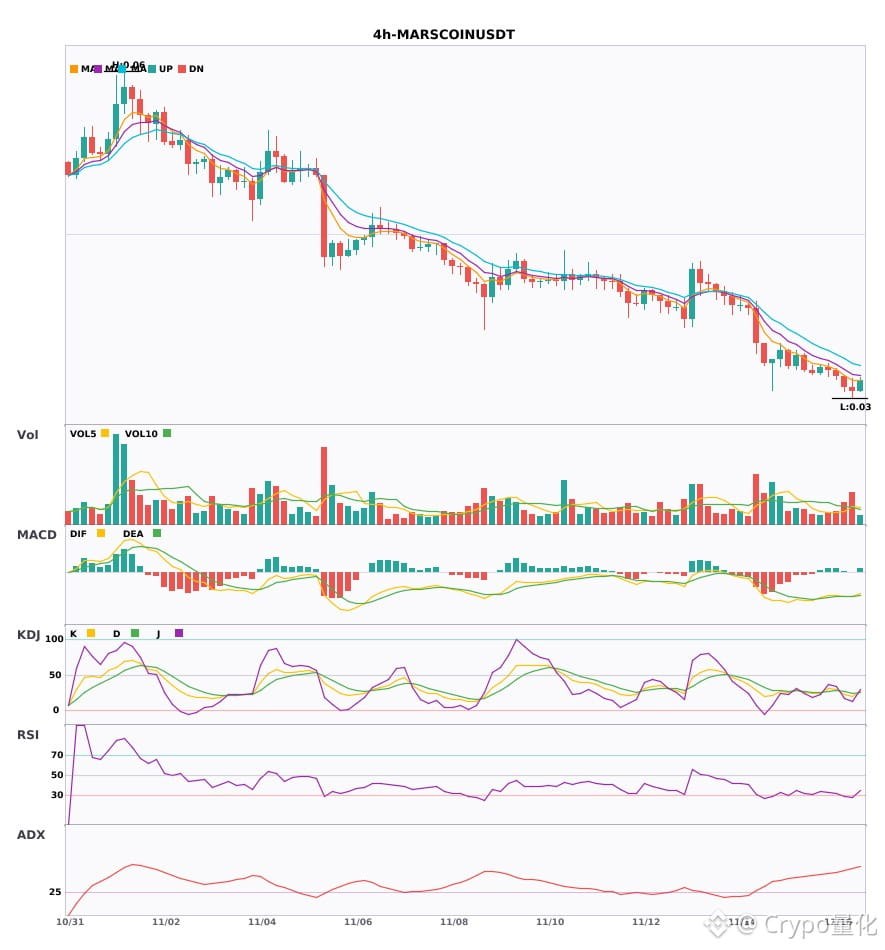
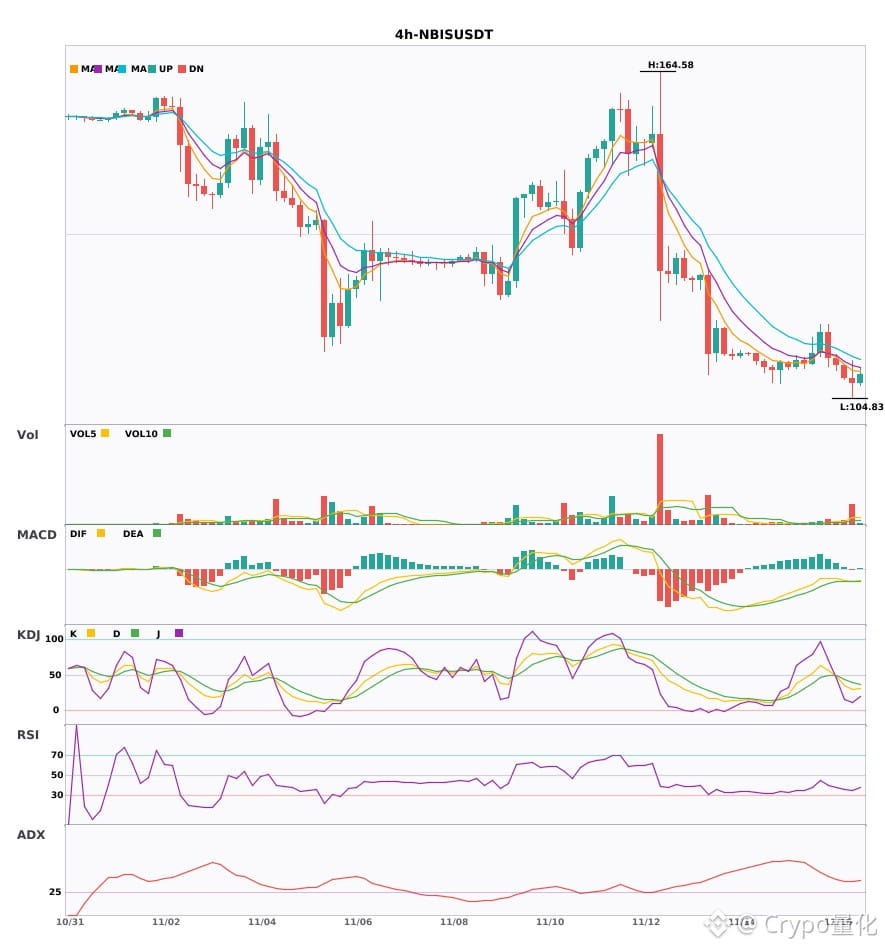
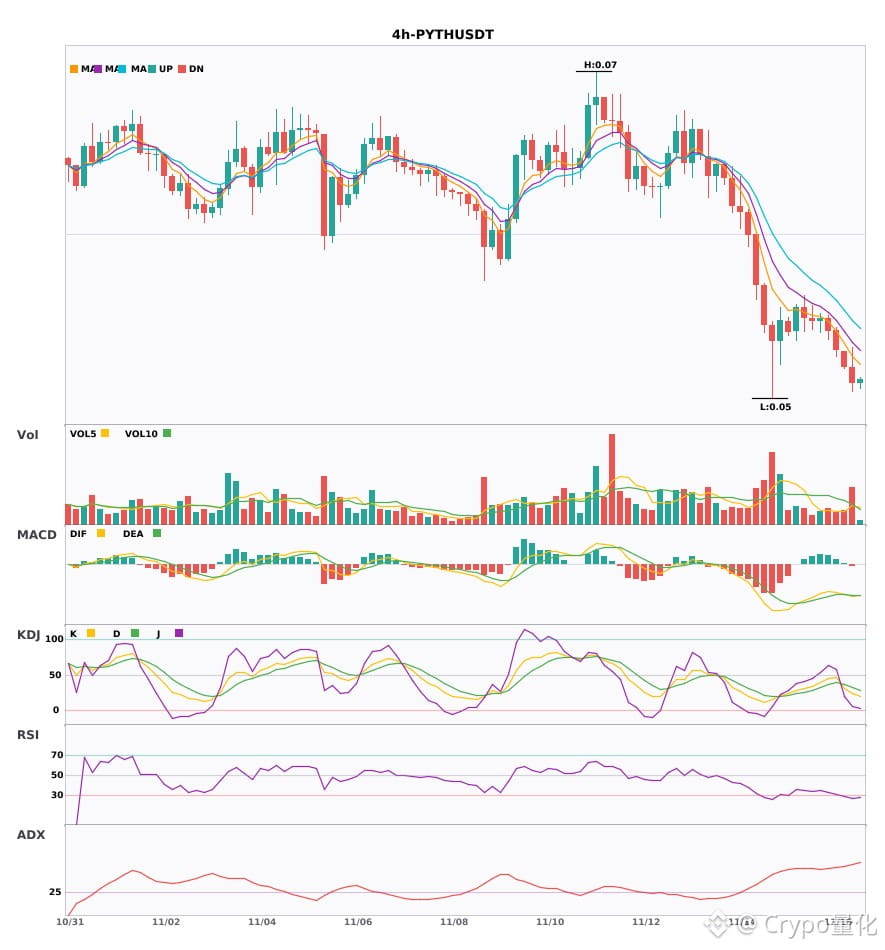
$MARSCOIN/$NBIS/$PYTH 4 4-hour short-term bearish pressure 🔥
════════════════════
🟢 $MARSCOIN 4 4-hour bearish signal
⚠️Technical analysis: ADX shows a strong trend, but beware of an overbought pullback. MACD bearish crossover is accelerating; moving averages are bearishly aligned and trending downward. KDJ is weak, with K not crossing above D. Volume is up 1.8x.
════════════════════
🟢 $NBIS 4 4-hour bearish signal
⚠️Technical analysis: ADX 36 indicates a clear trend. MACD bearish crossover below zero is accelerating; moving averages are bearishly aligned and diverging downward. KDJ is weak, with K not crossing above D (K 30.1, D 39.6). Volume has surged 4.7x.
════════════════════
🟢 $PYTH 4 4-hour bearish signal
⚠️Technical analysis: ADX indicates a very strong trend, but beware of an overbought pullback. MACD bearish crossover below zero is accelerating; moving averages are bearishly aligned. KDJ is weak, with K crossing below D. Trading volume is up 1.8x.
════════════════════
🔔 Follow for first-hand market alerts 🔔
#技术分析 #MARSCOIN #NBIS #PYTH
📌 When trading, pay attention to whether the candlestick patterns confirm the setup
$MARSCOIN /$NBIS /$PYTH 4 4-hour short-term bearish pressure 🔥
════════════════════
🟢 $MARSCOIN 4 4-hour bearish signal
⚠️Technical analysis: ADX shows a strong trend, but beware of an overbought pullback. MACD bearish crossover is accelerating; moving averages are bearishly aligned and trending downward. KDJ is weak, with K not crossing above D. Volume is up 1.8x.
════════════════════
🟢 $NBIS 4 4-hour bearish signal
⚠️Technical analysis: ADX 36 indicates a clear trend. MACD bearish crossover below zero is accelerating; moving averages are bearishly aligned and diverging downward. KDJ is weak, with K not crossing above D (K 30.1, D 39.6). Volume has surged 4.7x.
════════════════════
🟢 $PYTH 4 4-hour bearish signal
⚠️Technical analysis: ADX indicates a very strong trend, but beware of an overbought pullback. MACD bearish crossover below zero is accelerating; moving averages are bearishly aligned. KDJ is weak, with K crossing below D. Trading volume is up 1.8x.
════════════════════
🔔 Follow for first-hand market alerts 🔔
#技术分析 #MARSCOIN #NBIS #PYTH
📌 When trading, pay attention to whether the candlestick patterns confirm the setup
════════════════════
🟢 $MARSCOIN 4 4-hour bearish signal
⚠️Technical analysis: ADX shows a strong trend, but beware of an overbought pullback. MACD bearish crossover is accelerating; moving averages are bearishly aligned and trending downward. KDJ is weak, with K not crossing above D. Volume is up 1.8x.
════════════════════
🟢 $NBIS 4 4-hour bearish signal
⚠️Technical analysis: ADX 36 indicates a clear trend. MACD bearish crossover below zero is accelerating; moving averages are bearishly aligned and diverging downward. KDJ is weak, with K not crossing above D (K 30.1, D 39.6). Volume has surged 4.7x.
════════════════════
🟢 $PYTH 4 4-hour bearish signal
⚠️Technical analysis: ADX indicates a very strong trend, but beware of an overbought pullback. MACD bearish crossover below zero is accelerating; moving averages are bearishly aligned. KDJ is weak, with K crossing below D. Trading volume is up 1.8x.
════════════════════
🔔 Follow for first-hand market alerts 🔔
#技术分析 #MARSCOIN #NBIS #PYTH
📌 When trading, pay attention to whether the candlestick patterns confirm the setup
2

·
--
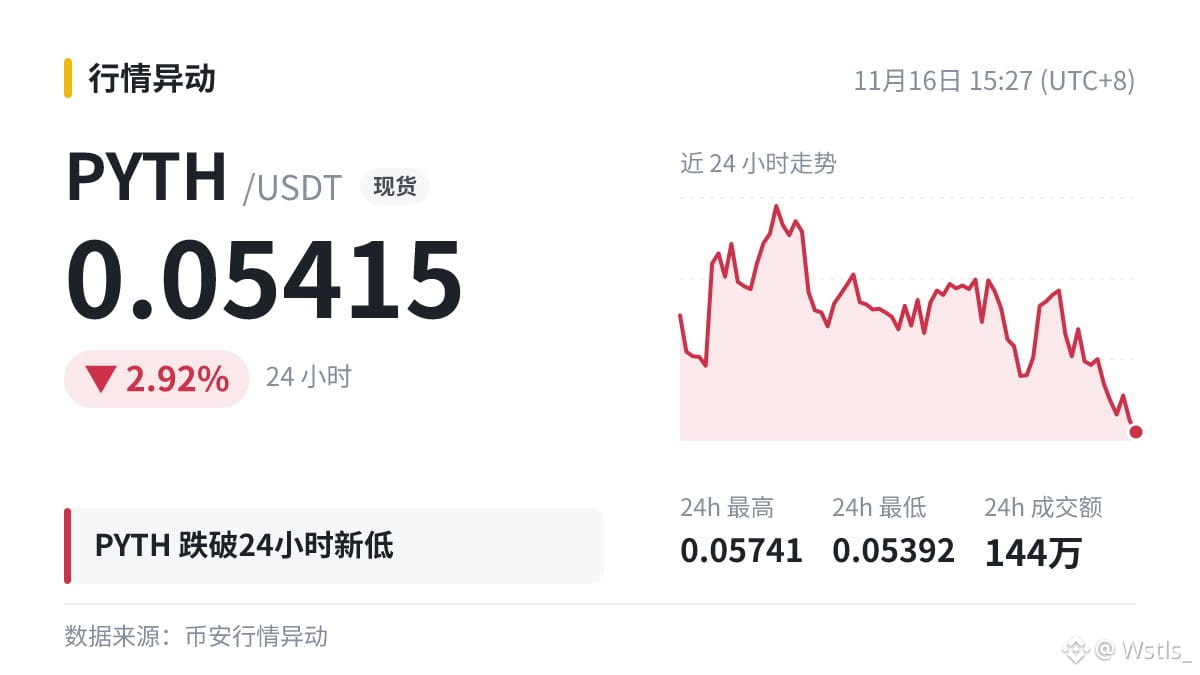
🩸 $PYTH hit a new 24-hour low of 0.05415, breaking below the previous low of 0.05427.
It was quiet for half a day, then finally picked a direction: down. If you’re carrying a large position, watch your risk—staying in the game is what matters most. Manage your position size and don’t hold onto losing trades.
#PYTH
🩸 $PYTH hit a new 24-hour low of 0.05415, breaking below the previous low of 0.05427.
It was quiet for half a day, then finally picked a direction: down. If you’re carrying a large position, watch your risk—staying in the game is what matters most. Manage your position size and don’t hold onto losing trades.
#PYTH
It was quiet for half a day, then finally picked a direction: down. If you’re carrying a large position, watch your risk—staying in the game is what matters most. Manage your position size and don’t hold onto losing trades.
#PYTH
3

·
--
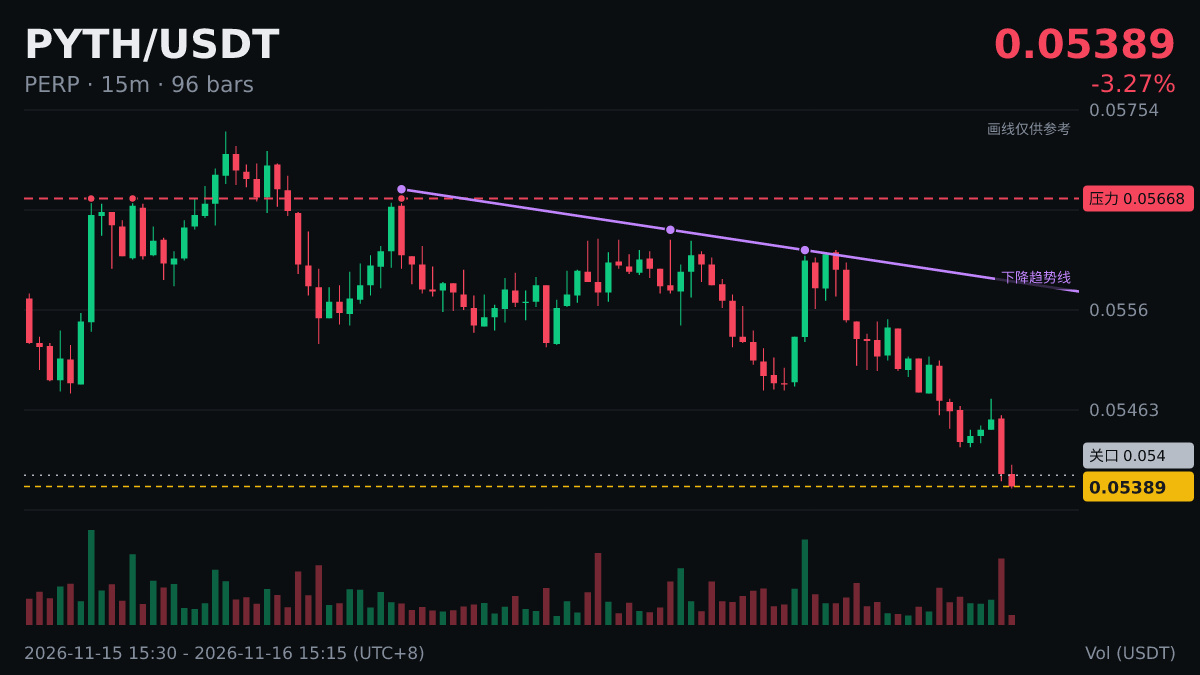
🐋 $PYTH has hit a new 24-hour low, and selling pressure hasn’t let up.
Current price: 0.05394, breaking below the previous low of 0.05427. 24-hour trading volume: $1.43 million.
A large number of long-position stop-losses typically sit below the previous low. Breaking through it could trigger a cascade of liquidations; watch for large players absorbing supply at lower levels.
#PYTH
🐋 $PYTH has hit a new 24-hour low, and selling pressure hasn’t let up.
Current price: 0.05394, breaking below the previous low of 0.05427. 24-hour trading volume: $1.43 million.
A large number of long-position stop-losses typically sit below the previous low. Breaking through it could trigger a cascade of liquidations; watch for large players absorbing supply at lower levels.
#PYTH
Current price: 0.05394, breaking below the previous low of 0.05427. 24-hour trading volume: $1.43 million.
A large number of long-position stop-losses typically sit below the previous low. Breaking through it could trigger a cascade of liquidations; watch for large players absorbing supply at lower levels.
#PYTH
32

·
--
Bullish
Partly True
$PYTH Is Reshaping Financial Market Data!
Most market data goes downstream. Pyth Network goes upstream, sourcing prices directly from institutions.
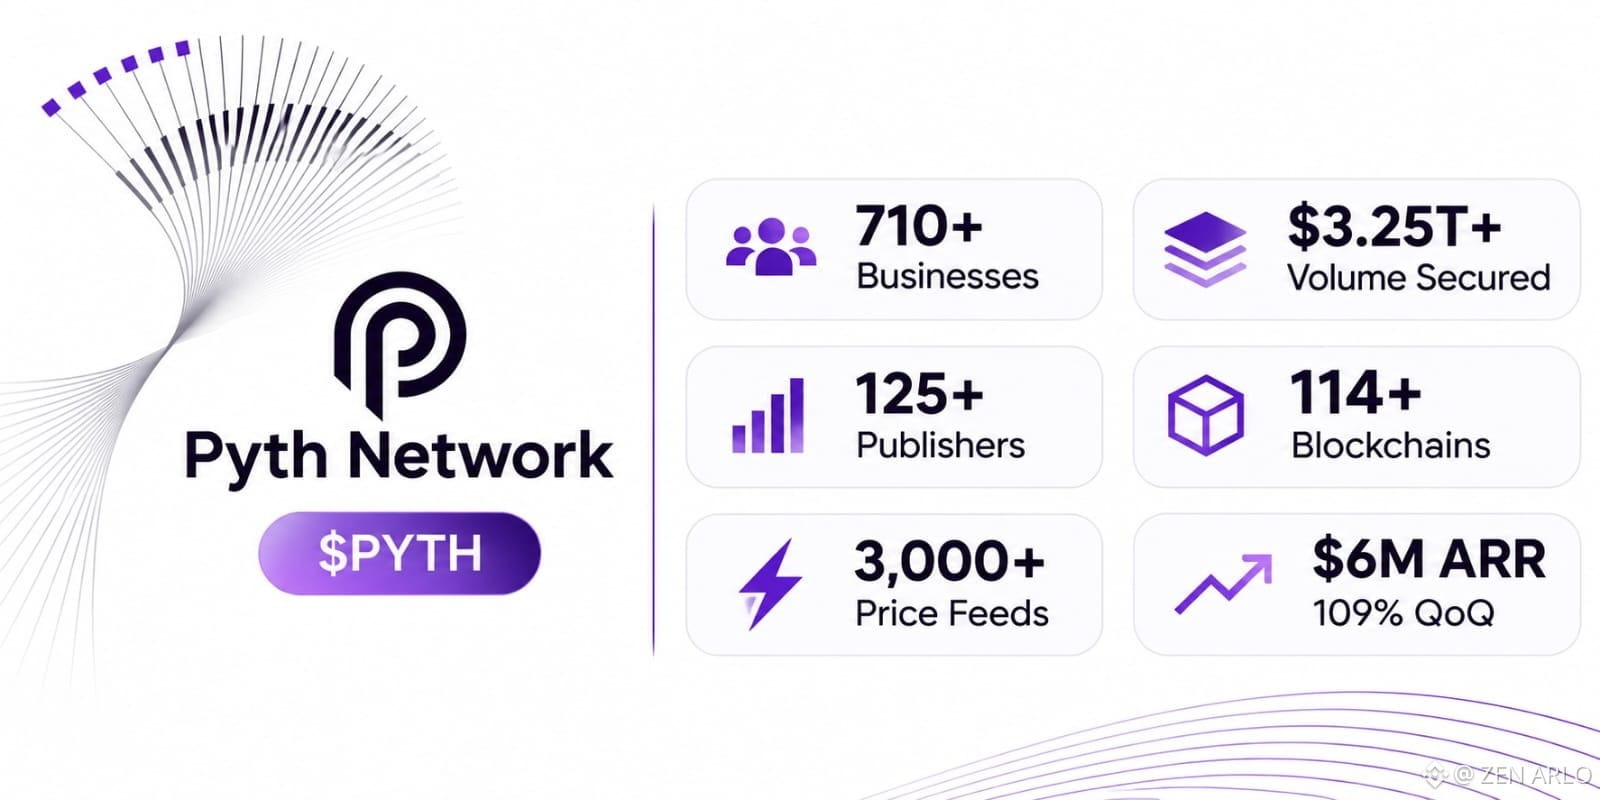
710+ businesses use Pyth, securing $3.25T+ in cumulative volume.
125+ institutional publishers deliver 3,000+ price feeds across 114+ blockchains.
Pyth supports 60% of the onchain perpetuals market.
Pyth Pro offers 2,200+ instruments through one integration with sub-100ms latency.
Pyth Pro surpassed $6M ARR, with subscription revenue growing 109% QoQ.
Pyth Terminal provides live pricing, benchmarks and publisher transparency.
Pyth Data Marketplace, Indices and AI Agents expand institutional data access and 24/7 finance.
For $LINK , $ONDO, $HYPE and $UMA communities, reliable market data is becoming increasingly important.
As digital finance expands, trusted market data is becoming essential infrastructure for the next generation of financial markets.
Only information not financial advice
#PYTH #DeFi #RWA
$PYTH Is Reshaping Financial Market Data!
Most market data goes downstream. Pyth Network goes upstream, sourcing prices directly from institutions.
710+ businesses use Pyth, securing $3.25T+ in cumulative volume.
125+ institutional publishers deliver 3,000+ price feeds across 114+ blockchains.
Pyth supports 60% of the onchain perpetuals market.
Pyth Pro offers 2,200+ instruments through one integration with sub-100ms latency.
Pyth Pro surpassed $6M ARR, with subscription revenue growing 109% QoQ.
Pyth Terminal provides live pricing, benchmarks and publisher transparency.
Pyth Data Marketplace, Indices and AI Agents expand institutional data access and 24/7 finance.
For $LINK , $ONDO, $HYPE and $UMA communities, reliable market data is becoming increasingly important.
As digital finance expands, trusted market data is becoming essential infrastructure for the next generation of financial markets.
Only information not financial advice
#PYTH #DeFi #RWA
Most market data goes downstream. Pyth Network goes upstream, sourcing prices directly from institutions.
710+ businesses use Pyth, securing $3.25T+ in cumulative volume.
125+ institutional publishers deliver 3,000+ price feeds across 114+ blockchains.
Pyth supports 60% of the onchain perpetuals market.
Pyth Pro offers 2,200+ instruments through one integration with sub-100ms latency.
Pyth Pro surpassed $6M ARR, with subscription revenue growing 109% QoQ.
Pyth Terminal provides live pricing, benchmarks and publisher transparency.
Pyth Data Marketplace, Indices and AI Agents expand institutional data access and 24/7 finance.
For $LINK , $ONDO, $HYPE and $UMA communities, reliable market data is becoming increasingly important.
As digital finance expands, trusted market data is becoming essential infrastructure for the next generation of financial markets.
Only information not financial advice
#PYTH #DeFi #RWA
Bianca Sofia:
Pyth is quietly becoming essential infrastructure, and those adoption numbers are honestly getting harder to ignore.
42
30
6.2k
·
--
$PYTH is down 7% and sitting right near the bottom of its 24h range
Chasing a green candle means you are buying from someone who trapped themselves higher up
Look at the math on $PYTH right now with volume sitting at 0.7x the weekly average
Price is at $0.06190 which is just 11% above the 24h low of $0.06126
The seller unloading onto late buyers at these levels is usually an early long trying to salvage what is left
Volume is drying up so there are no fresh bids coming in to absorb that weight
You end up holding the bag while they exit their loss
Always wait for the flush to finish before you even look at a chart
What is your go to filter for fake pumps
#PYTH #TradingTips
$PYTH is down 7% and sitting right near the bottom of its 24h range
Chasing a green candle means you are buying from someone who trapped themselves higher up
Look at the math on $PYTH right now with volume sitting at 0.7x the weekly average
Price is at $0.06190 which is just 11% above the 24h low of $0.06126
The seller unloading onto late buyers at these levels is usually an early long trying to salvage what is left
Volume is drying up so there are no fresh bids coming in to absorb that weight
You end up holding the bag while they exit their loss
Always wait for the flush to finish before you even look at a chart
What is your go to filter for fake pumps
#PYTH #TradingTips
Chasing a green candle means you are buying from someone who trapped themselves higher up
Look at the math on $PYTH right now with volume sitting at 0.7x the weekly average
Price is at $0.06190 which is just 11% above the 24h low of $0.06126
The seller unloading onto late buyers at these levels is usually an early long trying to salvage what is left
Volume is drying up so there are no fresh bids coming in to absorb that weight
You end up holding the bag while they exit their loss
Always wait for the flush to finish before you even look at a chart
What is your go to filter for fake pumps
#PYTH #TradingTips
12

·
--
$PYTH is gaining strong bullish momentum as volume rises and price breaks key resistance.
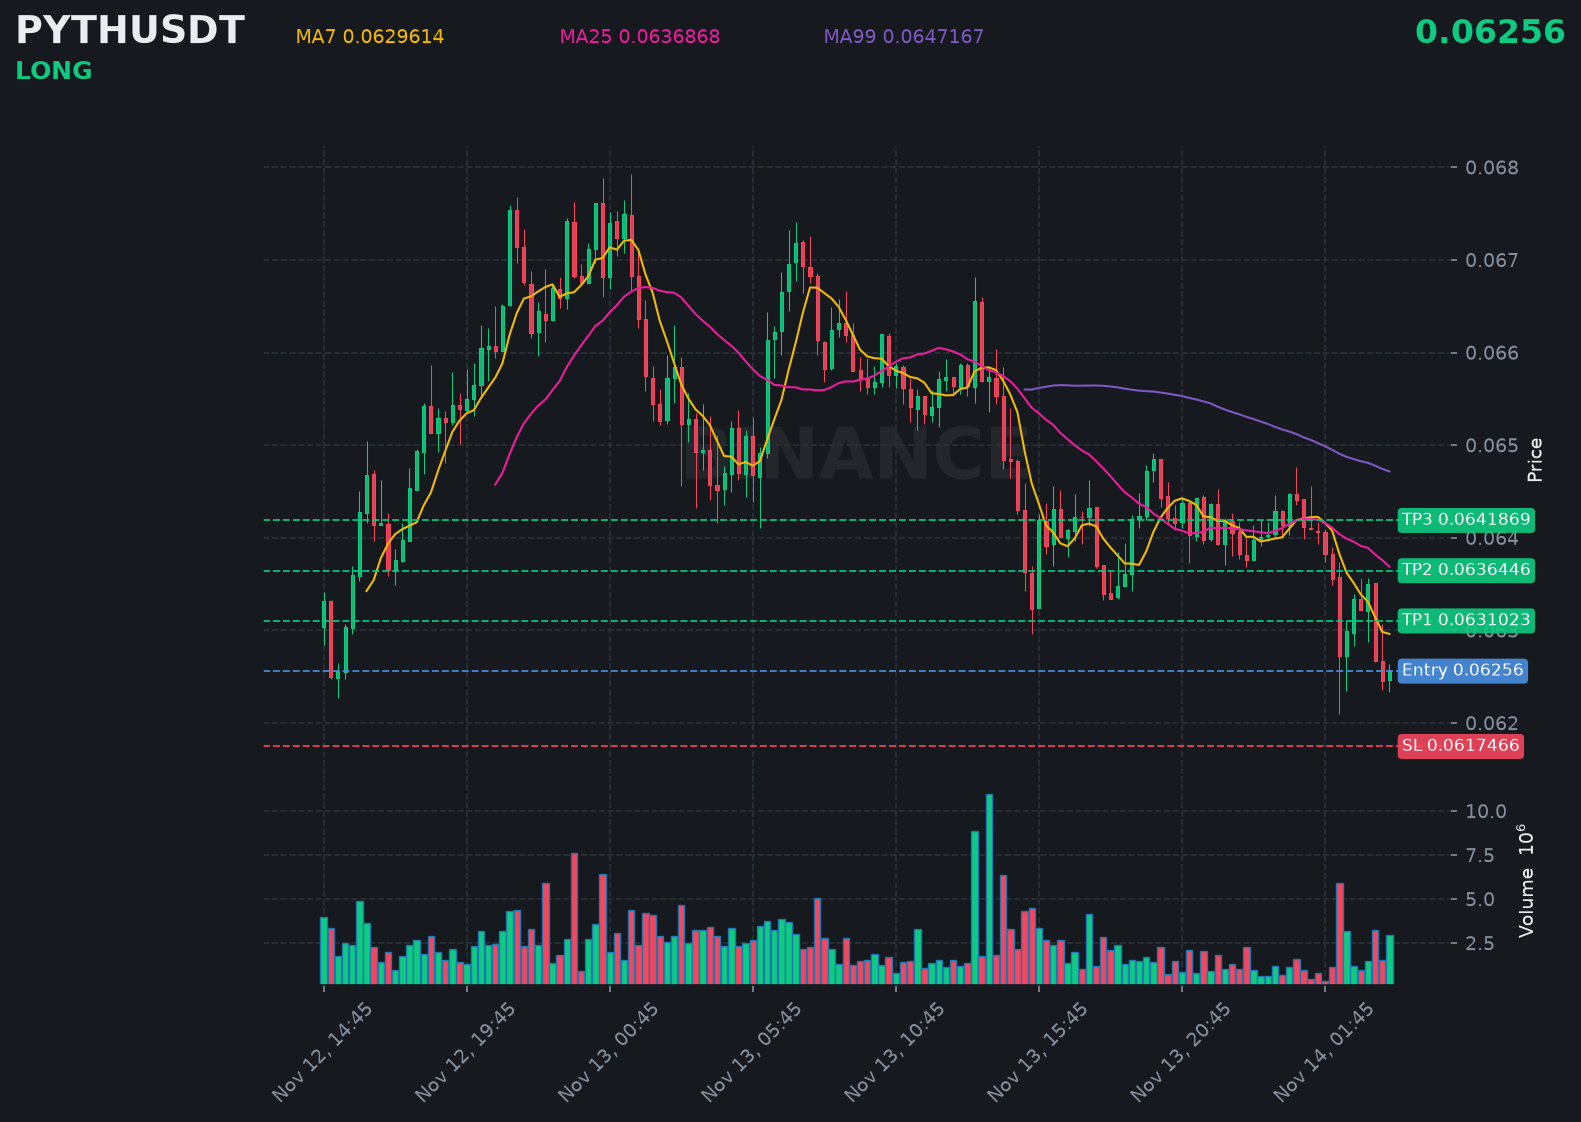
📍 @ 0.06256 | Volume: 0.19M USD
RSI 36 | EMA20: 0.0634205 USD
📈 Trade Plan:
📈 Entry: 0.0623973 – 0.0627227
🛑 Stop Loss: 0.0617466
🎯 TP1: 0.0631023
🎯 TP2: 0.0636446
🎯 TP3: 0.0641869
Waiting for a retest, then riding the uptrend.
👉 $PYTH 👈 Catch it
#PYTH
$PYTH is gaining strong bullish momentum as volume rises and price breaks key resistance.
📍 @ 0.06256 | Volume: 0.19M USD
RSI 36 | EMA20: 0.0634205 USD
📈 Trade Plan:
📈 Entry: 0.0623973 – 0.0627227
🛑 Stop Loss: 0.0617466
🎯 TP1: 0.0631023
🎯 TP2: 0.0636446
🎯 TP3: 0.0641869
Waiting for a retest, then riding the uptrend.
👉 $PYTH 👈 Catch it
#PYTH
📍 @ 0.06256 | Volume: 0.19M USD
RSI 36 | EMA20: 0.0634205 USD
📈 Trade Plan:
📈 Entry: 0.0623973 – 0.0627227
🛑 Stop Loss: 0.0617466
🎯 TP1: 0.0631023
🎯 TP2: 0.0636446
🎯 TP3: 0.0641869
Waiting for a retest, then riding the uptrend.
👉 $PYTH 👈 Catch it
#PYTH
70

·
--
🔴 PYTHUSDT · SHORT
━━━━━━━━━━━━━━
📍 Entry: 0.0676
🛑 Stop: 0.0712
🎯 TP1: 0.064
🎯 TP2: 0.0604
🎯 TP3: 0.0568
━━━━━━━━━━━━━━
💬 The market whispers that the tide is turning, and in its quiet retreat we find the clarity to let go. Patience will reward the ones who trust the flow. 🌊
#PYTH #Crypto #SHORT #LovelyVincent
🔴 PYTHUSDT · SHORT
━━━━━━━━━━━━━━
📍 Entry: 0.0676
🛑 Stop: 0.0712
🎯 TP1: 0.064
🎯 TP2: 0.0604
🎯 TP3: 0.0568
━━━━━━━━━━━━━━
💬 The market whispers that the tide is turning, and in its quiet retreat we find the clarity to let go. Patience will reward the ones who trust the flow. 🌊
#PYTH #Crypto #SHORT #LovelyVincent
━━━━━━━━━━━━━━
📍 Entry: 0.0676
🛑 Stop: 0.0712
🎯 TP1: 0.064
🎯 TP2: 0.0604
🎯 TP3: 0.0568
━━━━━━━━━━━━━━
💬 The market whispers that the tide is turning, and in its quiet retreat we find the clarity to let go. Patience will reward the ones who trust the flow. 🌊
#PYTH #Crypto #SHORT #LovelyVincent
65
·
--
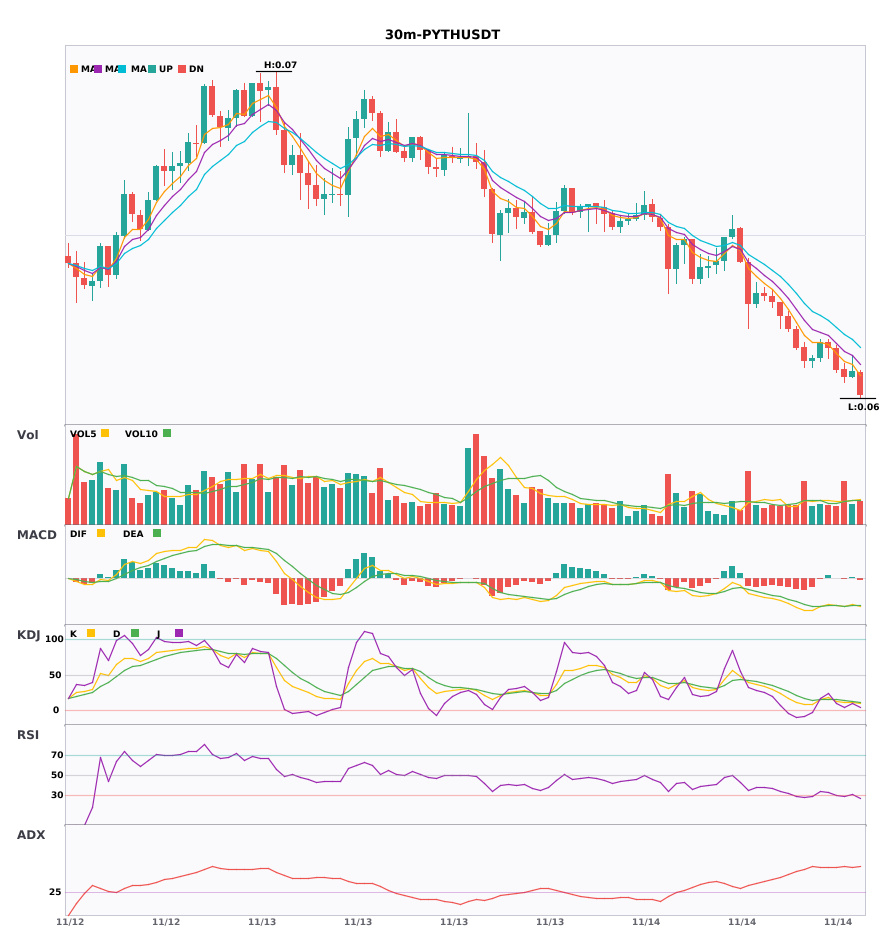
30-minute and 4-hour timeframes are both bearish; multi-timeframe confluence confirms the bearish trend 🔥
════════════════════
🟢 $USELESS 30-minute bearish signal
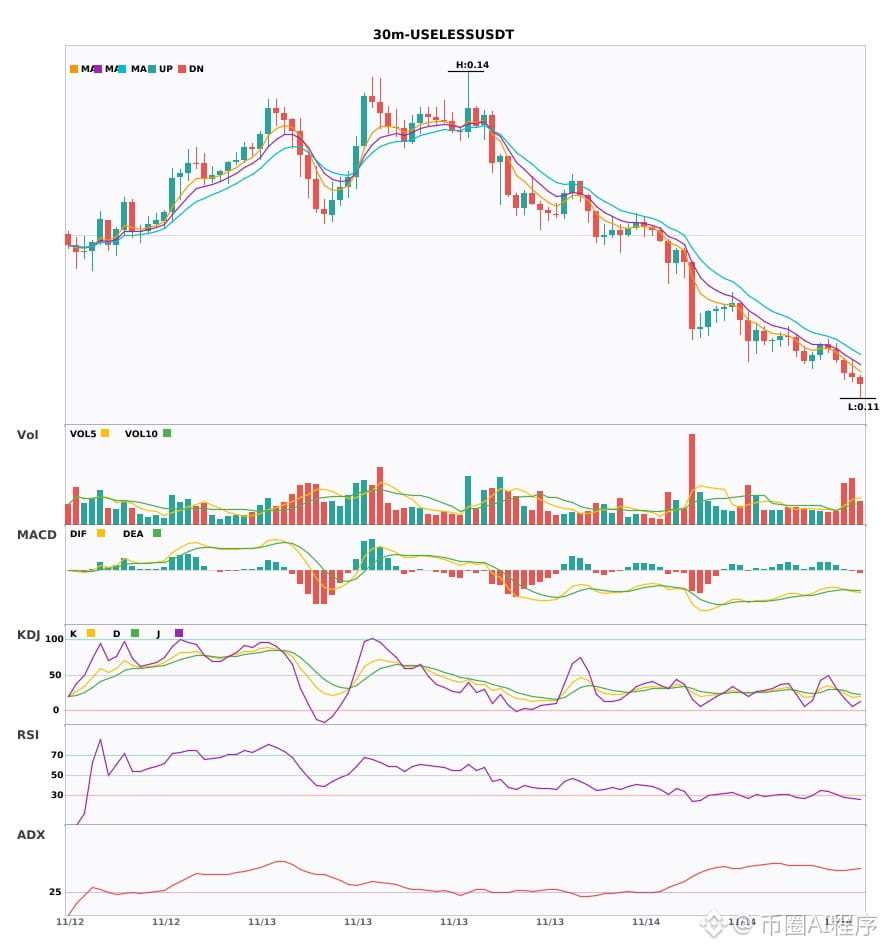
⚠️ Technical analysis: The 4-hour and 30-minute bearish signals are confirmed by confluence. After the MACD death cross, the green bars continue to grow; the moving averages are bearishly aligned and diverging downward. The KDJ is weak but not yet oversold. Trading volume is up 2.4x, giving bears the advantage.
════════════════════
🟢 $VIRTUAL 30-minute bearish signal
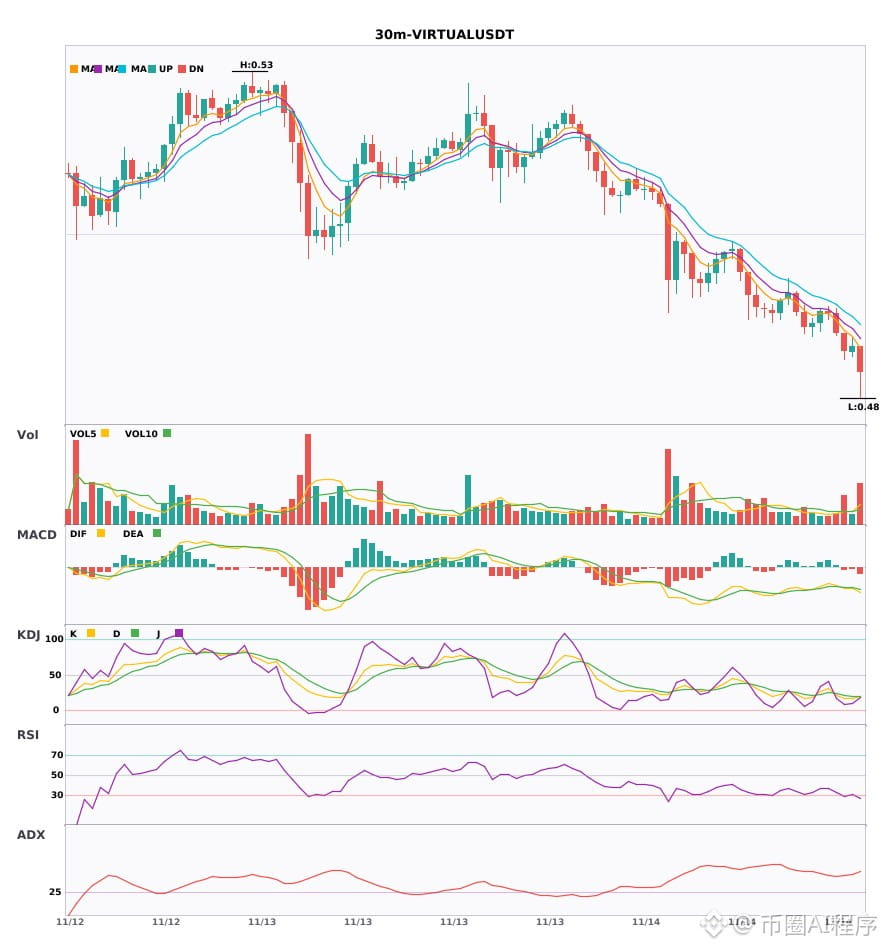
⚠️ Technical analysis: The 4-hour and 30-minute bearish signals are confirmed by confluence: the MACD death cross is accompanied by growing green bars, the moving averages are bearishly aligned, and the weak KDJ shows K crossing below D. Trading volume is up 2x.
════════════════════
🟢 $PYTH 30-minute bearish signal
⚠️ Technical analysis: The 4-hour bearish trend and 30-minute entry signal are confirmed by confluence! After the MACD death cross, the green bars are growing; the moving averages are bearishly aligned and trending downward. The KDJ has entered the oversold zone, so watch for a rebound. Trading volume is up 1.8x.
════════════════════
🔔 Follow for first-hand market updates and alerts 🔔
#多周期共振 #USELESS #VIRTUAL #PYTH
📌 When trading, check whether the candlestick patterns meet the criteria
30-minute and 4-hour timeframes are both bearish; multi-timeframe confluence confirms the bearish trend 🔥
════════════════════
🟢 $USELESS 30-minute bearish signal
⚠️ Technical analysis: The 4-hour and 30-minute bearish signals are confirmed by confluence. After the MACD death cross, the green bars continue to grow; the moving averages are bearishly aligned and diverging downward. The KDJ is weak but not yet oversold. Trading volume is up 2.4x, giving bears the advantage.
════════════════════
🟢 $VIRTUAL 30-minute bearish signal
⚠️ Technical analysis: The 4-hour and 30-minute bearish signals are confirmed by confluence: the MACD death cross is accompanied by growing green bars, the moving averages are bearishly aligned, and the weak KDJ shows K crossing below D. Trading volume is up 2x.
════════════════════
🟢 $PYTH 30-minute bearish signal
⚠️ Technical analysis: The 4-hour bearish trend and 30-minute entry signal are confirmed by confluence! After the MACD death cross, the green bars are growing; the moving averages are bearishly aligned and trending downward. The KDJ has entered the oversold zone, so watch for a rebound. Trading volume is up 1.8x.
════════════════════
🔔 Follow for first-hand market updates and alerts 🔔
#多周期共振 #USELESS #VIRTUAL #PYTH
📌 When trading, check whether the candlestick patterns meet the criteria
════════════════════
🟢 $USELESS 30-minute bearish signal
⚠️ Technical analysis: The 4-hour and 30-minute bearish signals are confirmed by confluence. After the MACD death cross, the green bars continue to grow; the moving averages are bearishly aligned and diverging downward. The KDJ is weak but not yet oversold. Trading volume is up 2.4x, giving bears the advantage.
════════════════════
🟢 $VIRTUAL 30-minute bearish signal
⚠️ Technical analysis: The 4-hour and 30-minute bearish signals are confirmed by confluence: the MACD death cross is accompanied by growing green bars, the moving averages are bearishly aligned, and the weak KDJ shows K crossing below D. Trading volume is up 2x.
════════════════════
🟢 $PYTH 30-minute bearish signal
⚠️ Technical analysis: The 4-hour bearish trend and 30-minute entry signal are confirmed by confluence! After the MACD death cross, the green bars are growing; the moving averages are bearishly aligned and trending downward. The KDJ has entered the oversold zone, so watch for a rebound. Trading volume is up 1.8x.
════════════════════
🔔 Follow for first-hand market updates and alerts 🔔
#多周期共振 #USELESS #VIRTUAL #PYTH
📌 When trading, check whether the candlestick patterns meet the criteria
10
Log in to explore more content
Join global crypto users on Binance Square
⚡️ Get latest and useful information about crypto.
💬 Trusted by the world’s largest crypto exchange.
👍 Discover real insights from verified creators.
Email / Phone number
Trending Topics
1
#A Packed Week of Earnings and Data Tests Markets
52,329 views
356 Discussing
2
#AnthropicIPOTestsInvestorAppetiteForAI
89,837 views
1,224 Discussing
3
#BitcoinExtendsLosingStreakToSixWeeks
52,774 views
579 Discussing
4
#XRPFallsTo$0.89LowestSinceNovember2024
9,706 views
56 Discussing
5
#HuangReportedlyConsidersReturnToNvidia
100,870 views
1,137 Discussing
6
#SP500AndNasdaqFuturesHitQuarterlyLows
14,934 views
194 Discussing
7
#CaliforniaVotersBackProp42BarringNewCryptoTaxes
10,918 views
177 Discussing
8
#HKPlansDigitalAssetRegulatoryBillByYearEnd
10,542 views
136 Discussing
9
#MUFGSMFGMizuhoPlanYenBackedStablecoin
24,820 views
262 Discussing
10
#HKMAAndSwiftExploreTokenizedDepositInteroperability
1,216 views
17 Discussing