
#gram
gram
810,595 views
4,707 Discussing
Hot
Latest

·
--
Bearish
🚀 GRAM/USDT – Big Move Coming? 🔥
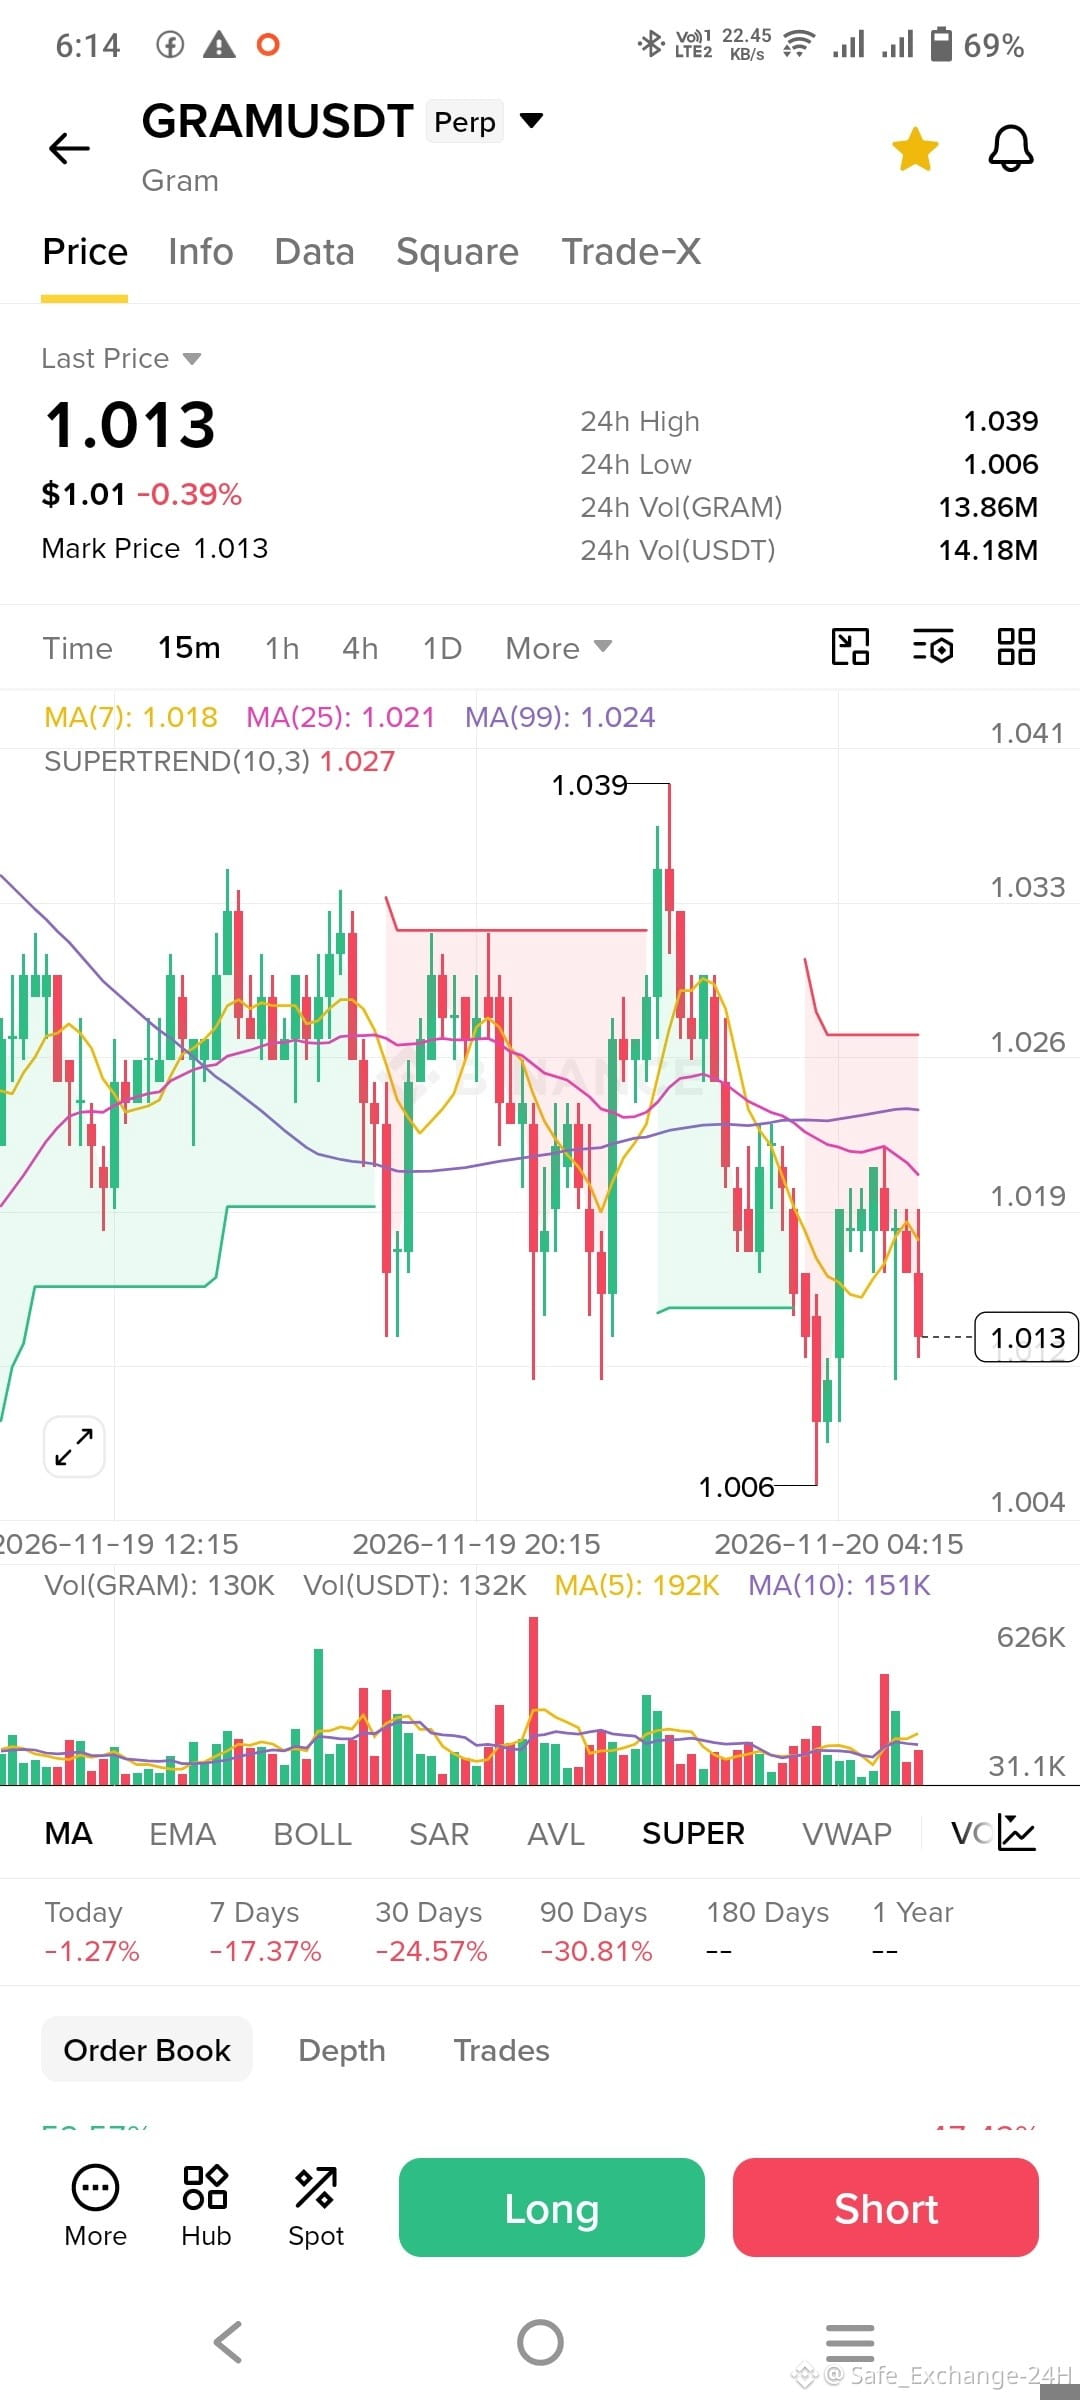
GRAM is trading around $1.013. After touching $1.006, the price attempted a recovery. But can buyers take control?
📊 15M Technical Analysis
💰 Current Price: $1.013
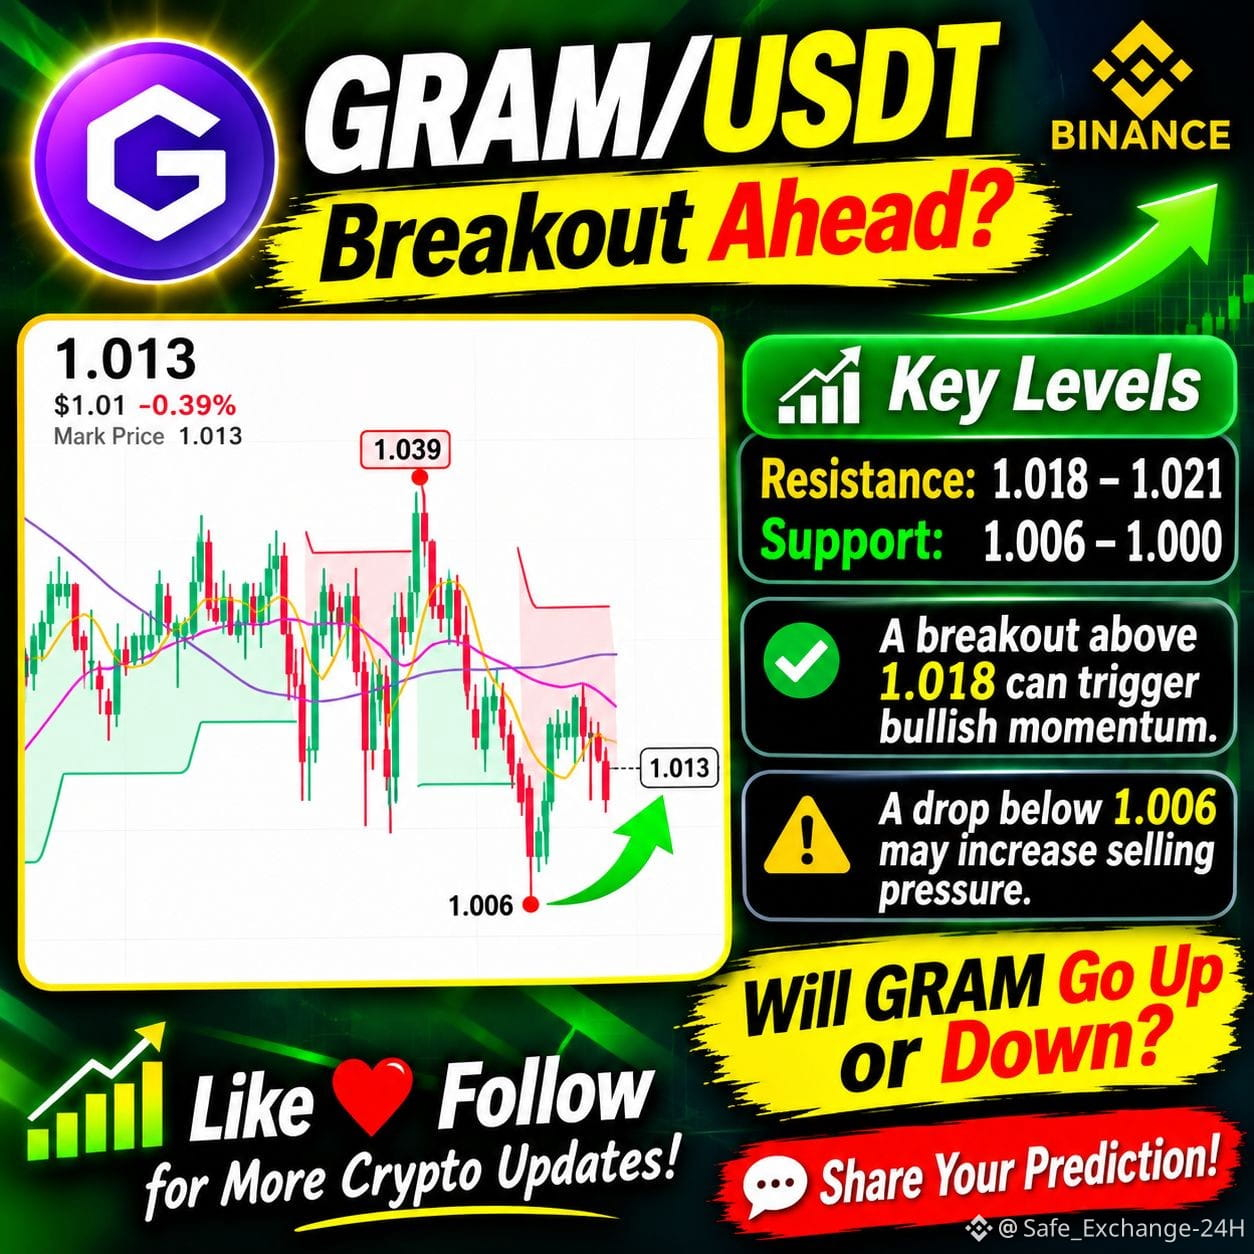
🔴 Resistance: $1.018 – $1.021
🟢 Support: $1.006 – $1.000
📈 A breakout above $1.021 could create bullish momentum.
⚠️ A breakdown below $1.006 may increase selling pressure.
🔥 UP or DOWN? What's your prediction?
👇 Comment your target price!
❤️ Follow me for daily crypto analysis, Binance updates & trading opportunities.
#GRAM #gramusdt #Binance #CryptoTrading #Altcoins #CryptoAnalysis
$GRAM
{spot}(GRAMUSDT)
🚀 GRAM/USDT – Big Move Coming? 🔥
GRAM is trading around $1.013. After touching $1.006, the price attempted a recovery. But can buyers take control?
📊 15M Technical Analysis
💰 Current Price: $1.013
🔴 Resistance: $1.018 – $1.021
🟢 Support: $1.006 – $1.000
📈 A breakout above $1.021 could create bullish momentum.
⚠️ A breakdown below $1.006 may increase selling pressure.
🔥 UP or DOWN? What's your prediction?
👇 Comment your target price!
❤️ Follow me for daily crypto analysis, Binance updates & trading opportunities.
#GRAM #gramusdt #Binance #CryptoTrading #Altcoins #CryptoAnalysis
$GRAM
GRAM is trading around $1.013. After touching $1.006, the price attempted a recovery. But can buyers take control?
📊 15M Technical Analysis
💰 Current Price: $1.013
🔴 Resistance: $1.018 – $1.021
🟢 Support: $1.006 – $1.000
📈 A breakout above $1.021 could create bullish momentum.
⚠️ A breakdown below $1.006 may increase selling pressure.
🔥 UP or DOWN? What's your prediction?
👇 Comment your target price!
❤️ Follow me for daily crypto analysis, Binance updates & trading opportunities.
#GRAM #gramusdt #Binance #CryptoTrading #Altcoins #CryptoAnalysis
$GRAM
2
342

·
--
$GRAM +0.20% | $EUR +0.10% | $U +0.05%
#GRAM nudged to $1.03, up +0.20% on $4.8 M volume. TON’s broad developer tooling keeps it in view as a modest rally builds.
#EUR climbed to $1.10, up +0.10% with $12.2 M changing hands. The steady rise hints at lingering fiat‑stable demand.
#U rose to $1.00, up +0.05% on $21.2 M volume. Its thin edge suggests a watchful eye on any shift in trader sentiment.
🔎 Keep an eye on whether the modest gains hold as volume patterns evolve.
#Write2Earn #Binance
$GRAM +0.20% | $EUR +0.10% | $U +0.05%
#GRAM nudged to $1.03, up +0.20% on $4.8 M volume. TON’s broad developer tooling keeps it in view as a modest rally builds.
#EUR climbed to $1.10, up +0.10% with $12.2 M changing hands. The steady rise hints at lingering fiat‑stable demand.
#U rose to $1.00, up +0.05% on $21.2 M volume. Its thin edge suggests a watchful eye on any shift in trader sentiment.
🔎 Keep an eye on whether the modest gains hold as volume patterns evolve.
#Write2Earn #Binance
#GRAM nudged to $1.03, up +0.20% on $4.8 M volume. TON’s broad developer tooling keeps it in view as a modest rally builds.
#EUR climbed to $1.10, up +0.10% with $12.2 M changing hands. The steady rise hints at lingering fiat‑stable demand.
#U rose to $1.00, up +0.05% on $21.2 M volume. Its thin edge suggests a watchful eye on any shift in trader sentiment.
🔎 Keep an eye on whether the modest gains hold as volume patterns evolve.
#Write2Earn #Binance
6

·
--
🦈 $GRAM SMASHES LOCAL RESISTANCE AS SMART MONEY LIQUIDITY FLOODS THE ORDER BOOK 📈
Institutional footprint is unmistakable on $GRAM today following a clean +8.94% markup that completely swept prior local resistance. 📊 Volume expansion confirms aggressive buying pressure as major wallets absorb supply directly from resting liquidity pools. ⚡
When structural range highs give way with this type of velocity, price discovery often accelerates as late shorts get trapped. 💡 Are you looking to position on an inefficiency retest, or waiting for a structural shift before entry? 👇
⚠️ Not financial advice. Always manage your risk. 🛡️
🏷️ #GRAM #SmartMoney #MarketStructure #PriceAction #Altcoins
🔥 💎
🦈 $GRAM SMASHES LOCAL RESISTANCE AS SMART MONEY LIQUIDITY FLOODS THE ORDER BOOK 📈
Institutional footprint is unmistakable on $GRAM today following a clean +8.94% markup that completely swept prior local resistance. 📊 Volume expansion confirms aggressive buying pressure as major wallets absorb supply directly from resting liquidity pools. ⚡
When structural range highs give way with this type of velocity, price discovery often accelerates as late shorts get trapped. 💡 Are you looking to position on an inefficiency retest, or waiting for a structural shift before entry? 👇
⚠️ Not financial advice. Always manage your risk. 🛡️
🏷️ #GRAM #SmartMoney #MarketStructure #PriceAction #Altcoins
🔥 💎
Institutional footprint is unmistakable on $GRAM today following a clean +8.94% markup that completely swept prior local resistance. 📊 Volume expansion confirms aggressive buying pressure as major wallets absorb supply directly from resting liquidity pools. ⚡
When structural range highs give way with this type of velocity, price discovery often accelerates as late shorts get trapped. 💡 Are you looking to position on an inefficiency retest, or waiting for a structural shift before entry? 👇
⚠️ Not financial advice. Always manage your risk. 🛡️
🏷️ #GRAM #SmartMoney #MarketStructure #PriceAction #Altcoins
🔥 💎
15

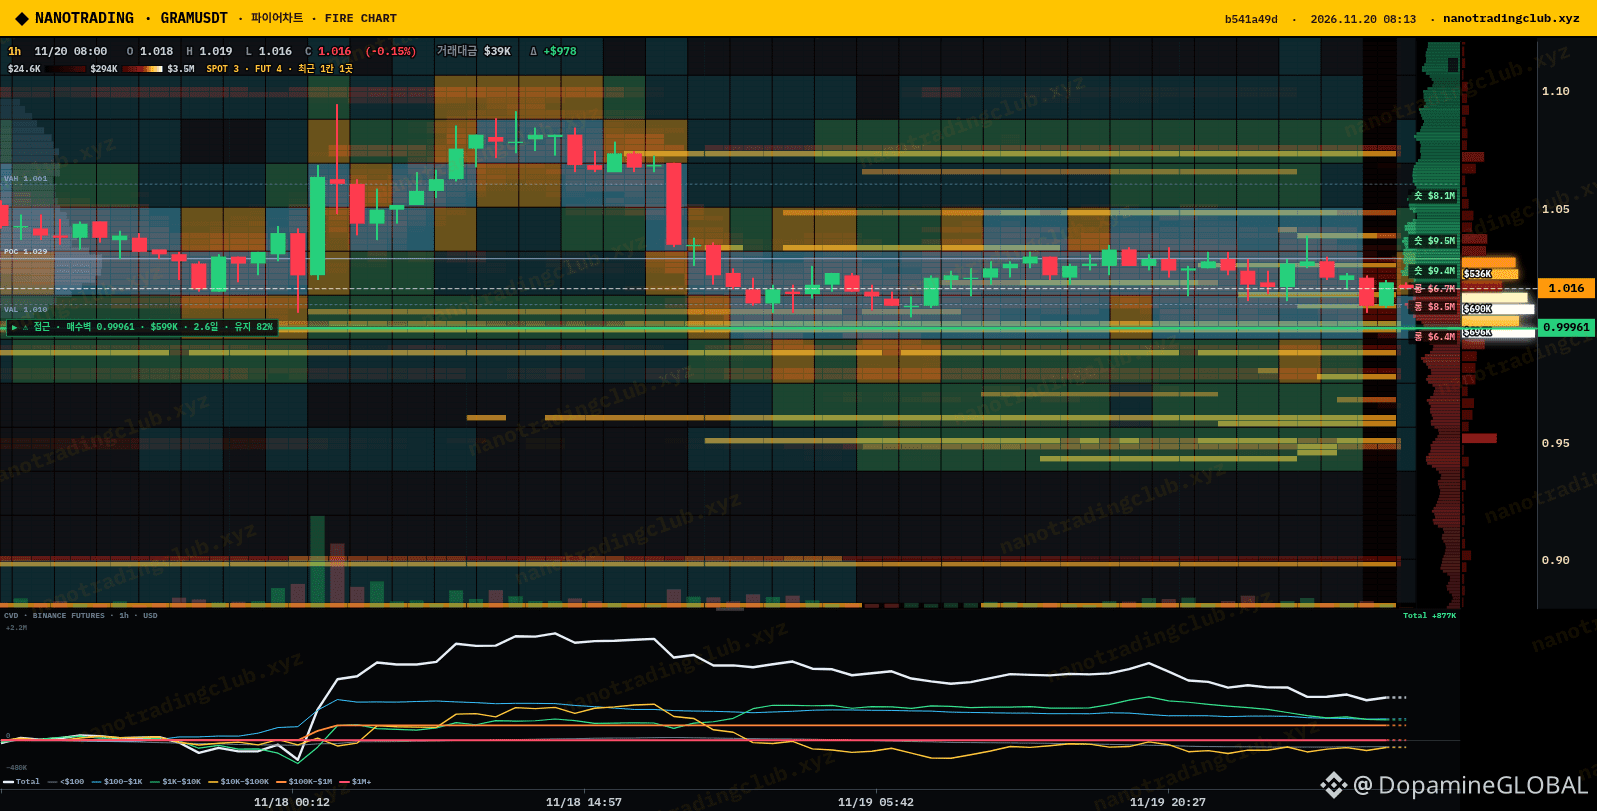
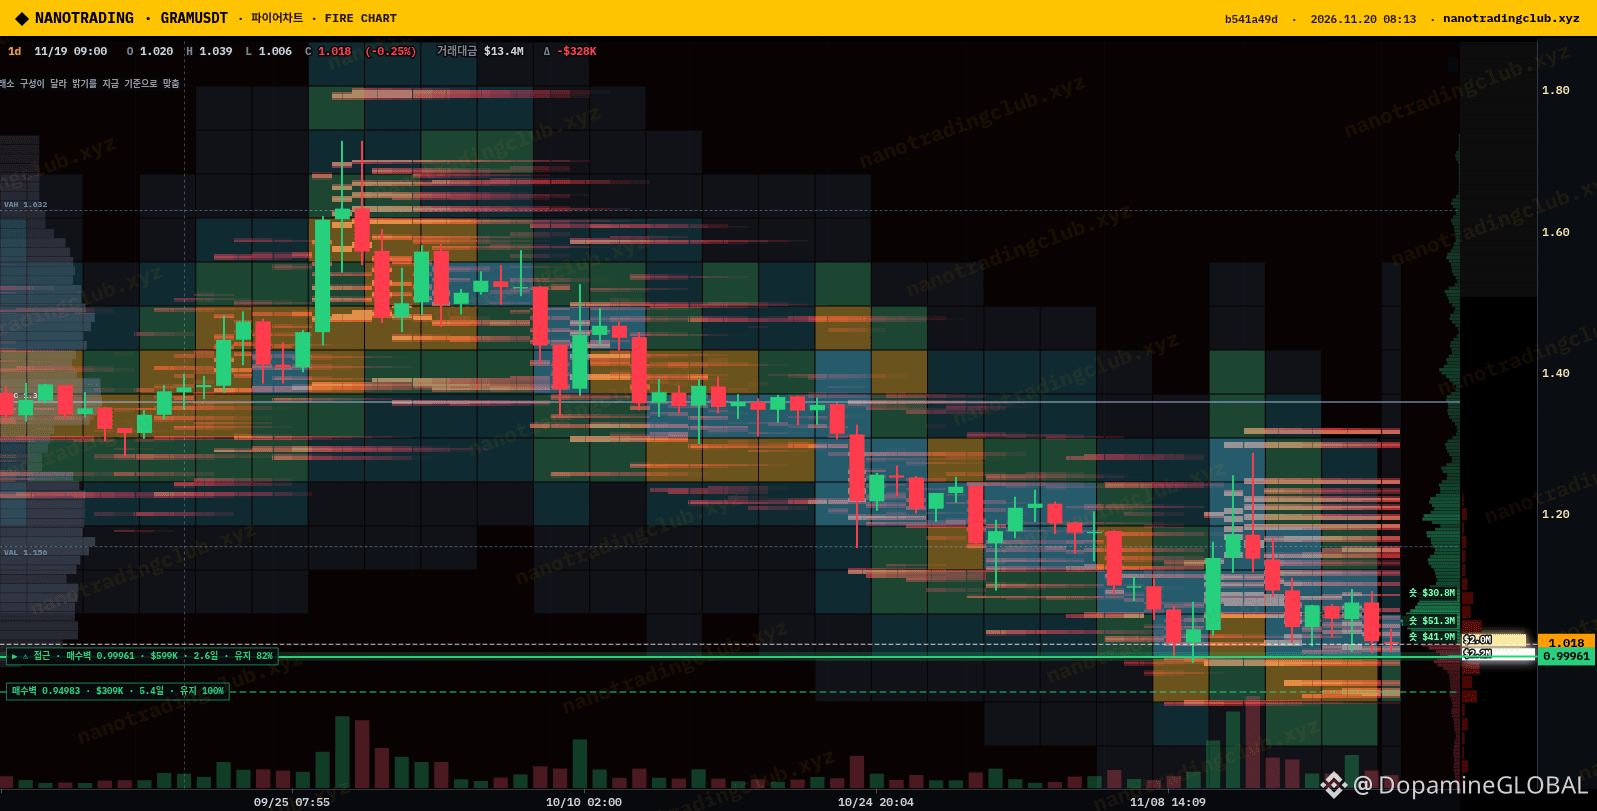
$GRAM has a bid wall that just won't leave. NanoTrading's wall scanner shows about $599K sitting at 0.9996, roughly 1.7% under price (~1.016), and it's been parked there for 2+ days with 82% persistence. Basically the $1 line in the sand.
Above, the 1h map stacks short liq clusters of $9.4M, $9.5M and $8.1M, while the 1d view shows even bigger short clusters ($30M-50M range) overhead. If that wall holds, a squeeze into those shorts is the path I'm watching on $GRAM.
Wall holds and we squeeze, or $1 breaks and the bid gets pulled? 👀
NFA, just watching the tape.
Source: NanoTrading Fire chart + wall scanner (nanotradingclub.xyz)
#GRAM #TON #NanoTrading #WallAlert
$GRAM has a bid wall that just won't leave. NanoTrading's wall scanner shows about $599K sitting at 0.9996, roughly 1.7% under price (~1.016), and it's been parked there for 2+ days with 82% persistence. Basically the $1 line in the sand.
Above, the 1h map stacks short liq clusters of $9.4M, $9.5M and $8.1M, while the 1d view shows even bigger short clusters ($30M-50M range) overhead. If that wall holds, a squeeze into those shorts is the path I'm watching on $GRAM .
Wall holds and we squeeze, or $1 breaks and the bid gets pulled? 👀
NFA, just watching the tape.
Source: NanoTrading Fire chart + wall scanner (nanotradingclub.xyz)
#GRAM #TON #NanoTrading #WallAlert
Above, the 1h map stacks short liq clusters of $9.4M, $9.5M and $8.1M, while the 1d view shows even bigger short clusters ($30M-50M range) overhead. If that wall holds, a squeeze into those shorts is the path I'm watching on $GRAM .
Wall holds and we squeeze, or $1 breaks and the bid gets pulled? 👀
NFA, just watching the tape.
Source: NanoTrading Fire chart + wall scanner (nanotradingclub.xyz)
#GRAM #TON #NanoTrading #WallAlert
143

·
--
🚀 GRAMUSDT Spot
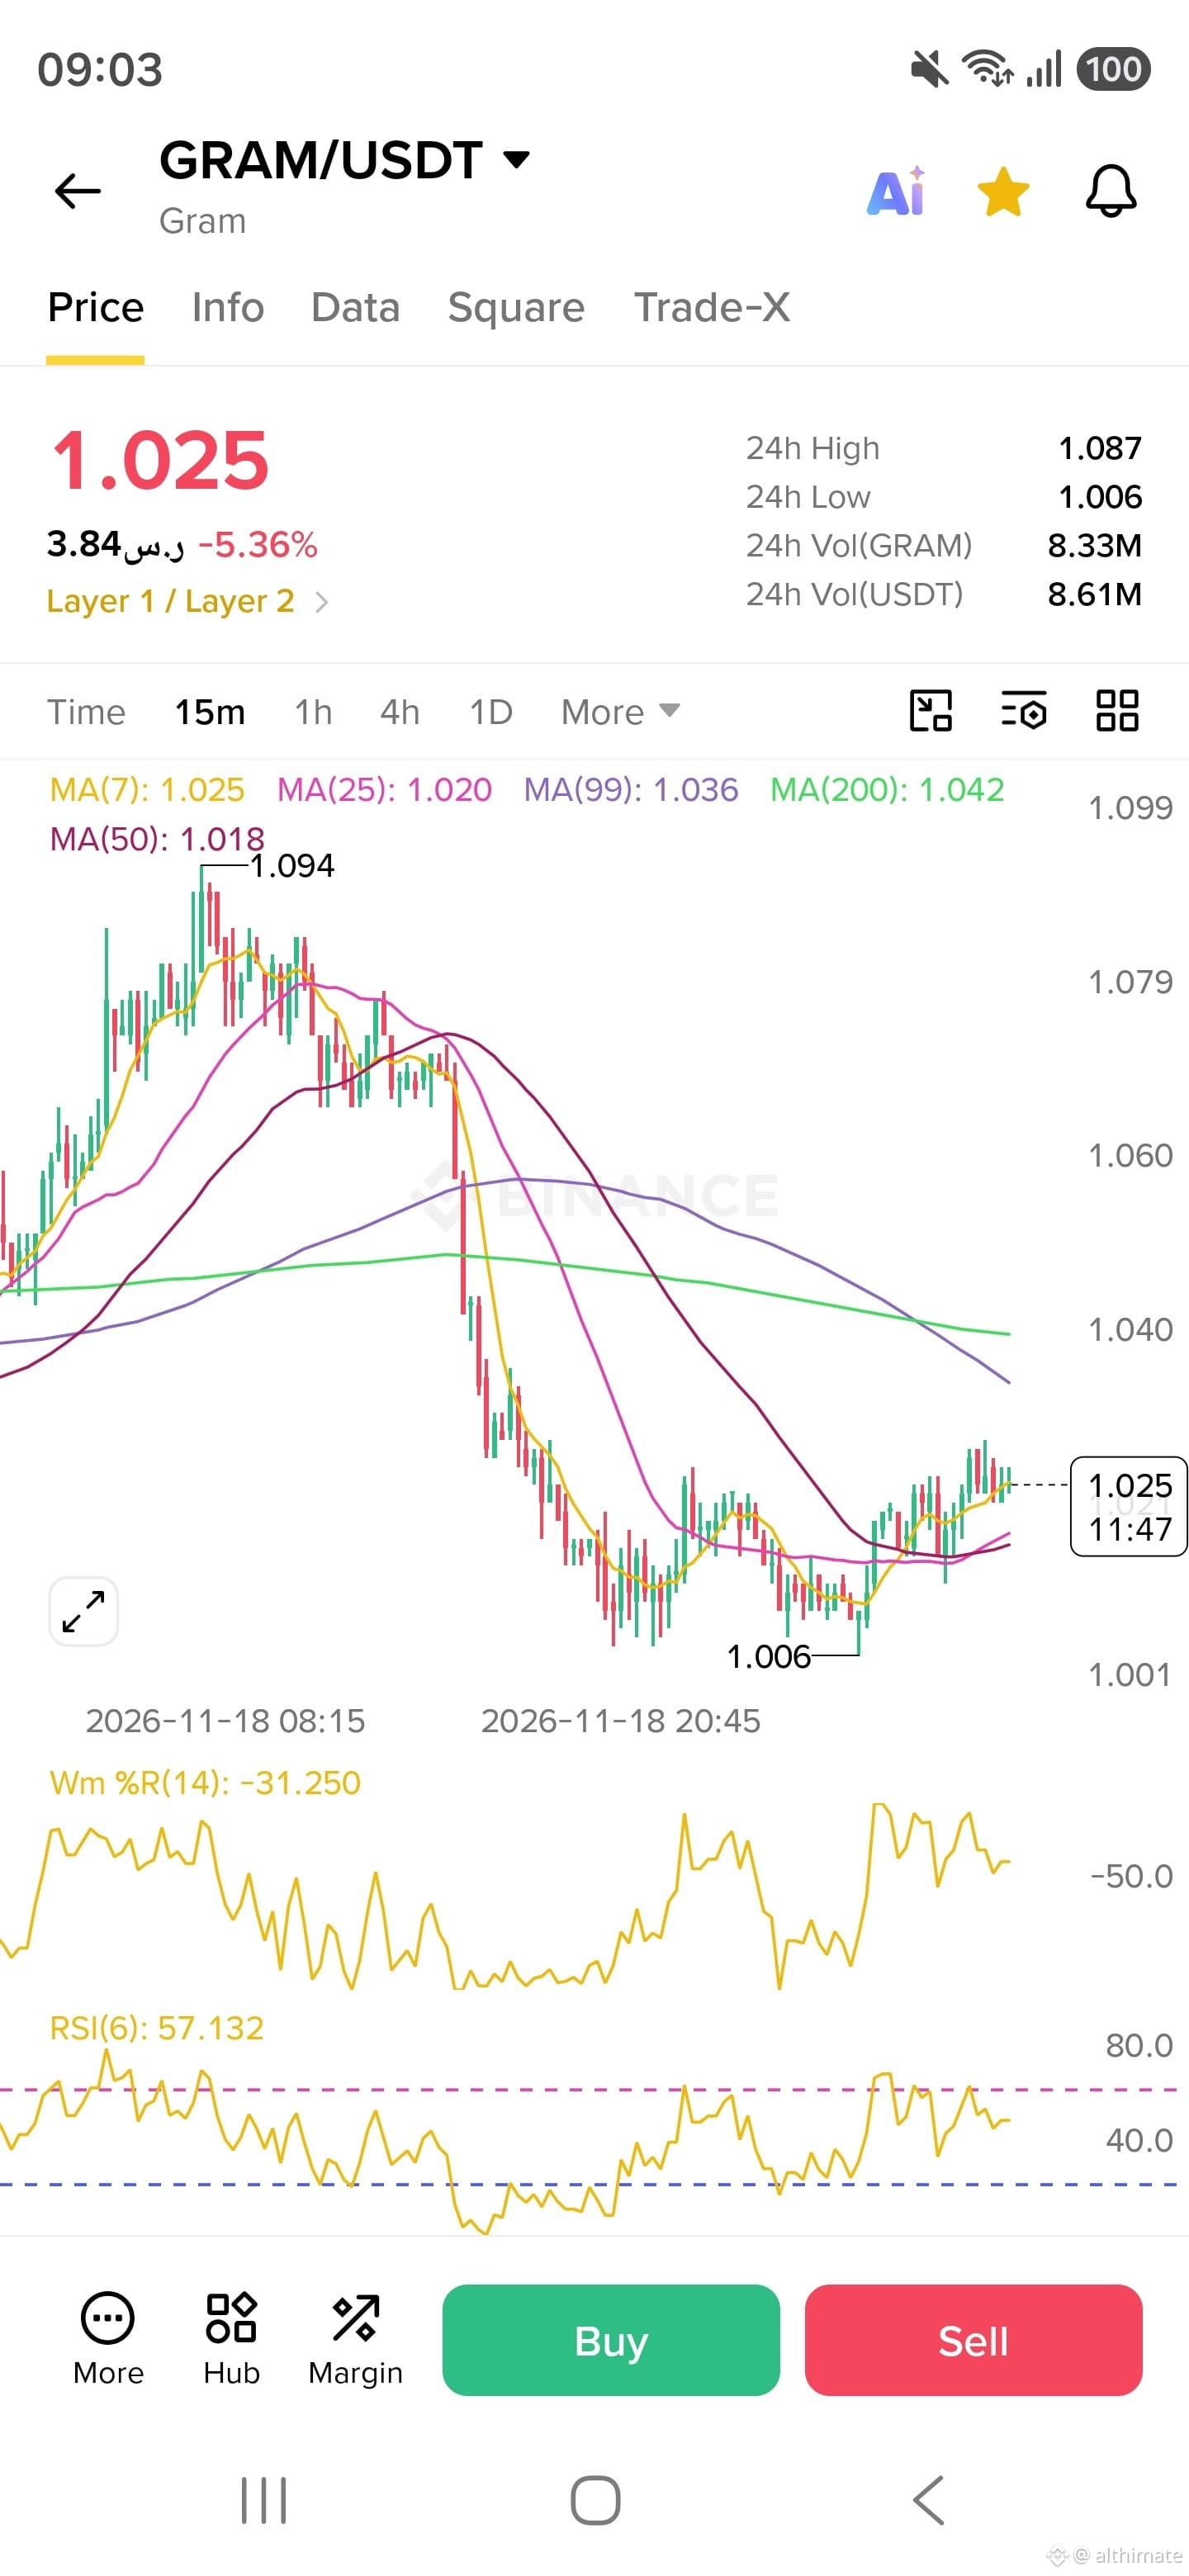
🟢 Entry: 1.010 – 1.020
🔴 Stop Loss: 0.950
🎯 Targets:
T1: 1.100
T2: 1.200
T3: 1.300
The cmp is 1.025!!!! $GRAM #GRAM
{spot}(GRAMUSDT)
#BTCRemainsUnderPressureAfterHawkishFOMCMinutes #NvidiaBoardReportedlySplitOverHuang’sReturn #CanGTA6'sLaunchLiftTTWOShares? #FOMCMinutesHighlightAIDebtRisks
🚀 GRAMUSDT Spot
🟢 Entry: 1.010 – 1.020
🔴 Stop Loss: 0.950
🎯 Targets:
T1: 1.100
T2: 1.200
T3: 1.300
The cmp is 1.025!!!! $GRAM #GRAM
#BTCRemainsUnderPressureAfterHawkishFOMCMinutes #NvidiaBoardReportedlySplitOverHuang’sReturn #CanGTA6'sLaunchLiftTTWOShares? #FOMCMinutesHighlightAIDebtRisks
🟢 Entry: 1.010 – 1.020
🔴 Stop Loss: 0.950
🎯 Targets:
T1: 1.100
T2: 1.200
T3: 1.300
The cmp is 1.025!!!! $GRAM #GRAM
#BTCRemainsUnderPressureAfterHawkishFOMCMinutes #NvidiaBoardReportedlySplitOverHuang’sReturn #CanGTA6'sLaunchLiftTTWOShares? #FOMCMinutesHighlightAIDebtRisks
336


$GRAM: The Campfire That Burns Too Hot Too Fast
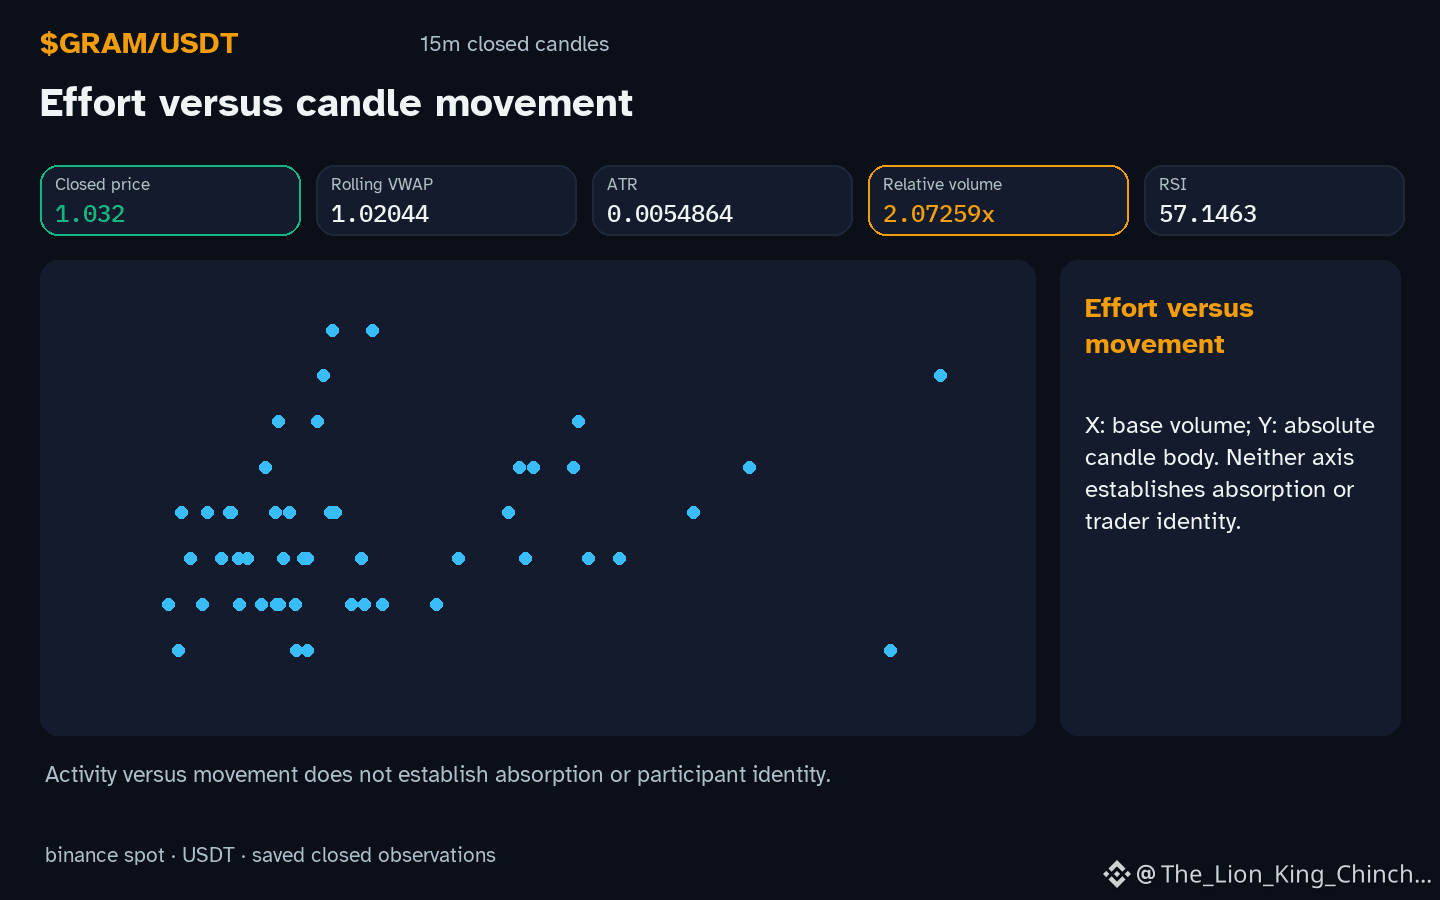
$GRAM: Can a sharp surge in activity signal a fleeting spark rather than a durable flame? The observation for $GRAM shows an hourly direction up with volume above its baseline, a pattern often interpreted as strong momentum. However, the mechanism behind such spikes resembles a campfire built with damp wood: initial intensity burns quickly without sustained heat. This thought experiment treats the volume surge as a hypothetical exhaustion event, where rapid participation exhausts available liquidity, leaving little fuel for continuation. In contrast, steady volume acts like seasoned logs, providing consistent warmth over time. The current reading of relative volume 2.07x baseline suggests a temporary spike rather than a structural shift. To reassess this interpretation, watch whether subsequent candles maintain elevated participation or revert to quieter levels. A decline in volume while price holds would indicate absorption, whereas fading interest could signal a return to baseline behavior. The RSI 57.1 offers no confirmation of exhaustion on its own, as it merely reflects recent price velocity. Future closed-candle evidence showing diminishing volume alongside a stall in upward movement would weaken the exhaustion narrative. Without such confirmation, the spike remains a localized event, not a trend reversal. The distinction between a mechanism and its label lies in observing whether the underlying participation persists or dissipates.
Probabilistic market research, not a recommendation or guaranteed return.
The comparison to keep in mind: $BTC has hourly direction down and volume not above its baseline; $HUMA has hourly direction up and volume above its baseline. This alone does not establish correlation.
#GRAM #BTC #HUMA #CryptoEducation #CryptoLearning
$GRAM : The Campfire That Burns Too Hot Too Fast
$GRAM : Can a sharp surge in activity signal a fleeting spark rather than a durable flame? The observation for $GRAM shows an hourly direction up with volume above its baseline, a pattern often interpreted as strong momentum. However, the mechanism behind such spikes resembles a campfire built with damp wood: initial intensity burns quickly without sustained heat. This thought experiment treats the volume surge as a hypothetical exhaustion event, where rapid participation exhausts available liquidity, leaving little fuel for continuation. In contrast, steady volume acts like seasoned logs, providing consistent warmth over time. The current reading of relative volume 2.07x baseline suggests a temporary spike rather than a structural shift. To reassess this interpretation, watch whether subsequent candles maintain elevated participation or revert to quieter levels. A decline in volume while price holds would indicate absorption, whereas fading interest could signal a return to baseline behavior. The RSI 57.1 offers no confirmation of exhaustion on its own, as it merely reflects recent price velocity. Future closed-candle evidence showing diminishing volume alongside a stall in upward movement would weaken the exhaustion narrative. Without such confirmation, the spike remains a localized event, not a trend reversal. The distinction between a mechanism and its label lies in observing whether the underlying participation persists or dissipates.
Probabilistic market research, not a recommendation or guaranteed return.
The comparison to keep in mind: $BTC has hourly direction down and volume not above its baseline; $HUMA has hourly direction up and volume above its baseline. This alone does not establish correlation.
#GRAM #BTC #HUMA #CryptoEducation #CryptoLearning
$GRAM : Can a sharp surge in activity signal a fleeting spark rather than a durable flame? The observation for $GRAM shows an hourly direction up with volume above its baseline, a pattern often interpreted as strong momentum. However, the mechanism behind such spikes resembles a campfire built with damp wood: initial intensity burns quickly without sustained heat. This thought experiment treats the volume surge as a hypothetical exhaustion event, where rapid participation exhausts available liquidity, leaving little fuel for continuation. In contrast, steady volume acts like seasoned logs, providing consistent warmth over time. The current reading of relative volume 2.07x baseline suggests a temporary spike rather than a structural shift. To reassess this interpretation, watch whether subsequent candles maintain elevated participation or revert to quieter levels. A decline in volume while price holds would indicate absorption, whereas fading interest could signal a return to baseline behavior. The RSI 57.1 offers no confirmation of exhaustion on its own, as it merely reflects recent price velocity. Future closed-candle evidence showing diminishing volume alongside a stall in upward movement would weaken the exhaustion narrative. Without such confirmation, the spike remains a localized event, not a trend reversal. The distinction between a mechanism and its label lies in observing whether the underlying participation persists or dissipates.
Probabilistic market research, not a recommendation or guaranteed return.
The comparison to keep in mind: $BTC has hourly direction down and volume not above its baseline; $HUMA has hourly direction up and volume above its baseline. This alone does not establish correlation.
#GRAM #BTC #HUMA #CryptoEducation #CryptoLearning
1
45

·
--
📊 Crypto Market Analysis – November 19, 2026
🔹 $GRAM : Trading near $1.03, facing bearish pressure. Support around $0.993 is important. A recovery above $1.07 could improve momentum.
🔹 $ZRO : Trading near $1.44, showing a strong 24-hour recovery. Buyers are targeting the $1.45 resistance zone. Holding $1.35 could support further upside.
🔹 $DASH : Trading near $37.70, with selling pressure continuing. Support is around $36.30, while $38.00 is the immediate resistance.
📈 Overall Outlook: GRAM remains bearish, ZRO shows short-term recovery, and DASH needs stronger buying volume. Stay patient and manage risk.
#GRAM #ZRO #DASH #CryptoAnalysis #CryptoTrading #MarketUpdate
{future}(GRAMUSDT)
{future}(ZROUSDT)
{future}(DASHUSDT)
📊 Crypto Market Analysis – November 19, 2026
🔹 $GRAM : Trading near $1.03, facing bearish pressure. Support around $0.993 is important. A recovery above $1.07 could improve momentum.
🔹 $ZRO : Trading near $1.44, showing a strong 24-hour recovery. Buyers are targeting the $1.45 resistance zone. Holding $1.35 could support further upside.
🔹 $DASH : Trading near $37.70, with selling pressure continuing. Support is around $36.30, while $38.00 is the immediate resistance.
📈 Overall Outlook: GRAM remains bearish, ZRO shows short-term recovery, and DASH needs stronger buying volume. Stay patient and manage risk.
#GRAM #ZRO #DASH #CryptoAnalysis #CryptoTrading #MarketUpdate
🔹 $GRAM : Trading near $1.03, facing bearish pressure. Support around $0.993 is important. A recovery above $1.07 could improve momentum.
🔹 $ZRO : Trading near $1.44, showing a strong 24-hour recovery. Buyers are targeting the $1.45 resistance zone. Holding $1.35 could support further upside.
🔹 $DASH : Trading near $37.70, with selling pressure continuing. Support is around $36.30, while $38.00 is the immediate resistance.
📈 Overall Outlook: GRAM remains bearish, ZRO shows short-term recovery, and DASH needs stronger buying volume. Stay patient and manage risk.
#GRAM #ZRO #DASH #CryptoAnalysis #CryptoTrading #MarketUpdate
33

·
--
Article
#NFTthe best and easiest way of making money 🤑 with 0 fund is creating (finding, claiming available telegram username) yesterday I sold username that I claimed for free for 19Grams guys not set ,find any way of making money #Gram
#NFT
the best and easiest way of making money 🤑 with 0 fund is creating (finding, claiming available telegram username) yesterday I sold username that I claimed for free for 19Grams guys not set ,find any way of making money #Gram
308

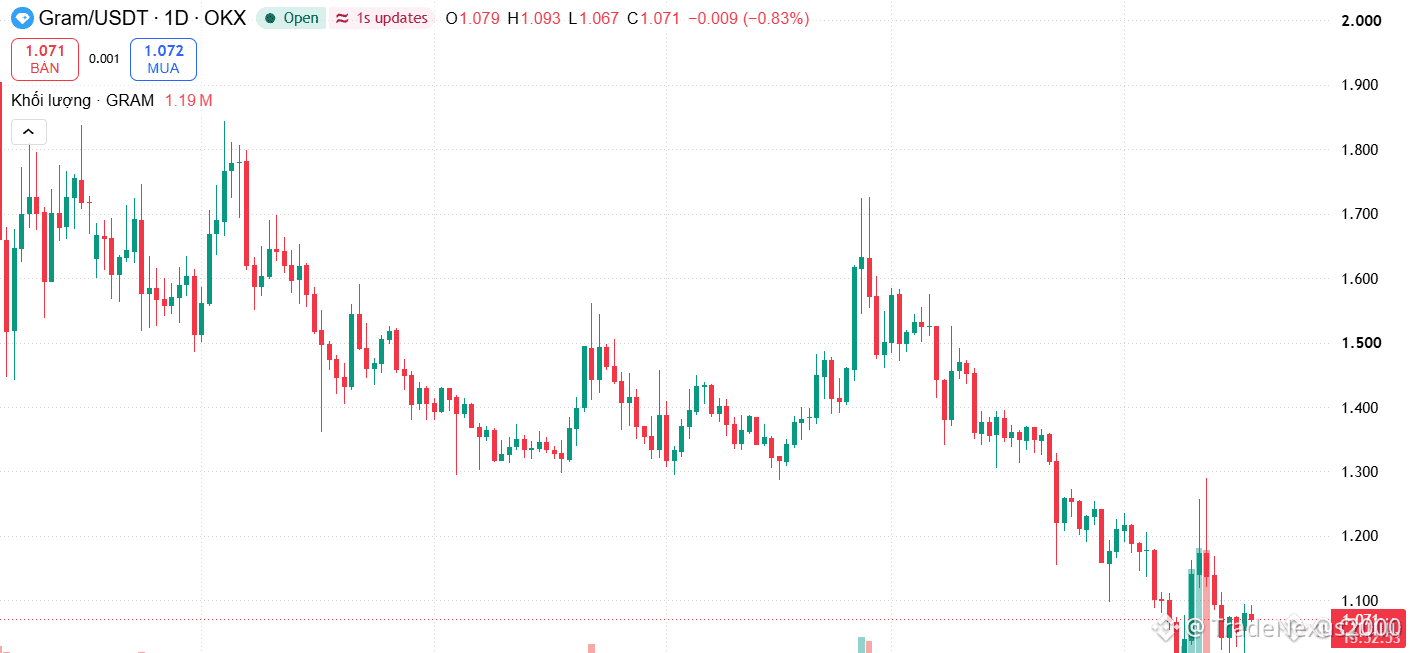
🦈 $GRAM FAILING TO CAPTURE SECTOR ROTATION AS SMART MONEY DRAINS LIQUIDITY 📉
Entry: 1.60 ⚡
Target: 1.70 🚀
While Layer-1 majors expand rapidly on aggressive capital inflows, assets like $GRAM display clear structural exhaustion. Price compression down to 1.07 highlights a distribution phase where institutional liquidity evaporates, leaving late capital trapped underwater. 📊
When participants fail to secure profits at local resistance around 1.70, structural momentum stalls completely. Without fresh order flow stepping in, shallow retracements act as exit liquidity for smart money rotating into higher-beta strength. 💡
💬 Are you holding through structural drawdowns or cutting exposure to reallocate capital? 👇
⚠️ Not financial advice. Always manage your risk. 🛡️
🏷️ #GRAM #MarketStructure #SmartMoney #Altcoins #Trading
🦈 📉
🦈 $GRAM FAILING TO CAPTURE SECTOR ROTATION AS SMART MONEY DRAINS LIQUIDITY 📉
Entry: 1.60 ⚡
Target: 1.70 🚀
While Layer-1 majors expand rapidly on aggressive capital inflows, assets like $GRAM display clear structural exhaustion. Price compression down to 1.07 highlights a distribution phase where institutional liquidity evaporates, leaving late capital trapped underwater. 📊
When participants fail to secure profits at local resistance around 1.70, structural momentum stalls completely. Without fresh order flow stepping in, shallow retracements act as exit liquidity for smart money rotating into higher-beta strength. 💡
💬 Are you holding through structural drawdowns or cutting exposure to reallocate capital? 👇
⚠️ Not financial advice. Always manage your risk. 🛡️
🏷️ #GRAM #MarketStructure #SmartMoney #Altcoins #Trading
🦈 📉
Entry: 1.60 ⚡
Target: 1.70 🚀
While Layer-1 majors expand rapidly on aggressive capital inflows, assets like $GRAM display clear structural exhaustion. Price compression down to 1.07 highlights a distribution phase where institutional liquidity evaporates, leaving late capital trapped underwater. 📊
When participants fail to secure profits at local resistance around 1.70, structural momentum stalls completely. Without fresh order flow stepping in, shallow retracements act as exit liquidity for smart money rotating into higher-beta strength. 💡
💬 Are you holding through structural drawdowns or cutting exposure to reallocate capital? 👇
⚠️ Not financial advice. Always manage your risk. 🛡️
🏷️ #GRAM #MarketStructure #SmartMoney #Altcoins #Trading
🦈 📉
23

·
--
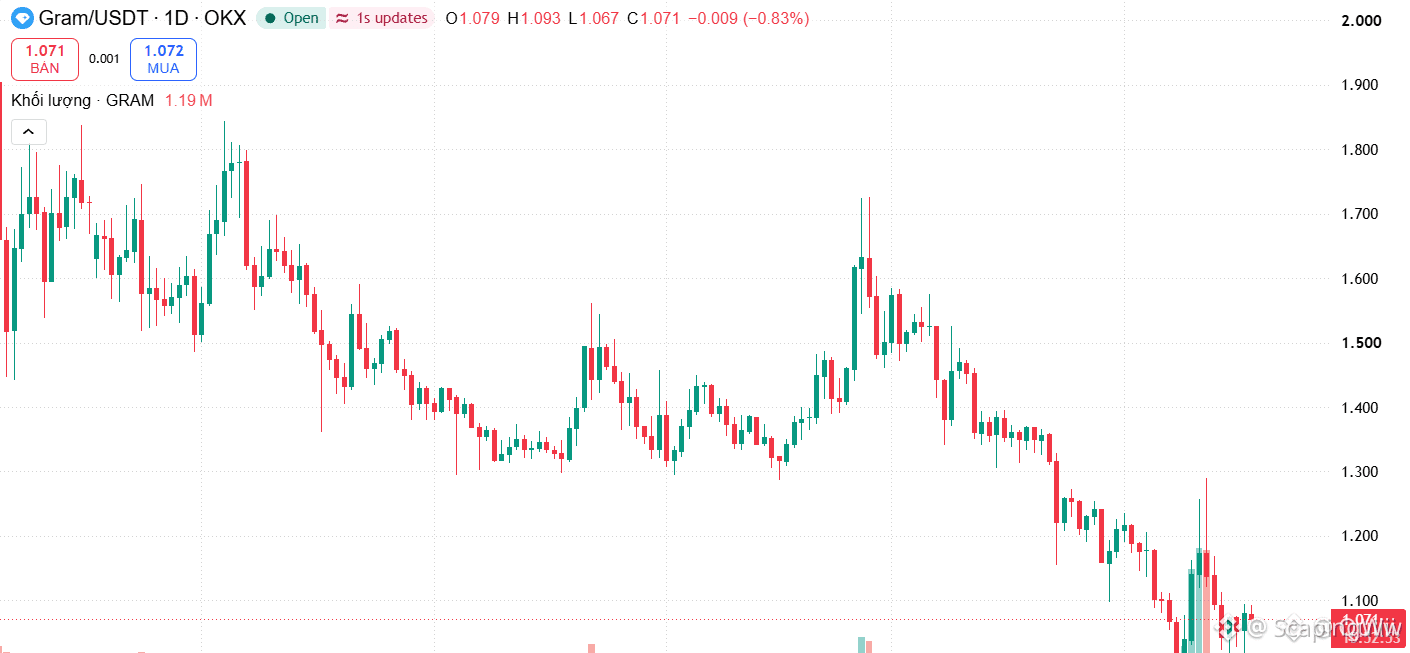
WHILE OTHER L1 TOKENS RALLY HARD, $GRAM IS STUCK BLEEDING OUT IN THE DUST! 📉🩸
Entry: 1.60 ⚡
Target: 1.70 🚀
While tier-one momentum pushes sector leaders into hyperdrive, lagging assets are facing brutal reality checks. $GRAM hit a wall near the upper range before sliding hard down to current lows, leaving late buyers trapped underwater as institutional liquidity dries up completely. Short-term bounces look sluggish when relative strength completely abandons a chart, forcing holders into an extended waiting game. 📊
Volume profiles show aggressive distribution while buyers lack the structural firepower to defend local floors. 💡 Are you catching falling knives on laggard altcoins, or waiting for confirmed trend reversals first? 🤔
⚠️ Not financial advice. Always manage your risk. 🛡️
🏷️ #GRAM #Altcoins #Trading #Crypto #MarketUpdate
🔥 💎
WHILE OTHER L1 TOKENS RALLY HARD, $GRAM IS STUCK BLEEDING OUT IN THE DUST! 📉🩸
Entry: 1.60 ⚡
Target: 1.70 🚀
While tier-one momentum pushes sector leaders into hyperdrive, lagging assets are facing brutal reality checks. $GRAM hit a wall near the upper range before sliding hard down to current lows, leaving late buyers trapped underwater as institutional liquidity dries up completely. Short-term bounces look sluggish when relative strength completely abandons a chart, forcing holders into an extended waiting game. 📊
Volume profiles show aggressive distribution while buyers lack the structural firepower to defend local floors. 💡 Are you catching falling knives on laggard altcoins, or waiting for confirmed trend reversals first? 🤔
⚠️ Not financial advice. Always manage your risk. 🛡️
🏷️ #GRAM #Altcoins #Trading #Crypto #MarketUpdate
🔥 💎
Entry: 1.60 ⚡
Target: 1.70 🚀
While tier-one momentum pushes sector leaders into hyperdrive, lagging assets are facing brutal reality checks. $GRAM hit a wall near the upper range before sliding hard down to current lows, leaving late buyers trapped underwater as institutional liquidity dries up completely. Short-term bounces look sluggish when relative strength completely abandons a chart, forcing holders into an extended waiting game. 📊
Volume profiles show aggressive distribution while buyers lack the structural firepower to defend local floors. 💡 Are you catching falling knives on laggard altcoins, or waiting for confirmed trend reversals first? 🤔
⚠️ Not financial advice. Always manage your risk. 🛡️
🏷️ #GRAM #Altcoins #Trading #Crypto #MarketUpdate
🔥 💎
22

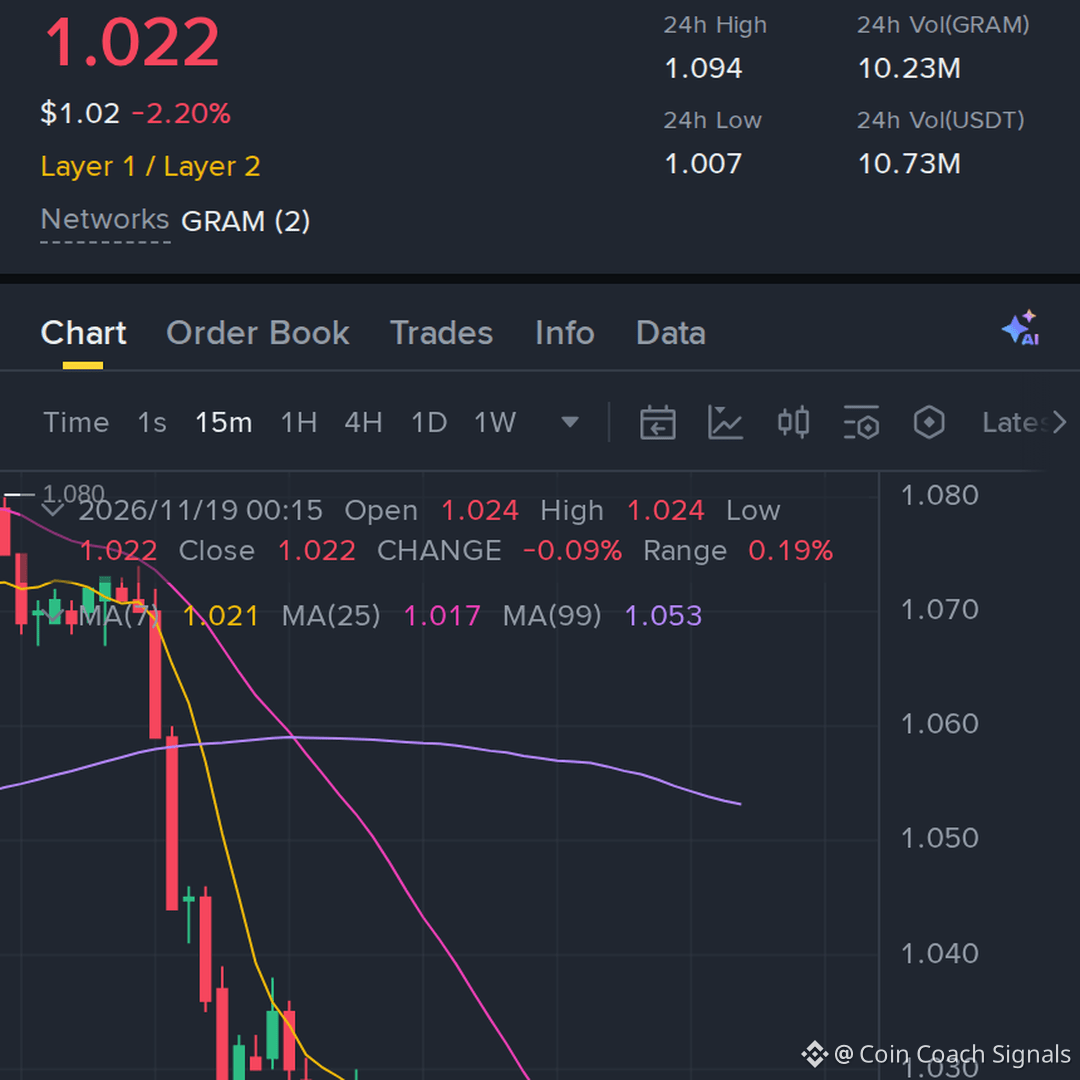
alright, $GRAM keeps rejecting the same area, so the short side is worth watching
Entry: 1.022–1.023
TP1: 0.999 / TP2: 0.98 / TP3: 0.951
Stop Loss: 1.039
#GRAM #Write2Earn #Binance #crypto
alright, $GRAM keeps rejecting the same area, so the short side is worth watching
Entry: 1.022–1.023
TP1: 0.999 / TP2: 0.98 / TP3: 0.951
Stop Loss: 1.039
#GRAM #Write2Earn #Binance #crypto
Entry: 1.022–1.023
TP1: 0.999 / TP2: 0.98 / TP3: 0.951
Stop Loss: 1.039
#GRAM #Write2Earn #Binance #crypto
104

🚀 GRAM (GRAM/USDT) – Is a Major Bullish Reversal Coming?
Gram is currently trading around $1.015, showing a decline of approximately 5.31%. Despite the recent correction, GRAM is approaching an important technical support area that could become a potential accumulation zone.
📊 Market Overview:
- Current Price: $1.015
- Market Cap: $2.92 Billion
- Fully Diluted Market Cap: $5.37 Billion
- 24H Volume: $92.23 Million
- Market Rank: #27
🔥 Technical Outlook:
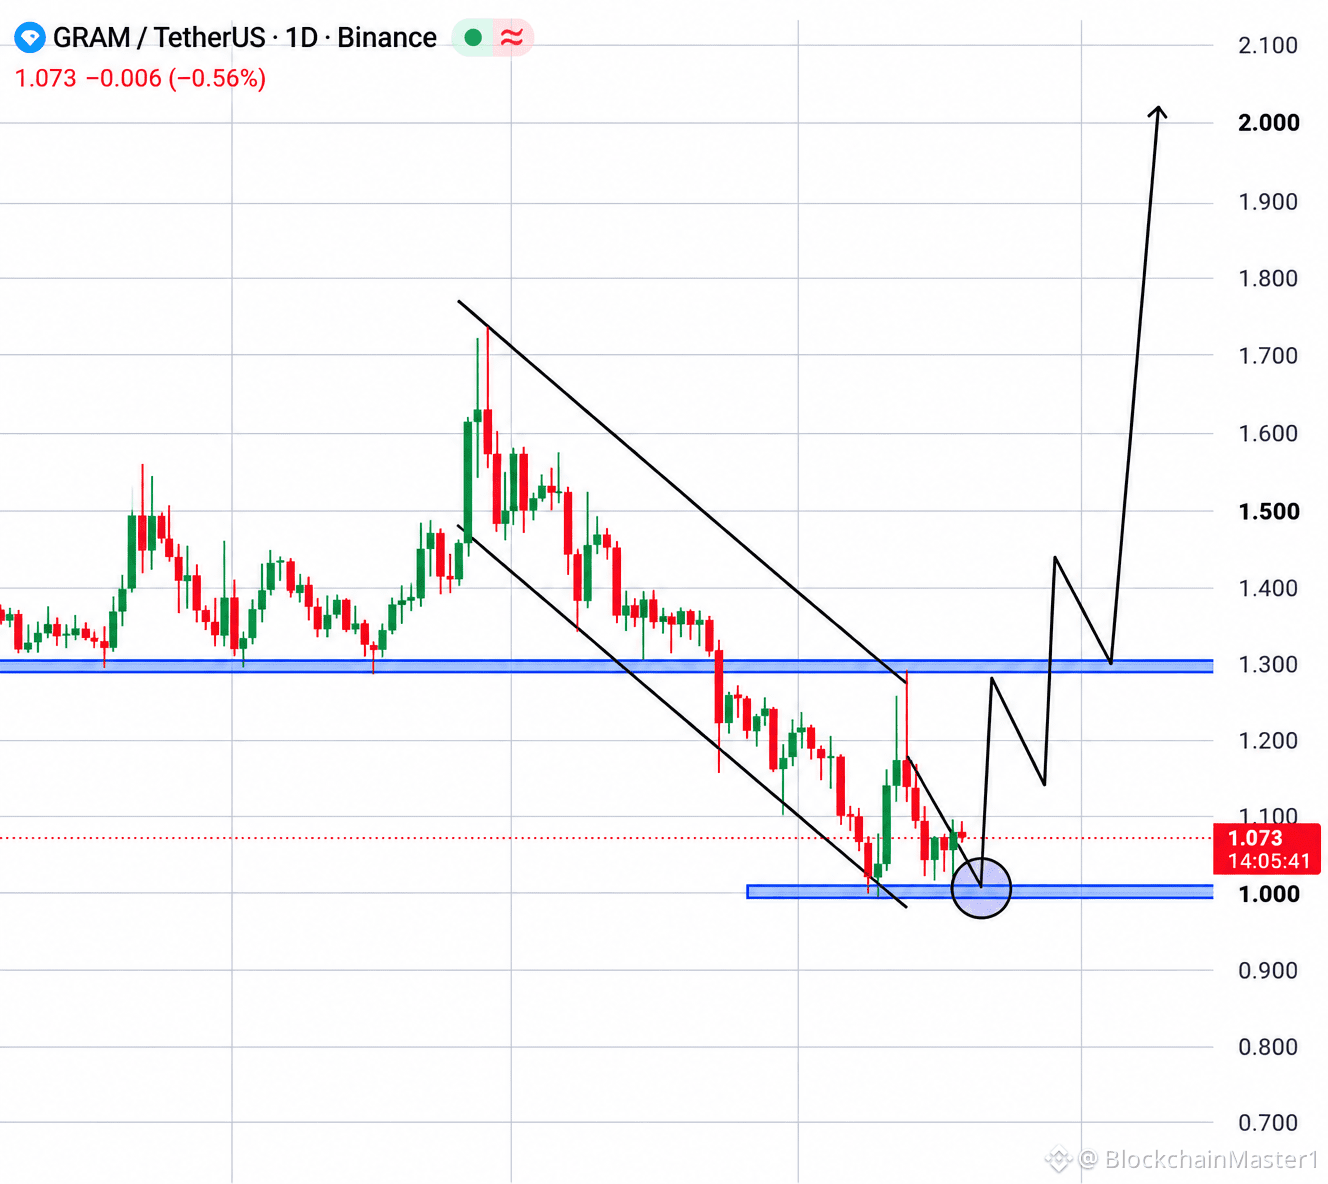
The daily chart shows a descending channel, with price approaching the important $1.00 support zone. A successful bounce could trigger a recovery toward the $1.30 resistance level. A confirmed breakout above this level may open the door for a stronger bullish move.
🎯 Potential Entry Zone: $1.00–$1.05
🎯 Take Profit Targets:
- TP1: $1.30
- TP2: $1.50
- TP3: $1.75
- TP4: $2.00
🛑 Stop Loss: Below $0.95 (risk-management reference).
⚡ Bullish Confirmation: A strong daily close above $1.30 with increasing trading volume could confirm a breakout.
⚠️ If GRAM loses the $1.00 support, further downside remains possible. These targets are speculative scenarios, not guaranteed outcomes. Always manage risk carefully.
Can GRAM reach $2.00 in the next bullish move?
#GRAM $GRAM $ZKC $ZIL
{future}(ZILUSDT)
{future}(GRAMUSDT)
🚀 GRAM (GRAM/USDT) – Is a Major Bullish Reversal Coming?
Gram is currently trading around $1.015, showing a decline of approximately 5.31%. Despite the recent correction, GRAM is approaching an important technical support area that could become a potential accumulation zone.
📊 Market Overview:
- Current Price: $1.015
- Market Cap: $2.92 Billion
- Fully Diluted Market Cap: $5.37 Billion
- 24H Volume: $92.23 Million
- Market Rank: #27
🔥 Technical Outlook:
The daily chart shows a descending channel, with price approaching the important $1.00 support zone. A successful bounce could trigger a recovery toward the $1.30 resistance level. A confirmed breakout above this level may open the door for a stronger bullish move.
🎯 Potential Entry Zone: $1.00–$1.05
🎯 Take Profit Targets:
- TP1: $1.30
- TP2: $1.50
- TP3: $1.75
- TP4: $2.00
🛑 Stop Loss: Below $0.95 (risk-management reference).
⚡ Bullish Confirmation: A strong daily close above $1.30 with increasing trading volume could confirm a breakout.
⚠️ If GRAM loses the $1.00 support, further downside remains possible. These targets are speculative scenarios, not guaranteed outcomes. Always manage risk carefully.
Can GRAM reach $2.00 in the next bullish move?
#GRAM $GRAM $ZKC $ZIL
Gram is currently trading around $1.015, showing a decline of approximately 5.31%. Despite the recent correction, GRAM is approaching an important technical support area that could become a potential accumulation zone.
📊 Market Overview:
- Current Price: $1.015
- Market Cap: $2.92 Billion
- Fully Diluted Market Cap: $5.37 Billion
- 24H Volume: $92.23 Million
- Market Rank: #27
🔥 Technical Outlook:
The daily chart shows a descending channel, with price approaching the important $1.00 support zone. A successful bounce could trigger a recovery toward the $1.30 resistance level. A confirmed breakout above this level may open the door for a stronger bullish move.
🎯 Potential Entry Zone: $1.00–$1.05
🎯 Take Profit Targets:
- TP1: $1.30
- TP2: $1.50
- TP3: $1.75
- TP4: $2.00
🛑 Stop Loss: Below $0.95 (risk-management reference).
⚡ Bullish Confirmation: A strong daily close above $1.30 with increasing trading volume could confirm a breakout.
⚠️ If GRAM loses the $1.00 support, further downside remains possible. These targets are speculative scenarios, not guaranteed outcomes. Always manage risk carefully.
Can GRAM reach $2.00 in the next bullish move?
#GRAM $GRAM $ZKC $ZIL

2
795

·
--
Can $GRAM hold its ground despite a 5.16% daily dip?
Volume has cooled significantly, currently running at 0.87x the 23-hour average. With the price at $1.012, market activity remains subdued after recent volatility.
Watch for a move back above the $1.096 high as a sign of renewed interest. Conversely, failing to sustain the $1.01 level could suggest further downside pressure.
Does the current low-volume consolidation signal a period of accumulation or a lack of conviction from buyers?
Tap $GRAM for the live chart. #GRAM #BinanceSquare
Can $GRAM hold its ground despite a 5.16% daily dip?
Volume has cooled significantly, currently running at 0.87x the 23-hour average. With the price at $1.012, market activity remains subdued after recent volatility.
Watch for a move back above the $1.096 high as a sign of renewed interest. Conversely, failing to sustain the $1.01 level could suggest further downside pressure.
Does the current low-volume consolidation signal a period of accumulation or a lack of conviction from buyers?
Tap $GRAM for the live chart. #GRAM #BinanceSquare
Volume has cooled significantly, currently running at 0.87x the 23-hour average. With the price at $1.012, market activity remains subdued after recent volatility.
Watch for a move back above the $1.096 high as a sign of renewed interest. Conversely, failing to sustain the $1.01 level could suggest further downside pressure.
Does the current low-volume consolidation signal a period of accumulation or a lack of conviction from buyers?
Tap $GRAM for the live chart. #GRAM #BinanceSquare
21

·
--
The tide is shifting in favor of the bulls, and $GRAM has just presented a tactical setup that aligns with my current outlook. I have mapped out the trade parameters below for those tracking the volatility.
⚡ $GRAM — LONG SETUP
📍 Entry: 0.9979 – 1.004
🎯 TP1: 1.0161
🎯 TP2: 1.0241
🎯 TP3: 1.0362
🛑 Stop Loss: 0.9919
Trade here 👇
📌 Trade management rules: see pinned post.
What’s your take on this $GRAM setup? Let me know in the comments or follow for more real-time entries.
#WriteToEarn #GRAM #CryptoTrading #BinanceSquare #Crypto
The tide is shifting in favor of the bulls, and $GRAM has just presented a tactical setup that aligns with my current outlook. I have mapped out the trade parameters below for those tracking the volatility.
⚡ $GRAM — LONG SETUP
📍 Entry: 0.9979 – 1.004
🎯 TP1: 1.0161
🎯 TP2: 1.0241
🎯 TP3: 1.0362
🛑 Stop Loss: 0.9919
Trade here 👇
📌 Trade management rules: see pinned post.
What’s your take on this $GRAM setup? Let me know in the comments or follow for more real-time entries.
#WriteToEarn #GRAM #CryptoTrading #BinanceSquare #Crypto
⚡ $GRAM — LONG SETUP
📍 Entry: 0.9979 – 1.004
🎯 TP1: 1.0161
🎯 TP2: 1.0241
🎯 TP3: 1.0362
🛑 Stop Loss: 0.9919
Trade here 👇
📌 Trade management rules: see pinned post.
What’s your take on this $GRAM setup? Let me know in the comments or follow for more real-time entries.
#WriteToEarn #GRAM #CryptoTrading #BinanceSquare #Crypto
1
79

·
--
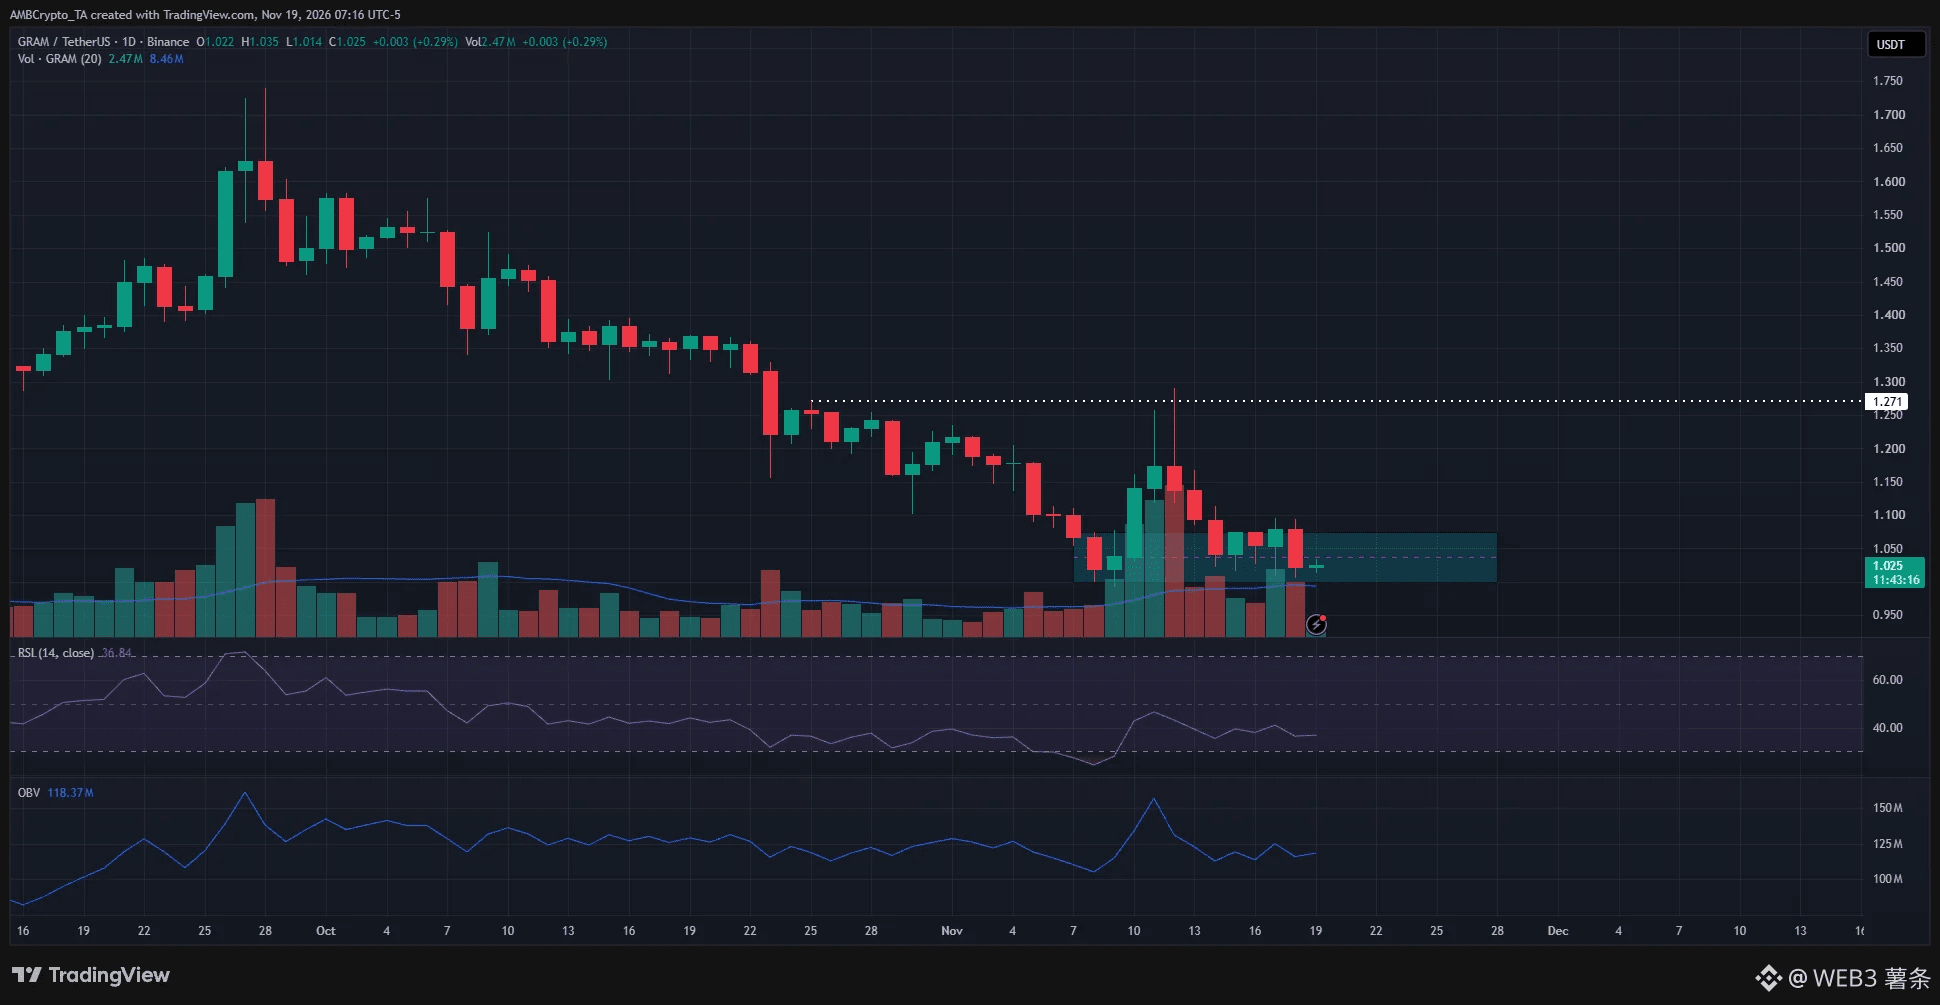
GRAM staged a rebound earlier this month, with its price briefly breaking above October’s high of $1.27. However, it soon pulled back, indicating significant selling pressure overhead and that sellers remain in control.
Daily technical indicators show that the RSI for #GRAM has remained below 50 for a full month, suggesting that the broader market is weak and buying pressure is insufficient. The $1.00–$1.07 area is currently a key support zone to watch. If buyers can hold this level, the price may still have a chance to rebound. The next step is to monitor the OBV volume indicator to see whether funds are flowing back in.
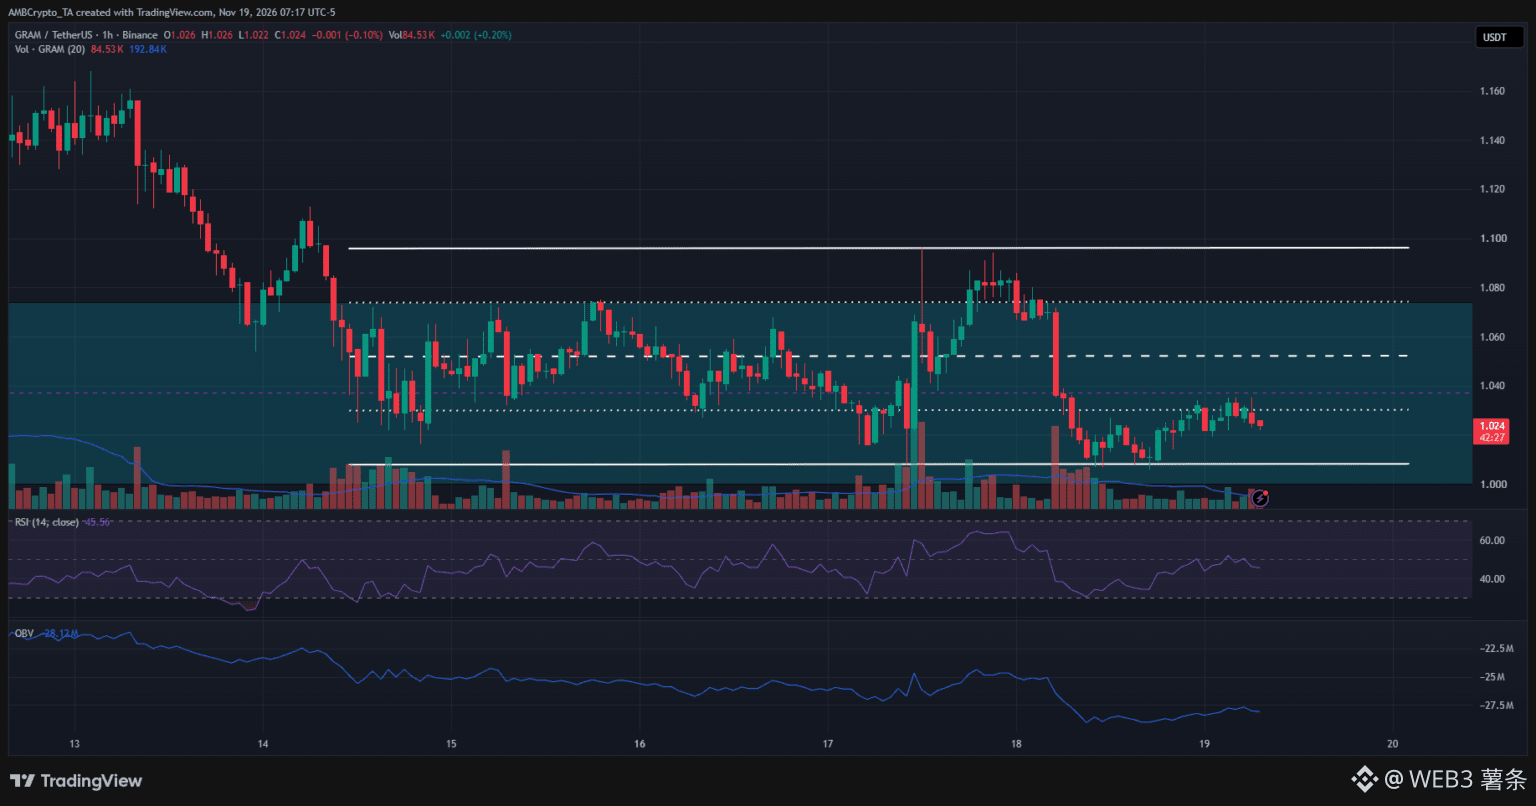
Key short-term price level: Watch support at $1
On the 1-hour chart, GRAM is currently trading mostly between $1.00 and $1.09, with the midpoint around $1.045. At the time of analysis, the price had moved close to the lower end of the range.
If support holds near $1, a short-term rebound may follow. However, a further drop below $0.978 would indicate strengthening bearish momentum and could invalidate the potential rebound within the range.
Two scenarios to watch:
Upside: A rebound to $1.045–$1.09 could encounter fresh selling pressure.
Downside: A break below $0.98 could cause the short-term trend to weaken further.
Overall, GRAM remains in a weak, range-bound phase, with $1 serving as an important level to watch.
GRAM staged a rebound earlier this month, with its price briefly breaking above October’s high of $1.27. However, it soon pulled back, indicating significant selling pressure overhead and that sellers remain in control.
Daily technical indicators show that the RSI for #GRAM has remained below 50 for a full month, suggesting that the broader market is weak and buying pressure is insufficient. The $1.00–$1.07 area is currently a key support zone to watch. If buyers can hold this level, the price may still have a chance to rebound. The next step is to monitor the OBV volume indicator to see whether funds are flowing back in.
Key short-term price level: Watch support at $1
On the 1-hour chart, GRAM is currently trading mostly between $1.00 and $1.09, with the midpoint around $1.045. At the time of analysis, the price had moved close to the lower end of the range.
If support holds near $1, a short-term rebound may follow. However, a further drop below $0.978 would indicate strengthening bearish momentum and could invalidate the potential rebound within the range.
Two scenarios to watch:
Upside: A rebound to $1.045–$1.09 could encounter fresh selling pressure.
Downside: A break below $0.98 could cause the short-term trend to weaken further.
Overall, GRAM remains in a weak, range-bound phase, with $1 serving as an important level to watch.
Daily technical indicators show that the RSI for #GRAM has remained below 50 for a full month, suggesting that the broader market is weak and buying pressure is insufficient. The $1.00–$1.07 area is currently a key support zone to watch. If buyers can hold this level, the price may still have a chance to rebound. The next step is to monitor the OBV volume indicator to see whether funds are flowing back in.
Key short-term price level: Watch support at $1
On the 1-hour chart, GRAM is currently trading mostly between $1.00 and $1.09, with the midpoint around $1.045. At the time of analysis, the price had moved close to the lower end of the range.
If support holds near $1, a short-term rebound may follow. However, a further drop below $0.978 would indicate strengthening bearish momentum and could invalidate the potential rebound within the range.
Two scenarios to watch:
Upside: A rebound to $1.045–$1.09 could encounter fresh selling pressure.
Downside: A break below $0.98 could cause the short-term trend to weaken further.
Overall, GRAM remains in a weak, range-bound phase, with $1 serving as an important level to watch.
185

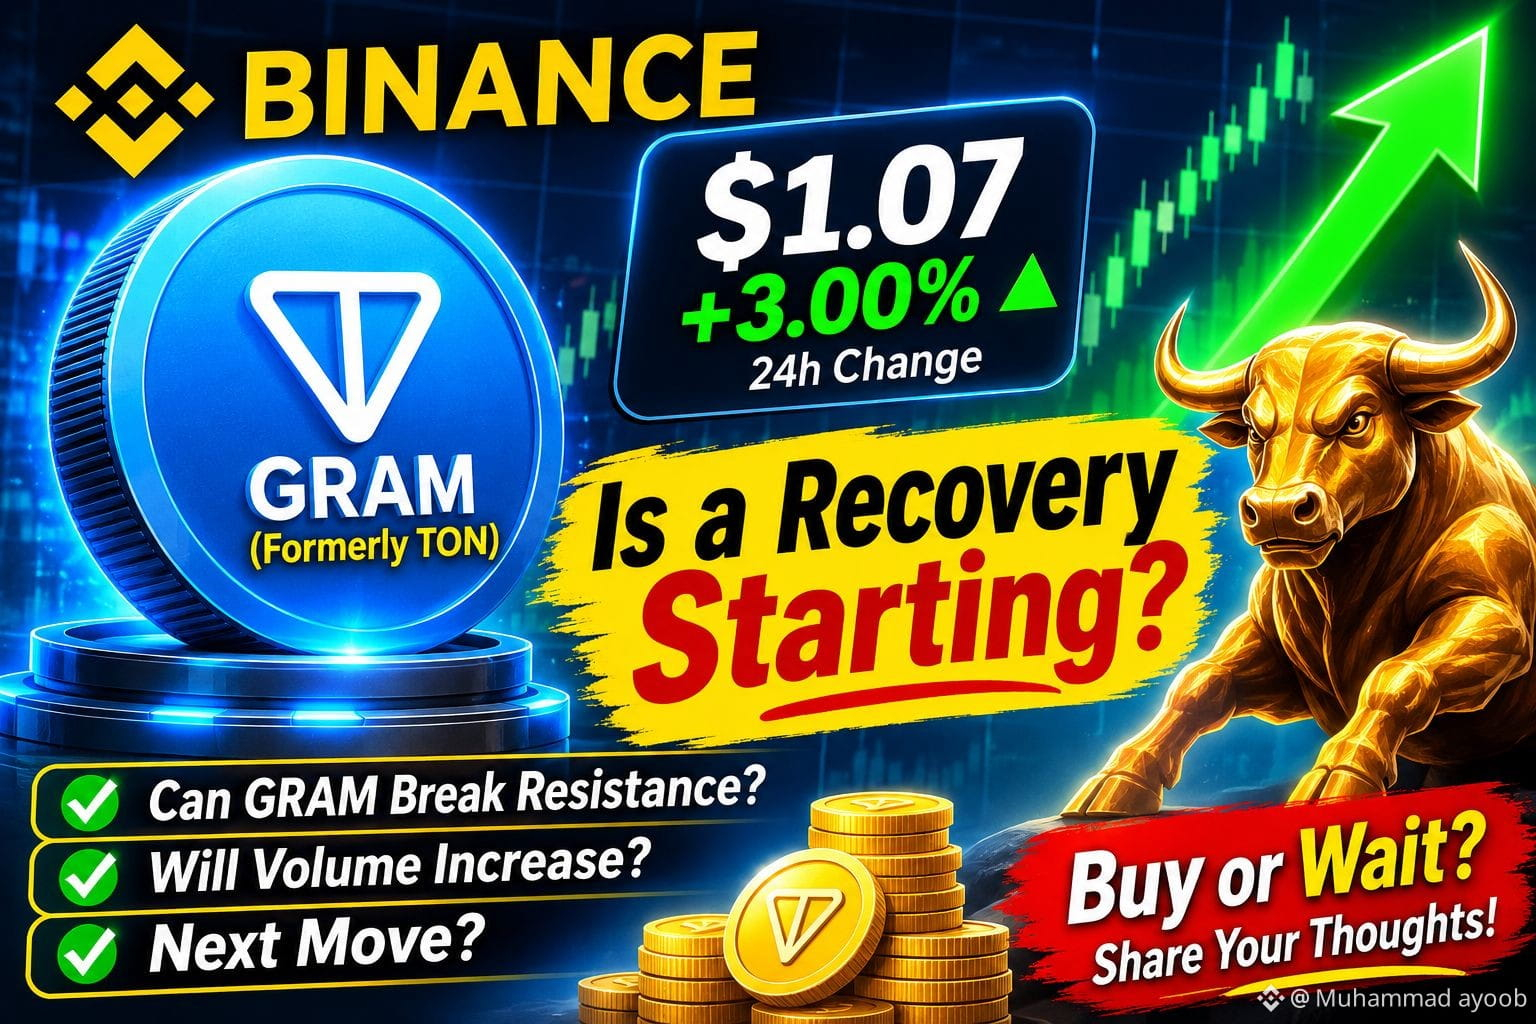
🚀$GRAM (Formerly TON): Is a Recovery Starting?
GRAM is attracting attention in the crypto market as buyers show renewed interest.
📊 Market Highlights:
- Current price: Approximately $1.07
- 24-hour change: Around +3%
- Market cap: Approximately $3.1 billion
- 24-hour trading volume: Around $104 million
What Should Investors Watch?
1. Can GRAM maintain its upward momentum?
2. Will trading volume continue increasing?
3. Can buyers push the price above nearby resistance?
The short-term recovery looks interesting, but the weekly trend still needs attention.
💬 What do you think?
Is GRAM preparing for another rally, or could we see another correction?
#GRAM #TON #crypto #BinanceSquare #Altcoins #CryptoAnalysis #blockchain
{spot}(GRAMUSDT)
🚀$GRAM (Formerly TON): Is a Recovery Starting?
GRAM is attracting attention in the crypto market as buyers show renewed interest.
📊 Market Highlights:
- Current price: Approximately $1.07
- 24-hour change: Around +3%
- Market cap: Approximately $3.1 billion
- 24-hour trading volume: Around $104 million
What Should Investors Watch?
1. Can GRAM maintain its upward momentum?
2. Will trading volume continue increasing?
3. Can buyers push the price above nearby resistance?
The short-term recovery looks interesting, but the weekly trend still needs attention.
💬 What do you think?
Is GRAM preparing for another rally, or could we see another correction?
#GRAM #TON #crypto #BinanceSquare #Altcoins #CryptoAnalysis #blockchain
GRAM is attracting attention in the crypto market as buyers show renewed interest.
📊 Market Highlights:
- Current price: Approximately $1.07
- 24-hour change: Around +3%
- Market cap: Approximately $3.1 billion
- 24-hour trading volume: Around $104 million
What Should Investors Watch?
1. Can GRAM maintain its upward momentum?
2. Will trading volume continue increasing?
3. Can buyers push the price above nearby resistance?
The short-term recovery looks interesting, but the weekly trend still needs attention.
💬 What do you think?
Is GRAM preparing for another rally, or could we see another correction?
#GRAM #TON #crypto #BinanceSquare #Altcoins #CryptoAnalysis #blockchain
1k

·
--
🔴 $GRAM SHORT · 1h
✅ Proven · Diamond Bottom
Entry 1.067
Target 0.9832 (−7.9%)
Stop 1.1047 (+3.5%)
Reward:risk 2.2
📊 All coins, 1h: 47% won of 101 · avg +2.4%
🪙 On GRAM: no tracked trades yet
Automated chart-pattern signal. Not financial advice.
#GRAM #CryptoSignals
🔴 $GRAM SHORT · 1h
✅ Proven · Diamond Bottom
Entry 1.067
Target 0.9832 (−7.9%)
Stop 1.1047 (+3.5%)
Reward:risk 2.2
📊 All coins, 1h: 47% won of 101 · avg +2.4%
🪙 On GRAM: no tracked trades yet
Automated chart-pattern signal. Not financial advice.
#GRAM #CryptoSignals
✅ Proven · Diamond Bottom
Entry 1.067
Target 0.9832 (−7.9%)
Stop 1.1047 (+3.5%)
Reward:risk 2.2
📊 All coins, 1h: 47% won of 101 · avg +2.4%
🪙 On GRAM: no tracked trades yet
Automated chart-pattern signal. Not financial advice.
#GRAM #CryptoSignals
117

·
--
$GRAM Token Unlock Data
Date: November 23 (in 3 days)
Amount: 36.58 million tokens
Value: approximately $37.39 million
Share of circulating supply: 1.28%
Recipient: Ecosystem community
Current price: 1.015 (24h -1.36%)
How do you interpret this information?
#GRAM
$GRAM Token Unlock Data
Date: November 23 (in 3 days)
Amount: 36.58 million tokens
Value: approximately $37.39 million
Share of circulating supply: 1.28%
Recipient: Ecosystem community
Current price: 1.015 (24h -1.36%)
How do you interpret this information?
#GRAM
Date: November 23 (in 3 days)
Amount: 36.58 million tokens
Value: approximately $37.39 million
Share of circulating supply: 1.28%
Recipient: Ecosystem community
Current price: 1.015 (24h -1.36%)
How do you interpret this information?
#GRAM
22

·
--
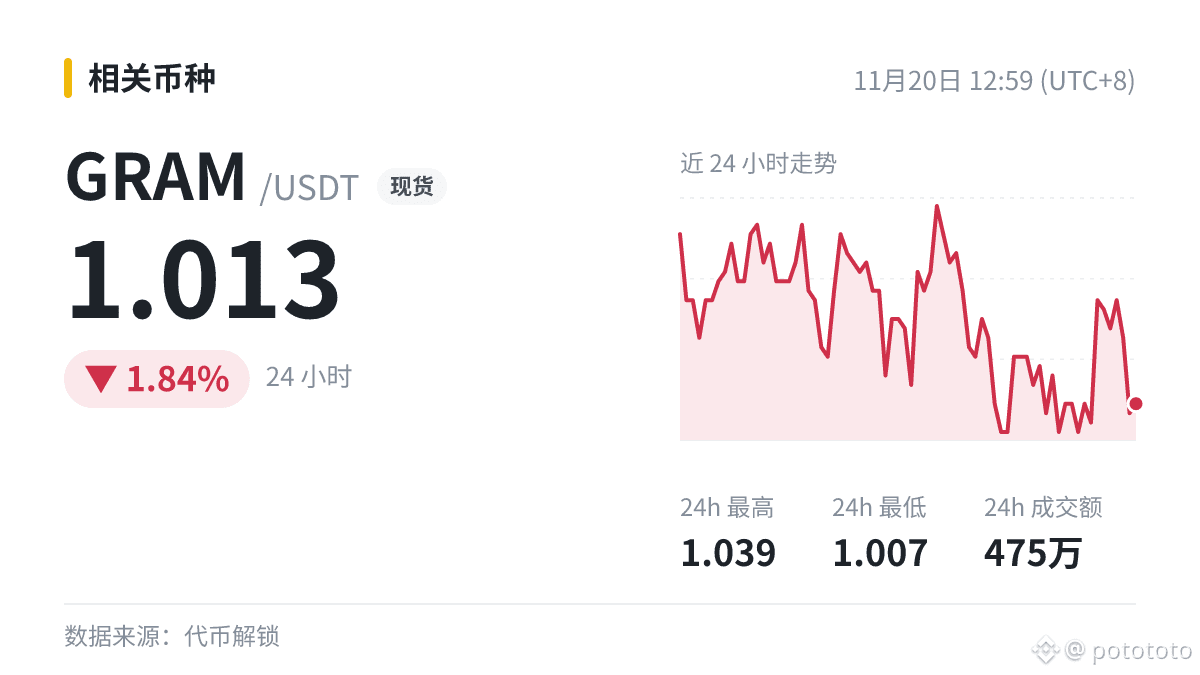
The “big test” for $GRAM is set for November 23 (in 3 days): $37.39 million will be unlocked, equal to 1.28% of the circulating supply (ecosystem community).
This time, the amount isn’t large—it’s more like a quick pop quiz. No need to lose sleep over it; just stay on your toes for a bit.
Keep an eye on things. If the market makes another move, I’ll be right here to chat.
#GRAM
It’s your money, so you call the shots.
The “big test” for $GRAM is set for November 23 (in 3 days): $37.39 million will be unlocked, equal to 1.28% of the circulating supply (ecosystem community).
This time, the amount isn’t large—it’s more like a quick pop quiz. No need to lose sleep over it; just stay on your toes for a bit.
Keep an eye on things. If the market makes another move, I’ll be right here to chat.
#GRAM
It’s your money, so you call the shots.
This time, the amount isn’t large—it’s more like a quick pop quiz. No need to lose sleep over it; just stay on your toes for a bit.
Keep an eye on things. If the market makes another move, I’ll be right here to chat.
#GRAM
It’s your money, so you call the shots.
5

·
--
$GRAM is more than just a crypto token; it is part of the digital network connected to the TON ecosystem. Its blockchain technology, fast transactions, and connection with Telegram give the project a distinct identity in the crypto market.
📊Key Factors for $GRAM
Growing adoption of the TON ecosystem.
Continuous blockchain technology and network development.
Increasing community participation.
Long-term utility and ecosystem expansion.
In the crypto market, short-term price movements are not everything. Technology, real-world utility, and adoption also play an important role in a project's long-term development.
If the TON ecosystem continues to grow, GRAM could benefit from new opportunities in the future. #GRAM #gram #ton #blockchain
{spot}(GRAMUSDT)
$GRAM is more than just a crypto token; it is part of the digital network connected to the TON ecosystem. Its blockchain technology, fast transactions, and connection with Telegram give the project a distinct identity in the crypto market.
📊Key Factors for $GRAM
Growing adoption of the TON ecosystem.
Continuous blockchain technology and network development.
Increasing community participation.
Long-term utility and ecosystem expansion.
In the crypto market, short-term price movements are not everything. Technology, real-world utility, and adoption also play an important role in a project's long-term development.
If the TON ecosystem continues to grow, GRAM could benefit from new opportunities in the future. #GRAM #gram #ton #blockchain
📊Key Factors for $GRAM
Growing adoption of the TON ecosystem.
Continuous blockchain technology and network development.
Increasing community participation.
Long-term utility and ecosystem expansion.
In the crypto market, short-term price movements are not everything. Technology, real-world utility, and adoption also play an important role in a project's long-term development.
If the TON ecosystem continues to grow, GRAM could benefit from new opportunities in the future. #GRAM #gram #ton #blockchain

597
Log in to explore more content
Join global crypto users on Binance Square
⚡️ Get latest and useful information about crypto.
💬 Trusted by the world’s largest crypto exchange.
👍 Discover real insights from verified creators.
Email / Phone number
Trending Topics
1
#IsAnthropic’s$1.5TMarketCapJustified?
46,283 views
224 Discussing
2
#BTCBelow$62KAmidHikeFearsAndShiftToAnthropic
7,630 views
60 Discussing
3
#NvidiaBoardReportedlySplitOverHuang’sReturn
203,492 views
1,677 Discussing
4
#CanGTA6'sLaunchLiftTTWOShares?
163,487 views
1,204 Discussing
5
#BlackRockBitcoinETFRecordsLargestDailyOutflow
0 views
5 Discussing
6
#LedgerProbesTamperedWalletsInBerlinAndDubai
13,539 views
202 Discussing
7
#13FInstitutionsBitcoinSpotETPHoldingsHitRecord
26,692 views
270 Discussing
8
#BTCRemainsUnderPressureAfterHawkishFOMCMinutes
374,082 views
2,499 Discussing
9
#StrategySTRCPreferredSlips3.65%Below$100Par
12,877 views
98 Discussing
10
#MASToUpgradeSGDTestnetToSGDigitalLedger
49,654 views
457 Discussing