
#crypto
crypto
405.6M views
2.4M Discussing
Hot
Latest

·
--
$PEPE Is Outperforming — But Is It Sustainable?
PEPE is gaining while Bitcoin remains under pressure, as capital rotates into meme coins.
The key zone is $0.00000516–$0.00000533. A breakout with sustained volume could trigger another leg higher.
But losing $0.00000506 could expose $0.00000490.
Momentum is here. The real question is whether buyers can sustain it.
Would you chase the breakout or wait for confirmation?
#PEPE #Pepe #Crypto #CryptoAnalysis
$PEPE Is Outperforming — But Is It Sustainable?
PEPE is gaining while Bitcoin remains under pressure, as capital rotates into meme coins.
The key zone is $0.00000516–$0.00000533. A breakout with sustained volume could trigger another leg higher.
But losing $0.00000506 could expose $0.00000490.
Momentum is here. The real question is whether buyers can sustain it.
Would you chase the breakout or wait for confirmation?
#PEPE #Pepe #Crypto #CryptoAnalysis
PEPE is gaining while Bitcoin remains under pressure, as capital rotates into meme coins.
The key zone is $0.00000516–$0.00000533. A breakout with sustained volume could trigger another leg higher.
But losing $0.00000506 could expose $0.00000490.
Momentum is here. The real question is whether buyers can sustain it.
Would you chase the breakout or wait for confirmation?
#PEPE #Pepe #Crypto #CryptoAnalysis

An Heriford JR8K:
Chase and take Pepe to The universe why wait Shitcoin bitcoin dictates our lives it has to be changed.Pep coin is the new Brave coin.
2
2
348

·
--
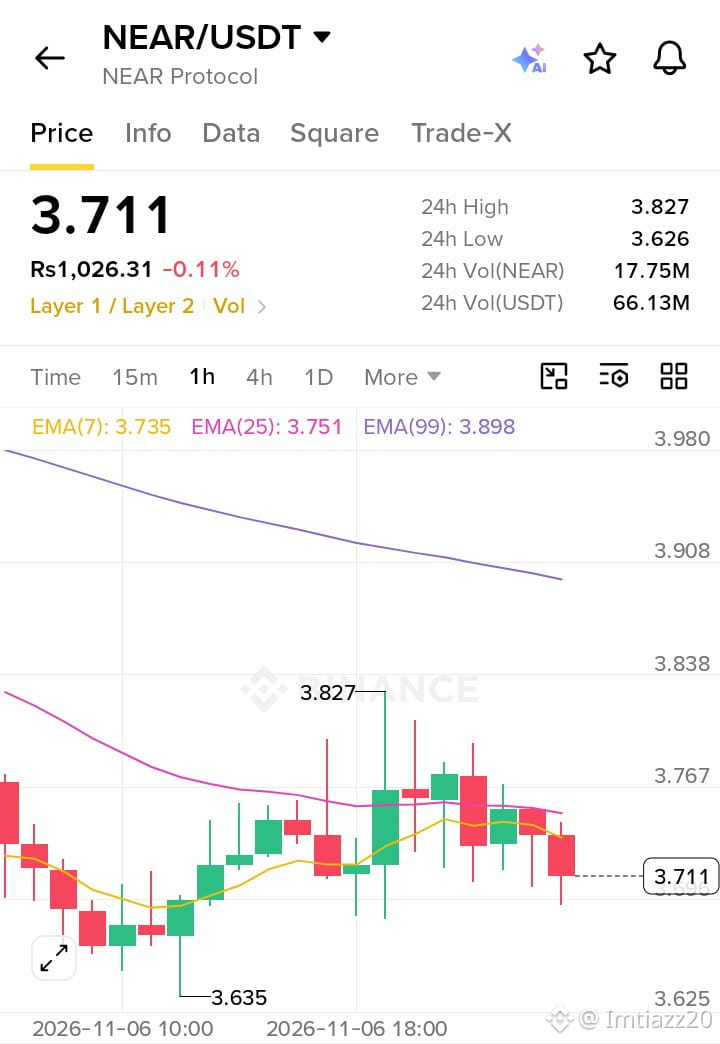
🚨 $NEAR just got REJECTED and nobody is talking about it
$4.37 → $3.67 in days. 📉
Here's what the chart says 🧵👇
1️⃣ Sept breakout ran on RSI 83. That's not a trend, that's a rubber band.
2️⃣ Open interest jumped 22% while sellers hit the tape. Leverage got trapped.
3️⃣ Every short-term MA is now overhead. $4.13 and $4.25 are walls.
🔴 Lose $3.50 and $3.25 is the next stop.
🟢 Reclaim $3.91, then $4.13, and shorts get squeezed hard.
Weak hands are panicking. Smart money is watching $3.50. 👀
I'm not chasing and I'm not catastrophizing. I'm waiting for the level to decide.
Where's YOUR line in the sand, $3.50 or $3.91? 👇
#Market_Update #crypto
{spot}(NEARUSDT)
🚨 $NEAR just got REJECTED and nobody is talking about it
$4.37 → $3.67 in days. 📉
Here's what the chart says 🧵👇
1️⃣ Sept breakout ran on RSI 83. That's not a trend, that's a rubber band.
2️⃣ Open interest jumped 22% while sellers hit the tape. Leverage got trapped.
3️⃣ Every short-term MA is now overhead. $4.13 and $4.25 are walls.
🔴 Lose $3.50 and $3.25 is the next stop.
🟢 Reclaim $3.91, then $4.13, and shorts get squeezed hard.
Weak hands are panicking. Smart money is watching $3.50. 👀
I'm not chasing and I'm not catastrophizing. I'm waiting for the level to decide.
Where's YOUR line in the sand, $3.50 or $3.91? 👇
#Market_Update #crypto
$4.37 → $3.67 in days. 📉
Here's what the chart says 🧵👇
1️⃣ Sept breakout ran on RSI 83. That's not a trend, that's a rubber band.
2️⃣ Open interest jumped 22% while sellers hit the tape. Leverage got trapped.
3️⃣ Every short-term MA is now overhead. $4.13 and $4.25 are walls.
🔴 Lose $3.50 and $3.25 is the next stop.
🟢 Reclaim $3.91, then $4.13, and shorts get squeezed hard.
Weak hands are panicking. Smart money is watching $3.50. 👀
I'm not chasing and I'm not catastrophizing. I'm waiting for the level to decide.
Where's YOUR line in the sand, $3.50 or $3.91? 👇
#Market_Update #crypto
3
129

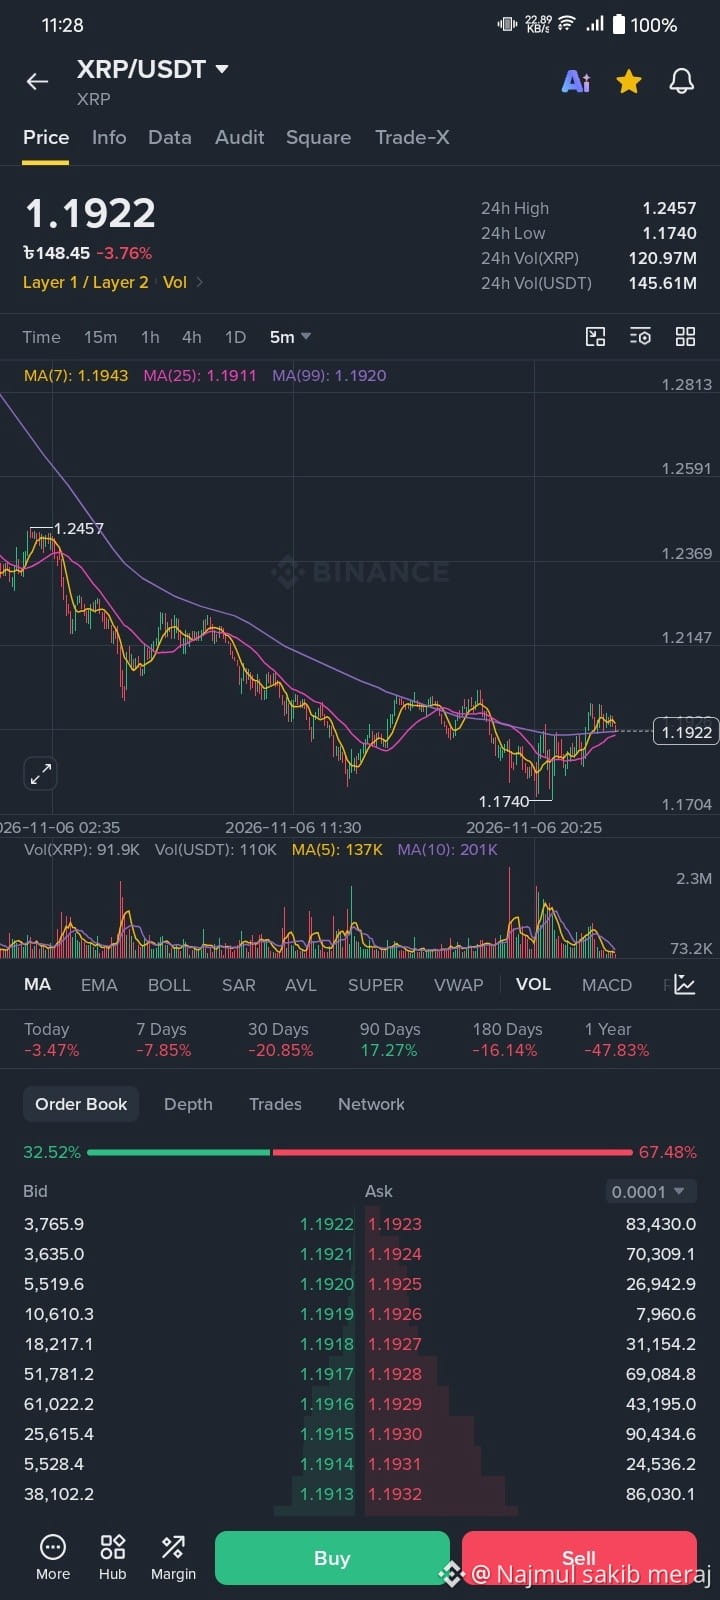
📊 $XRP Market Outlook 🚀
XRP is facing selling pressure, with $1.20 acting as an important support zone. A breakdown below it could trigger further downside, while reclaiming $1.30–$1.38 may strengthen the recovery.
My bigger question: Can bulls eventually push XRP back toward $1.80–$2.00? 👀
What's your prediction? Bullish comeback or more downside?
#XRP #Crypto #BinanceSquare #MarketAnalysis
{future}(XRPUSDT)
📊 $XRP Market Outlook 🚀
XRP is facing selling pressure, with $1.20 acting as an important support zone. A breakdown below it could trigger further downside, while reclaiming $1.30–$1.38 may strengthen the recovery.
My bigger question: Can bulls eventually push XRP back toward $1.80–$2.00? 👀
What's your prediction? Bullish comeback or more downside?
#XRP #Crypto #BinanceSquare #MarketAnalysis
XRP is facing selling pressure, with $1.20 acting as an important support zone. A breakdown below it could trigger further downside, while reclaiming $1.30–$1.38 may strengthen the recovery.
My bigger question: Can bulls eventually push XRP back toward $1.80–$2.00? 👀
What's your prediction? Bullish comeback or more downside?
#XRP #Crypto #BinanceSquare #MarketAnalysis
trade expert bd:
i think go long
1
3
410


·
--
🇺🇸 US Treasury just cut MEXC off from the American financial system.
FinCEN's order, part of 'Operation Economic Outcast', bars US institutions from any transfers to or from the exchange. Treasury alleges MEXC facilitated $16 BILLION in illicit finance tied to Iran, North Korea and Russia.
This is not a fine. It is a severance. MEXC is now locked out of dollar rails, and any bank or exchange touching MEXC flows risks secondary exposure.
Two things to watch. First, user funds: withdrawals and liquidity on MEXC over the next 48 hours will tell the real story. Second, whether this is the start of a wider sweep. Treasury named a pattern, not just one exchange.
The allegations are unproven and MEXC has not had its full say yet. But Washington just showed it will cut an exchange off entirely, not just sanction an address.
$MX
📌 Sharing personal opinions only, not financial advice or a recommendation to buy/sell. Crypto is highly risky; DYOR and you are solely responsible. No coin promotion.
#MEXC #Crypto #Regulation #Binance
🇺🇸 US Treasury just cut MEXC off from the American financial system.
FinCEN's order, part of 'Operation Economic Outcast', bars US institutions from any transfers to or from the exchange. Treasury alleges MEXC facilitated $16 BILLION in illicit finance tied to Iran, North Korea and Russia.
This is not a fine. It is a severance. MEXC is now locked out of dollar rails, and any bank or exchange touching MEXC flows risks secondary exposure.
Two things to watch. First, user funds: withdrawals and liquidity on MEXC over the next 48 hours will tell the real story. Second, whether this is the start of a wider sweep. Treasury named a pattern, not just one exchange.
The allegations are unproven and MEXC has not had its full say yet. But Washington just showed it will cut an exchange off entirely, not just sanction an address.
$MX
📌 Sharing personal opinions only, not financial advice or a recommendation to buy/sell. Crypto is highly risky; DYOR and you are solely responsible. No coin promotion.
#MEXC #Crypto #Regulation #Binance
FinCEN's order, part of 'Operation Economic Outcast', bars US institutions from any transfers to or from the exchange. Treasury alleges MEXC facilitated $16 BILLION in illicit finance tied to Iran, North Korea and Russia.
This is not a fine. It is a severance. MEXC is now locked out of dollar rails, and any bank or exchange touching MEXC flows risks secondary exposure.
Two things to watch. First, user funds: withdrawals and liquidity on MEXC over the next 48 hours will tell the real story. Second, whether this is the start of a wider sweep. Treasury named a pattern, not just one exchange.
The allegations are unproven and MEXC has not had its full say yet. But Washington just showed it will cut an exchange off entirely, not just sanction an address.
$MX
📌 Sharing personal opinions only, not financial advice or a recommendation to buy/sell. Crypto is highly risky; DYOR and you are solely responsible. No coin promotion.
#MEXC #Crypto #Regulation #Binance
1
759

·
--
Bullish
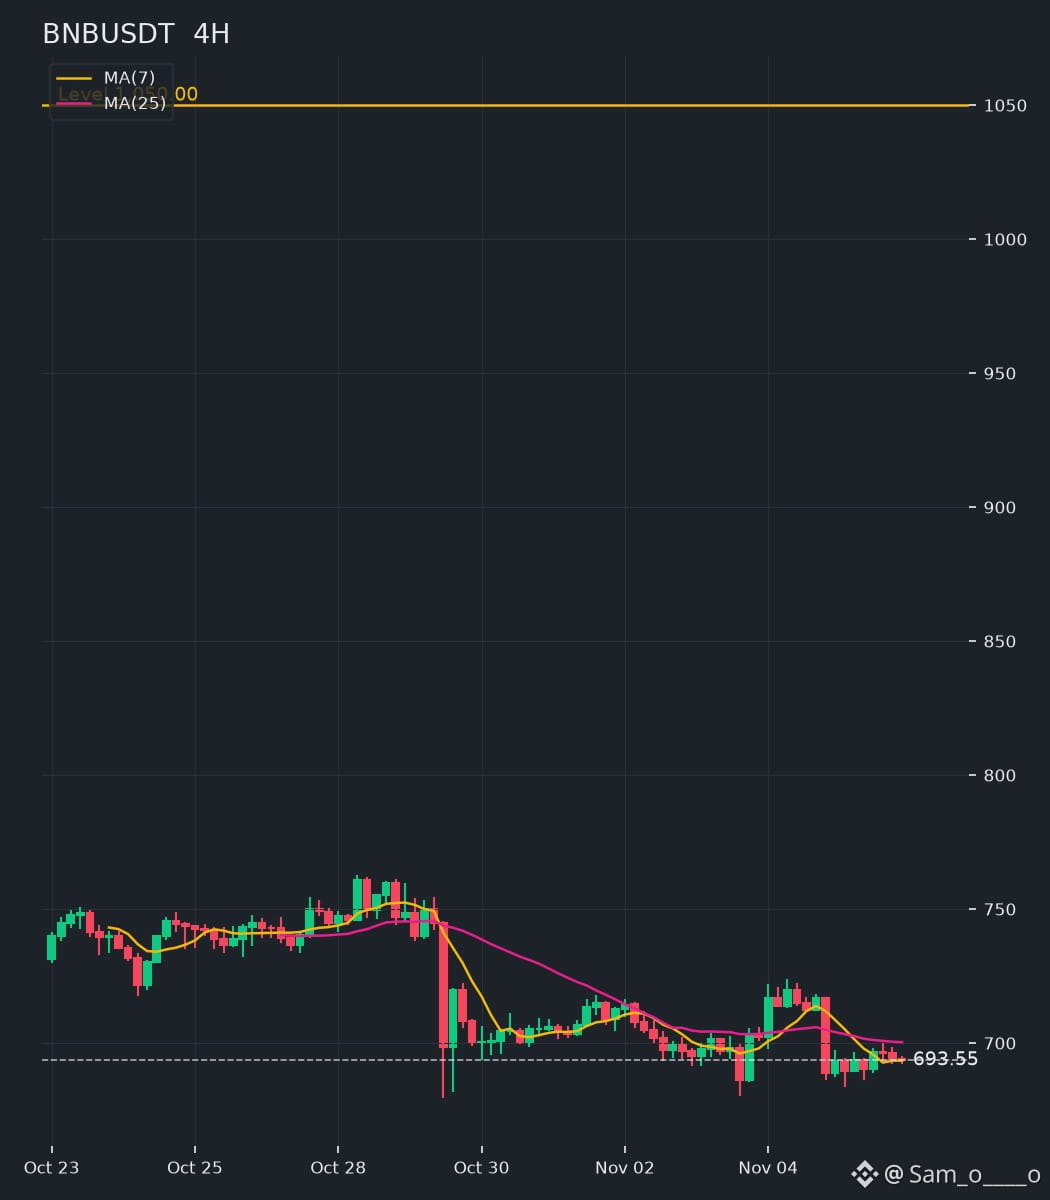
$BNB just got a huge accessibility boost. Coinbase and Robinhood both listed BNB this week, opening the fourth-largest crypto to millions of US retail traders. That's a real adoption catalyst. But the chart tells a different story. BNB is sitting around $693 right now, still sliding from the $750 area last week.
I'm leaning bullish because exchange listings usually bring sticky demand, but I don't fully trust this move yet. Good news with weak price action often needs time to digest. I'm watching $685 as support and $710 as near-term resistance. If support holds, I think a run back to the $750 high is realistic. If it loses $680, I'd step aside. Do you think US retail access is enough to push BNB past $750, or is the market ignoring this listing? 📉 #BNB #Crypto
The pump is easy to see. The reason and the next move are not. Follow for both.
{spot}(BNBUSDT)
$BNB just got a huge accessibility boost. Coinbase and Robinhood both listed BNB this week, opening the fourth-largest crypto to millions of US retail traders. That's a real adoption catalyst. But the chart tells a different story. BNB is sitting around $693 right now, still sliding from the $750 area last week.
I'm leaning bullish because exchange listings usually bring sticky demand, but I don't fully trust this move yet. Good news with weak price action often needs time to digest. I'm watching $685 as support and $710 as near-term resistance. If support holds, I think a run back to the $750 high is realistic. If it loses $680, I'd step aside. Do you think US retail access is enough to push BNB past $750, or is the market ignoring this listing? 📉 #BNB #Crypto
The pump is easy to see. The reason and the next move are not. Follow for both.
I'm leaning bullish because exchange listings usually bring sticky demand, but I don't fully trust this move yet. Good news with weak price action often needs time to digest. I'm watching $685 as support and $710 as near-term resistance. If support holds, I think a run back to the $750 high is realistic. If it loses $680, I'd step aside. Do you think US retail access is enough to push BNB past $750, or is the market ignoring this listing? 📉 #BNB #Crypto
The pump is easy to see. The reason and the next move are not. Follow for both.
1
76

·
--
Bullish
🐸 $PEPE
{spot}(PEPEUSDT)
check-in: calm before a move?
💰 Price: $0.00000505 (+4% in 24h)
📊 4H chart (Oct 29 to Nov 6): high ~$0.00000568 | low ~$0.00000431
📈 Price is sitting on the 7 and 25-period averages (~$0.00000486), above the 99-period (~$0.00000474)
⚖️ Order book: ~54% bids vs ~46% asks, a slight buyer edge that can flip in seconds
👀 Levels:
• Support: ~$0.00000474, then ~$0.00000454
• Resistance: ~$0.0000050, then ~$0.0000053
🧠 What it means:
PEPE is consolidating after a big swing. A real breakout needs volume, and it could go either way.
⚠️ Reality check:
• No confirmed catalyst, so a "big rise" is a hope, not a fact
• Meme coins reverse as fast as they pump
• Beware "next PEPE 100x" presales. Many are paid ads or scams
Small size, a stop-loss, and an exit plan before you enter. 🛡️
Breakout 🟢 up or 🔴 down? 👇
Trade on your own risk.
#PEPE #MemeCoin #Crypto #BinanceSquare
🐸 $PEPE
check-in: calm before a move?
💰 Price: $0.00000505 (+4% in 24h)
📊 4H chart (Oct 29 to Nov 6): high ~$0.00000568 | low ~$0.00000431
📈 Price is sitting on the 7 and 25-period averages (~$0.00000486), above the 99-period (~$0.00000474)
⚖️ Order book: ~54% bids vs ~46% asks, a slight buyer edge that can flip in seconds
👀 Levels:
• Support: ~$0.00000474, then ~$0.00000454
• Resistance: ~$0.0000050, then ~$0.0000053
🧠 What it means:
PEPE is consolidating after a big swing. A real breakout needs volume, and it could go either way.
⚠️ Reality check:
• No confirmed catalyst, so a "big rise" is a hope, not a fact
• Meme coins reverse as fast as they pump
• Beware "next PEPE 100x" presales. Many are paid ads or scams
Small size, a stop-loss, and an exit plan before you enter. 🛡️
Breakout 🟢 up or 🔴 down? 👇
Trade on your own risk.
#PEPE #MemeCoin #Crypto #BinanceSquare
check-in: calm before a move?
💰 Price: $0.00000505 (+4% in 24h)
📊 4H chart (Oct 29 to Nov 6): high ~$0.00000568 | low ~$0.00000431
📈 Price is sitting on the 7 and 25-period averages (~$0.00000486), above the 99-period (~$0.00000474)
⚖️ Order book: ~54% bids vs ~46% asks, a slight buyer edge that can flip in seconds
👀 Levels:
• Support: ~$0.00000474, then ~$0.00000454
• Resistance: ~$0.0000050, then ~$0.0000053
🧠 What it means:
PEPE is consolidating after a big swing. A real breakout needs volume, and it could go either way.
⚠️ Reality check:
• No confirmed catalyst, so a "big rise" is a hope, not a fact
• Meme coins reverse as fast as they pump
• Beware "next PEPE 100x" presales. Many are paid ads or scams
Small size, a stop-loss, and an exit plan before you enter. 🛡️
Breakout 🟢 up or 🔴 down? 👇
Trade on your own risk.
#PEPE #MemeCoin #Crypto #BinanceSquare

1
164

·
--
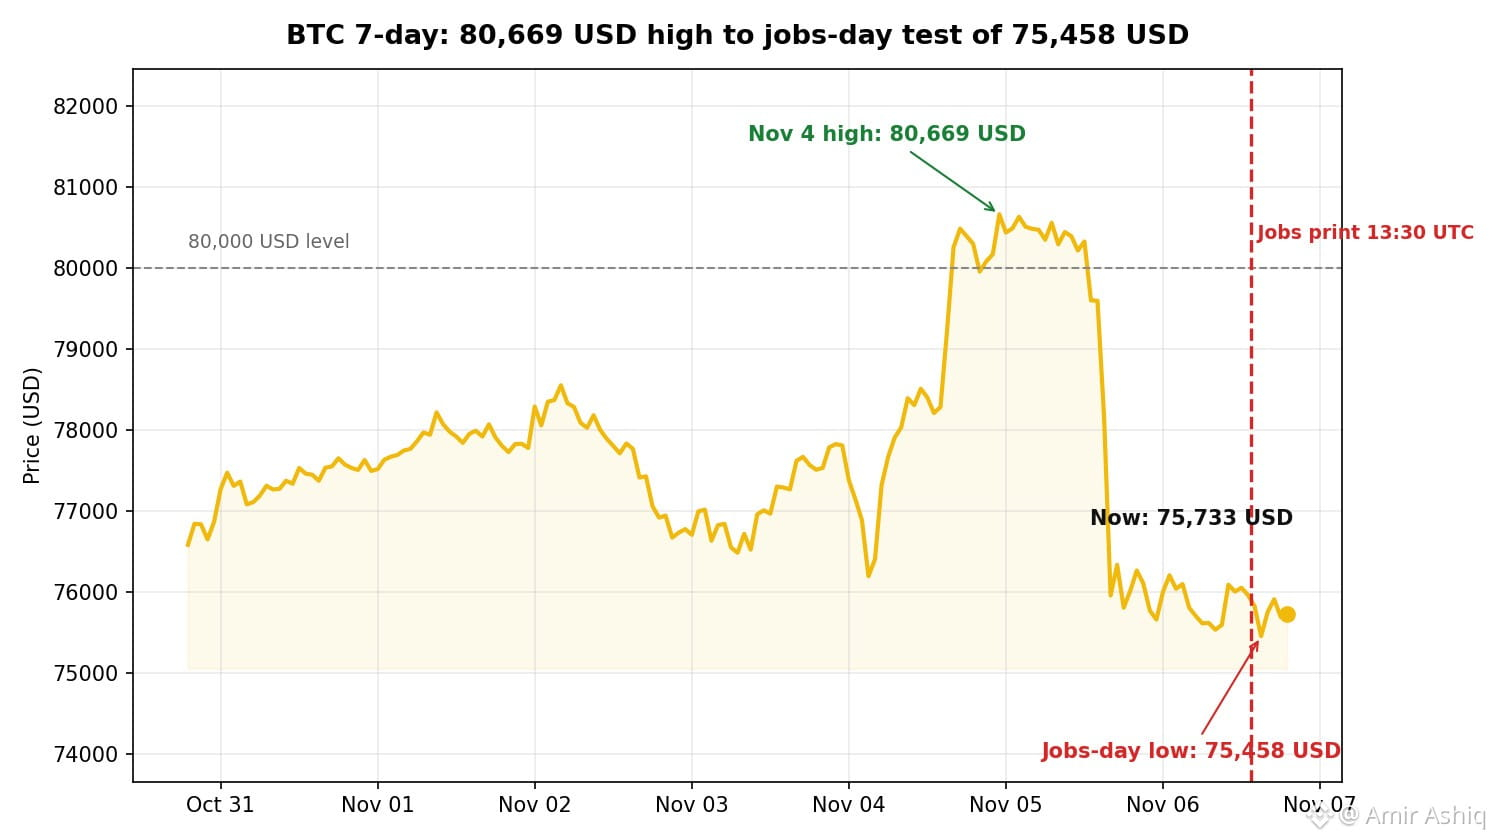
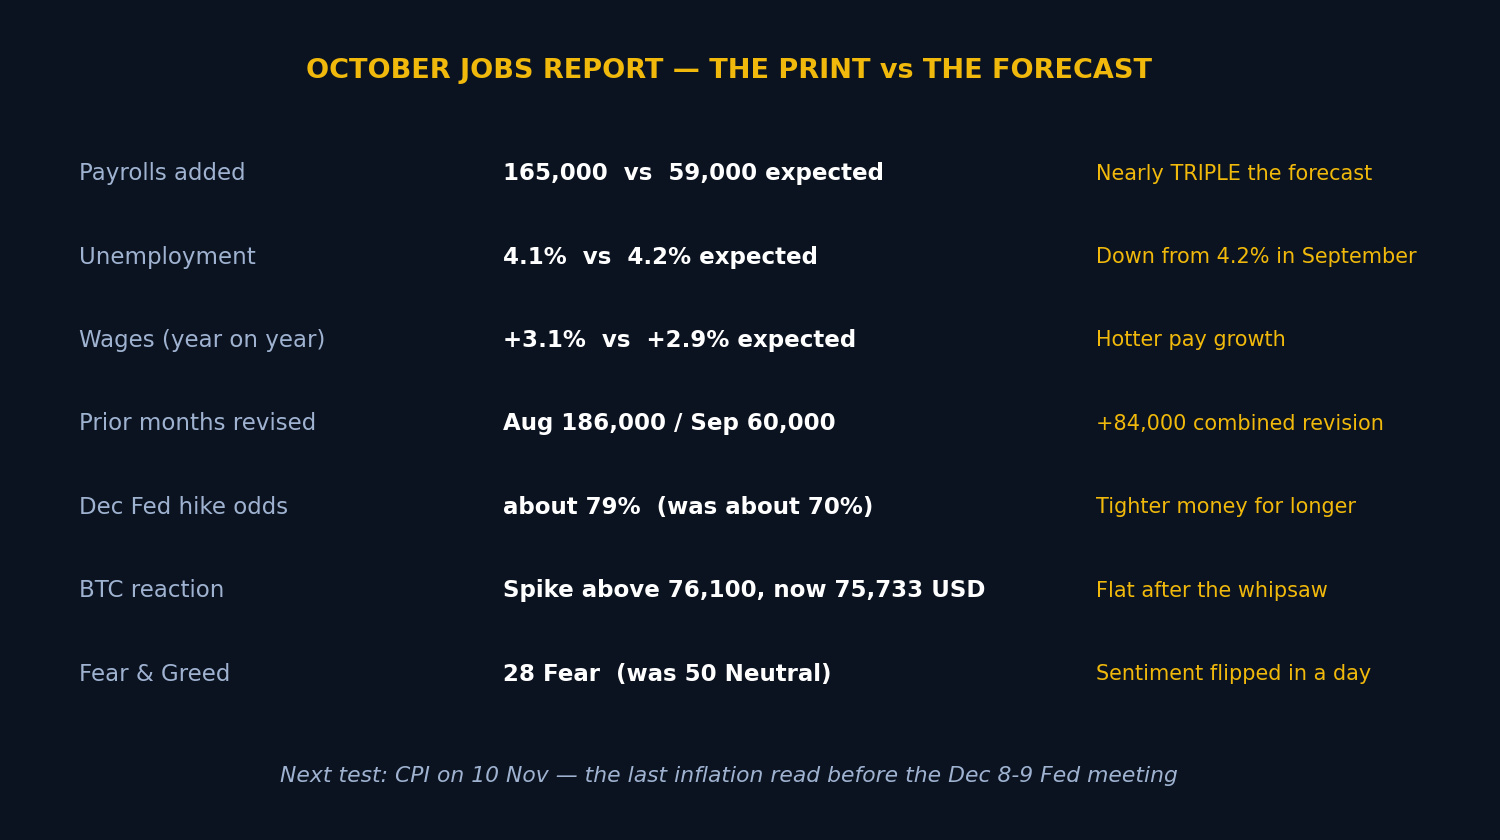
🚨 165,000 JOBS JUST SMASHED THE 59,000 FORECAST — BUT $BTC IS STILL STUCK UNDER 76,000 USD! ⚠️
The October jobs report landed hot: 165,000 new jobs vs just 59,000 expected — nearly triple the forecast. Unemployment dipped to 4.1% and wages grew 3.1% year-on-year, both beating estimates. September was revised up to 60,000 from 29,000.
$BTC spiked above 76,100 USD on the print, then slid to about 75,200 USD before settling near 75,733 USD. $ETH sits at 2,229 USD while $SOL held 90 USD — the market froze on the same number.
Here's the catch:
📉 December Fed hike odds jumped to about 79% from around 70%, and the 10-year yield rose to 4.894% — hot jobs mean tighter money for longer.
📊 Fear & Greed crashed to 28 Fear from 50 Neutral yesterday — sentiment flipped in a day.
💧 About 468 million USD in leveraged positions was liquidated in 24 hours, and US spot $BTC ETFs lost 430 million USD on Thursday alone.
Hot jobs = a strong economy = the Fed has less reason to ease. That is why $BTC lagged the Nasdaq's 2% bounce.
Will the December hike decision decide Bitcoin's next big move — or is 75,000 USD the line that matters most? 👇
Not financial advice — educational purposes only.
#JobsReportRaisesHikeOdds #Bitcoin #crypto #Ethereum
🚨 165,000 JOBS JUST SMASHED THE 59,000 FORECAST — BUT $BTC IS STILL STUCK UNDER 76,000 USD! ⚠️
The October jobs report landed hot: 165,000 new jobs vs just 59,000 expected — nearly triple the forecast. Unemployment dipped to 4.1% and wages grew 3.1% year-on-year, both beating estimates. September was revised up to 60,000 from 29,000.
$BTC spiked above 76,100 USD on the print, then slid to about 75,200 USD before settling near 75,733 USD. $ETH sits at 2,229 USD while $SOL held 90 USD — the market froze on the same number.
Here's the catch:
📉 December Fed hike odds jumped to about 79% from around 70%, and the 10-year yield rose to 4.894% — hot jobs mean tighter money for longer.
📊 Fear & Greed crashed to 28 Fear from 50 Neutral yesterday — sentiment flipped in a day.
💧 About 468 million USD in leveraged positions was liquidated in 24 hours, and US spot $BTC ETFs lost 430 million USD on Thursday alone.
Hot jobs = a strong economy = the Fed has less reason to ease. That is why $BTC lagged the Nasdaq's 2% bounce.
Will the December hike decision decide Bitcoin's next big move — or is 75,000 USD the line that matters most? 👇
Not financial advice — educational purposes only.
#JobsReportRaisesHikeOdds #Bitcoin #crypto #Ethereum
The October jobs report landed hot: 165,000 new jobs vs just 59,000 expected — nearly triple the forecast. Unemployment dipped to 4.1% and wages grew 3.1% year-on-year, both beating estimates. September was revised up to 60,000 from 29,000.
$BTC spiked above 76,100 USD on the print, then slid to about 75,200 USD before settling near 75,733 USD. $ETH sits at 2,229 USD while $SOL held 90 USD — the market froze on the same number.
Here's the catch:
📉 December Fed hike odds jumped to about 79% from around 70%, and the 10-year yield rose to 4.894% — hot jobs mean tighter money for longer.
📊 Fear & Greed crashed to 28 Fear from 50 Neutral yesterday — sentiment flipped in a day.
💧 About 468 million USD in leveraged positions was liquidated in 24 hours, and US spot $BTC ETFs lost 430 million USD on Thursday alone.
Hot jobs = a strong economy = the Fed has less reason to ease. That is why $BTC lagged the Nasdaq's 2% bounce.
Will the December hike decision decide Bitcoin's next big move — or is 75,000 USD the line that matters most? 👇
Not financial advice — educational purposes only.
#JobsReportRaisesHikeOdds #Bitcoin #crypto #Ethereum
125

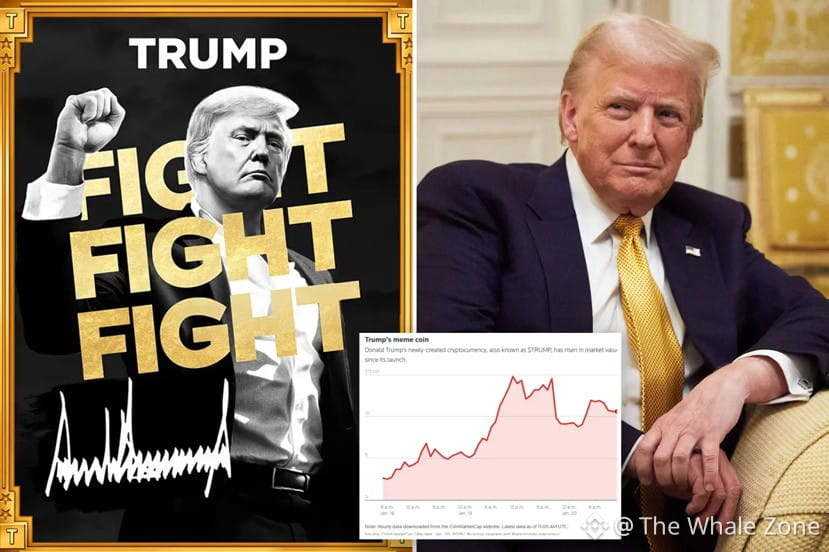
🚨 HE CAN INFLUENCE WASHINGTON, BUT CAN’T SAVE HIS OWN CRYPTO COIN?
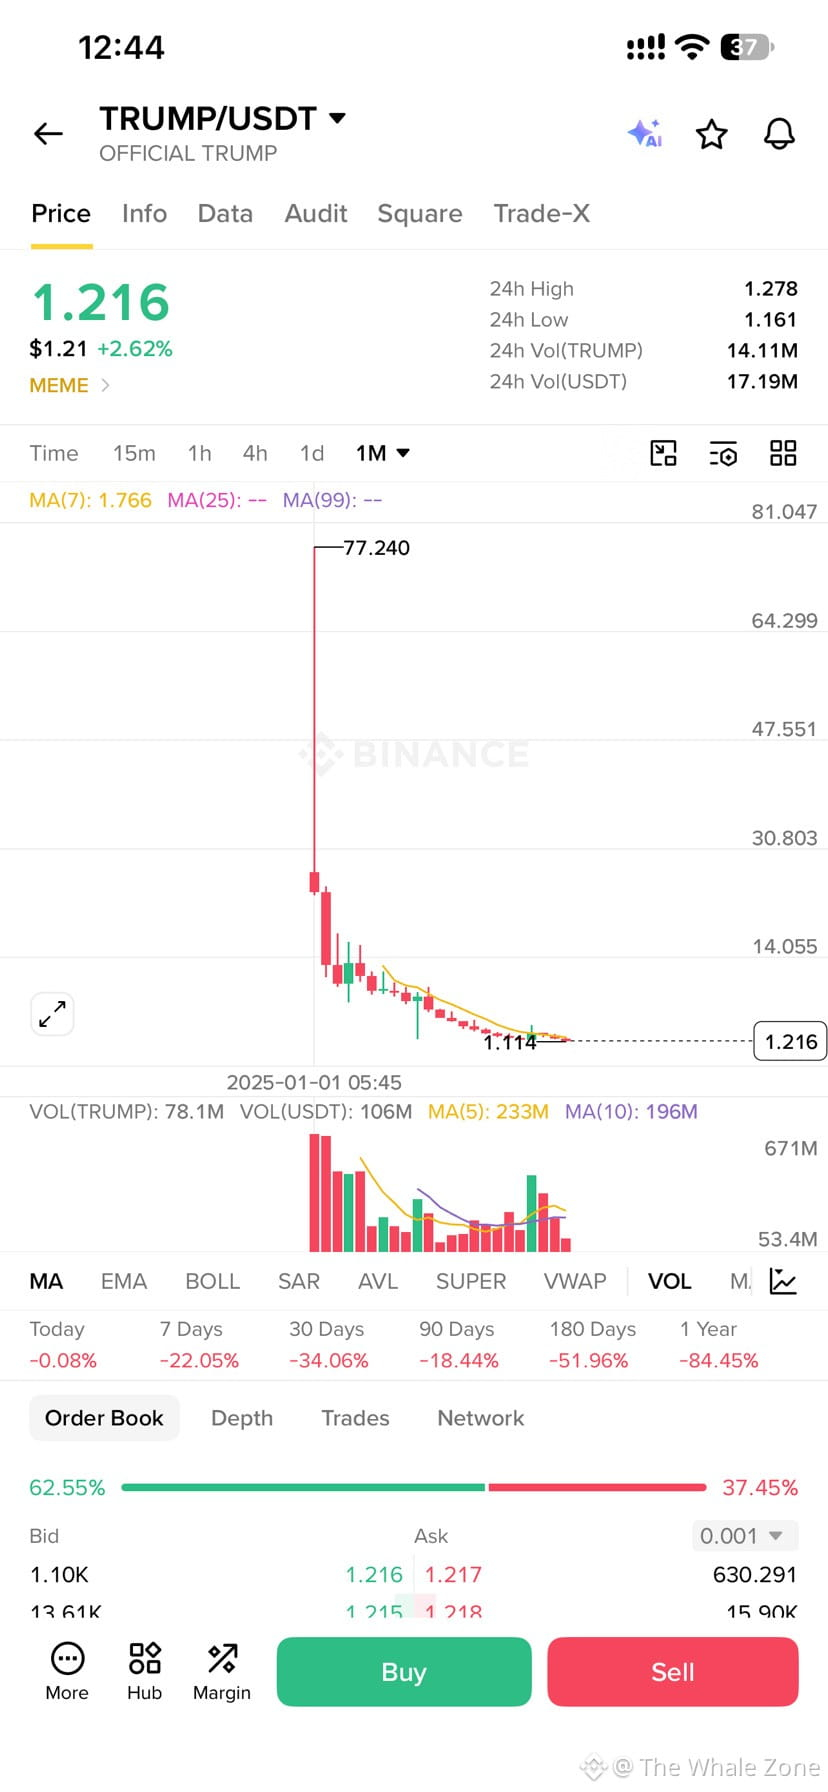
Donald Trump’s official $TRUMP meme coin is facing a brutal collapse.
According to the screenshot, $TRUMP is trading at just $1.216, down 84.45% over the past year, despite Trump being the sitting US president.
Political power, global influence, and a struggling token — a controversial combination.
If Trump can’t keep his own coin alive, what does that say about political hype in crypto? 👀
#TRUMP #crypto #memecoins #Binance
{future}(TRUMPUSDT)
🚨 HE CAN INFLUENCE WASHINGTON, BUT CAN’T SAVE HIS OWN CRYPTO COIN?
Donald Trump’s official $TRUMP meme coin is facing a brutal collapse.
According to the screenshot, $TRUMP is trading at just $1.216, down 84.45% over the past year, despite Trump being the sitting US president.
Political power, global influence, and a struggling token — a controversial combination.
If Trump can’t keep his own coin alive, what does that say about political hype in crypto? 👀
#TRUMP #crypto #memecoins #Binance
Donald Trump’s official $TRUMP meme coin is facing a brutal collapse.
According to the screenshot, $TRUMP is trading at just $1.216, down 84.45% over the past year, despite Trump being the sitting US president.
Political power, global influence, and a struggling token — a controversial combination.
If Trump can’t keep his own coin alive, what does that say about political hype in crypto? 👀
#TRUMP #crypto #memecoins #Binance
2
366

·
--
I checked the tape: Trump's token is down 23% since the midterms. It closed Nov 3 at $1.586 and trades at $1.22 now.
Democrats won control of Congress. The token that priced a Republican sweep is now pricing a Democratic one. Over the same window, BTC is down about 2%.
This is what a political memecoin looks like when the vote goes the other way. The campaign ended; the token didn't.
Are political tokens a bet on policy, or just leverage on one man?
{spot}(TRUMPUSDT)
#TRUMP #Crypto
NFA. I trade my own book. DYOR.
I checked the tape: Trump's token is down 23% since the midterms. It closed Nov 3 at $1.586 and trades at $1.22 now.
Democrats won control of Congress. The token that priced a Republican sweep is now pricing a Democratic one. Over the same window, BTC is down about 2%.
This is what a political memecoin looks like when the vote goes the other way. The campaign ended; the token didn't.
Are political tokens a bet on policy, or just leverage on one man?
#TRUMP #Crypto
NFA. I trade my own book. DYOR.
Democrats won control of Congress. The token that priced a Republican sweep is now pricing a Democratic one. Over the same window, BTC is down about 2%.
This is what a political memecoin looks like when the vote goes the other way. The campaign ended; the token didn't.
Are political tokens a bet on policy, or just leverage on one man?
#TRUMP #Crypto
NFA. I trade my own book. DYOR.
2
657

·
--
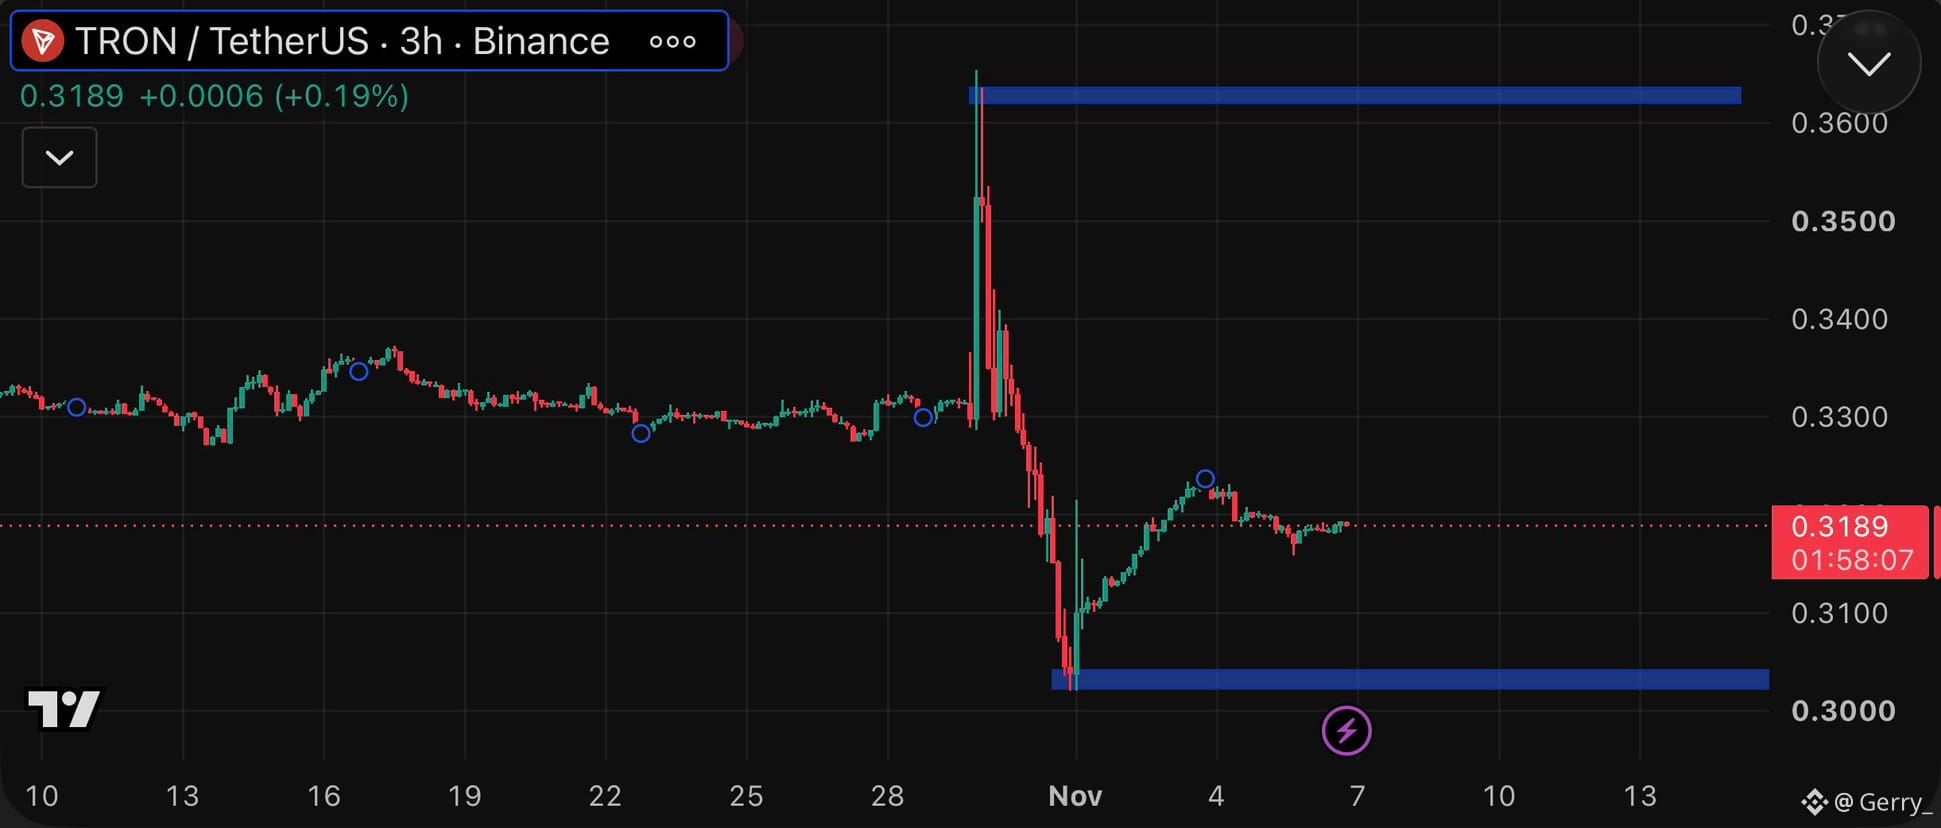
$TRX The Big Move Is Over. Now Comes the Real Test.
After that wild spike toward $0.36, TRX dropped sharply and found buyers near $0.302.
Now price is moving sideways around $0.3189.
Here’s what I’m watching:
Support: $0.302–$0.304
Resistance: $0.323–$0.325
I think the next move depends on whether buyers can reclaim $0.325. Until then, this looks more like a recovery attempt than a confirmed reversal.
#TRX #Crypto
$TRX The Big Move Is Over. Now Comes the Real Test.
After that wild spike toward $0.36, TRX dropped sharply and found buyers near $0.302.
Now price is moving sideways around $0.3189.
Here’s what I’m watching:
Support: $0.302–$0.304
Resistance: $0.323–$0.325
I think the next move depends on whether buyers can reclaim $0.325. Until then, this looks more like a recovery attempt than a confirmed reversal.
#TRX #Crypto
After that wild spike toward $0.36, TRX dropped sharply and found buyers near $0.302.
Now price is moving sideways around $0.3189.
Here’s what I’m watching:
Support: $0.302–$0.304
Resistance: $0.323–$0.325
I think the next move depends on whether buyers can reclaim $0.325. Until then, this looks more like a recovery attempt than a confirmed reversal.
#TRX #Crypto
Linus_parker:
A failed TRX bounce could invite more selling.
3
3
393

Article
$81K to $75K in 48 Hours: Is $75K The Bottom?Why #BTC Fell From $81K to $75K in 48 Hours - And Why $75K Is The Most Important Level Now
In just 48 hours, the market gave us both a perfect bounce and a brutal crash. If you are confused, you are not alone. Let me break it down with real data, not hype.
1. WHAT ACTUALLY HAPPENED?
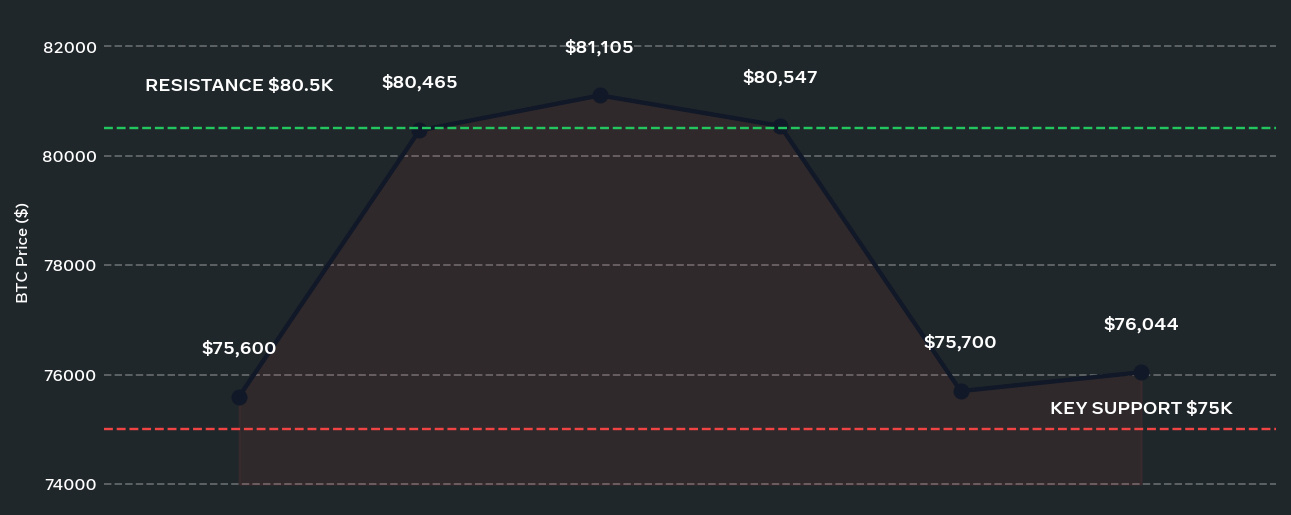
Nov 4: BTC dipped to $75,600, then bounced to $80,465. Shorts got liquidated, $378M in just 1 hour.
Nov 5: BTC touched $81,105 high. Everyone thought the rally was back.
Nov 6: Crash. BTC fell to $75,700, down -5.8% in 24 hours. ETH fell -8.2% to $2,218, XRP fell -9.7% to $1.18, SOL fell -6.9% to $89.22.
Nov 7: $BTC is trading around $76,044. Total crypto market cap is now $2.57T, down 5%.
So this was not a crypto problem. This was a macro problem.
2. THE 3 REAL REASONS FOR THE CRASH
Reason 1 - AI Stocks Crashed First
Nasdaq fell -5.52%, S&P 500 fell -4.4%. Philadelphia Semiconductor Index crashed -12.2%. Nvidia fell -9.3%, AMD fell -17.3%. After US midterms, investors fear tougher rules on AI data centers. When tech falls, crypto follows.
Reason 2 - $1 Billion Liquidation
CoinGlass data shows $1.05B liquidated in 24 hours. 88.2% were longs. That means people who were betting on price going up got wiped out. BTC alone had $267M liquidations, ETH had $167M. This was a leverage flush, not a spot sell-off.
Reason 3 - ETF Outflows
US Spot BTC ETFs saw $430M net outflows on Thursday. Fidelity FBTC lost ~$200M, BlackRock IBIT lost ~$105M. For the whole week, outflows are almost $870M. Institutions were de-risking, not buying.
Fear & Greed Index dropped from 50 (Neutral) to 28 (Fear) in just 1 day. A month ago it was 71 (Greed).
3. TECHNICAL ANALYSIS - LEVELS THAT MATTER
BTC is now below ALL major EMAs:
- 50-day EMA: $79,756
- 100-day EMA: $77,770
- 200-day EMA: $76,497 - This was support, now it is resistance
- RSI: 37.88 - Weak, but not oversold yet. Below 30 is oversold.
Key Levels:
Support: $74,000 - $75,000 (MUST HOLD)
If $75K breaks on daily close: Next $72,000, then $70,000
Resistance: $76,500 (first), then $79,000 - $80,000
Breakout: Daily close above $76,500 = short bounce, above $80,000 = real recovery
BTC Dominance is 59.2%. That means money is rotating INTO BTC, not altcoins. In fear, people trust BTC more.
4. WHAT HAPPENS NEXT? 2 SCENARIOS
Bullish Scenario - Bounce:
If $BTC holds $75K and closes back above $76,500, we can see a relief bounce to $79K - $80K. ETF inflows need to return for this.
Bearish Scenario - Breakdown:
If BTC closes below $74,968, another leverage flush will come and $72K - $68K will be in play. Some analysts are even warning about $58K if this becomes a 2018-style selloff. Not confirmed yet, but risk is real.
5. MY PLAN (Not Financial Advice)
I am not panicking and I am not FOMO buying.
- No leverage. Spot only.
- Small entry near $75K support, not all-in.
- If $75K breaks, I wait. If $76.5K reclaims, I add a little.
- Patience is the real profit here.
The market is flushing leverage, not breaking BTC. Every time Fear is at 28, smart money starts watching, not selling.
What is your plan?
1 = Buying the $75K dip
2 = Waiting for $72K
3 = Staying out, cash is king
Comment your number, let's see what Square thinks.
Not financial advice. DYOR. Data sources: CoinGlass, SoSoValue, Farside Investors, Alternative.me.
#Crypto #BinanceSquare #MarketAnalysis
$81K to $75K in 48 Hours: Is $75K The Bottom?
Why #BTC Fell From $81K to $75K in 48 Hours - And Why $75K Is The Most Important Level Now
In just 48 hours, the market gave us both a perfect bounce and a brutal crash. If you are confused, you are not alone. Let me break it down with real data, not hype.
1. WHAT ACTUALLY HAPPENED?
Nov 4: BTC dipped to $75,600, then bounced to $80,465. Shorts got liquidated, $378M in just 1 hour.
Nov 5: BTC touched $81,105 high. Everyone thought the rally was back.
Nov 6: Crash. BTC fell to $75,700, down -5.8% in 24 hours. ETH fell -8.2% to $2,218, XRP fell -9.7% to $1 .18, SOL fell -6.9% to $89.22.
Nov 7: $BTC is trading around $76,044. Total crypto market cap is now $2.57T, down 5%.
So this was not a crypto problem. This was a macro problem.
2. THE 3 REAL REASONS FOR THE CRASH
Reason 1 - AI Stocks Crashed First
Nasdaq fell -5.52%, S&P 500 fell -4.4%. Philadelphia Semiconductor Index crashed -12.2%. Nvidia fell -9.3%, AMD fell -17.3%. After US midterms, investors fear tougher rules on AI data centers. When tech falls, crypto follows.
Reason 2 - $1 Billion Liquidation
CoinGlass data shows $1 .05B liquidated in 24 hours. 88.2% were longs. That means people who were betting on price going up got wiped out. BTC alone had $267M liquidations, ETH had $167M. This was a leverage flush, not a spot sell-off.
Reason 3 - ETF Outflows
US Spot BTC ETFs saw $430M net outflows on Thursday. Fidelity FBTC lost ~$200M, BlackRock IBIT lost ~$105M. For the whole week, outflows are almost $870M. Institutions were de-risking, not buying.
Fear & Greed Index dropped from 50 (Neutral) to 28 (Fear) in just 1 day. A month ago it was 71 (Greed).
3. TECHNICAL ANALYSIS - LEVELS THAT MATTER
BTC is now below ALL major EMAs:
- 50-day EMA: $79,756
- 100-day EMA: $77,770
- 200-day EMA: $76,497 - This was support, now it is resistance
- RSI: 37.88 - Weak, but not oversold yet. Below 30 is oversold.
Key Levels:
Support: $74,000 - $75,000 (MUST HOLD)
If $75K breaks on daily close: Next $72,000, then $70,000
Resistance: $76,500 (first), then $79,000 - $80,000
Breakout: Daily close above $76,500 = short bounce, above $80,000 = real recovery
BTC Dominance is 59.2%. That means money is rotating INTO BTC, not altcoins. In fear, people trust BTC more.
4. WHAT HAPPENS NEXT? 2 SCENARIOS
Bullish Scenario - Bounce:
If $BTC holds $75K and closes back above $76,500, we can see a relief bounce to $79K - $80K. ETF inflows need to return for this.
Bearish Scenario - Breakdown:
If BTC closes below $74,968, another leverage flush will come and $72K - $68K will be in play. Some analysts are even warning about $58K if this becomes a 2018-style selloff. Not confirmed yet, but risk is real.
5. MY PLAN (Not Financial Advice)
I am not panicking and I am not FOMO buying.
- No leverage. Spot only.
- Small entry near $75K support, not all-in.
- If $75K breaks, I wait. If $76.5K reclaims, I add a little.
- Patience is the real profit here.
The market is flushing leverage, not breaking BTC. Every time Fear is at 28, smart money starts watching, not selling.
What is your plan?
1 = Buying the $75K dip
2 = Waiting for $72K
3 = Staying out, cash is king
Comment your number, let's see what Square thinks.
Not financial advice. DYOR. Data sources: CoinGlass, SoSoValue, Farside Investors, Alternative.me.
#Crypto #BinanceSquare #MarketAnalysis
In just 48 hours, the market gave us both a perfect bounce and a brutal crash. If you are confused, you are not alone. Let me break it down with real data, not hype.
1. WHAT ACTUALLY HAPPENED?
Nov 4: BTC dipped to $75,600, then bounced to $80,465. Shorts got liquidated, $378M in just 1 hour.
Nov 5: BTC touched $81,105 high. Everyone thought the rally was back.
Nov 6: Crash. BTC fell to $75,700, down -5.8% in 24 hours. ETH fell -8.2% to $2,218, XRP fell -9.7% to $1 .18, SOL fell -6.9% to $89.22.
Nov 7: $BTC is trading around $76,044. Total crypto market cap is now $2.57T, down 5%.
So this was not a crypto problem. This was a macro problem.
2. THE 3 REAL REASONS FOR THE CRASH
Reason 1 - AI Stocks Crashed First
Nasdaq fell -5.52%, S&P 500 fell -4.4%. Philadelphia Semiconductor Index crashed -12.2%. Nvidia fell -9.3%, AMD fell -17.3%. After US midterms, investors fear tougher rules on AI data centers. When tech falls, crypto follows.
Reason 2 - $1 Billion Liquidation
CoinGlass data shows $1 .05B liquidated in 24 hours. 88.2% were longs. That means people who were betting on price going up got wiped out. BTC alone had $267M liquidations, ETH had $167M. This was a leverage flush, not a spot sell-off.
Reason 3 - ETF Outflows
US Spot BTC ETFs saw $430M net outflows on Thursday. Fidelity FBTC lost ~$200M, BlackRock IBIT lost ~$105M. For the whole week, outflows are almost $870M. Institutions were de-risking, not buying.
Fear & Greed Index dropped from 50 (Neutral) to 28 (Fear) in just 1 day. A month ago it was 71 (Greed).
3. TECHNICAL ANALYSIS - LEVELS THAT MATTER
BTC is now below ALL major EMAs:
- 50-day EMA: $79,756
- 100-day EMA: $77,770
- 200-day EMA: $76,497 - This was support, now it is resistance
- RSI: 37.88 - Weak, but not oversold yet. Below 30 is oversold.
Key Levels:
Support: $74,000 - $75,000 (MUST HOLD)
If $75K breaks on daily close: Next $72,000, then $70,000
Resistance: $76,500 (first), then $79,000 - $80,000
Breakout: Daily close above $76,500 = short bounce, above $80,000 = real recovery
BTC Dominance is 59.2%. That means money is rotating INTO BTC, not altcoins. In fear, people trust BTC more.
4. WHAT HAPPENS NEXT? 2 SCENARIOS
Bullish Scenario - Bounce:
If $BTC holds $75K and closes back above $76,500, we can see a relief bounce to $79K - $80K. ETF inflows need to return for this.
Bearish Scenario - Breakdown:
If BTC closes below $74,968, another leverage flush will come and $72K - $68K will be in play. Some analysts are even warning about $58K if this becomes a 2018-style selloff. Not confirmed yet, but risk is real.
5. MY PLAN (Not Financial Advice)
I am not panicking and I am not FOMO buying.
- No leverage. Spot only.
- Small entry near $75K support, not all-in.
- If $75K breaks, I wait. If $76.5K reclaims, I add a little.
- Patience is the real profit here.
The market is flushing leverage, not breaking BTC. Every time Fear is at 28, smart money starts watching, not selling.
What is your plan?
1 = Buying the $75K dip
2 = Waiting for $72K
3 = Staying out, cash is king
Comment your number, let's see what Square thinks.
Not financial advice. DYOR. Data sources: CoinGlass, SoSoValue, Farside Investors, Alternative.me.
#Crypto #BinanceSquare #MarketAnalysis
1
138

·
--
$TA is up 25% and showing rejection at the highs. Here's why 👇
A 45% surge in 3 days put it up 25% on the day, so I took a closer look at the structure.
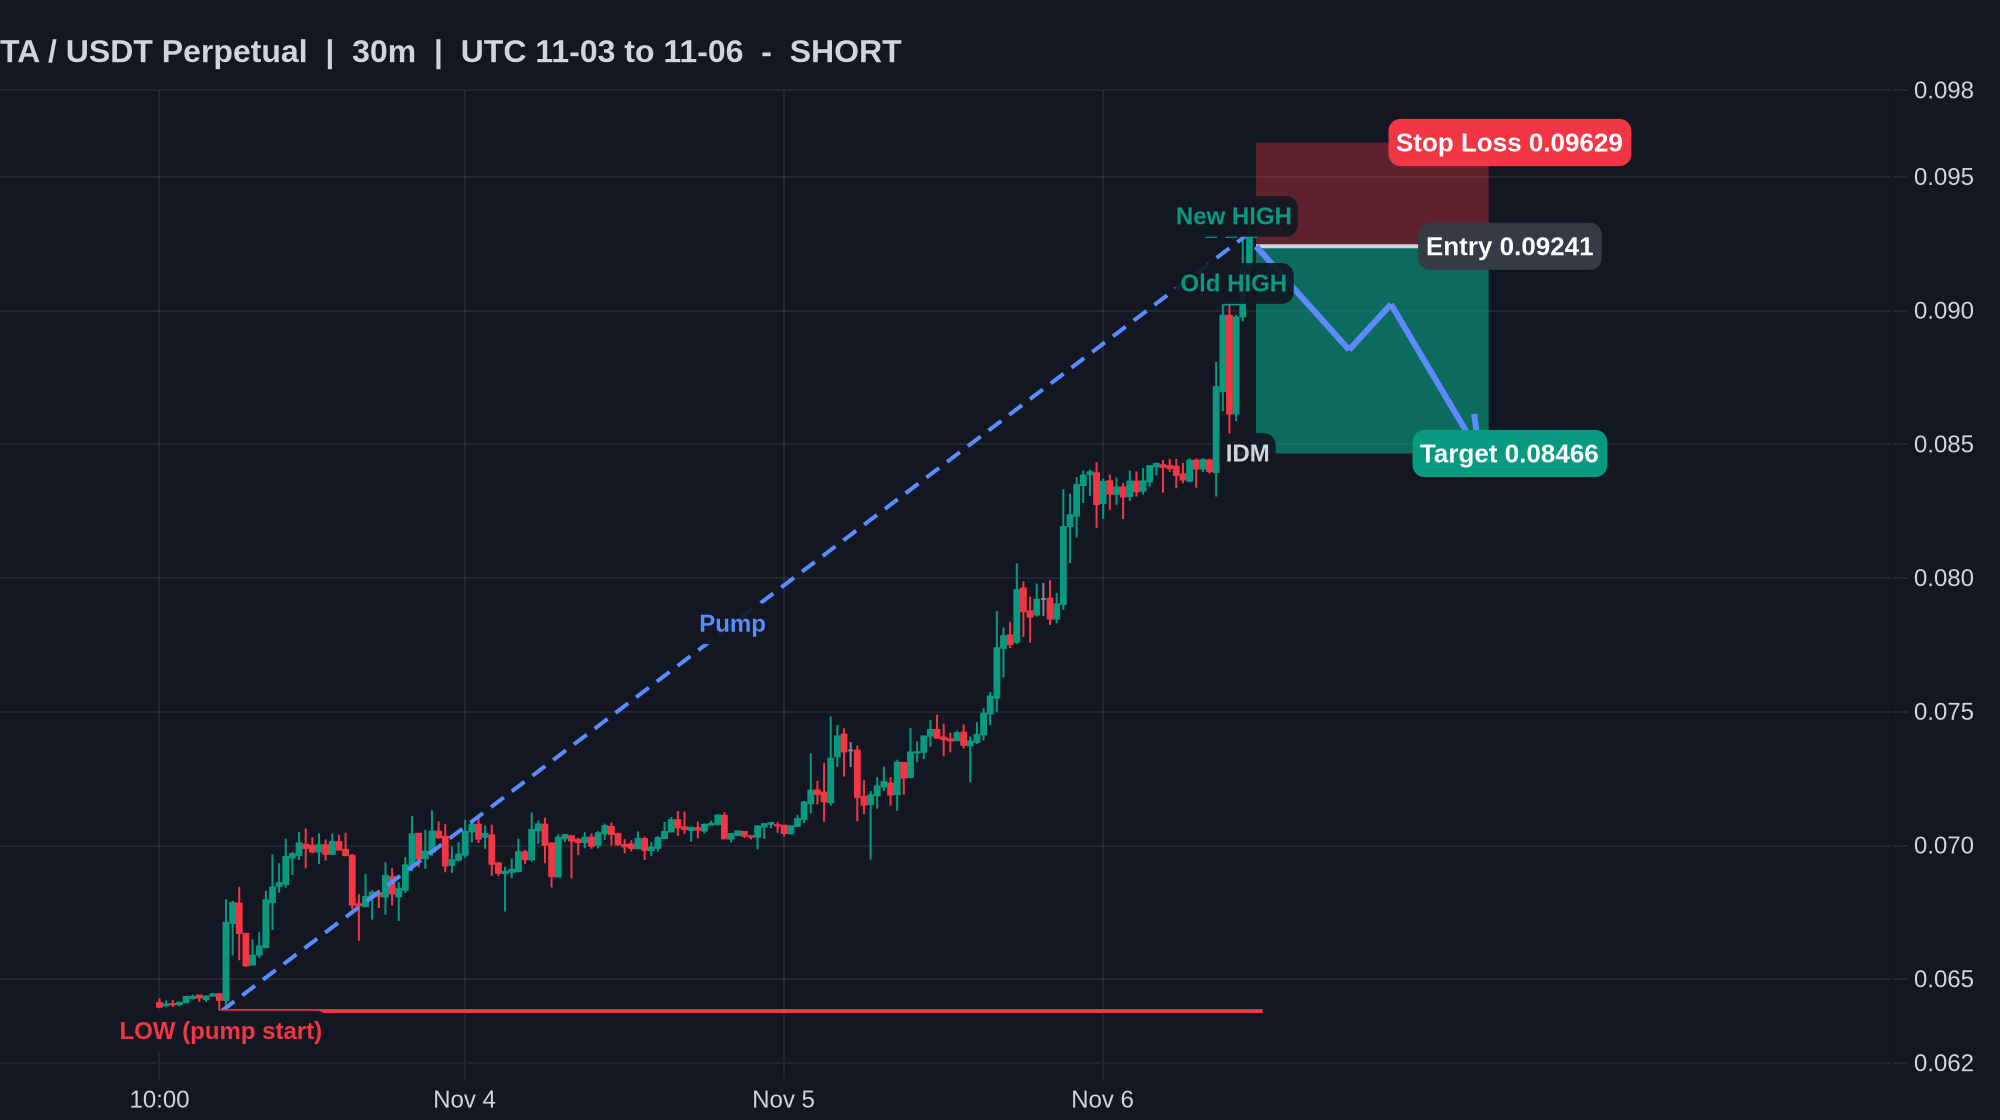
The break above 0.09027 was tiny (2.8%) and TA got rejected from 0.09278 straight away. That's not strength, that's buyers running out of steam.
Next stop for me is 0.08466. Nobody's touched it since $TA the pullback (21% of the leg), so it's the obvious magnet. A move above 0.09278 proves me wrong.
📌 My TA trade: short from 0.09241, stop at 0.09629, target 0.08466 (+8.4%, 1:2)
📊 24h Vol: $15.1M | 24h Chg: +25.0% | Funding: +0.0402%
Am I wrong? Tell me why below 👇
Follow for daily chart breakdowns 🔔
Not financial advice. Manage your risk.
#TA #Crypto #Trading
$TA is up 25% and showing rejection at the highs. Here's why 👇
A 45% surge in 3 days put it up 25% on the day, so I took a closer look at the structure.
The break above 0.09027 was tiny (2.8%) and TA got rejected from 0.09278 straight away. That's not strength, that's buyers running out of steam.
Next stop for me is 0.08466. Nobody's touched it since $TA the pullback (21% of the leg), so it's the obvious magnet. A move above 0.09278 proves me wrong.
📌 My TA trade: short from 0.09241, stop at 0.09629, target 0.08466 (+8.4%, 1:2)
📊 24h Vol: $15.1M | 24h Chg: +25.0% | Funding: +0.0402%
Am I wrong? Tell me why below 👇
Follow for daily chart breakdowns 🔔
Not financial advice. Manage your risk.
#TA #Crypto #Trading
A 45% surge in 3 days put it up 25% on the day, so I took a closer look at the structure.
The break above 0.09027 was tiny (2.8%) and TA got rejected from 0.09278 straight away. That's not strength, that's buyers running out of steam.
Next stop for me is 0.08466. Nobody's touched it since $TA the pullback (21% of the leg), so it's the obvious magnet. A move above 0.09278 proves me wrong.
📌 My TA trade: short from 0.09241, stop at 0.09629, target 0.08466 (+8.4%, 1:2)
📊 24h Vol: $15.1M | 24h Chg: +25.0% | Funding: +0.0402%
Am I wrong? Tell me why below 👇
Follow for daily chart breakdowns 🔔
Not financial advice. Manage your risk.
#TA #Crypto #Trading
7

·
--
💥 $ZEC SMASHES THROUGH $688 RESISTANCE AS BULLS TARGET THE $860 LIQUIDITY ZONE! 🚀
Target: 860 🚀
$ZEC just delivered a clean structural breakout, tearing past the critical $688 supply level and carving out fresh highs above $800. ⚡ Buyers are aggressively stepping in to front-run the next expansion phase, pushing momentum into hyperdrive. 📊
Order flow shows relentless bid pressure pointing straight toward the key $850–$860 liquidity pocket. 🌊 Meanwhile, smart money capital is rotating into high-conviction setups like $TAO and $AAVE as momentum spreads across top runners. 💡
💬 Are you taking profits on this $ZEC impulse or riding the momentum into the upper resistance band? 👇
⚠️ Not financial advice. Always manage your risk. 🛡️
🏷️ #ZEC #Breakout #Altcoins #Crypto
🚀 ⚡
💥 $ZEC SMASHES THROUGH $688 RESISTANCE AS BULLS TARGET THE $860 LIQUIDITY ZONE! 🚀
Target: 860 🚀
$ZEC just delivered a clean structural breakout, tearing past the critical $688 supply level and carving out fresh highs above $800. ⚡ Buyers are aggressively stepping in to front-run the next expansion phase, pushing momentum into hyperdrive. 📊
Order flow shows relentless bid pressure pointing straight toward the key $850–$860 liquidity pocket. 🌊 Meanwhile, smart money capital is rotating into high-conviction setups like $TAO and $AAVE as momentum spreads across top runners. 💡
💬 Are you taking profits on this $ZEC impulse or riding the momentum into the upper resistance band? 👇
⚠️ Not financial advice. Always manage your risk. 🛡️
🏷️ #ZEC #Breakout #Altcoins #Crypto
🚀 ⚡
Target: 860 🚀
$ZEC just delivered a clean structural breakout, tearing past the critical $688 supply level and carving out fresh highs above $800. ⚡ Buyers are aggressively stepping in to front-run the next expansion phase, pushing momentum into hyperdrive. 📊
Order flow shows relentless bid pressure pointing straight toward the key $850–$860 liquidity pocket. 🌊 Meanwhile, smart money capital is rotating into high-conviction setups like $TAO and $AAVE as momentum spreads across top runners. 💡
💬 Are you taking profits on this $ZEC impulse or riding the momentum into the upper resistance band? 👇
⚠️ Not financial advice. Always manage your risk. 🛡️
🏷️ #ZEC #Breakout #Altcoins #Crypto
🚀 ⚡
29

Tap the live $BTC and $ETH widgets below to analyze open positions.
🌐 Macro Parameters
The October US jobs report showed nonfarm payrolls rising by 165,000, well above forecasts of roughly 59,000 to 65,000. Unemployment fell to 4.1% from 4.2%, while monthly wages increased 0.4%.
The Fed held rates at 3.75% to 4.00% on October 28, 2026. Strong employment data has shifted expectations, with futures markets pricing roughly a 77% to 80% chance of a 25 basis point Fed hike at the December 9, 2026 meeting.
📊 Market Structure
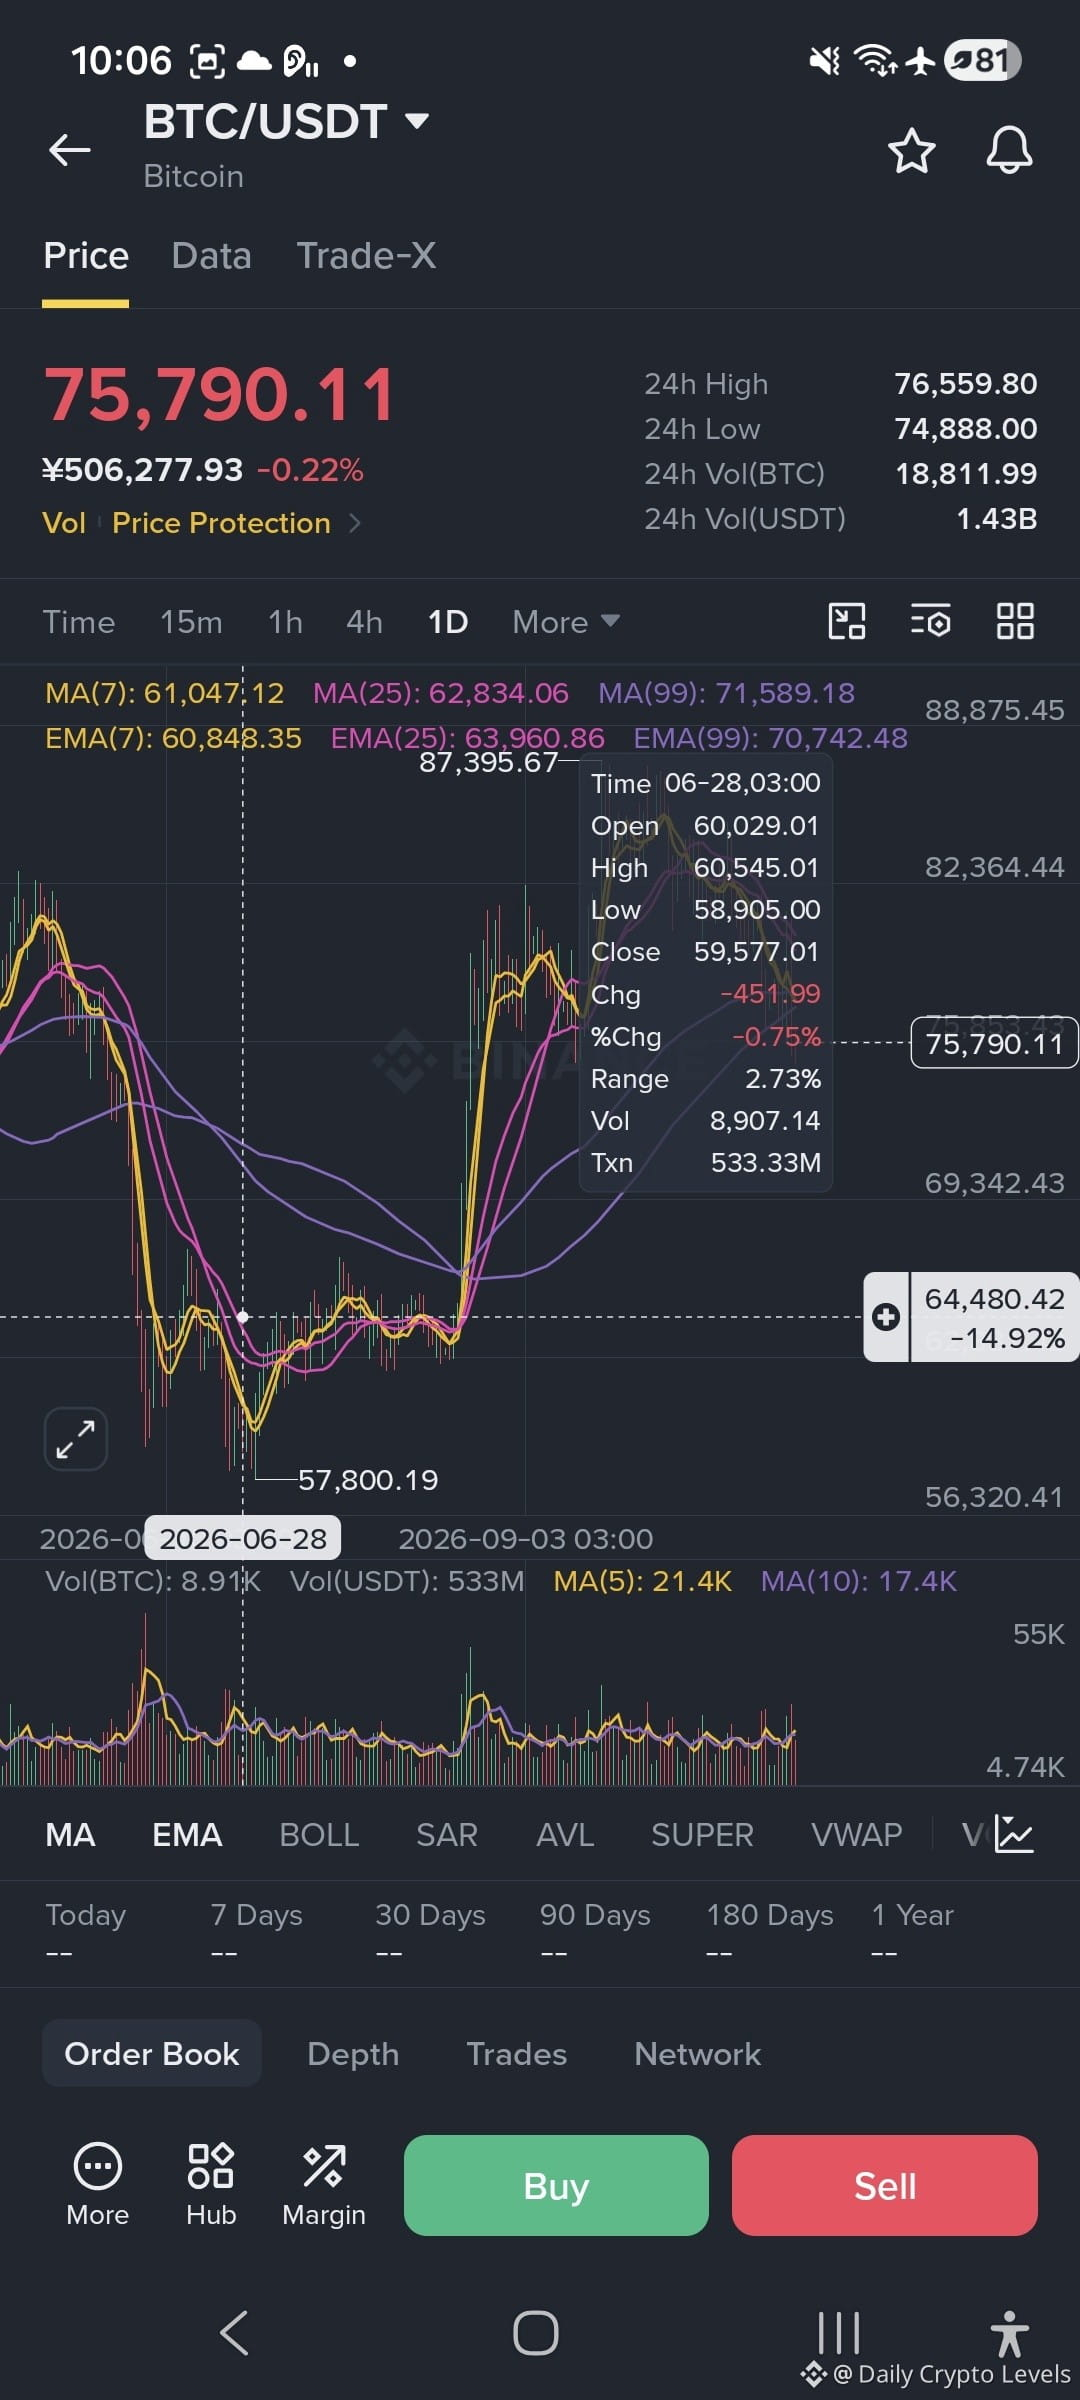
$BTC trades at $75,711.76, down 0.60% over 24 hours and 2.20% over 7 days, with a 24-hour range of $74,921.12 to $76,892.13. Despite recovering the $76,000 area after this week's tech-stock rout, US spot Bitcoin ETFs shed roughly $430 million.
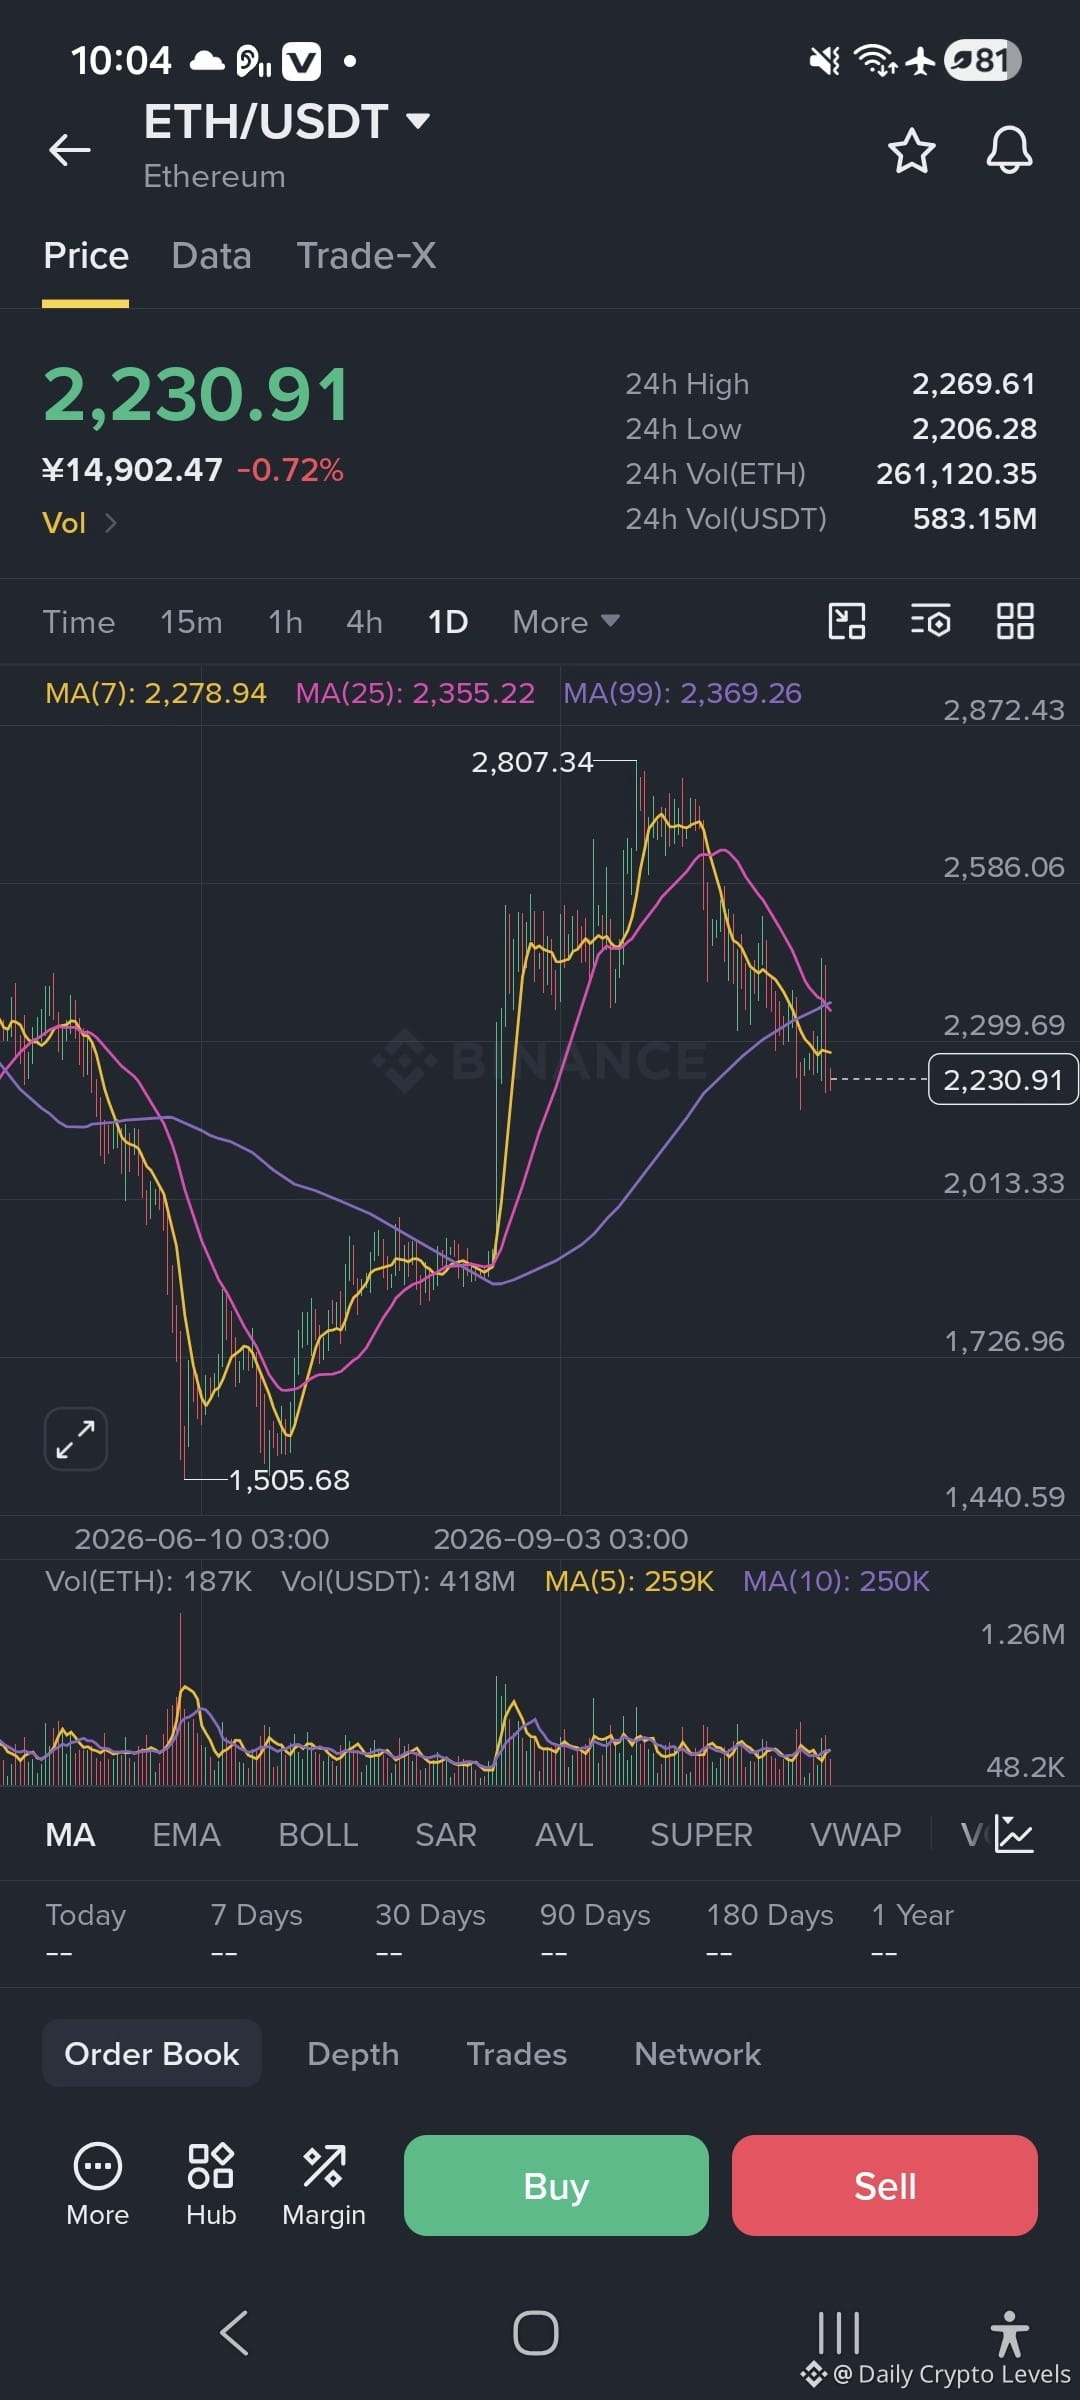
$ETH trades at $2,223.02, down 1.30% over 24 hours but up 0.40% over 7 days. Its 24-hour range stands at $2,208.54 to $2,265.81, reflecting a mixed short-term picture.
💧 Allocation Framework
The combination of stronger employment data and rising Fed hike expectations creates a challenging macro backdrop for risk assets. ETF outflows also remain an important factor when assessing institutional demand for $BTC.
Traders may watch employment-driven rate expectations, ETF flow trends, and key price levels across $BTC and $ETH. Whether conditions shift toward risk-on or risk-off will depend on how these factors develop, with neither outcome guaranteed.
━━━━━━━━━━━━━━
💬 Risk-on or risk-off?
#BTC #ETH #Crypto #BinanceSquare
Tap the live $BTC and $ETH widgets below to analyze open positions.
🌐 Macro Parameters
The October US jobs report showed nonfarm payrolls rising by 165,000, well above forecasts of roughly 59,000 to 65,000. Unemployment fell to 4.1% from 4.2%, while monthly wages increased 0.4%.
The Fed held rates at 3.75% to 4.00% on October 28, 2026. Strong employment data has shifted expectations, with futures markets pricing roughly a 77% to 80% chance of a 25 basis point Fed hike at the December 9, 2026 meeting.
📊 Market Structure
$BTC trades at $75,711.76, down 0.60% over 24 hours and 2.20% over 7 days, with a 24-hour range of $74,921.12 to $76,892.13. Despite recovering the $76,000 area after this week's tech-stock rout, US spot Bitcoin ETFs shed roughly $430 million.
$ETH trades at $2,223.02, down 1.30% over 24 hours but up 0.40% over 7 days. Its 24-hour range stands at $2,208.54 to $2,265.81, reflecting a mixed short-term picture.
💧 Allocation Framework
The combination of stronger employment data and rising Fed hike expectations creates a challenging macro backdrop for risk assets. ETF outflows also remain an important factor when assessing institutional demand for $BTC.
Traders may watch employment-driven rate expectations, ETF flow trends, and key price levels across $BTC and $ETH. Whether conditions shift toward risk-on or risk-off will depend on how these factors develop, with neither outcome guaranteed.
━━━━━━━━━━━━━━
💬 Risk-on or risk-off?
#BTC #ETH #Crypto #BinanceSquare
🌐 Macro Parameters
The October US jobs report showed nonfarm payrolls rising by 165,000, well above forecasts of roughly 59,000 to 65,000. Unemployment fell to 4.1% from 4.2%, while monthly wages increased 0.4%.
The Fed held rates at 3.75% to 4.00% on October 28, 2026. Strong employment data has shifted expectations, with futures markets pricing roughly a 77% to 80% chance of a 25 basis point Fed hike at the December 9, 2026 meeting.
📊 Market Structure
$BTC trades at $75,711.76, down 0.60% over 24 hours and 2.20% over 7 days, with a 24-hour range of $74,921.12 to $76,892.13. Despite recovering the $76,000 area after this week's tech-stock rout, US spot Bitcoin ETFs shed roughly $430 million.
$ETH trades at $2,223.02, down 1.30% over 24 hours but up 0.40% over 7 days. Its 24-hour range stands at $2,208.54 to $2,265.81, reflecting a mixed short-term picture.
💧 Allocation Framework
The combination of stronger employment data and rising Fed hike expectations creates a challenging macro backdrop for risk assets. ETF outflows also remain an important factor when assessing institutional demand for $BTC.
Traders may watch employment-driven rate expectations, ETF flow trends, and key price levels across $BTC and $ETH. Whether conditions shift toward risk-on or risk-off will depend on how these factors develop, with neither outcome guaranteed.
━━━━━━━━━━━━━━
💬 Risk-on or risk-off?
#BTC #ETH #Crypto #BinanceSquare
2
197

·
--
Verified
🏦 CORPORATE BITCOIN ARMS RACE HEATS UP
Strive just dropped a statement quarter — and the Bitcoin treasury race has a new challenger closing in on No. 2.
🔹 THE NUMBERS
Strive (Nasdaq: ASST) bought 15,124 BTC in October alone, lifting its treasury to 43,124 BTC, worth roughly $3.25B. That includes a single $511M buy of 6,182 BTC on Oct 26. Q3 net income hit $509M, powered by $533.7M in unrealized Bitcoin gains.
🔹 WHY IT MATTERS
Strive is now the 4th-largest public corporate Bitcoin holder — just 390 BTC behind Twenty One Capital and only 877 BTC short of Metaplanet at No. 2. The race for the No. 2 spot is now a matter of weeks, not quarters. The buying was funded largely by a $609M raise via 15% SATS preferred stock — aggressive, expensive capital chasing Bitcoin exposure.
🔹 THE RISK
That $509M profit is paper gains. If BTC rolls over, it reverses just as fast — and 15% preferred dividends are a heavy price to pay for leverage. Treasury momentum is real, but it cuts both ways.
Corporate treasuries keep stacking while BTC holds ~$76K. The question is who blinks first — the buyers, or the market? 🐂 or 🐻 — drop your take below.
📌 Sharing personal opinions only, not financial advice or a recommendation to buy/sell. Crypto is highly risky; DYOR and you are solely responsible. No coin promotion.
#Bitcoin #Strive #Crypto #Binance
🏦 CORPORATE BITCOIN ARMS RACE HEATS UP
Strive just dropped a statement quarter — and the Bitcoin treasury race has a new challenger closing in on No. 2.
🔹 THE NUMBERS
Strive (Nasdaq: ASST) bought 15,124 BTC in October alone, lifting its treasury to 43,124 BTC, worth roughly $3.25B. That includes a single $511M buy of 6,182 BTC on Oct 26. Q3 net income hit $509M, powered by $533.7M in unrealized Bitcoin gains.
🔹 WHY IT MATTERS
Strive is now the 4th-largest public corporate Bitcoin holder — just 390 BTC behind Twenty One Capital and only 877 BTC short of Metaplanet at No. 2. The race for the No. 2 spot is now a matter of weeks, not quarters. The buying was funded largely by a $609M raise via 15% SATS preferred stock — aggressive, expensive capital chasing Bitcoin exposure.
🔹 THE RISK
That $509M profit is paper gains. If BTC rolls over, it reverses just as fast — and 15% preferred dividends are a heavy price to pay for leverage. Treasury momentum is real, but it cuts both ways.
Corporate treasuries keep stacking while BTC holds ~$76K. The question is who blinks first — the buyers, or the market? 🐂 or 🐻 — drop your take below.
📌 Sharing personal opinions only, not financial advice or a recommendation to buy/sell. Crypto is highly risky; DYOR and you are solely responsible. No coin promotion.
#Bitcoin #Strive #Crypto #Binance
Strive just dropped a statement quarter — and the Bitcoin treasury race has a new challenger closing in on No. 2.
🔹 THE NUMBERS
Strive (Nasdaq: ASST) bought 15,124 BTC in October alone, lifting its treasury to 43,124 BTC, worth roughly $3.25B. That includes a single $511M buy of 6,182 BTC on Oct 26. Q3 net income hit $509M, powered by $533.7M in unrealized Bitcoin gains.
🔹 WHY IT MATTERS
Strive is now the 4th-largest public corporate Bitcoin holder — just 390 BTC behind Twenty One Capital and only 877 BTC short of Metaplanet at No. 2. The race for the No. 2 spot is now a matter of weeks, not quarters. The buying was funded largely by a $609M raise via 15% SATS preferred stock — aggressive, expensive capital chasing Bitcoin exposure.
🔹 THE RISK
That $509M profit is paper gains. If BTC rolls over, it reverses just as fast — and 15% preferred dividends are a heavy price to pay for leverage. Treasury momentum is real, but it cuts both ways.
Corporate treasuries keep stacking while BTC holds ~$76K. The question is who blinks first — the buyers, or the market? 🐂 or 🐻 — drop your take below.
📌 Sharing personal opinions only, not financial advice or a recommendation to buy/sell. Crypto is highly risky; DYOR and you are solely responsible. No coin promotion.
#Bitcoin #Strive #Crypto #Binance
BTC+0.03%
ASSTUS+0.09%
Abu Fahadأ:
💛
1
3
839

·
--
⚡ $PUMP SHOWS ABSURD RELATIVE STRENGTH WHILE ALTS BLEED HARD! 💥
Entry: 0.0045 - 0.0047 ⚡
Target: 0.005 - 0.01 🚀
Stop Loss: 0.00424 ⚠️
While the broader market experiences heavy selling pressure, $PUMP is completely ignoring the pullback and defending local structure with iron demand. 📊 Smart money is visibly stepping in to absorb panic dumps, creating a clear order flow divergence.
📌 Bids are stacking heavy at the demand block, positioning for a violent expansion once broader liquidity stabilizes. 💬 Are you bidding this relative strength setup now or waiting for the breakout move? 👇
⚠️ Not financial advice. Always manage your risk. 🛡️
🏷️ #PUMP #LongSetup #Altcoins #Crypto
🔥 💎
⚡ $PUMP SHOWS ABSURD RELATIVE STRENGTH WHILE ALTS BLEED HARD! 💥
Entry: 0.0045 - 0.0047 ⚡
Target: 0.005 - 0.01 🚀
Stop Loss: 0.00424 ⚠️
While the broader market experiences heavy selling pressure, $PUMP is completely ignoring the pullback and defending local structure with iron demand. 📊 Smart money is visibly stepping in to absorb panic dumps, creating a clear order flow divergence.
📌 Bids are stacking heavy at the demand block, positioning for a violent expansion once broader liquidity stabilizes. 💬 Are you bidding this relative strength setup now or waiting for the breakout move? 👇
⚠️ Not financial advice. Always manage your risk. 🛡️
🏷️ #PUMP #LongSetup #Altcoins #Crypto
🔥 💎
Entry: 0.0045 - 0.0047 ⚡
Target: 0.005 - 0.01 🚀
Stop Loss: 0.00424 ⚠️
While the broader market experiences heavy selling pressure, $PUMP is completely ignoring the pullback and defending local structure with iron demand. 📊 Smart money is visibly stepping in to absorb panic dumps, creating a clear order flow divergence.
📌 Bids are stacking heavy at the demand block, positioning for a violent expansion once broader liquidity stabilizes. 💬 Are you bidding this relative strength setup now or waiting for the breakout move? 👇
⚠️ Not financial advice. Always manage your risk. 🛡️
🏷️ #PUMP #LongSetup #Altcoins #Crypto
🔥 💎

·
--
🚨 HEAVY DISTRIBUTION ON $TUT AS RESISTANCE AT 0.067 TRAPS LATE BUYERS! 🔻
Entry: 0.0585 - 0.0622 ⚡
Target: 0.0500 - 0.0318 🎯
Stop Loss: 0.0710 ⚠️
The aggressive pump into the 0.067 resistance level met an immediate wall of sell orders, completely snapping the rally's momentum. 📊 Dump volume is exploding as institutional supply aggressively steps in to capitalize on trapped late buyers at the top.
🌊 Order flow points toward a steep structural unwind back toward the 0.03x liquidity pocket. 📌 Heavy selling pressure makes this momentum decay pattern extremely clean. 💬 Are you positioning for the drop or staying on the sidelines? 👇
⚠️ Not financial advice. Always manage your risk. 🛡️
🏷️ #TUT #ShortSetup #Bearish #Crypto
📉 🔻
🚨 HEAVY DISTRIBUTION ON $TUT AS RESISTANCE AT 0.067 TRAPS LATE BUYERS! 🔻
Entry: 0.0585 - 0.0622 ⚡
Target: 0.0500 - 0.0318 🎯
Stop Loss: 0.0710 ⚠️
The aggressive pump into the 0.067 resistance level met an immediate wall of sell orders, completely snapping the rally's momentum. 📊 Dump volume is exploding as institutional supply aggressively steps in to capitalize on trapped late buyers at the top.
🌊 Order flow points toward a steep structural unwind back toward the 0.03x liquidity pocket. 📌 Heavy selling pressure makes this momentum decay pattern extremely clean. 💬 Are you positioning for the drop or staying on the sidelines? 👇
⚠️ Not financial advice. Always manage your risk. 🛡️
🏷️ #TUT #ShortSetup #Bearish #Crypto
📉 🔻
Entry: 0.0585 - 0.0622 ⚡
Target: 0.0500 - 0.0318 🎯
Stop Loss: 0.0710 ⚠️
The aggressive pump into the 0.067 resistance level met an immediate wall of sell orders, completely snapping the rally's momentum. 📊 Dump volume is exploding as institutional supply aggressively steps in to capitalize on trapped late buyers at the top.
🌊 Order flow points toward a steep structural unwind back toward the 0.03x liquidity pocket. 📌 Heavy selling pressure makes this momentum decay pattern extremely clean. 💬 Are you positioning for the drop or staying on the sidelines? 👇
⚠️ Not financial advice. Always manage your risk. 🛡️
🏷️ #TUT #ShortSetup #Bearish #Crypto
📉 🔻
Log in to explore more content
Join global crypto users on Binance Square
⚡️ Get latest and useful information about crypto.
💬 Trusted by the world’s largest crypto exchange.
👍 Discover real insights from verified creators.
Email / Phone number
Trending Topics
1
#BitcoinRebounds$75KAsChipsLead
6,128 views
107 Discussing
2
#JobsReportRaisesHikeOdds
90,765 views
881 Discussing
3
#US Data Center Rules May Constrain AI Expansion
11,825 views
94 Discussing
4
#$2TWipedOutHedgeFundsFaceLiquidation
14,144 views
98 Discussing
5
#WillAnthropicListOnTime
12,996 views
252 Discussing
6
#USNovemberMichiganExpectationsIndexPrelimAt50.9
21,011 views
346 Discussing
7
#OilPlungesBelow$100
21,301 views
38 Discussing
8
#TradFiForBeginners
12,893 views
222 Discussing
9
#USMidtermsCouldShakeUpUS-IranTies
40,888 views
518 Discussing
10
#RussianCentralBankNamesBTCETHUSDTForNonQualifiedInvestors
775 views
11 Discussing