
#56
56
3,350 views
40 Discussing
Hot
Latest

·
--
56% daily increase, but the funding rate is actually negative?
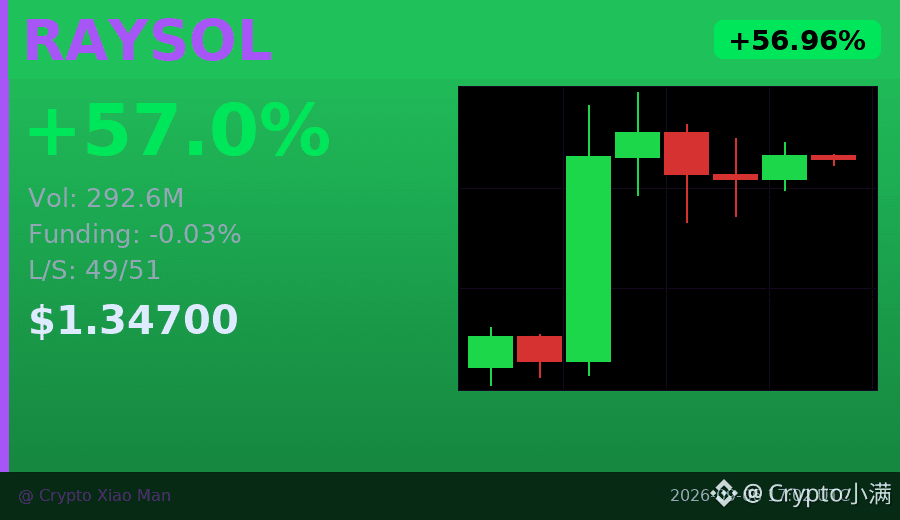
RAYSOL surged from 0.85 to 1.40 today, with trading volume hitting $292 million. The strangest part is that while the price skyrocketed, the funding rate was still -0.029%, and the long/short ratio was almost 50/50.
What does this mean? Most people haven’t caught on to this wave of strength yet, or they’re still waiting for a pullback to get in. The candlestick action over the past 8 hours is very clear: the third big bullish candle broke out directly, and then the price held steady at the highs with little retracement.
This kind of situation, where the price flies but the funding rate doesn’t follow, is often a sign that the move isn’t over yet. Of course, with such a sharp short-term rally, chasing the price still requires caution.
$RAYSOL #Solana生态 #56%涨幅
Click the small card below to quickly check the market 👇
56% daily increase, but the funding rate is actually negative?
RAYSOL surged from 0.85 to 1.40 today, with trading volume hitting $292 million. The strangest part is that while the price skyrocketed, the funding rate was still -0.029%, and the long/short ratio was almost 50/50.
What does this mean? Most people haven’t caught on to this wave of strength yet, or they’re still waiting for a pullback to get in. The candlestick action over the past 8 hours is very clear: the third big bullish candle broke out directly, and then the price held steady at the highs with little retracement.
This kind of situation, where the price flies but the funding rate doesn’t follow, is often a sign that the move isn’t over yet. Of course, with such a sharp short-term rally, chasing the price still requires caution.
$RAYSOL #Solana生态 #56%涨幅
Click the small card below to quickly check the market 👇
RAYSOL surged from 0.85 to 1.40 today, with trading volume hitting $292 million. The strangest part is that while the price skyrocketed, the funding rate was still -0.029%, and the long/short ratio was almost 50/50.
What does this mean? Most people haven’t caught on to this wave of strength yet, or they’re still waiting for a pullback to get in. The candlestick action over the past 8 hours is very clear: the third big bullish candle broke out directly, and then the price held steady at the highs with little retracement.
This kind of situation, where the price flies but the funding rate doesn’t follow, is often a sign that the move isn’t over yet. Of course, with such a sharp short-term rally, chasing the price still requires caution.
$RAYSOL #Solana生态 #56%涨幅
Click the small card below to quickly check the market 👇
70

·
--
$UAI long position entered! 20X leverage, average entry price 0.2122, current unrealized ROE +22.4% 🚀
🎯 Live trade
$UAI USDT perpetual · LONG · 20X
Average entry price 0.2122 → current price 0.2597
TP1 0.2597 / TP2 0.2739 / SL 0.2289
Risk-reward ratio 2.8:1, holding window 20~40 minutes
🧠 Entry rationale (LLM strategy #56 analysis)
24h sharp drop of -14%, RSI(5m/15m)=30.9/19.2, deeply oversold
5m long lower-wick Pinbar, lower-wick ratio 3.3x, clear bottoming signal
Rebounded +3.79% from the low of 0.232, right-side reversal confirmed
Aggressive buying returns at 54.5%, MACD red bars expanding
Broader market choppy but bullish, score 59.9; trend confirmation passed
Automatically switched to LIMIT to avoid chasing, placing order at the pullback level of 0.2393
🛡️ Risk management rules
Stop loss at 0.2289 is fixed and must not be moved. If ROE is below +18% after 40 minutes, the timeout circuit breaker is triggered; large winning positions are exempt from forced closure.
This trade entered the pool on the left side and got confirmation on the right side—the timing feels great. Do you think it can reach TP2? Share your target price in the comments 👇
#币安合约 #实盘战报 #量化交易 #UAI
$UAI long position entered! 20X leverage, average entry price 0.2122, current unrealized ROE +22.4% 🚀
🎯 Live trade
$UAI USDT perpetual · LONG · 20X
Average entry price 0.2122 → current price 0.2597
TP1 0.2597 / TP2 0.2739 / SL 0.2289
Risk-reward ratio 2.8:1, holding window 20~40 minutes
🧠 Entry rationale (LLM strategy #56 analysis)
24h sharp drop of -14%, RSI(5m/15m)=30.9/19.2, deeply oversold
5m long lower-wick Pinbar, lower-wick ratio 3.3x, clear bottoming signal
Rebounded +3.79% from the low of 0.232, right-side reversal confirmed
Aggressive buying returns at 54.5%, MACD red bars expanding
Broader market choppy but bullish, score 59.9; trend confirmation passed
Automatically switched to LIMIT to avoid chasing, placing order at the pullback level of 0.2393
🛡️ Risk management rules
Stop loss at 0.2289 is fixed and must not be moved. If ROE is below +18% after 40 minutes, the timeout circuit breaker is triggered; large winning positions are exempt from forced closure.
This trade entered the pool on the left side and got confirmation on the right side—the timing feels great. Do you think it can reach TP2? Share your target price in the comments 👇
#币安合约 #实盘战报 #量化交易 #UAI
🎯 Live trade
$UAI USDT perpetual · LONG · 20X
Average entry price 0.2122 → current price 0.2597
TP1 0.2597 / TP2 0.2739 / SL 0.2289
Risk-reward ratio 2.8:1, holding window 20~40 minutes
🧠 Entry rationale (LLM strategy #56 analysis)
24h sharp drop of -14%, RSI(5m/15m)=30.9/19.2, deeply oversold
5m long lower-wick Pinbar, lower-wick ratio 3.3x, clear bottoming signal
Rebounded +3.79% from the low of 0.232, right-side reversal confirmed
Aggressive buying returns at 54.5%, MACD red bars expanding
Broader market choppy but bullish, score 59.9; trend confirmation passed
Automatically switched to LIMIT to avoid chasing, placing order at the pullback level of 0.2393
🛡️ Risk management rules
Stop loss at 0.2289 is fixed and must not be moved. If ROE is below +18% after 40 minutes, the timeout circuit breaker is triggered; large winning positions are exempt from forced closure.
This trade entered the pool on the left side and got confirmation on the right side—the timing feels great. Do you think it can reach TP2? Share your target price in the comments 👇
#币安合约 #实盘战报 #量化交易 #UAI
2
520

·
--
⬇️ $DOT Bears are in control; I don't buy this rebound
$DOT (Polkadot) | Daily chart watch
I. Trend
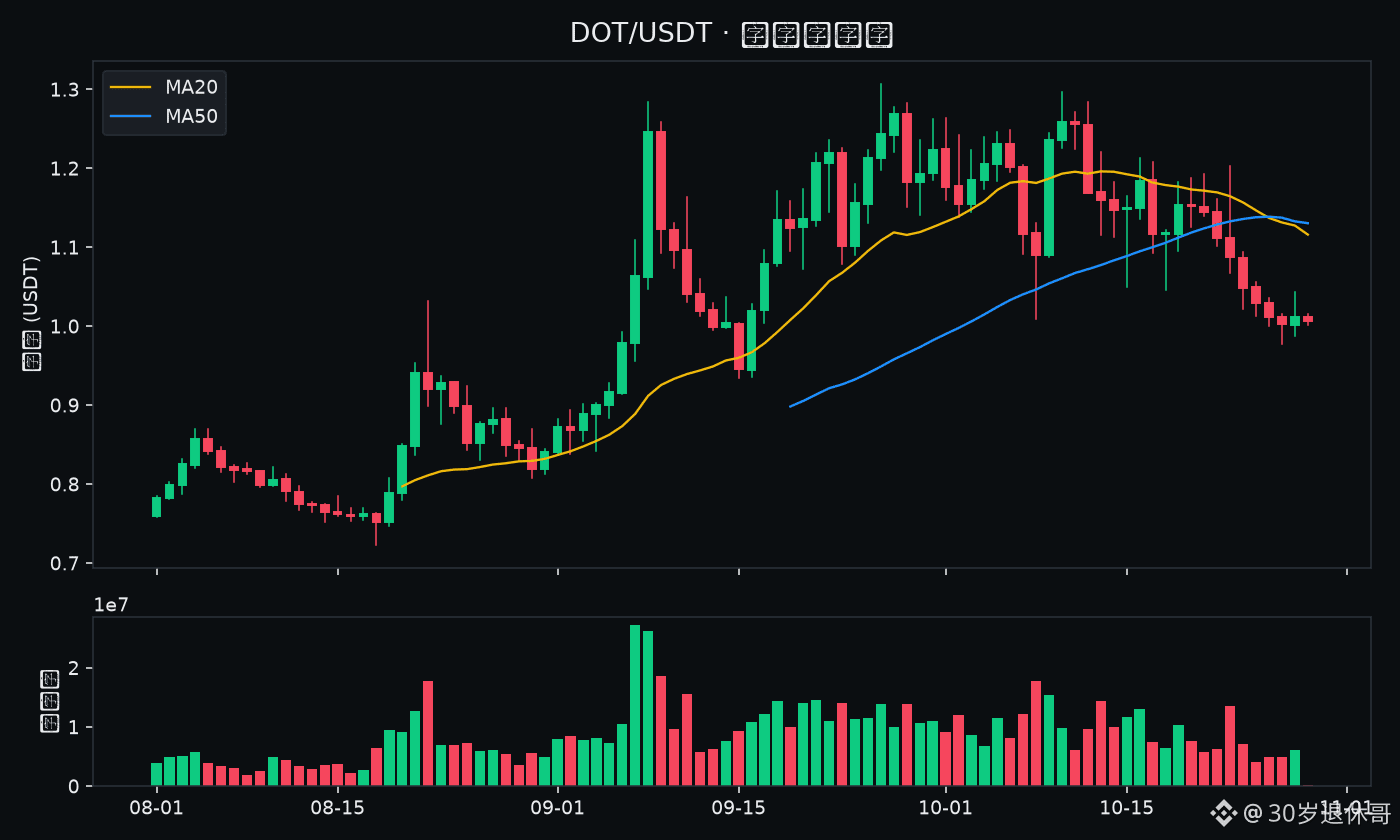
Market cap rank: around #56; current price: around 1.0070 USDT. MA20 ≈ 1.1159 and MA50 ≈ 1.1303. Price is below the moving averages, and every rebound looks more like an exit window for those stuck at higher prices. When the trend is bearish, “buying the dip” can easily turn into “catching a falling knife.”
II. Key levels and invalidation
Resistance ≈ 1.2960; support ≈ 0.977000. If price fails to break through resistance and then breaks below support on heavy volume, that’s the bearish scenario. The invalidation level is 1.2960: if price reclaims it convincingly, I’ll admit I’m wrong and turn neutral.
III. Volume
Yesterday’s volume fell to 0.7x the average of the past nearly 20 days—big moves are often brewing in the quiet!
【My view】$DOT: bearish.
I’ll be watching closely to see whether a rebound near 1.2960 gets rejected, and whether 0.977000 holds.
In a bear market, “just hold on a little longer” is often the most expensive decision. The chart has made its position clear. I’m putting my view out there; price action will provide the answer.
⚠️ The above is solely my personal public technical observation of market conditions and expression of sentiment, and does not constitute investment advice. Crypto is extremely volatile; make your own decisions, manage risk strictly, and accept responsibility for any gains or losses.
$BTC $ETH $DOT #看空 #技术分析 #币安广场 #30-year-old early retirement guy
⬇️ $DOT Bears are in control; I don't buy this rebound
$DOT (Polkadot) | Daily chart watch
I. Trend
Market cap rank: around #56; current price: around 1.0070 USDT. MA20 ≈ 1.1159 and MA50 ≈ 1.1303. Price is below the moving averages, and every rebound looks more like an exit window for those stuck at higher prices. When the trend is bearish, “buying the dip” can easily turn into “catching a falling knife.”
II. Key levels and invalidation
Resistance ≈ 1.2960; support ≈ 0.977000. If price fails to break through resistance and then breaks below support on heavy volume, that’s the bearish scenario. The invalidation level is 1.2960: if price reclaims it convincingly, I’ll admit I’m wrong and turn neutral.
III. Volume
Yesterday’s volume fell to 0.7x the average of the past nearly 20 days—big moves are often brewing in the quiet!
【My view】$DOT : bearish.
I’ll be watching closely to see whether a rebound near 1.2960 gets rejected, and whether 0.977000 holds.
In a bear market, “just hold on a little longer” is often the most expensive decision. The chart has made its position clear. I’m putting my view out there; price action will provide the answer.
⚠️ The above is solely my personal public technical observation of market conditions and expression of sentiment, and does not constitute investment advice. Crypto is extremely volatile; make your own decisions, manage risk strictly, and accept responsibility for any gains or losses.
$BTC $ETH $DOT #看空 #技术分析 #币安广场 #30-year-old early retirement guy
$DOT (Polkadot) | Daily chart watch
I. Trend
Market cap rank: around #56; current price: around 1.0070 USDT. MA20 ≈ 1.1159 and MA50 ≈ 1.1303. Price is below the moving averages, and every rebound looks more like an exit window for those stuck at higher prices. When the trend is bearish, “buying the dip” can easily turn into “catching a falling knife.”
II. Key levels and invalidation
Resistance ≈ 1.2960; support ≈ 0.977000. If price fails to break through resistance and then breaks below support on heavy volume, that’s the bearish scenario. The invalidation level is 1.2960: if price reclaims it convincingly, I’ll admit I’m wrong and turn neutral.
III. Volume
Yesterday’s volume fell to 0.7x the average of the past nearly 20 days—big moves are often brewing in the quiet!
【My view】$DOT : bearish.
I’ll be watching closely to see whether a rebound near 1.2960 gets rejected, and whether 0.977000 holds.
In a bear market, “just hold on a little longer” is often the most expensive decision. The chart has made its position clear. I’m putting my view out there; price action will provide the answer.
⚠️ The above is solely my personal public technical observation of market conditions and expression of sentiment, and does not constitute investment advice. Crypto is extremely volatile; make your own decisions, manage risk strictly, and accept responsibility for any gains or losses.
$BTC $ETH $DOT #看空 #技术分析 #币安广场 #30-year-old early retirement guy
383

·
--
We're excited to share the latest trending tokens with our community. According to CoinGecko, The Black Bull (ANSEM) and Backpack (BP) are gaining traction.
We're seeing notable market cap ranks, with Bitcoin (BTC) at #1 and Hyperliquid (HYPE) at #10 🚀.
We've also got Aave (AAVE) at #56 and Bittensor (TAO) at #41, while Based (BASED) is at #661, and our community is taking notice 💡.
Our focus is on these tokens, with their respective market cap ranks. We're tracking their progress, and we're hopeful about their potential 🔥.
We're committed to keeping our community informed, and we're looking forward to seeing how these tokens perform in the future 📈.
$NFP, $ZBT, $NFP
We're excited to share the latest trending tokens with our community. According to CoinGecko, The Black Bull (ANSEM) and Backpack (BP) are gaining traction.
We're seeing notable market cap ranks, with Bitcoin (BTC) at #1 and Hyperliquid (HYPE) at #10 🚀.
We've also got Aave (AAVE) at #56 and Bittensor (TAO) at #41, while Based (BASED) is at #661, and our community is taking notice 💡.
Our focus is on these tokens, with their respective market cap ranks. We're tracking their progress, and we're hopeful about their potential 🔥.
We're committed to keeping our community informed, and we're looking forward to seeing how these tokens perform in the future 📈.
$NFP, $ZBT , $NFP
We're seeing notable market cap ranks, with Bitcoin (BTC) at #1 and Hyperliquid (HYPE) at #10 🚀.
We've also got Aave (AAVE) at #56 and Bittensor (TAO) at #41, while Based (BASED) is at #661, and our community is taking notice 💡.
Our focus is on these tokens, with their respective market cap ranks. We're tracking their progress, and we're hopeful about their potential 🔥.
We're committed to keeping our community informed, and we're looking forward to seeing how these tokens perform in the future 📈.
$NFP, $ZBT , $NFP
110

·
--
🐸 PEPE IS SLEEPING... BUT THE WHALES AREN’T
PEPE currently sitting at $0.00000333 with $1.4B market cap 💰
24h volume hitting $136M — that’s serious liquidity for a frog!
💡 Key observations:
• Down 12% on the week but sentiment is 75% bullish 🟢
• 88% down from ATH ($0.000028) — classic accumulation zone
• All 420.69T tokens in circulation — fully diluted, zero unlocks
• Rank #56 globally among all crypto
History rhymes in memecoin land. The whales know when to load up. Quiet floors are where bags get filled 🤔
If PEPE reclaims $0.0000050, next stop is $0.000010. The frog army is just recharging ☁️
👀 Keep watching. The frog always jumps.
#PEPE #Memecoin
🐸 PEPE IS SLEEPING... BUT THE WHALES AREN’T
PEPE currently sitting at $0.00000333 with $1.4B market cap 💰
24h volume hitting $136M — that’s serious liquidity for a frog!
💡 Key observations:
• Down 12% on the week but sentiment is 75% bullish 🟢
• 88% down from ATH ($0.000028) — classic accumulation zone
• All 420.69T tokens in circulation — fully diluted, zero unlocks
• Rank #56 globally among all crypto
History rhymes in memecoin land. The whales know when to load up. Quiet floors are where bags get filled 🤔
If PEPE reclaims $0.0000050, next stop is $0.000010. The frog army is just recharging ☁️
👀 Keep watching. The frog always jumps.
#PEPE #Memecoin
PEPE currently sitting at $0.00000333 with $1.4B market cap 💰
24h volume hitting $136M — that’s serious liquidity for a frog!
💡 Key observations:
• Down 12% on the week but sentiment is 75% bullish 🟢
• 88% down from ATH ($0.000028) — classic accumulation zone
• All 420.69T tokens in circulation — fully diluted, zero unlocks
• Rank #56 globally among all crypto
History rhymes in memecoin land. The whales know when to load up. Quiet floors are where bags get filled 🤔
If PEPE reclaims $0.0000050, next stop is $0.000010. The frog army is just recharging ☁️
👀 Keep watching. The frog always jumps.
#PEPE #Memecoin
40
·
--
We're excited to share the latest trending tokens with our community. According to CoinGecko, Cash Cat (CASHCAT) and Solstice (SLX) are gaining attention 🚀.
We've seen notable market cap ranks, with LAB (LAB) at #109, Pudgy Penguins (PENGU) at #115, and Aave (AAVE) at #56. Bitcoin (BTC) remains at the top with a market cap rank of #1, while Solana (SOL) holds a strong position at #7.
We're keeping a close eye on these tokens, and we're eager to see how they perform in the coming days 💡. With our community's interest in mind, we're providing updates on their market cap ranks and percentage changes. Our community can stay informed with the latest data 📈, and make informed decisions about their investments 👍.
$VANRY, $UTK, $BLUAI
We're excited to share the latest trending tokens with our community. According to CoinGecko, Cash Cat (CASHCAT) and Solstice (SLX) are gaining attention 🚀.
We've seen notable market cap ranks, with LAB (LAB) at #109, Pudgy Penguins (PENGU) at #115, and Aave (AAVE) at #56. Bitcoin (BTC) remains at the top with a market cap rank of #1, while Solana (SOL) holds a strong position at #7.
We're keeping a close eye on these tokens, and we're eager to see how they perform in the coming days 💡. With our community's interest in mind, we're providing updates on their market cap ranks and percentage changes. Our community can stay informed with the latest data 📈, and make informed decisions about their investments 👍.
$VANRY, $UTK, $BLUAI
We've seen notable market cap ranks, with LAB (LAB) at #109, Pudgy Penguins (PENGU) at #115, and Aave (AAVE) at #56. Bitcoin (BTC) remains at the top with a market cap rank of #1, while Solana (SOL) holds a strong position at #7.
We're keeping a close eye on these tokens, and we're eager to see how they perform in the coming days 💡. With our community's interest in mind, we're providing updates on their market cap ranks and percentage changes. Our community can stay informed with the latest data 📈, and make informed decisions about their investments 👍.
$VANRY, $UTK, $BLUAI
155
·
--
56% price increase, but the funding rate has already spiked to 0.0249%—what does this mean?
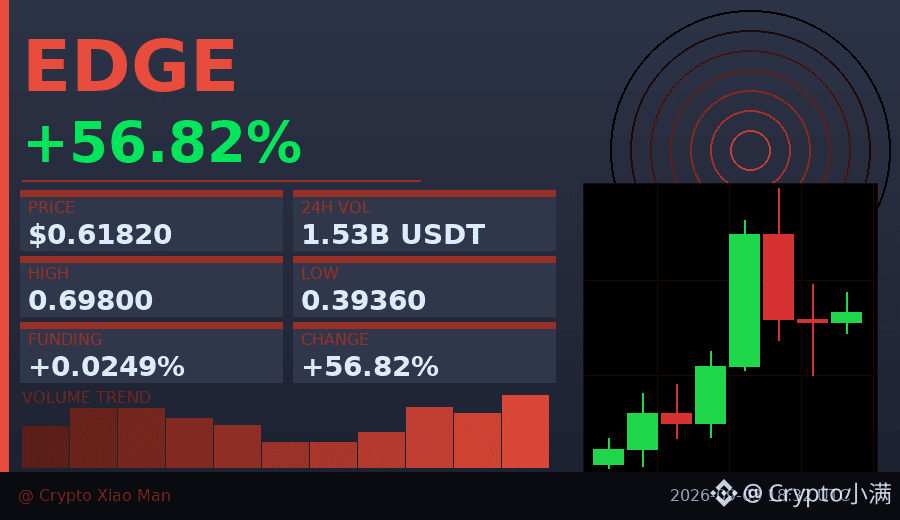
Today, EDGE moved from 0.39 to 0.69 and then retraced to 0.61, with volume surging to 153 million USDT.
Longs are 52% and shorts are 48%, nearly even on both sides. But such a high funding rate suggests leveraged long positions are overcrowded.
The 8-hour candlestick chart shows: the 5th big bullish candle broke through the previous high directly. The 6th candle surged and then pulled back. Now candles 7–8 are consolidating.
This kind of pattern is common when short-term profit-taking flows in. If funding doesn’t drop, pullback pressure will only increase.
I don’t chase this kind of high funding-rate setup—I’ll wait until the funding rate falls back below 0.01% before taking another look.
$EDGE #资金费率警报 #56%
Click the small card below to quickly view the market👇
56% price increase, but the funding rate has already spiked to 0.0249%—what does this mean?
Today, EDGE moved from 0.39 to 0.69 and then retraced to 0.61, with volume surging to 153 million USDT.
Longs are 52% and shorts are 48%, nearly even on both sides. But such a high funding rate suggests leveraged long positions are overcrowded.
The 8-hour candlestick chart shows: the 5th big bullish candle broke through the previous high directly. The 6th candle surged and then pulled back. Now candles 7–8 are consolidating.
This kind of pattern is common when short-term profit-taking flows in. If funding doesn’t drop, pullback pressure will only increase.
I don’t chase this kind of high funding-rate setup—I’ll wait until the funding rate falls back below 0.01% before taking another look.
$EDGE #资金费率警报 #56%
Click the small card below to quickly view the market👇
Today, EDGE moved from 0.39 to 0.69 and then retraced to 0.61, with volume surging to 153 million USDT.
Longs are 52% and shorts are 48%, nearly even on both sides. But such a high funding rate suggests leveraged long positions are overcrowded.
The 8-hour candlestick chart shows: the 5th big bullish candle broke through the previous high directly. The 6th candle surged and then pulled back. Now candles 7–8 are consolidating.
This kind of pattern is common when short-term profit-taking flows in. If funding doesn’t drop, pullback pressure will only increase.
I don’t chase this kind of high funding-rate setup—I’ll wait until the funding rate falls back below 0.01% before taking another look.
$EDGE #资金费率警报 #56%
Click the small card below to quickly view the market👇
27
·
--
56% price increase, but shorts still make up 55%—this is a typical short-squeeze market.
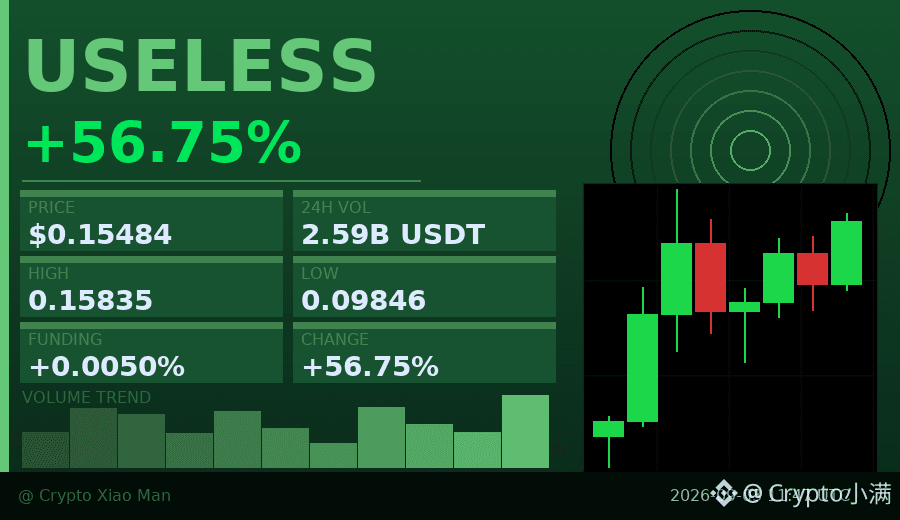
USELESS moved from 0.098 to 0.158, staying strongly bid for 8 hours, with trading volume of 259 million U. When the price broke through, the shorts didn’t have time to exit—now the more it rises, the more trapped they are.
The key for this move is the 0.14 support level. As long as it doesn’t pull back and fall below it, the longs can continue squeezing out short-stop orders. But since this rally is driven by sentiment, be careful when chasing the price.
$USELESS #轧空行情 #56%
Click the small card below to quickly view the market👇
56% price increase, but shorts still make up 55%—this is a typical short-squeeze market.
USELESS moved from 0.098 to 0.158, staying strongly bid for 8 hours, with trading volume of 259 million U. When the price broke through, the shorts didn’t have time to exit—now the more it rises, the more trapped they are.
The key for this move is the 0.14 support level. As long as it doesn’t pull back and fall below it, the longs can continue squeezing out short-stop orders. But since this rally is driven by sentiment, be careful when chasing the price.
$USELESS #轧空行情 #56%
Click the small card below to quickly view the market👇
USELESS moved from 0.098 to 0.158, staying strongly bid for 8 hours, with trading volume of 259 million U. When the price broke through, the shorts didn’t have time to exit—now the more it rises, the more trapped they are.
The key for this move is the 0.14 support level. As long as it doesn’t pull back and fall below it, the longs can continue squeezing out short-stop orders. But since this rally is driven by sentiment, be careful when chasing the price.
$USELESS #轧空行情 #56%
Click the small card below to quickly view the market👇
96
·
--
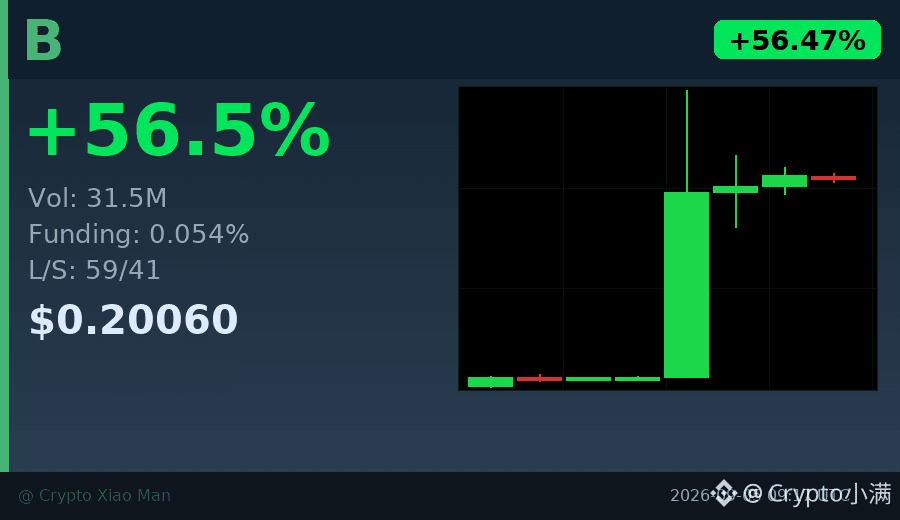
Behind the 56% increase, what’s really worth paying attention to is the 101 million in trading volume.
Buying pressure kept coming in over the 8 hours, pushing the price from 0.13 all the way above 0.20.
The funding rate is only 0.054%, and the long/short ratio is 59/41, which shows it’s not crowded yet.
This kind of combination of rising volume and price, with sentiment not yet overheated, is often more interesting than a simple surge.
I’ll be watching for a pullback opportunity around 0.195, with a stop loss below 0.185.
$B #成交量突破 #56%
Click the card below to quickly view the market👇
Behind the 56% increase, what’s really worth paying attention to is the 101 million in trading volume.
Buying pressure kept coming in over the 8 hours, pushing the price from 0.13 all the way above 0.20.
The funding rate is only 0.054%, and the long/short ratio is 59/41, which shows it’s not crowded yet.
This kind of combination of rising volume and price, with sentiment not yet overheated, is often more interesting than a simple surge.
I’ll be watching for a pullback opportunity around 0.195, with a stop loss below 0.185.
$B #成交量突破 #56%
Click the card below to quickly view the market👇
Buying pressure kept coming in over the 8 hours, pushing the price from 0.13 all the way above 0.20.
The funding rate is only 0.054%, and the long/short ratio is 59/41, which shows it’s not crowded yet.
This kind of combination of rising volume and price, with sentiment not yet overheated, is often more interesting than a simple surge.
I’ll be watching for a pullback opportunity around 0.195, with a stop loss below 0.185.
$B #成交量突破 #56%
Click the card below to quickly view the market👇
17

·
--
Many people make a common mistake when looking at $DOT: thinking that because it has fallen 98% from ATH, with a market cap of only 1.28 billion and a rank of #56, it must be an undervalued deep value opportunity. But the real issue is that $DOT has an enormous circulating supply, ongoing inflation every year, and its cross-chain narrative has been diluted by more lightweight solutions. Falling a lot doesn’t necessarily mean it’s cheap—it may be the true waterline revealed after liquidity ebbs.
This week, $DOT slid from 0.88 to 0.75, down 10% on the week and 8.5% over 30 days. Based on the near-30-day price action, on July 11 there was a breakout-style bullish candle on elevated volume (daily trading volume of 125 million). After that, the price failed to hold and drifted lower on decreasing volume. In the past two or three days, trading volume has returned to the 80 million–100 million range, while the price has been ranging around 0.75. The key here isn’t how high it can rebound, but whether the supply side has genuinely eased.
Bull–bear disagreement boils down to the same question: trading volume. If you’re bullish, you want to see daily trading value stay above 100 million for the next three days and for the price not to break 0.74—evidence that someone is accumulating at the bottom. If you’re bearish, you’ll also watch this metric: once volume expands but price doesn’t rise, or volume contracts and breaks down, then 0.75 isn’t a bottom—it’s just a waystation to the next leg lower. No matter which side you’re on, keeping an eye on trading volume matters far more than obsessing over the ATH.
Many people make a common mistake when looking at $DOT : thinking that because it has fallen 98% from ATH, with a market cap of only 1.28 billion and a rank of #56, it must be an undervalued deep value opportunity. But the real issue is that $DOT has an enormous circulating supply, ongoing inflation every year, and its cross-chain narrative has been diluted by more lightweight solutions. Falling a lot doesn’t necessarily mean it’s cheap—it may be the true waterline revealed after liquidity ebbs.
This week, $DOT slid from 0.88 to 0.75, down 10% on the week and 8.5% over 30 days. Based on the near-30-day price action, on July 11 there was a breakout-style bullish candle on elevated volume (daily trading volume of 125 million). After that, the price failed to hold and drifted lower on decreasing volume. In the past two or three days, trading volume has returned to the 80 million–100 million range, while the price has been ranging around 0.75. The key here isn’t how high it can rebound, but whether the supply side has genuinely eased.
Bull–bear disagreement boils down to the same question: trading volume. If you’re bullish, you want to see daily trading value stay above 100 million for the next three days and for the price not to break 0.74—evidence that someone is accumulating at the bottom. If you’re bearish, you’ll also watch this metric: once volume expands but price doesn’t rise, or volume contracts and breaks down, then 0.75 isn’t a bottom—it’s just a waystation to the next leg lower. No matter which side you’re on, keeping an eye on trading volume matters far more than obsessing over the ATH.
This week, $DOT slid from 0.88 to 0.75, down 10% on the week and 8.5% over 30 days. Based on the near-30-day price action, on July 11 there was a breakout-style bullish candle on elevated volume (daily trading volume of 125 million). After that, the price failed to hold and drifted lower on decreasing volume. In the past two or three days, trading volume has returned to the 80 million–100 million range, while the price has been ranging around 0.75. The key here isn’t how high it can rebound, but whether the supply side has genuinely eased.
Bull–bear disagreement boils down to the same question: trading volume. If you’re bullish, you want to see daily trading value stay above 100 million for the next three days and for the price not to break 0.74—evidence that someone is accumulating at the bottom. If you’re bearish, you’ll also watch this metric: once volume expands but price doesn’t rise, or volume contracts and breaks down, then 0.75 isn’t a bottom—it’s just a waystation to the next leg lower. No matter which side you’re on, keeping an eye on trading volume matters far more than obsessing over the ATH.
213

$ENA -4.4% in 24h: analysis📉 Breakdown of the drop over 24h
Summary: the picture across timeframes is mixed — no single trend is visible; confirmed by high trading volume.
Worst momentum: $ENA -4.4% in 24h
Price: $0.1589 (range $0.1571–$0.1687)
Momentum by timeframe: 1h -1.3%, 24h -4.4%, 7d -0.6%, 30d +83.5%
Position within the 24h range: 16% (at the lower bound of the daily range)
$ENA -4.4% in 24h: analysis
📉 Breakdown of the drop over 24h
Summary: the picture across timeframes is mixed — no single trend is visible; confirmed by high trading volume.
Worst momentum: $ENA -4.4% in 24h
Price: $0.1589 (range $0.1571–$0.1687)
Momentum by timeframe: 1h -1.3%, 24h -4.4%, 7d -0.6%, 30d +83.5%
Position within the 24h range: 16% (at the lower bound of the daily range)
Summary: the picture across timeframes is mixed — no single trend is visible; confirmed by high trading volume.
Worst momentum: $ENA -4.4% in 24h
Price: $0.1589 (range $0.1571–$0.1687)
Momentum by timeframe: 1h -1.3%, 24h -4.4%, 7d -0.6%, 30d +83.5%
Position within the 24h range: 16% (at the lower bound of the daily range)
403
·
--
We're excited to share the latest trending tokens with our community. According to CoinGecko, top tokens are making waves in the market.
We're seeing a mix of established and new players, including Bitcoin (BTC) and Taiko (TAIKO) 🚀.
Our analysis shows that Aave (AAVE) and Pudgy Penguins (PENGU) are also gaining traction, with market cap ranks of #56 and #118 respectively.
We're tracking the performance of these tokens, with Synapse (SYN) and Jupiter (JUP) showing promise 📈. Solana (SOL) is also on our radar, with a market cap rank of #7.
We're committed to staying up-to-date on the latest market trends, and we're excited to see how these tokens will perform in the future 💡.
Our community can expect more updates and insights on these trending tokens, as we continue to monitor the market 📊.
$NFP, $ZBT, $TAIKO
We're excited to share the latest trending tokens with our community. According to CoinGecko, top tokens are making waves in the market.
We're seeing a mix of established and new players, including Bitcoin (BTC) and Taiko (TAIKO) 🚀.
Our analysis shows that Aave (AAVE) and Pudgy Penguins (PENGU) are also gaining traction, with market cap ranks of #56 and #118 respectively.
We're tracking the performance of these tokens, with Synapse (SYN) and Jupiter (JUP) showing promise 📈. Solana (SOL) is also on our radar, with a market cap rank of #7.
We're committed to staying up-to-date on the latest market trends, and we're excited to see how these tokens will perform in the future 💡.
Our community can expect more updates and insights on these trending tokens, as we continue to monitor the market 📊.
$NFP, $ZBT , $TAIKO
We're seeing a mix of established and new players, including Bitcoin (BTC) and Taiko (TAIKO) 🚀.
Our analysis shows that Aave (AAVE) and Pudgy Penguins (PENGU) are also gaining traction, with market cap ranks of #56 and #118 respectively.
We're tracking the performance of these tokens, with Synapse (SYN) and Jupiter (JUP) showing promise 📈. Solana (SOL) is also on our radar, with a market cap rank of #7.
We're committed to staying up-to-date on the latest market trends, and we're excited to see how these tokens will perform in the future 💡.
Our community can expect more updates and insights on these trending tokens, as we continue to monitor the market 📊.
$NFP, $ZBT , $TAIKO
3

·
--
“Why does Uni’s 16.3% gain overshadow BTC and ETH?”Pump.fun (PUMPUSDT) is trending right now!
Rank: #56
“UNI surged 16.311% in a single day to 7.14 USDT — a figure that contradicts and ’s less-than-6% move over the past 24 hours. So why are large whales moving into this altcoin? 👀 According to Binance data, UNIUSDT’s 24-hour volume is 73.7 M USDT. This is not a ordinary “pump”; it is a sign of liquidity flow and real DEX usage. Weighted avg price 6.70 USDT, previous close 6.14 USDT — in other words, an “ape-in” opportunity of more than 1 USDT. In the same context, LTCUSDT climbed +7.07% to 54.65 USDT, BNBUSDT +6.64% to 768.03 USDT, and DOGEUSDT +6.46% to 0.09021 USDT. These three are seen as an “altcoin-season” signal, but from my perspective UNI’s momentum is on a different layer. Why? First, Uniswap’s new v4 release enters the testnet phase earlier this week, and with fees for liquidity providers (LPs) set to rise from 0.3% to 0.5%, expectations of a “fee-rebate” emerged. Second, Layer-2 integrations across the ETH ecosystem are progressing slowly; this is causing ’s to remain compressed around 6.5%. Therefore, risk-on traders looking for “high-yield” are turning to UNI. Of course, everyone sees UNI as “just hype.” “Everyone says UNI is a temporary pump, but I think there is real token utility and a fee-model revision underneath this price action.” This contrary view often escapes those especially worried about a short-term “dump.” Now, let’s look at these data with a DCA tactic n
“Why does Uni’s 16.3% gain overshadow BTC and ETH?”
Pump.fun (PUMPUSDT) is trending right now!
Rank: #56
“UNI surged 16.311% in a single day to 7.14 USDT — a figure that contradicts and ’s less-than-6% move over the past 24 hours. So why are large whales moving into this altcoin? 👀 According to Binance data, UNIUSDT’s 24-hour volume is 73.7 M USDT. This is not a ordinary “pump”; it is a sign of liquidity flow and real DEX usage. Weighted avg price 6.70 USDT, previous close 6.14 USDT — in other words, an “ape-in” opportunity of more than 1 USDT. In the same context, LTCUSDT climbed +7.07% to 54.65 USDT, BNBUSDT +6.64% to 768.03 USDT, and DOGEUSDT +6.46% to 0.09021 USDT. These three are seen as an “altcoin-season” signal, but from my perspective UNI’s momentum is on a different layer. Why? First, Uniswap’s new v4 release enters the testnet phase earlier this week, and with fees for liquidity providers (LPs) set to rise from 0.3% to 0.5%, expectations of a “fee-rebate” emerged. Second, Layer-2 integrations across the ETH ecosystem are progressing slowly; this is causing ’s to remain compressed around 6.5%. Therefore, risk-on traders looking for “high-yield” are turning to UNI. Of course, everyone sees UNI as “just hype.” “Everyone says UNI is a temporary pump, but I think there is real token utility and a fee-model revision underneath this price action.” This contrary view often escapes those especially worried about a short-term “dump.” Now, let’s look at these data with a DCA tactic n
Rank: #56
“UNI surged 16.311% in a single day to 7.14 USDT — a figure that contradicts and ’s less-than-6% move over the past 24 hours. So why are large whales moving into this altcoin? 👀 According to Binance data, UNIUSDT’s 24-hour volume is 73.7 M USDT. This is not a ordinary “pump”; it is a sign of liquidity flow and real DEX usage. Weighted avg price 6.70 USDT, previous close 6.14 USDT — in other words, an “ape-in” opportunity of more than 1 USDT. In the same context, LTCUSDT climbed +7.07% to 54.65 USDT, BNBUSDT +6.64% to 768.03 USDT, and DOGEUSDT +6.46% to 0.09021 USDT. These three are seen as an “altcoin-season” signal, but from my perspective UNI’s momentum is on a different layer. Why? First, Uniswap’s new v4 release enters the testnet phase earlier this week, and with fees for liquidity providers (LPs) set to rise from 0.3% to 0.5%, expectations of a “fee-rebate” emerged. Second, Layer-2 integrations across the ETH ecosystem are progressing slowly; this is causing ’s to remain compressed around 6.5%. Therefore, risk-on traders looking for “high-yield” are turning to UNI. Of course, everyone sees UNI as “just hype.” “Everyone says UNI is a temporary pump, but I think there is real token utility and a fee-model revision underneath this price action.” This contrary view often escapes those especially worried about a short-term “dump.” Now, let’s look at these data with a DCA tactic n
52


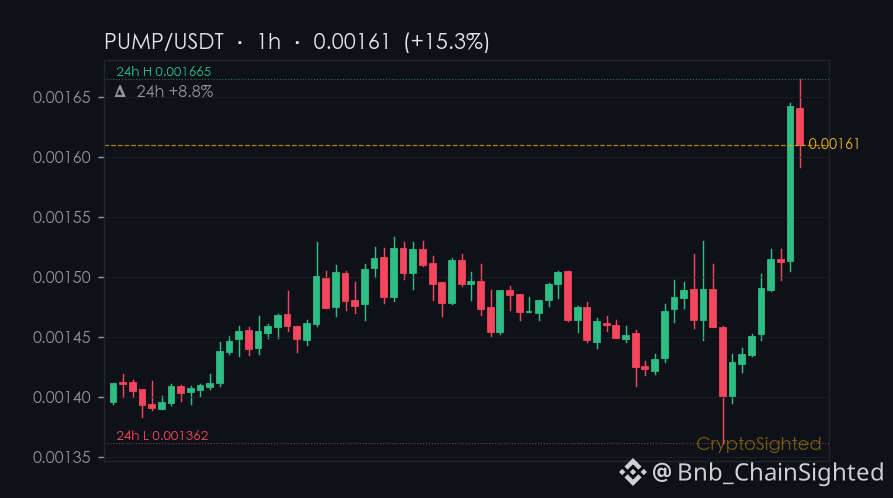
A 0.005% funding rate anomaly on $PUMP’s derivatives - just enough to make shorts pause and longs recalibrate their risk math.
The token is up 8.8% in 24 hours, but the funding rate is hovering near neutral, suggesting the move lacks strong leverage backing.
That’s the tension.
Checkpoint: PUMP’s funding rate is ↑0.0050% now - if it holds above that level tomorrow, the market is still in a neutral stance; if it flips negative, the leverage-driven narrative may be in trouble.
—
📊 13 directional calls in the last 30d, every one auto-settled against price. Direction only — no buy/sell calls.
Not financial advice. DYOR.
📌 Funding Pulse · #56 · #FundingRate #CryptoSighted $PUMP
A 0.005% funding rate anomaly on $PUMP ’s derivatives - just enough to make shorts pause and longs recalibrate their risk math.
The token is up 8.8% in 24 hours, but the funding rate is hovering near neutral, suggesting the move lacks strong leverage backing.
That’s the tension.
Checkpoint: PUMP’s funding rate is ↑0.0050% now - if it holds above that level tomorrow, the market is still in a neutral stance; if it flips negative, the leverage-driven narrative may be in trouble.
—
📊 13 directional calls in the last 30d, every one auto-settled against price. Direction only — no buy/sell calls.
Not financial advice. DYOR.
📌 Funding Pulse · #56 · #FundingRate #CryptoSighted $PUMP
The token is up 8.8% in 24 hours, but the funding rate is hovering near neutral, suggesting the move lacks strong leverage backing.
That’s the tension.
Checkpoint: PUMP’s funding rate is ↑0.0050% now - if it holds above that level tomorrow, the market is still in a neutral stance; if it flips negative, the leverage-driven narrative may be in trouble.
—
📊 13 directional calls in the last 30d, every one auto-settled against price. Direction only — no buy/sell calls.
Not financial advice. DYOR.
📌 Funding Pulse · #56 · #FundingRate #CryptoSighted $PUMP
181
·
--
We're excited to share the latest trending tokens with our community 🚀. Our team has been tracking the market, and we're seeing some notable movements.
We're looking at tokens like Pudgy Penguins (PENGU), Worldcoin (WLD), and Bittensor (TAO), which are currently ranked #113, #56, and #43 in market cap, respectively. Other trending tokens include Lighter (LIT), Cash Cat (CASHCAT), Zama (ZAMA), and Pi Network (PI).
We're seeing significant interest in these tokens, and we're expecting more updates soon 💡. Our community is eager to learn more about these trending tokens, and we're happy to provide the latest information 📈. We're committed to keeping our community informed, and we'll continue to share more updates in the future 🚫.
$LA, $BANK, $ESPORTS
We're excited to share the latest trending tokens with our community 🚀. Our team has been tracking the market, and we're seeing some notable movements.
We're looking at tokens like Pudgy Penguins (PENGU), Worldcoin (WLD), and Bittensor (TAO), which are currently ranked #113, #56, and #43 in market cap, respectively. Other trending tokens include Lighter (LIT), Cash Cat (CASHCAT), Zama (ZAMA), and Pi Network (PI).
We're seeing significant interest in these tokens, and we're expecting more updates soon 💡. Our community is eager to learn more about these trending tokens, and we're happy to provide the latest information 📈. We're committed to keeping our community informed, and we'll continue to share more updates in the future 🚫.
$LA , $BANK , $ESPORTS
We're looking at tokens like Pudgy Penguins (PENGU), Worldcoin (WLD), and Bittensor (TAO), which are currently ranked #113, #56, and #43 in market cap, respectively. Other trending tokens include Lighter (LIT), Cash Cat (CASHCAT), Zama (ZAMA), and Pi Network (PI).
We're seeing significant interest in these tokens, and we're expecting more updates soon 💡. Our community is eager to learn more about these trending tokens, and we're happy to provide the latest information 📈. We're committed to keeping our community informed, and we'll continue to share more updates in the future 🚫.
$LA , $BANK , $ESPORTS
161
A 6.5% drop in 24 hours - that’s the move $FIL just made, without any obvious catalyst.
It’s not the kind of price action you’d expect from a coin that’s been sitting in a sideways grind.
And yet, here it is: a sharp decline with no clear reason to point to.
The numbers don’t lie, but they don’t tell the whole story either.
FIL is down 6.3% over the past week and 14.4% in the last 30 days.
That’s a steep slide, and it’s happening even as the broader market sentiment is slowly turning less fearful.
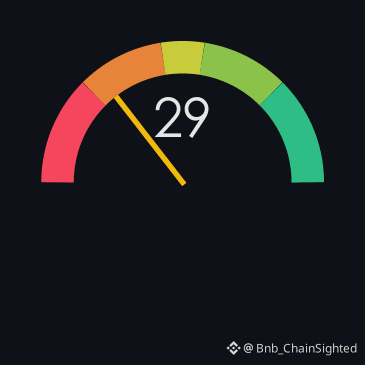
The Fear & Greed Index has climbed from 25 to 29 in just one day - a move toward the neutral zone, not the panic it was in before.
—
Not financial advice. DYOR.
📌 Fear & Greed · #56 · #FearAndGreed #CryptoSighted $FIL
A 6.5% drop in 24 hours - that’s the move $FIL just made, without any obvious catalyst.
It’s not the kind of price action you’d expect from a coin that’s been sitting in a sideways grind.
And yet, here it is: a sharp decline with no clear reason to point to.
The numbers don’t lie, but they don’t tell the whole story either.
FIL is down 6.3% over the past week and 14.4% in the last 30 days.
That’s a steep slide, and it’s happening even as the broader market sentiment is slowly turning less fearful.
The Fear & Greed Index has climbed from 25 to 29 in just one day - a move toward the neutral zone, not the panic it was in before.
—
Not financial advice. DYOR.
📌 Fear & Greed · #56 · #FearAndGreed #CryptoSighted $FIL
It’s not the kind of price action you’d expect from a coin that’s been sitting in a sideways grind.
And yet, here it is: a sharp decline with no clear reason to point to.
The numbers don’t lie, but they don’t tell the whole story either.
FIL is down 6.3% over the past week and 14.4% in the last 30 days.
That’s a steep slide, and it’s happening even as the broader market sentiment is slowly turning less fearful.
The Fear & Greed Index has climbed from 25 to 29 in just one day - a move toward the neutral zone, not the panic it was in before.
—
Not financial advice. DYOR.
📌 Fear & Greed · #56 · #FearAndGreed #CryptoSighted $FIL
592

·
--
I've been tracking trending tokens on CoinGecko, and I'm excited to share my findings.
I see ADI, PENGU, and BANK are gaining traction.
I'm watching their market cap ranks, with Bittensor at #41 and Pi Network at #64, along with Aave at #56, and I think they're worth considering 🚀.
I've also noticed Cash Cat at #326, which could be a hidden gem.
I believe these tokens have potential, with some experiencing significant % changes.
I'm looking forward to seeing how they perform, and I'll be keeping a close eye on them 💡.
I think it's time to take a closer look at these tokens, and perhaps invest in them 📈.
$HEMI, $XNO, $HEMI
I've been tracking trending tokens on CoinGecko, and I'm excited to share my findings.
I see ADI, PENGU, and BANK are gaining traction.
I'm watching their market cap ranks, with Bittensor at #41 and Pi Network at #64, along with Aave at #56, and I think they're worth considering 🚀.
I've also noticed Cash Cat at #326, which could be a hidden gem.
I believe these tokens have potential, with some experiencing significant % changes.
I'm looking forward to seeing how they perform, and I'll be keeping a close eye on them 💡.
I think it's time to take a closer look at these tokens, and perhaps invest in them 📈.
$HEMI , $XNO , $HEMI
I see ADI, PENGU, and BANK are gaining traction.
I'm watching their market cap ranks, with Bittensor at #41 and Pi Network at #64, along with Aave at #56, and I think they're worth considering 🚀.
I've also noticed Cash Cat at #326, which could be a hidden gem.
I believe these tokens have potential, with some experiencing significant % changes.
I'm looking forward to seeing how they perform, and I'll be keeping a close eye on them 💡.
I think it's time to take a closer look at these tokens, and perhaps invest in them 📈.
$HEMI , $XNO , $HEMI
774
·
--
After a 40% surge, are the shorts actually still adding positions?
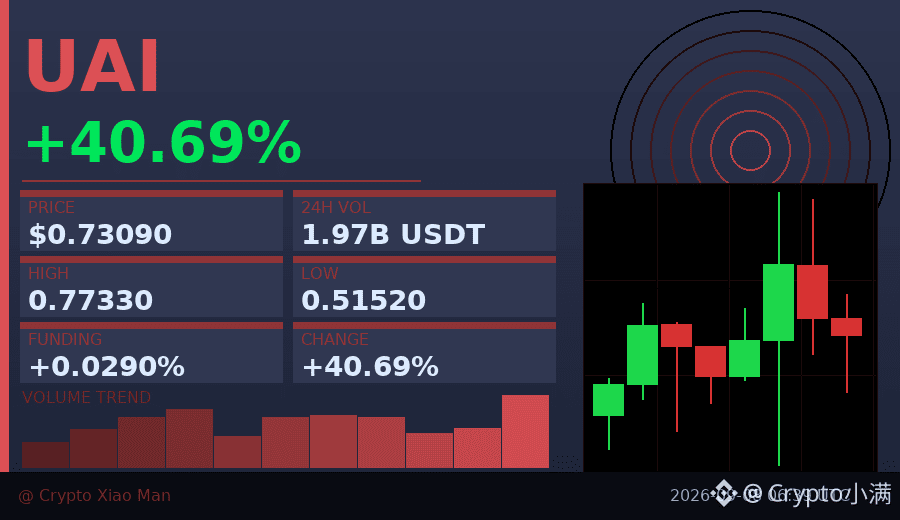
Today, UAI jumped 40.69%, reaching 0.77 before pulling back to around 0.73. Trading volume is close to $200 million, so the interest level isn’t low.
What’s interesting, though, is that the long/short ratio shows 56% of people are shorting, while only 44% are going long. Usually after a move like this, most people chase longs—but this time it’s the other way around.
More importantly, the hourly chart has closed bearish for three consecutive candles. This suggests that at higher levels, someone is distributing, and buyers are starting to hesitate.
This situation of “the price is rising a lot, but the shorts aren’t backing off” could mean either the shorts are stubborn, or they’ve spotted something. I’m inclined to wait and watch first, and wait for the direction to become clearer.
$UAI #多空分歧 #56% shorts
Click the small card below to quickly view the chart 👇
After a 40% surge, are the shorts actually still adding positions?
Today, UAI jumped 40.69%, reaching 0.77 before pulling back to around 0.73. Trading volume is close to $200 million, so the interest level isn’t low.
What’s interesting, though, is that the long/short ratio shows 56% of people are shorting, while only 44% are going long. Usually after a move like this, most people chase longs—but this time it’s the other way around.
More importantly, the hourly chart has closed bearish for three consecutive candles. This suggests that at higher levels, someone is distributing, and buyers are starting to hesitate.
This situation of “the price is rising a lot, but the shorts aren’t backing off” could mean either the shorts are stubborn, or they’ve spotted something. I’m inclined to wait and watch first, and wait for the direction to become clearer.
$UAI #多空分歧 #56% shorts
Click the small card below to quickly view the chart 👇
Today, UAI jumped 40.69%, reaching 0.77 before pulling back to around 0.73. Trading volume is close to $200 million, so the interest level isn’t low.
What’s interesting, though, is that the long/short ratio shows 56% of people are shorting, while only 44% are going long. Usually after a move like this, most people chase longs—but this time it’s the other way around.
More importantly, the hourly chart has closed bearish for three consecutive candles. This suggests that at higher levels, someone is distributing, and buyers are starting to hesitate.
This situation of “the price is rising a lot, but the shorts aren’t backing off” could mean either the shorts are stubborn, or they’ve spotted something. I’m inclined to wait and watch first, and wait for the direction to become clearer.
$UAI #多空分歧 #56% shorts
Click the small card below to quickly view the chart 👇
22
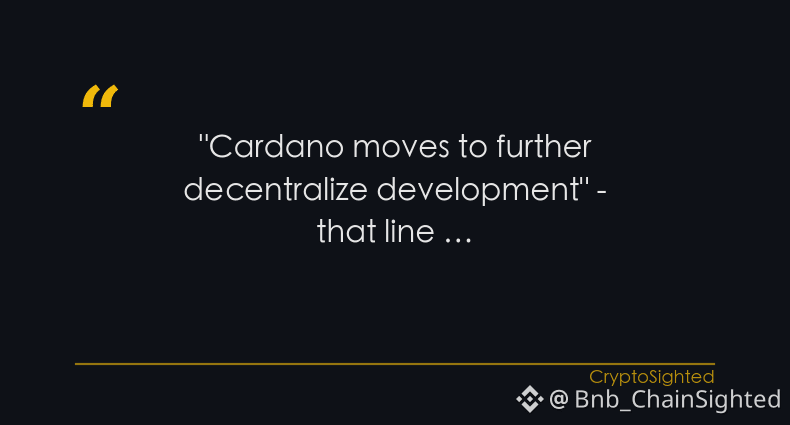
"Cardano moves to further decentralize development" - that line from Decrypt caught my eye. It’s not just about code anymore; it’s about control. And when a project like Cardano starts shifting power outward, it raises a question: where does that leave the rest of DeFi?
Now, Aerodrome ($AERO) is getting a new home on Binance - not just in trading, but in Earn, Convert, and even VIP Loan. That’s not a small move. It’s a sign that Binance sees AERO as more than just another token. It’s a gateway for DeFi projects to tap into a broader audience. And when Binance opens its doors to a new asset, it’s not just about liquidity. It’s about access. It’s about building a new kind of funding channel.
The question is: is AERO’s move a one-off, or could it be the start of a broader trend in DeFi tokenization?
defense or offense - one word.
—
For educational purposes only. Not financial advice.
📌 Crypto 101 · #56 · #CryptoEducation #CryptoSighted $AERO
"Cardano moves to further decentralize development" - that line from Decrypt caught my eye. It’s not just about code anymore; it’s about control. And when a project like Cardano starts shifting power outward, it raises a question: where does that leave the rest of DeFi?
Now, Aerodrome ($AERO ) is getting a new home on Binance - not just in trading, but in Earn, Convert, and even VIP Loan. That’s not a small move. It’s a sign that Binance sees AERO as more than just another token. It’s a gateway for DeFi projects to tap into a broader audience. And when Binance opens its doors to a new asset, it’s not just about liquidity. It’s about access. It’s about building a new kind of funding channel.
The question is: is AERO’s move a one-off, or could it be the start of a broader trend in DeFi tokenization?
defense or offense - one word.
—
For educational purposes only. Not financial advice.
📌 Crypto 101 · #56 · #CryptoEducation #CryptoSighted $AERO
Now, Aerodrome ($AERO ) is getting a new home on Binance - not just in trading, but in Earn, Convert, and even VIP Loan. That’s not a small move. It’s a sign that Binance sees AERO as more than just another token. It’s a gateway for DeFi projects to tap into a broader audience. And when Binance opens its doors to a new asset, it’s not just about liquidity. It’s about access. It’s about building a new kind of funding channel.
The question is: is AERO’s move a one-off, or could it be the start of a broader trend in DeFi tokenization?
defense or offense - one word.
—
For educational purposes only. Not financial advice.
📌 Crypto 101 · #56 · #CryptoEducation #CryptoSighted $AERO
418
·
--
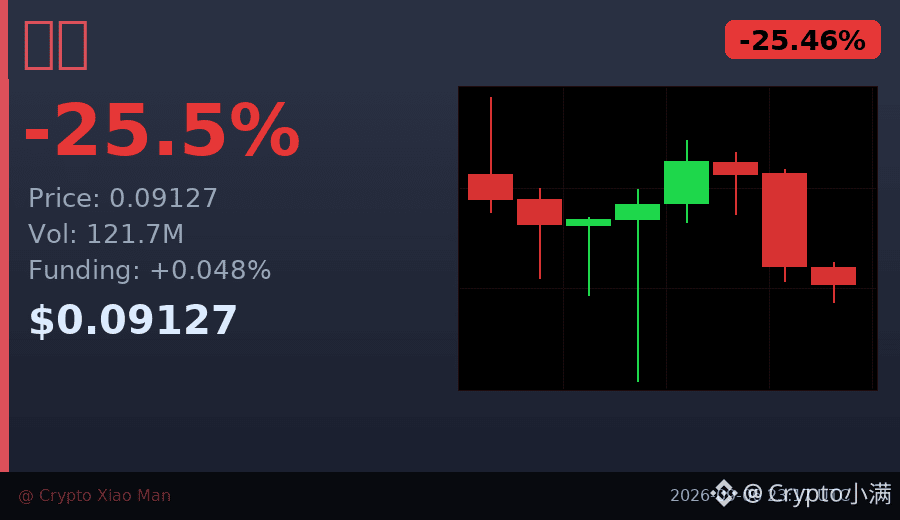
A 25% drop, but the funding rate is still in positive territory — what does that mean?
"Bull Run" was dumped from 0.125 straight down to 0.091 today, with trading volume hitting 121 million USDT, and the hourly chart has already closed three consecutive bearish candles.
Yet the funding rate is still +0.048%, and the long/short ratio is 56% to 44%, so longs haven’t fully surrendered.
This kind of divergence — "price down, funding rate not collapsing" — usually has two possible scenarios:
Either it’s flushing leverage, clearing out high-leverage long positions before a rebound;
or someone is using the positive funding rate to distribute gradually, like a frog being boiled slowly.
The key is whether it can reclaim 0.095 in the next 2-3 hours.
If it can’t hold, the previous low at 0.088 is very likely to be tested again.
$Bull Run #资金费率背离 #56% long/short ratio
Tap the small card below to quickly check the market 👇
A 25% drop, but the funding rate is still in positive territory — what does that mean?
"Bull Run" was dumped from 0.125 straight down to 0.091 today, with trading volume hitting 121 million USDT, and the hourly chart has already closed three consecutive bearish candles.
Yet the funding rate is still +0.048%, and the long/short ratio is 56% to 44%, so longs haven’t fully surrendered.
This kind of divergence — "price down, funding rate not collapsing" — usually has two possible scenarios:
Either it’s flushing leverage, clearing out high-leverage long positions before a rebound;
or someone is using the positive funding rate to distribute gradually, like a frog being boiled slowly.
The key is whether it can reclaim 0.095 in the next 2-3 hours.
If it can’t hold, the previous low at 0.088 is very likely to be tested again.
$Bull Run #资金费率背离 #56% long/short ratio
Tap the small card below to quickly check the market 👇
"Bull Run" was dumped from 0.125 straight down to 0.091 today, with trading volume hitting 121 million USDT, and the hourly chart has already closed three consecutive bearish candles.
Yet the funding rate is still +0.048%, and the long/short ratio is 56% to 44%, so longs haven’t fully surrendered.
This kind of divergence — "price down, funding rate not collapsing" — usually has two possible scenarios:
Either it’s flushing leverage, clearing out high-leverage long positions before a rebound;
or someone is using the positive funding rate to distribute gradually, like a frog being boiled slowly.
The key is whether it can reclaim 0.095 in the next 2-3 hours.
If it can’t hold, the previous low at 0.088 is very likely to be tested again.
$Bull Run #资金费率背离 #56% long/short ratio
Tap the small card below to quickly check the market 👇
55
Log in to explore more content
Join global crypto users on Binance Square
⚡️ Get latest and useful information about crypto.
💬 Trusted by the world’s largest crypto exchange.
👍 Discover real insights from verified creators.
Email / Phone number
Trending Topics
1
#MoreHikesExpectedIsBTCUnderPressure
5,290 views
95 Discussing
2
#NvidiaBeatsEstimatesWith$130BQ4Outlook
71,988 views
296 Discussing
3
#AnthropicIPOPriceCouldExceed$80
71,076 views
246 Discussing
4
#RussiaCentralBankAddsAlfaBankToCryptoExchangeRegister
5,053 views
54 Discussing
5
#VisaPlansStablecoinPrefundingForAPACCrossBorderPayments
5,138 views
40 Discussing
6
#CanadaAndUSLaunchOperationNiagaraAgainstApprovalPhishing
45,150 views
59 Discussing
7
#BankOfEnglandUnveilsClearingHousePathwayCoveringDLTFirms
4,698 views
66 Discussing
8
#DBSAndCirclePartnerToExpandAsianInstitutionsUSDCAccess
6,120 views
68 Discussing
9
#LedgerHardwareImplantReportsExtendToDubai
106,378 views
922 Discussing
10
#NvidiaBoardNotConsideringHuang’sReturnasCEO
283,376 views
1,689 Discussing