
#23
23
47,746 views
133 Discussing
Hot
Latest

·
--
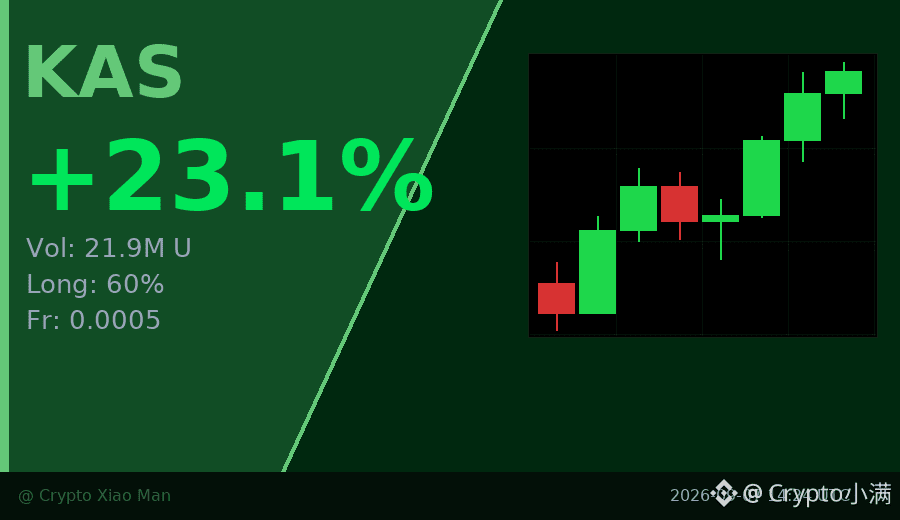
23% rise in percentage, trading volume surged to 21.90 million U, and this rally in KAS is kind of interesting.
More importantly, the funding rate is only 0.0005. The long side makes up 60%, but it’s not extremely crowded. Compared with coins whose funding rates jump above 0.01, KAS’s upward resistance is actually smaller.
The hourly chart has already seen three consecutive bullish candles—pushing steadily from around 0.03 up to 0.037. The buying momentum is very stable. This kind of volume-price alignment paired with a moderate funding rate is often more durable than a pull-up driven by overheated sentiment.
$KAS #KAS #23.09
Click the small card below to quickly check the market trend👇
23% rise in percentage, trading volume surged to 21.90 million U, and this rally in KAS is kind of interesting.
More importantly, the funding rate is only 0.0005. The long side makes up 60%, but it’s not extremely crowded. Compared with coins whose funding rates jump above 0.01, KAS’s upward resistance is actually smaller.
The hourly chart has already seen three consecutive bullish candles—pushing steadily from around 0.03 up to 0.037. The buying momentum is very stable. This kind of volume-price alignment paired with a moderate funding rate is often more durable than a pull-up driven by overheated sentiment.
$KAS #KAS #23.09
Click the small card below to quickly check the market trend👇
More importantly, the funding rate is only 0.0005. The long side makes up 60%, but it’s not extremely crowded. Compared with coins whose funding rates jump above 0.01, KAS’s upward resistance is actually smaller.
The hourly chart has already seen three consecutive bullish candles—pushing steadily from around 0.03 up to 0.037. The buying momentum is very stable. This kind of volume-price alignment paired with a moderate funding rate is often more durable than a pull-up driven by overheated sentiment.
$KAS #KAS #23.09
Click the small card below to quickly check the market trend👇
49

·
--
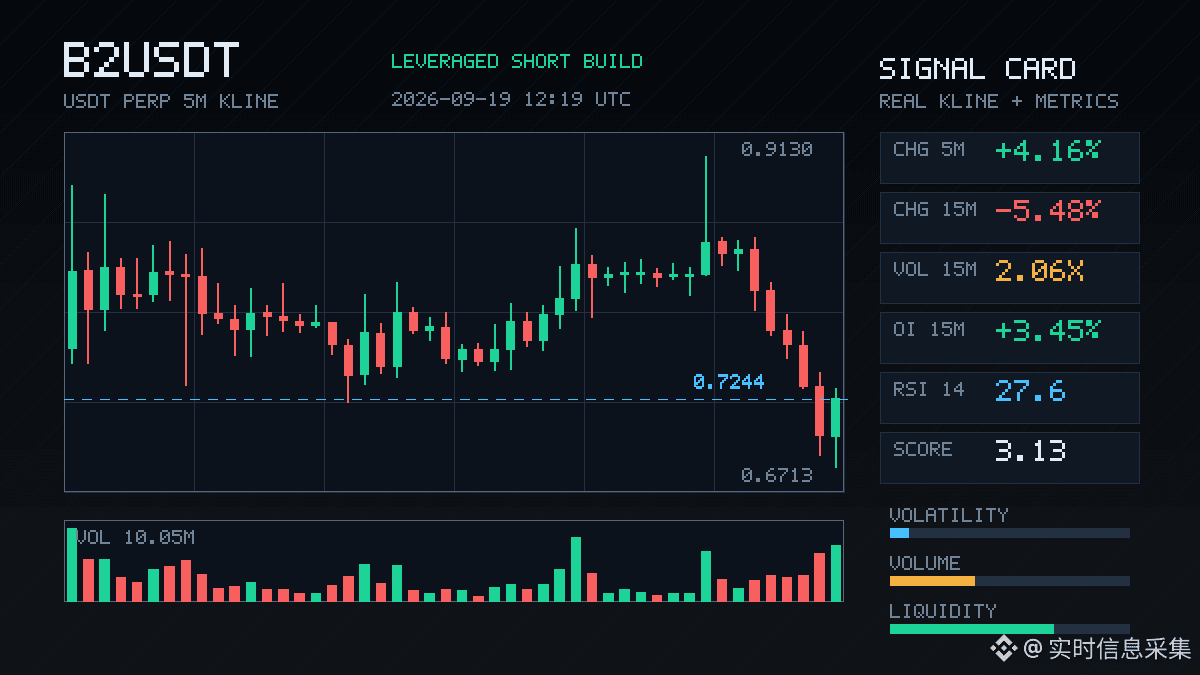
$B2 This sell-off has some substance. In the 15m chart, the price dropped directly by 5.48%, and volume surged to 2.06x—but it’s not just pure panic selling. OI on the 15m actually increased by 3.45%, a typical pattern of price down and positions up. New leveraged short orders are entering; it’s not just old longs getting pushed out.
What’s interesting is that the 1h OI is -1.02%, with a nominal change of -12.92%, suggesting that over this hour overall positions are being reduced. But in the most recent 15 minutes, suddenly someone added shorts. The abnormal percentile is 92.9%, ranking #23 across the whole pool, and it has persisted across several consecutive intervals—so this signal quality isn’t low.
Aggressive trades are down by -3.3%, buy/sell ratio is 0.94: sell pressure is dominant but not to an extreme level. The 24h trading volume is 109M—liquidity is deep enough; this isn’t some fake move from a small pool.
The current question is: are these new shorts jumping the gun, or are they catching the falling knife? If OI keeps rising while price keeps dropping, but the subsequent volume can’t keep up, then short covering would be the fuel for a rebound. If it continues to sell off with increasing volume and breaks lower, then the trend is confirmed. Watch the OI change on the next 15m candle—if the logic of adding shorts is still continuing, it won’t be a good time to step in.
$B2 This sell-off has some substance. In the 15m chart, the price dropped directly by 5.48%, and volume surged to 2.06x—but it’s not just pure panic selling. OI on the 15m actually increased by 3.45%, a typical pattern of price down and positions up. New leveraged short orders are entering; it’s not just old longs getting pushed out.
What’s interesting is that the 1h OI is -1.02%, with a nominal change of -12.92%, suggesting that over this hour overall positions are being reduced. But in the most recent 15 minutes, suddenly someone added shorts. The abnormal percentile is 92.9%, ranking #23 across the whole pool, and it has persisted across several consecutive intervals—so this signal quality isn’t low.
Aggressive trades are down by -3.3%, buy/sell ratio is 0.94: sell pressure is dominant but not to an extreme level. The 24h trading volume is 109M—liquidity is deep enough; this isn’t some fake move from a small pool.
The current question is: are these new shorts jumping the gun, or are they catching the falling knife? If OI keeps rising while price keeps dropping, but the subsequent volume can’t keep up, then short covering would be the fuel for a rebound. If it continues to sell off with increasing volume and breaks lower, then the trend is confirmed. Watch the OI change on the next 15m candle—if the logic of adding shorts is still continuing, it won’t be a good time to step in.
What’s interesting is that the 1h OI is -1.02%, with a nominal change of -12.92%, suggesting that over this hour overall positions are being reduced. But in the most recent 15 minutes, suddenly someone added shorts. The abnormal percentile is 92.9%, ranking #23 across the whole pool, and it has persisted across several consecutive intervals—so this signal quality isn’t low.
Aggressive trades are down by -3.3%, buy/sell ratio is 0.94: sell pressure is dominant but not to an extreme level. The 24h trading volume is 109M—liquidity is deep enough; this isn’t some fake move from a small pool.
The current question is: are these new shorts jumping the gun, or are they catching the falling knife? If OI keeps rising while price keeps dropping, but the subsequent volume can’t keep up, then short covering would be the fuel for a rebound. If it continues to sell off with increasing volume and breaks lower, then the trend is confirmed. Watch the OI change on the next 15m candle—if the logic of adding shorts is still continuing, it won’t be a good time to step in.
167

·
--
$G This move is a bit interesting.
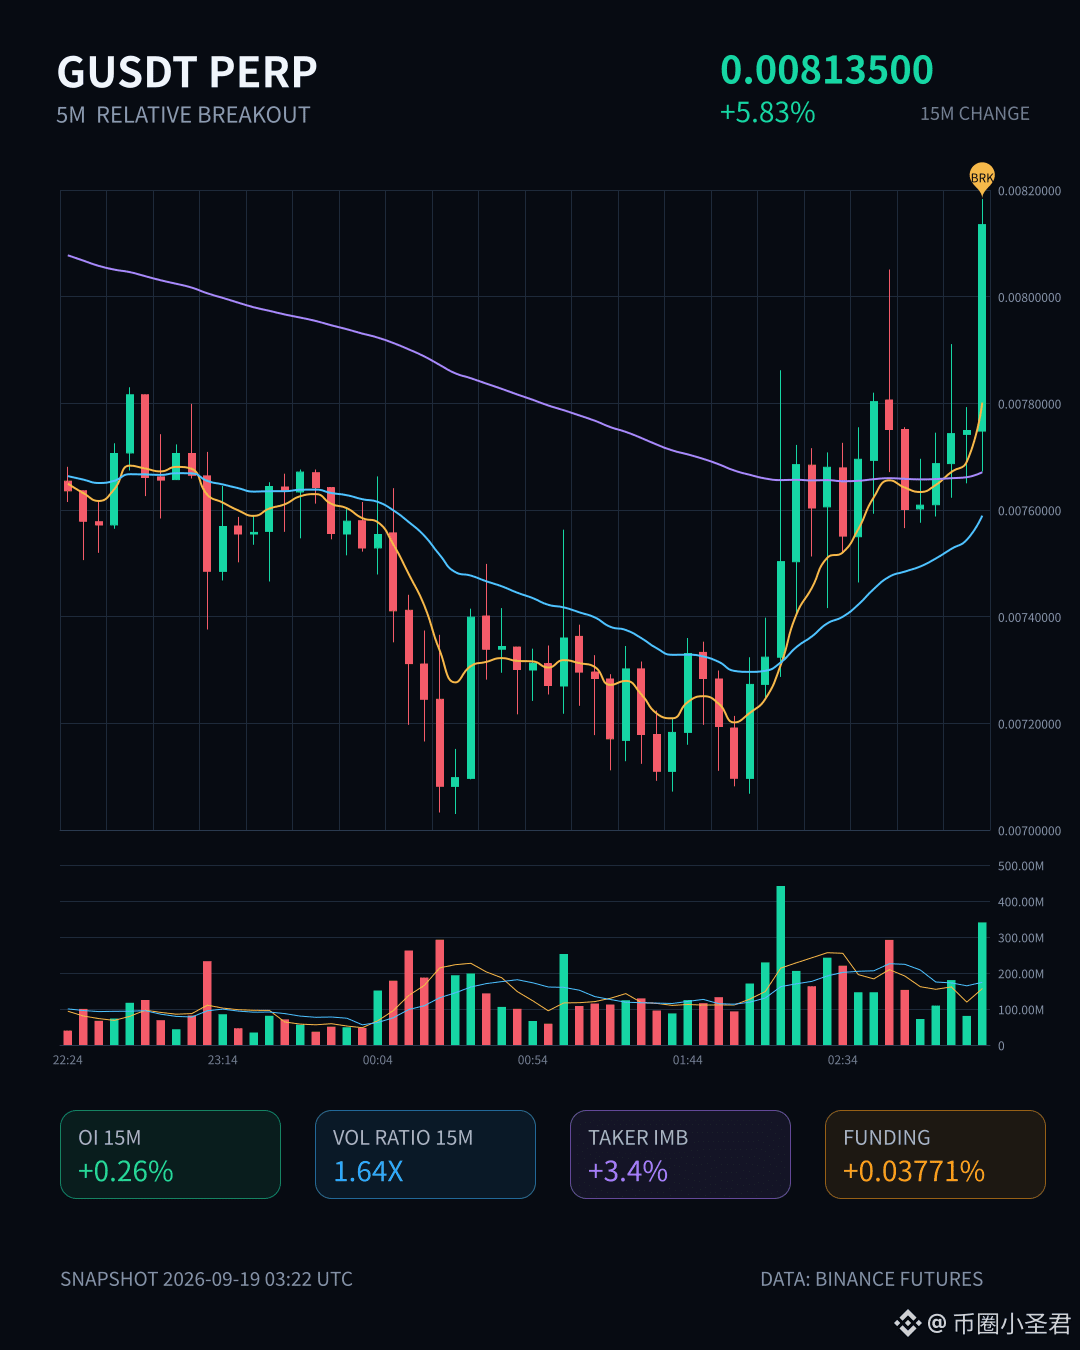
In 15m, it’s up 5.83%; volume is 1.64x. It directly broke through the upper edge of the recent ~20 consecutive 5m candles. The key is that OI is rising along with it—on 15m, OI +0.26%, nominal +936K; on the 1h timeframe, nominal also added 860K. Price is rising along with OI—this doesn’t look like a short-squeeze kind of fakeout; it looks more like someone is opening fresh longs.
Anomaly percentile is 88.5%, total pool #23, nominal change #14. Depth has been confirmed.
24h trading value is 707M, which isn’t small in the pool.
Active trade gap is 3.4%, buy/sell ratio is 1.07—bullish, but not overheated.
First, see whether it can hold above this range’s upper edge. If it’s a false breakout, OI will speak first.
$G This move is a bit interesting.
In 15m, it’s up 5.83%; volume is 1.64x. It directly broke through the upper edge of the recent ~20 consecutive 5m candles. The key is that OI is rising along with it—on 15m, OI +0.26%, nominal +936K; on the 1h timeframe, nominal also added 860K. Price is rising along with OI—this doesn’t look like a short-squeeze kind of fakeout; it looks more like someone is opening fresh longs.
Anomaly percentile is 88.5%, total pool #23, nominal change #14. Depth has been confirmed.
24h trading value is 707M, which isn’t small in the pool.
Active trade gap is 3.4%, buy/sell ratio is 1.07—bullish, but not overheated.
First, see whether it can hold above this range’s upper edge. If it’s a false breakout, OI will speak first.
In 15m, it’s up 5.83%; volume is 1.64x. It directly broke through the upper edge of the recent ~20 consecutive 5m candles. The key is that OI is rising along with it—on 15m, OI +0.26%, nominal +936K; on the 1h timeframe, nominal also added 860K. Price is rising along with OI—this doesn’t look like a short-squeeze kind of fakeout; it looks more like someone is opening fresh longs.
Anomaly percentile is 88.5%, total pool #23, nominal change #14. Depth has been confirmed.
24h trading value is 707M, which isn’t small in the pool.
Active trade gap is 3.4%, buy/sell ratio is 1.07—bullish, but not overheated.
First, see whether it can hold above this range’s upper edge. If it’s a false breakout, OI will speak first.
25

·
--
“%20+ Daily Gains – What’s the Secret Behind NEAR’s Fast Jump from 3.7$ to 4.5$?”NEAR Protocol (NEARUSDT) is trending right now!
Rank: #23
Seeing a %20+ increase within a single day makes most traders wonder, “Is it a pump or a dump?” Here’s the surprising reality: NEAR ( ) has the potential to jump from 3.726 USDT to 4.5 USDT in just 24 hours, and it’s already filling the liquidity pool with a $336 M volume. I don’t just view this move as a simple “momentum spike”; it signals a new integration of Layer‑2 scaling solutions. **Daily Data Breakdown** - **NEARUSDT**: +20.349% rise, last price 3.726 USDT, 336.6 M USDT volume. Opened at 3.096 USDT, high 3.835 USDT, low 3.063 USDT. - **SOLUSDT**: +11.789% increase, 113.22 USDT, 511.8 M USDT volume. A strong uptrend from 101.28 USDT to 113.22 USDT. - **UNIUSDT**: +15.414% increase, 8.873 USDT, 206.7 M USDT volume. A rise in liquidity, alongside the testnet launch of Uniswap V4. - **ADAUSDT** and **ATOMUSDT** also show gains of 12.4% and 11.3% respectively, proving they’ve regained interest in “alt‑layer” ecosystems. **My Alpha Call** - **NEAR**: A 4.5 USDT target (≈+21% higher) is reasonable within 48 hours. “Ape in” on open positions, and keep the stop‑loss at 3.45 USDT. - **SOL**: Break above 118 USDT, then aim for 125 USDT. The DCA (Dollar‑Cost‑Average) strategy works well during low‑volatility periods. - **UNI**: A “pump” is expected from the 9.5 USDT level, but to reduce the risk of a “dump,” set up a “sell‑the‑news” plan at 8.3 USDT. **Contrary View** Many analysts think this NEAR rally is a “one-time
“%20+ Daily Gains – What’s the Secret Behind NEAR’s Fast Jump from 3.7$ to 4.5$?”
NEAR Protocol (NEARUSDT) is trending right now!
Rank: #23
Seeing a %20+ increase within a single day makes most traders wonder, “Is it a pump or a dump?” Here’s the surprising reality: NEAR ( ) has the potential to jump from 3.726 USDT to 4.5 USDT in just 24 hours, and it’s already filling the liquidity pool with a $336 M volume. I don’t just view this move as a simple “momentum spike”; it signals a new integration of Layer‑2 scaling solutions. **Daily Data Breakdown** - **NEARUSDT**: +20.349% rise, last price 3.726 USDT, 336.6 M USDT volume. Opened at 3.096 USDT, high 3.835 USDT, low 3.063 USDT. - **SOLUSDT**: +11.789% increase, 113.22 USDT, 511.8 M USDT volume. A strong uptrend from 101.28 USDT to 113.22 USDT. - **UNIUSDT**: +15.414% increase, 8.873 USDT, 206.7 M USDT volume. A rise in liquidity, alongside the testnet launch of Uniswap V4. - **ADAUSDT** and **ATOMUSDT** also show gains of 12.4% and 11.3% respectively, proving they’ve regained interest in “alt‑layer” ecosystems. **My Alpha Call** - **NEAR**: A 4.5 USDT target (≈+21% higher) is reasonable within 48 hours. “Ape in” on open positions, and keep the stop‑loss at 3.45 USDT. - **SOL**: Break above 118 USDT, then aim for 125 USDT. The DCA (Dollar‑Cost‑Average) strategy works well during low‑volatility periods. - **UNI**: A “pump” is expected from the 9.5 USDT level, but to reduce the risk of a “dump,” set up a “sell‑the‑news” plan at 8.3 USDT. **Contrary View** Many analysts think this NEAR rally is a “one-time
Rank: #23
Seeing a %20+ increase within a single day makes most traders wonder, “Is it a pump or a dump?” Here’s the surprising reality: NEAR ( ) has the potential to jump from 3.726 USDT to 4.5 USDT in just 24 hours, and it’s already filling the liquidity pool with a $336 M volume. I don’t just view this move as a simple “momentum spike”; it signals a new integration of Layer‑2 scaling solutions. **Daily Data Breakdown** - **NEARUSDT**: +20.349% rise, last price 3.726 USDT, 336.6 M USDT volume. Opened at 3.096 USDT, high 3.835 USDT, low 3.063 USDT. - **SOLUSDT**: +11.789% increase, 113.22 USDT, 511.8 M USDT volume. A strong uptrend from 101.28 USDT to 113.22 USDT. - **UNIUSDT**: +15.414% increase, 8.873 USDT, 206.7 M USDT volume. A rise in liquidity, alongside the testnet launch of Uniswap V4. - **ADAUSDT** and **ATOMUSDT** also show gains of 12.4% and 11.3% respectively, proving they’ve regained interest in “alt‑layer” ecosystems. **My Alpha Call** - **NEAR**: A 4.5 USDT target (≈+21% higher) is reasonable within 48 hours. “Ape in” on open positions, and keep the stop‑loss at 3.45 USDT. - **SOL**: Break above 118 USDT, then aim for 125 USDT. The DCA (Dollar‑Cost‑Average) strategy works well during low‑volatility periods. - **UNI**: A “pump” is expected from the 9.5 USDT level, but to reduce the risk of a “dump,” set up a “sell‑the‑news” plan at 8.3 USDT. **Contrary View** Many analysts think this NEAR rally is a “one-time
65

Article
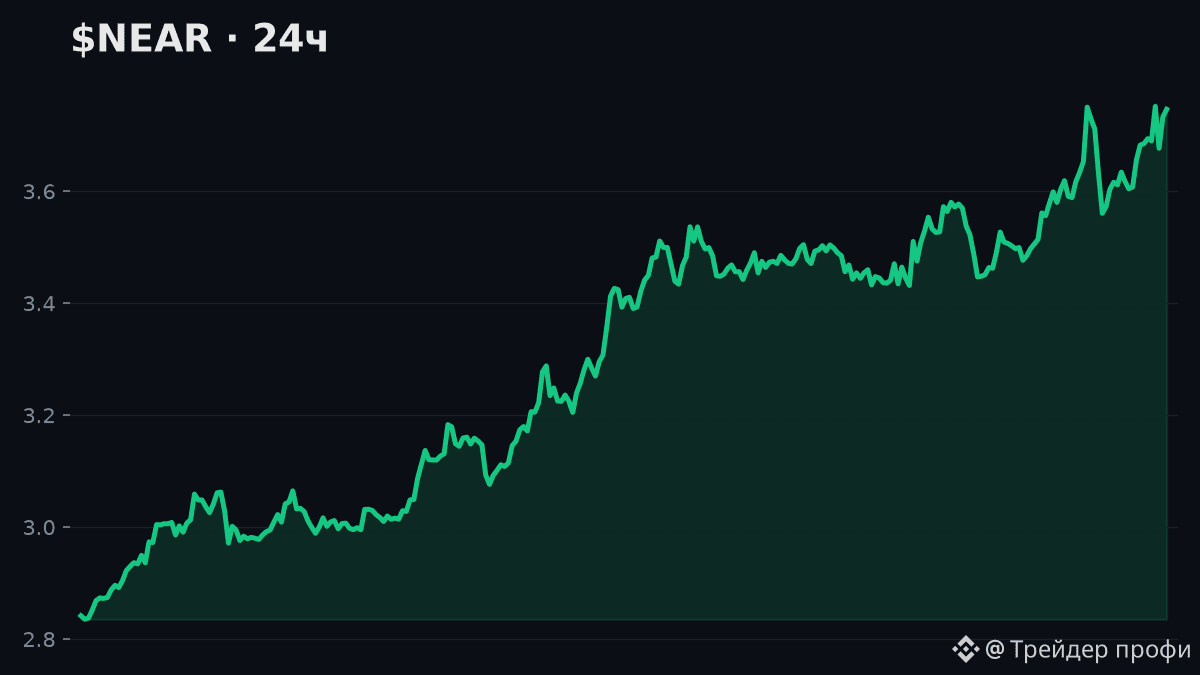
$NEAR +31.5% in 24h — turned into a rocket — the strongest in the top-100!🚀 $NEAR +31.5% in 24h — turned into a rocket — the strongest in the top-100!
The market today doesn’t spare the boring. 👀
🧭 Summary: movement is in line with the broader trend — 7D and 30D in the same direction; confirmed by high trading volume.
🌍 Market context: out of 73 major coins with notable movement over the past 24h — 🔼 69 went up, 🔽 4 fell
$NEAR +31.5% in 24h — turned into a rocket — the strongest in the top-100!
🚀 $NEAR +31.5% in 24h — turned into a rocket — the strongest in the top-100!
The market today doesn’t spare the boring. 👀
🧭 Summary: movement is in line with the broader trend — 7D and 30D in the same direction; confirmed by high trading volume.
🌍 Market context: out of 73 major coins with notable movement over the past 24h — 🔼 69 went up, 🔽 4 fell
The market today doesn’t spare the boring. 👀
🧭 Summary: movement is in line with the broader trend — 7D and 30D in the same direction; confirmed by high trading volume.
🌍 Market context: out of 73 major coins with notable movement over the past 24h — 🔼 69 went up, 🔽 4 fell
163
·
--
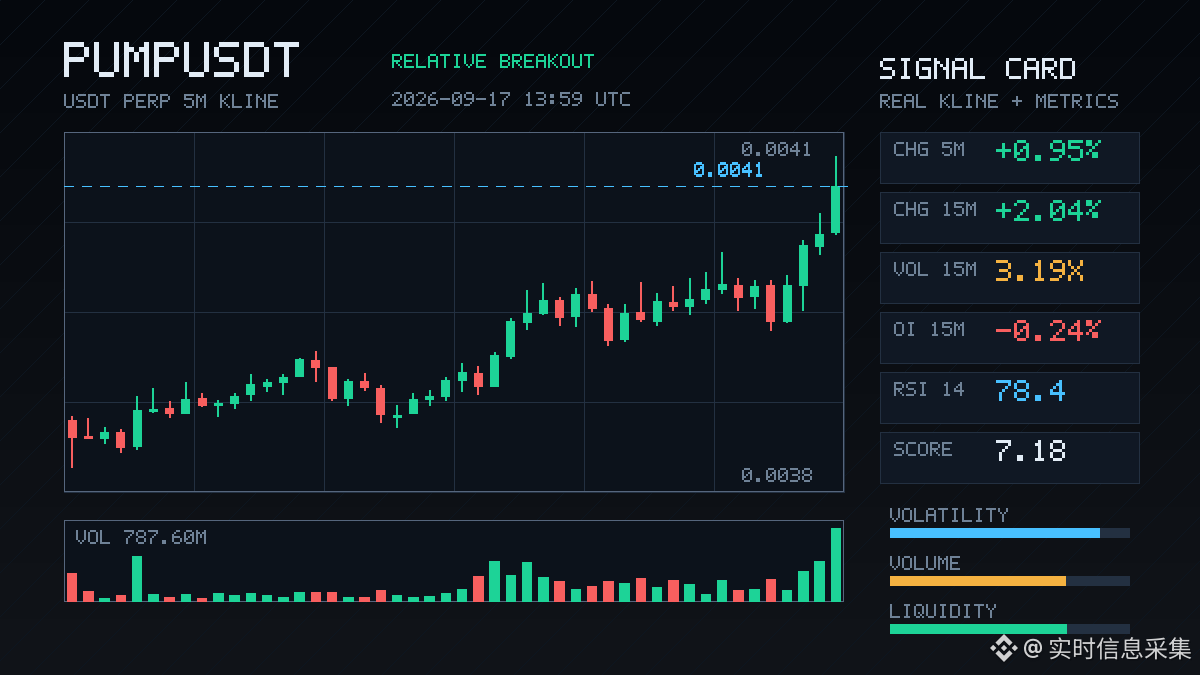
$PUMP This spot is kind of interesting.
In 15m, it pulled up 2%. Volume directly reached 3.19×, the volatility Z hit 3.49, and the closing price broke above the upper band of the last ~20 5m candles. Active trade imbalance is +19.2%, with buy/sell ratio at 1.48—clearly, funds are pushing upward.
But OI is falling—15m -0.24%, 1h -0.59%, while the notional is still increasing. Price is rising while OI is declining, which smells more like short covering than a fresh bullish surge. Funding rates are in the high percentile recently; OI is at an extreme percentile of 96.8%, Pool #23, notional change #10. The trend has been continuing across several consecutive cycles.
24h trading volume is 158 million, and the depth is sufficient. What matters now is whether this short-covering move can open up room to the upside—or whether it hits an extreme zone and then fizzles out.
High level, high funding, OI divergence—I’m inclined to watch first and not rush to chase.
$PUMP This spot is kind of interesting.
In 15m, it pulled up 2%. Volume directly reached 3.19×, the volatility Z hit 3.49, and the closing price broke above the upper band of the last ~20 5m candles. Active trade imbalance is +19.2%, with buy/sell ratio at 1.48—clearly, funds are pushing upward.
But OI is falling—15m -0.24%, 1h -0.59%, while the notional is still increasing. Price is rising while OI is declining, which smells more like short covering than a fresh bullish surge. Funding rates are in the high percentile recently; OI is at an extreme percentile of 96.8%, Pool #23, notional change #10. The trend has been continuing across several consecutive cycles.
24h trading volume is 158 million, and the depth is sufficient. What matters now is whether this short-covering move can open up room to the upside—or whether it hits an extreme zone and then fizzles out.
High level, high funding, OI divergence—I’m inclined to watch first and not rush to chase.
In 15m, it pulled up 2%. Volume directly reached 3.19×, the volatility Z hit 3.49, and the closing price broke above the upper band of the last ~20 5m candles. Active trade imbalance is +19.2%, with buy/sell ratio at 1.48—clearly, funds are pushing upward.
But OI is falling—15m -0.24%, 1h -0.59%, while the notional is still increasing. Price is rising while OI is declining, which smells more like short covering than a fresh bullish surge. Funding rates are in the high percentile recently; OI is at an extreme percentile of 96.8%, Pool #23, notional change #10. The trend has been continuing across several consecutive cycles.
24h trading volume is 158 million, and the depth is sufficient. What matters now is whether this short-covering move can open up room to the upside—or whether it hits an extreme zone and then fizzles out.
High level, high funding, OI divergence—I’m inclined to watch first and not rush to chase.
3

·
--
XRP hasn’t dropped all that much on this 15m move—only 0.87%, but volume surged to 2.43x, with a Z-score of 2.48. This kind of volume-accompanied sell-off, paired with an order-flow imbalance of Active Trades difference -12.5% and the buy/sell ratio at 0.78, clearly favors the sellers.
More importantly, look at OI: the 15m contract is -0.08%, with a notional change of -3.79M. The 1h contract is +0.01%, but its notional change is -5.86M, down 1.5%. With price falling while OI also falls, this is typical of leveraged longs being liquidated—either stop-outs or active de-risking/position shrinking, not fresh shorts coming in to smash the market.
The close price has already broken below the lower edge of the recent 5m K-zone for nearly 20 candles. OI’s abnormal percentile is 98.4%; within the whole pool, the abnormality ranks #23, with notional change at #5. In such an extreme percentile, this relative breakdown is worth watching: will it continue deleveraging, or will it stabilize? 24h trading volume is 1.32B U—liquidity is sufficient—but the active direction remains bearish. Don’t rush to catch it.
XRP hasn’t dropped all that much on this 15m move—only 0.87%, but volume surged to 2.43x, with a Z-score of 2.48. This kind of volume-accompanied sell-off, paired with an order-flow imbalance of Active Trades difference -12.5% and the buy/sell ratio at 0.78, clearly favors the sellers.
More importantly, look at OI: the 15m contract is -0.08%, with a notional change of -3.79M. The 1h contract is +0.01%, but its notional change is -5.86M, down 1.5%. With price falling while OI also falls, this is typical of leveraged longs being liquidated—either stop-outs or active de-risking/position shrinking, not fresh shorts coming in to smash the market.
The close price has already broken below the lower edge of the recent 5m K-zone for nearly 20 candles. OI’s abnormal percentile is 98.4%; within the whole pool, the abnormality ranks #23, with notional change at #5. In such an extreme percentile, this relative breakdown is worth watching: will it continue deleveraging, or will it stabilize? 24h trading volume is 1.32B U—liquidity is sufficient—but the active direction remains bearish. Don’t rush to catch it.
More importantly, look at OI: the 15m contract is -0.08%, with a notional change of -3.79M. The 1h contract is +0.01%, but its notional change is -5.86M, down 1.5%. With price falling while OI also falls, this is typical of leveraged longs being liquidated—either stop-outs or active de-risking/position shrinking, not fresh shorts coming in to smash the market.
The close price has already broken below the lower edge of the recent 5m K-zone for nearly 20 candles. OI’s abnormal percentile is 98.4%; within the whole pool, the abnormality ranks #23, with notional change at #5. In such an extreme percentile, this relative breakdown is worth watching: will it continue deleveraging, or will it stabilize? 24h trading volume is 1.32B U—liquidity is sufficient—but the active direction remains bearish. Don’t rush to catch it.
1
·
--
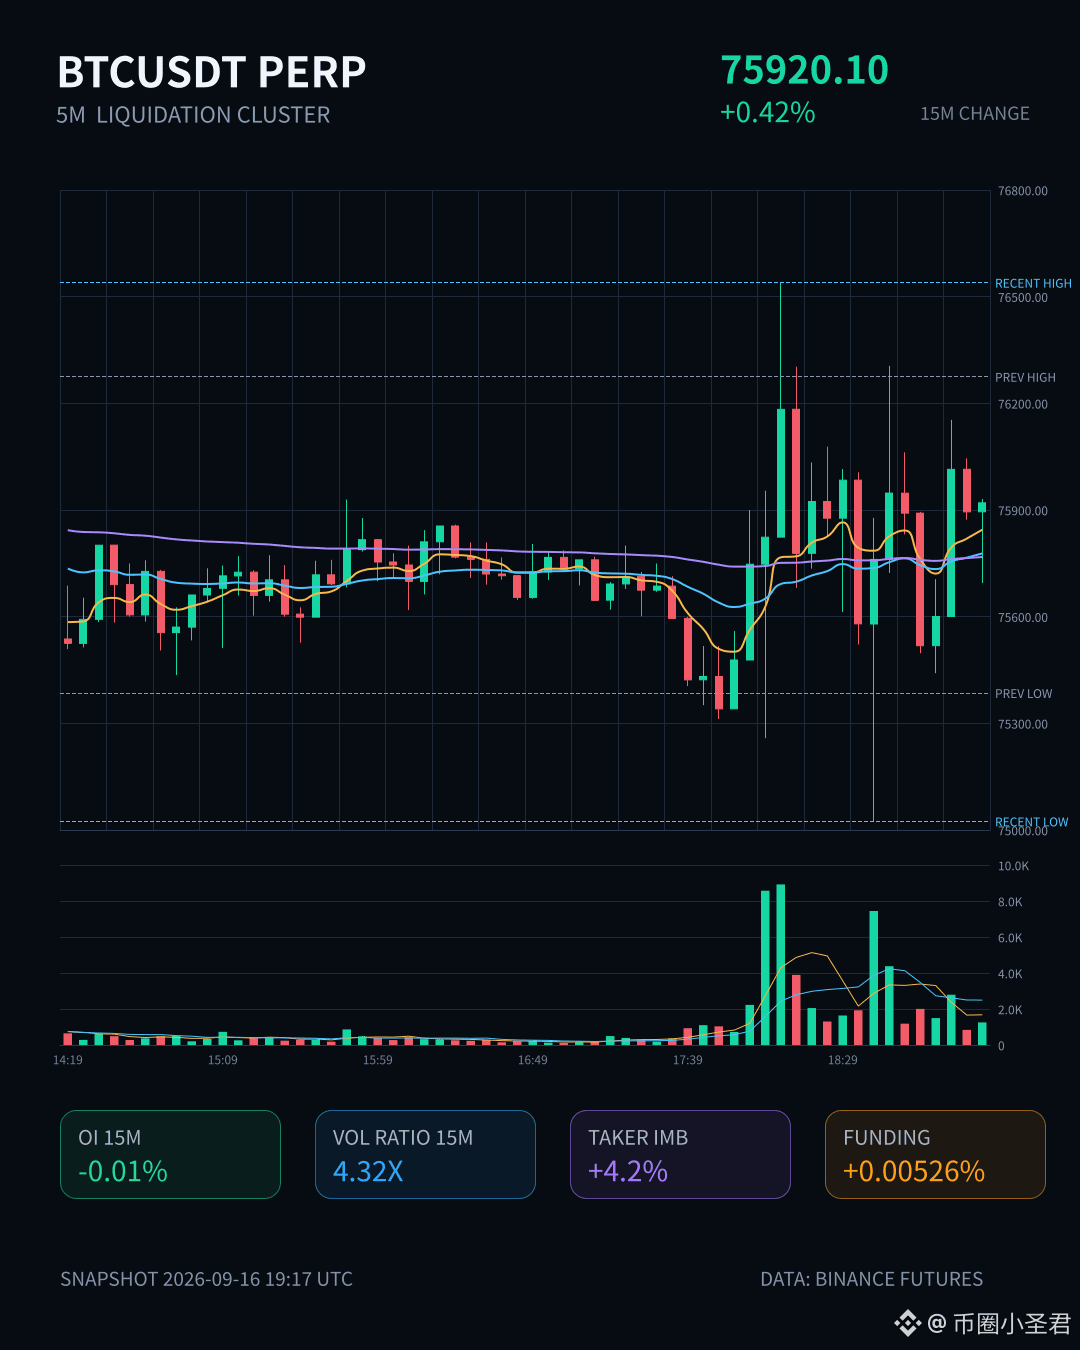
3:30 a.m. — this wave doesn’t taste right.
The price is up 0.42%, volume surged to 4.32x, yet OI actually dips slightly at the 15m level. Still, the notional change jumped to the #1 in the whole pool. In plain terms: the price is rising, but the open interest hasn’t caught up. This isn’t fresh long-side money entering—this looks like shorts getting lifted off.
On Binance at the 5m level, forced-liquidation agents are at 450K, clearly concentrated on the buy side—too obvious a sign of short covering. Active fills are 4.2% lower, the buy/sell ratio is 1.09. Simply put: someone is catching orders up top, but they’re not catching aggressively.
At the 1h level, OI is still positive at +0.93%, and there’s a 90M increase sitting there, so don’t rush to shout "multi-kill mode is over" or "it’s going to waterfall." This is more like a round of position covering, not the starting point of a trend reversal.
The real signal isn’t in the percentage move—it’s in the structure. Price up + OI down. I’ve seen this combo way too many times: either the shorts get beaten into taking a break, or it’s just handover/rotation before the next leg. Anomaly quantile at 88.3%, pool #23, continuation across multiple consecutive cycles—on the data side, it’s definitely a legit anomaly.
My stance: don’t chase, just watch. Once the liquidation pressure cluster has fully released, the direction will show itself for real. $BTC
3:30 a.m. — this wave doesn’t taste right.
The price is up 0.42%, volume surged to 4.32x, yet OI actually dips slightly at the 15m level. Still, the notional change jumped to the #1 in the whole pool. In plain terms: the price is rising, but the open interest hasn’t caught up. This isn’t fresh long-side money entering—this looks like shorts getting lifted off.
On Binance at the 5m level, forced-liquidation agents are at 450K, clearly concentrated on the buy side—too obvious a sign of short covering. Active fills are 4.2% lower, the buy/sell ratio is 1.09. Simply put: someone is catching orders up top, but they’re not catching aggressively.
At the 1h level, OI is still positive at +0.93%, and there’s a 90M increase sitting there, so don’t rush to shout "multi-kill mode is over" or "it’s going to waterfall." This is more like a round of position covering, not the starting point of a trend reversal.
The real signal isn’t in the percentage move—it’s in the structure. Price up + OI down. I’ve seen this combo way too many times: either the shorts get beaten into taking a break, or it’s just handover/rotation before the next leg. Anomaly quantile at 88.3%, pool #23, continuation across multiple consecutive cycles—on the data side, it’s definitely a legit anomaly.
My stance: don’t chase, just watch. Once the liquidation pressure cluster has fully released, the direction will show itself for real. $BTC
The price is up 0.42%, volume surged to 4.32x, yet OI actually dips slightly at the 15m level. Still, the notional change jumped to the #1 in the whole pool. In plain terms: the price is rising, but the open interest hasn’t caught up. This isn’t fresh long-side money entering—this looks like shorts getting lifted off.
On Binance at the 5m level, forced-liquidation agents are at 450K, clearly concentrated on the buy side—too obvious a sign of short covering. Active fills are 4.2% lower, the buy/sell ratio is 1.09. Simply put: someone is catching orders up top, but they’re not catching aggressively.
At the 1h level, OI is still positive at +0.93%, and there’s a 90M increase sitting there, so don’t rush to shout "multi-kill mode is over" or "it’s going to waterfall." This is more like a round of position covering, not the starting point of a trend reversal.
The real signal isn’t in the percentage move—it’s in the structure. Price up + OI down. I’ve seen this combo way too many times: either the shorts get beaten into taking a break, or it’s just handover/rotation before the next leg. Anomaly quantile at 88.3%, pool #23, continuation across multiple consecutive cycles—on the data side, it’s definitely a legit anomaly.
My stance: don’t chase, just watch. Once the liquidation pressure cluster has fully released, the direction will show itself for real. $BTC
225
·
--
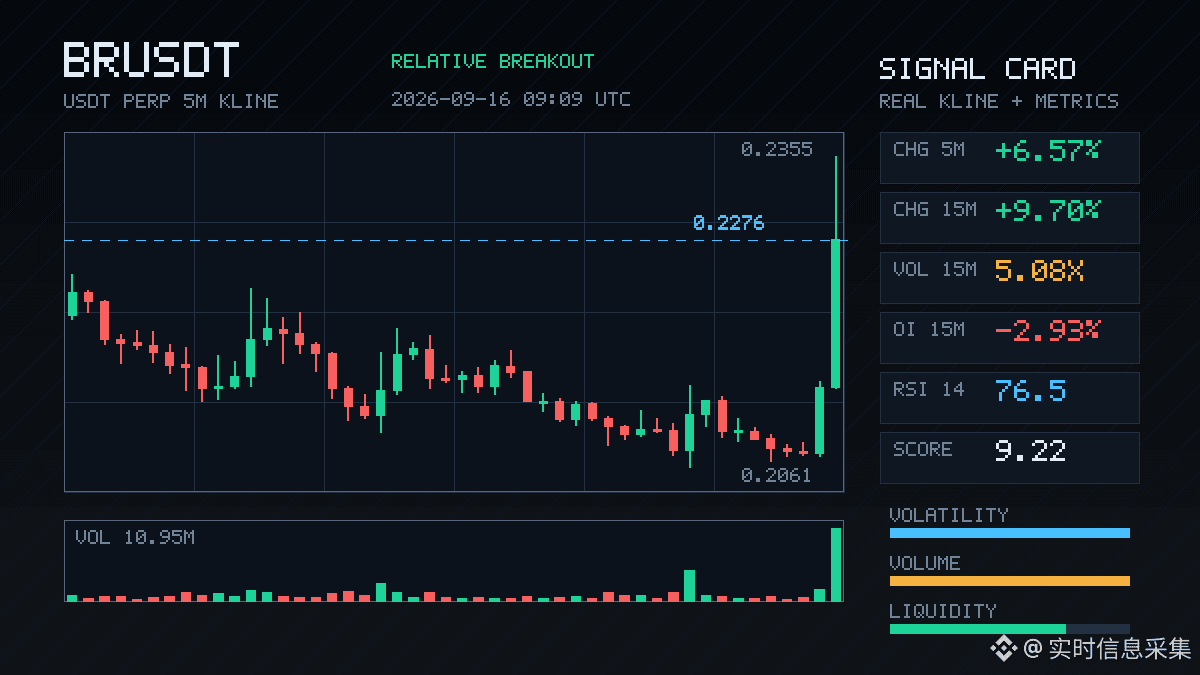
$BR This rally is a bit intense—on the 15m timeframe it straight-up surged +9.7%. The volume expanded to more than 5 times, the Z-value is 7.48, and it’s no longer ordinary volatility. Price broke above the upper band of nearly 20 consecutive 5m candles, with buy orders showing relative strength. The buy/sell ratio is 1.35—it looks like there’s capital actively pushing.
But there’s an interesting detail: with the price rising like this, OI is actually declining. The 15m contract is -2.93%, 1h is -1.07%, and nominal changes are still increasing. This structure looks more like shorts getting squeezed and positions being unwound, pushing price higher, rather than fresh longs aggressively opening new positions. Short-covering squeezes often come fast and go fast too—if you chase the move, keep your eyes open.
Abnormal ranking in the whole pool is #23, nominal change is #12. In the past 24h, turnover is 155M, and both momentum and liquidity are online. At this point, the key is whether the pullback can hold the upper edge of the breakout zone you just saw. If it holds, there may be a second wave; if it doesn’t, then it’s likely just a one-off short squeeze.
$BR This rally is a bit intense—on the 15m timeframe it straight-up surged +9.7%. The volume expanded to more than 5 times, the Z-value is 7.48, and it’s no longer ordinary volatility. Price broke above the upper band of nearly 20 consecutive 5m candles, with buy orders showing relative strength. The buy/sell ratio is 1.35—it looks like there’s capital actively pushing.
But there’s an interesting detail: with the price rising like this, OI is actually declining. The 15m contract is -2.93%, 1h is -1.07%, and nominal changes are still increasing. This structure looks more like shorts getting squeezed and positions being unwound, pushing price higher, rather than fresh longs aggressively opening new positions. Short-covering squeezes often come fast and go fast too—if you chase the move, keep your eyes open.
Abnormal ranking in the whole pool is #23, nominal change is #12. In the past 24h, turnover is 155M, and both momentum and liquidity are online. At this point, the key is whether the pullback can hold the upper edge of the breakout zone you just saw. If it holds, there may be a second wave; if it doesn’t, then it’s likely just a one-off short squeeze.
But there’s an interesting detail: with the price rising like this, OI is actually declining. The 15m contract is -2.93%, 1h is -1.07%, and nominal changes are still increasing. This structure looks more like shorts getting squeezed and positions being unwound, pushing price higher, rather than fresh longs aggressively opening new positions. Short-covering squeezes often come fast and go fast too—if you chase the move, keep your eyes open.
Abnormal ranking in the whole pool is #23, nominal change is #12. In the past 24h, turnover is 155M, and both momentum and liquidity are online. At this point, the key is whether the pullback can hold the upper edge of the breakout zone you just saw. If it holds, there may be a second wave; if it doesn’t, then it’s likely just a one-off short squeeze.
4
·
--
ASTER This 15m move is kind of interesting. The price fell 0.72%, and volume surged to 3.28x. The aggressive trade gap is -24.7%, the buy-sell ratio is 0.60, and the close even broke below the lower edge of the past 20-plus 5m candles.
But OI didn’t drop along with it—1h notional change is only -341K, basically flat. Price moves down and leverage doesn’t retreat, which feels more like new shorts entering to push rather than longs capitulating with that kind of liquidation.
The pool’s notional change ranks #23, with an abnormal percentile of 67.9%. Not extreme, but the direction is pretty clear. 24h turnover is 50.92M, and the market is still holding up.
With this kind of structure, I usually don’t rush to take a side. First, I’ll see whether the breakdown of the lower band can accelerate—if shorts add size but still can’t knock it down, then that’s when you really need to be careful.
ASTER This 15m move is kind of interesting. The price fell 0.72%, and volume surged to 3.28x. The aggressive trade gap is -24.7%, the buy-sell ratio is 0.60, and the close even broke below the lower edge of the past 20-plus 5m candles.
But OI didn’t drop along with it—1h notional change is only -341K, basically flat. Price moves down and leverage doesn’t retreat, which feels more like new shorts entering to push rather than longs capitulating with that kind of liquidation.
The pool’s notional change ranks #23, with an abnormal percentile of 67.9%. Not extreme, but the direction is pretty clear. 24h turnover is 50.92M, and the market is still holding up.
With this kind of structure, I usually don’t rush to take a side. First, I’ll see whether the breakdown of the lower band can accelerate—if shorts add size but still can’t knock it down, then that’s when you really need to be careful.
But OI didn’t drop along with it—1h notional change is only -341K, basically flat. Price moves down and leverage doesn’t retreat, which feels more like new shorts entering to push rather than longs capitulating with that kind of liquidation.
The pool’s notional change ranks #23, with an abnormal percentile of 67.9%. Not extreme, but the direction is pretty clear. 24h turnover is 50.92M, and the market is still holding up.
With this kind of structure, I usually don’t rush to take a side. First, I’ll see whether the breakdown of the lower band can accelerate—if shorts add size but still can’t knock it down, then that’s when you really need to be careful.
14

·
--
$REZ This is a bit interesting.
In 15m, it only pulled less than 2 points, but the OI has been piling upward for several consecutive cycles. The 1h contract is +3.72%, and the notional increase is also over 270k U. Price is rising while open interest rises in sync—this looks like a typical leveraged long building positions, not just a simple short-covering pulse.
Volume expanded to 3x. The aggressive buy/sell ratio is 1.78, and the difference in aggressive trades is 28%, clearly leaning bullish. The abnormal percentile is 92.7%; in the whole pool it ranks #13 by order book, and the notional change ranks #23. It’s not the very top batch, but the strength comes from continuity and strong confirmation with depth.
In the last 24h, turnover is a little over 42M. The market’s not big; if OI continues making these consecutive moves, short-term volatility can easily be amplified. When longs add leverage, price often moves quite smoothly—but the issue is that once incremental buying stalls, reflexivity can hit just as fast.
First, watch whether OI keeps stacking. We’ll talk after it stops piling.
$REZ This is a bit interesting.
In 15m, it only pulled less than 2 points, but the OI has been piling upward for several consecutive cycles. The 1h contract is +3.72%, and the notional increase is also over 270k U. Price is rising while open interest rises in sync—this looks like a typical leveraged long building positions, not just a simple short-covering pulse.
Volume expanded to 3x. The aggressive buy/sell ratio is 1.78, and the difference in aggressive trades is 28%, clearly leaning bullish. The abnormal percentile is 92.7%; in the whole pool it ranks #13 by order book, and the notional change ranks #23. It’s not the very top batch, but the strength comes from continuity and strong confirmation with depth.
In the last 24h, turnover is a little over 42M. The market’s not big; if OI continues making these consecutive moves, short-term volatility can easily be amplified. When longs add leverage, price often moves quite smoothly—but the issue is that once incremental buying stalls, reflexivity can hit just as fast.
First, watch whether OI keeps stacking. We’ll talk after it stops piling.
In 15m, it only pulled less than 2 points, but the OI has been piling upward for several consecutive cycles. The 1h contract is +3.72%, and the notional increase is also over 270k U. Price is rising while open interest rises in sync—this looks like a typical leveraged long building positions, not just a simple short-covering pulse.
Volume expanded to 3x. The aggressive buy/sell ratio is 1.78, and the difference in aggressive trades is 28%, clearly leaning bullish. The abnormal percentile is 92.7%; in the whole pool it ranks #13 by order book, and the notional change ranks #23. It’s not the very top batch, but the strength comes from continuity and strong confirmation with depth.
In the last 24h, turnover is a little over 42M. The market’s not big; if OI continues making these consecutive moves, short-term volatility can easily be amplified. When longs add leverage, price often moves quite smoothly—but the issue is that once incremental buying stalls, reflexivity can hit just as fast.
First, watch whether OI keeps stacking. We’ll talk after it stops piling.
4
·
--
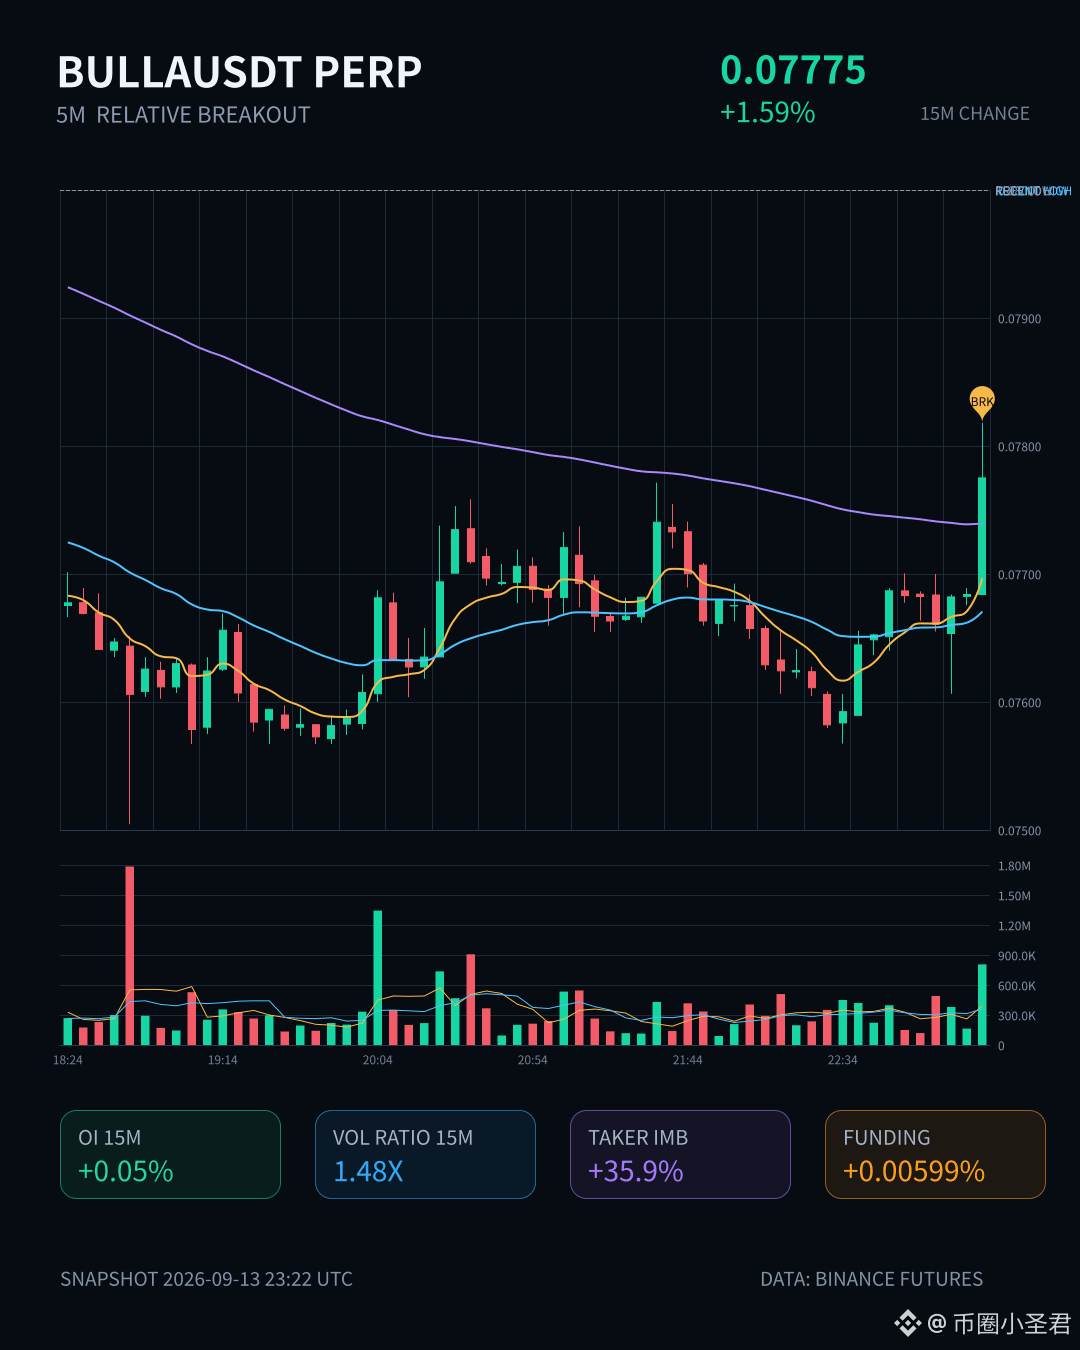
$BULLA This 15m move is kind of interesting. A 1.59% gain isn’t violent, but paired with the OI hourly +0.23% and notional +2.2%—it feels more like fresh leverage is slowly entering the market rather than old longs adding and just spinning.
The active trades are off by 35.9%, the buy-sell ratio is 2.12. The 5m closing price stands above the top of the recent range over nearly 20 intervals. If you chase the breakout from here, your stop-loss room is actually pretty clear, but don’t chase into the 15m candle’s upper wick with 1.48x volume.
Abnormal in the whole pool: #23, change in notional: #19. BULLA isn’t really the star today, but depth confirmation + net active buying are solid; the short-term structure is fine.
$BULLA This 15m move is kind of interesting. A 1.59% gain isn’t violent, but paired with the OI hourly +0.23% and notional +2.2%—it feels more like fresh leverage is slowly entering the market rather than old longs adding and just spinning.
The active trades are off by 35.9%, the buy-sell ratio is 2.12. The 5m closing price stands above the top of the recent range over nearly 20 intervals. If you chase the breakout from here, your stop-loss room is actually pretty clear, but don’t chase into the 15m candle’s upper wick with 1.48x volume.
Abnormal in the whole pool: #23, change in notional: #19. BULLA isn’t really the star today, but depth confirmation + net active buying are solid; the short-term structure is fine.
The active trades are off by 35.9%, the buy-sell ratio is 2.12. The 5m closing price stands above the top of the recent range over nearly 20 intervals. If you chase the breakout from here, your stop-loss room is actually pretty clear, but don’t chase into the 15m candle’s upper wick with 1.48x volume.
Abnormal in the whole pool: #23, change in notional: #19. BULLA isn’t really the star today, but depth confirmation + net active buying are solid; the short-term structure is fine.
113

·
--
$WLD at dawn this move is a bit interesting.
On the 15m timeframe, it dropped 0.76%. Volume expanded straight to 1.99x. The close fell below the lower bound of the last 20+ 5m candles. Active taker volume imbalance is -42.9%, and the buy/sell ratio is 0.40—meaning the selling pressure is real and not just a wick.
But OI is rising: 15m +0.13%, 1h +0.05%. The percentile is abnormal at 78.4%, and the overall pool ranks #23 by abnormality. Price is down while OI is up, yet the notional change is negative (-270K / -650K). This isn’t just a simple liquidation of long positions—more like new leveraged shorts moving in and “buying tickets.”
In the last 24h, turnover is 79M. This abnormality level in the pool is relatively high.
My view: the break below the lower end of the range is a fact, but shorts shouldn’t celebrate too early—OI is rising while notional shrinks, suggesting this leg of the short is more of a light-position probe. If it’s going to continue, we need to see whether there’s incremental volume coming in to keep pushing it higher; if volume fades back, then this drop may just be a one-off shakeout during a period of thinner liquidity.
For now, leave it alone—don’t chase. This kind of structure at dawn often gives you a second answer in the morning.
$WLD at dawn this move is a bit interesting.
On the 15m timeframe, it dropped 0.76%. Volume expanded straight to 1.99x. The close fell below the lower bound of the last 20+ 5m candles. Active taker volume imbalance is -42.9%, and the buy/sell ratio is 0.40—meaning the selling pressure is real and not just a wick.
But OI is rising: 15m +0.13%, 1h +0.05%. The percentile is abnormal at 78.4%, and the overall pool ranks #23 by abnormality. Price is down while OI is up, yet the notional change is negative (-270K / -650K). This isn’t just a simple liquidation of long positions—more like new leveraged shorts moving in and “buying tickets.”
In the last 24h, turnover is 79M. This abnormality level in the pool is relatively high.
My view: the break below the lower end of the range is a fact, but shorts shouldn’t celebrate too early—OI is rising while notional shrinks, suggesting this leg of the short is more of a light-position probe. If it’s going to continue, we need to see whether there’s incremental volume coming in to keep pushing it higher; if volume fades back, then this drop may just be a one-off shakeout during a period of thinner liquidity.
For now, leave it alone—don’t chase. This kind of structure at dawn often gives you a second answer in the morning.
On the 15m timeframe, it dropped 0.76%. Volume expanded straight to 1.99x. The close fell below the lower bound of the last 20+ 5m candles. Active taker volume imbalance is -42.9%, and the buy/sell ratio is 0.40—meaning the selling pressure is real and not just a wick.
But OI is rising: 15m +0.13%, 1h +0.05%. The percentile is abnormal at 78.4%, and the overall pool ranks #23 by abnormality. Price is down while OI is up, yet the notional change is negative (-270K / -650K). This isn’t just a simple liquidation of long positions—more like new leveraged shorts moving in and “buying tickets.”
In the last 24h, turnover is 79M. This abnormality level in the pool is relatively high.
My view: the break below the lower end of the range is a fact, but shorts shouldn’t celebrate too early—OI is rising while notional shrinks, suggesting this leg of the short is more of a light-position probe. If it’s going to continue, we need to see whether there’s incremental volume coming in to keep pushing it higher; if volume fades back, then this drop may just be a one-off shakeout during a period of thinner liquidity.
For now, leave it alone—don’t chase. This kind of structure at dawn often gives you a second answer in the morning.
5
·
--
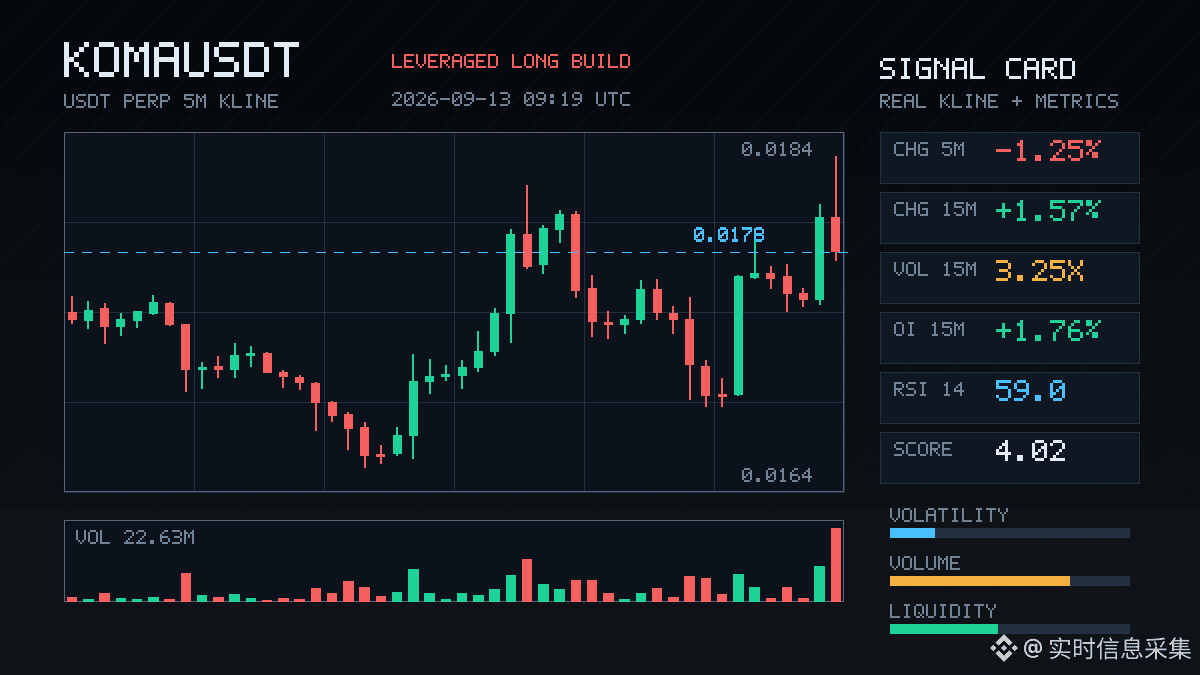
KOMA, this move is a bit interesting.
On the 15m timeframe it surged 1.57%, and volume directly jumped to 3.25x. OI: 15m +1.76%, 1h +0.81%. Notional change was 223K. Price is rising and positions are rising with it—this is the typical leveraged long getting in, not some kind of short covering fake pump.
The OI abnormal percentile is 92.3%—it ranks #12 across the whole pool. The notional change ranks #23, and it isn’t just a single spike; it’s been continuing across several consecutive periods. Trading volume is also higher than usual. The buy/sell ratio of active orders is 1.07, a 3.6% difference—buys are slightly dominant.
24h trading value is 21.77M. The market cap isn’t large, so even this incremental increase can pry open volatility. With OI crowding at the 92nd percentile, longs are piled in pretty heavily—what happens next is either they keep pushing, or this becomes fuel for a squeeze bubble-pop.
Keep an eye on it first—don’t rush to chase the breakout.
KOMA, this move is a bit interesting.
On the 15m timeframe it surged 1.57%, and volume directly jumped to 3.25x. OI: 15m +1.76%, 1h +0.81%. Notional change was 223K. Price is rising and positions are rising with it—this is the typical leveraged long getting in, not some kind of short covering fake pump.
The OI abnormal percentile is 92.3%—it ranks #12 across the whole pool. The notional change ranks #23, and it isn’t just a single spike; it’s been continuing across several consecutive periods. Trading volume is also higher than usual. The buy/sell ratio of active orders is 1.07, a 3.6% difference—buys are slightly dominant.
24h trading value is 21.77M. The market cap isn’t large, so even this incremental increase can pry open volatility. With OI crowding at the 92nd percentile, longs are piled in pretty heavily—what happens next is either they keep pushing, or this becomes fuel for a squeeze bubble-pop.
Keep an eye on it first—don’t rush to chase the breakout.
On the 15m timeframe it surged 1.57%, and volume directly jumped to 3.25x. OI: 15m +1.76%, 1h +0.81%. Notional change was 223K. Price is rising and positions are rising with it—this is the typical leveraged long getting in, not some kind of short covering fake pump.
The OI abnormal percentile is 92.3%—it ranks #12 across the whole pool. The notional change ranks #23, and it isn’t just a single spike; it’s been continuing across several consecutive periods. Trading volume is also higher than usual. The buy/sell ratio of active orders is 1.07, a 3.6% difference—buys are slightly dominant.
24h trading value is 21.77M. The market cap isn’t large, so even this incremental increase can pry open volatility. With OI crowding at the 92nd percentile, longs are piled in pretty heavily—what happens next is either they keep pushing, or this becomes fuel for a squeeze bubble-pop.
Keep an eye on it first—don’t rush to chase the breakout.
11

Article
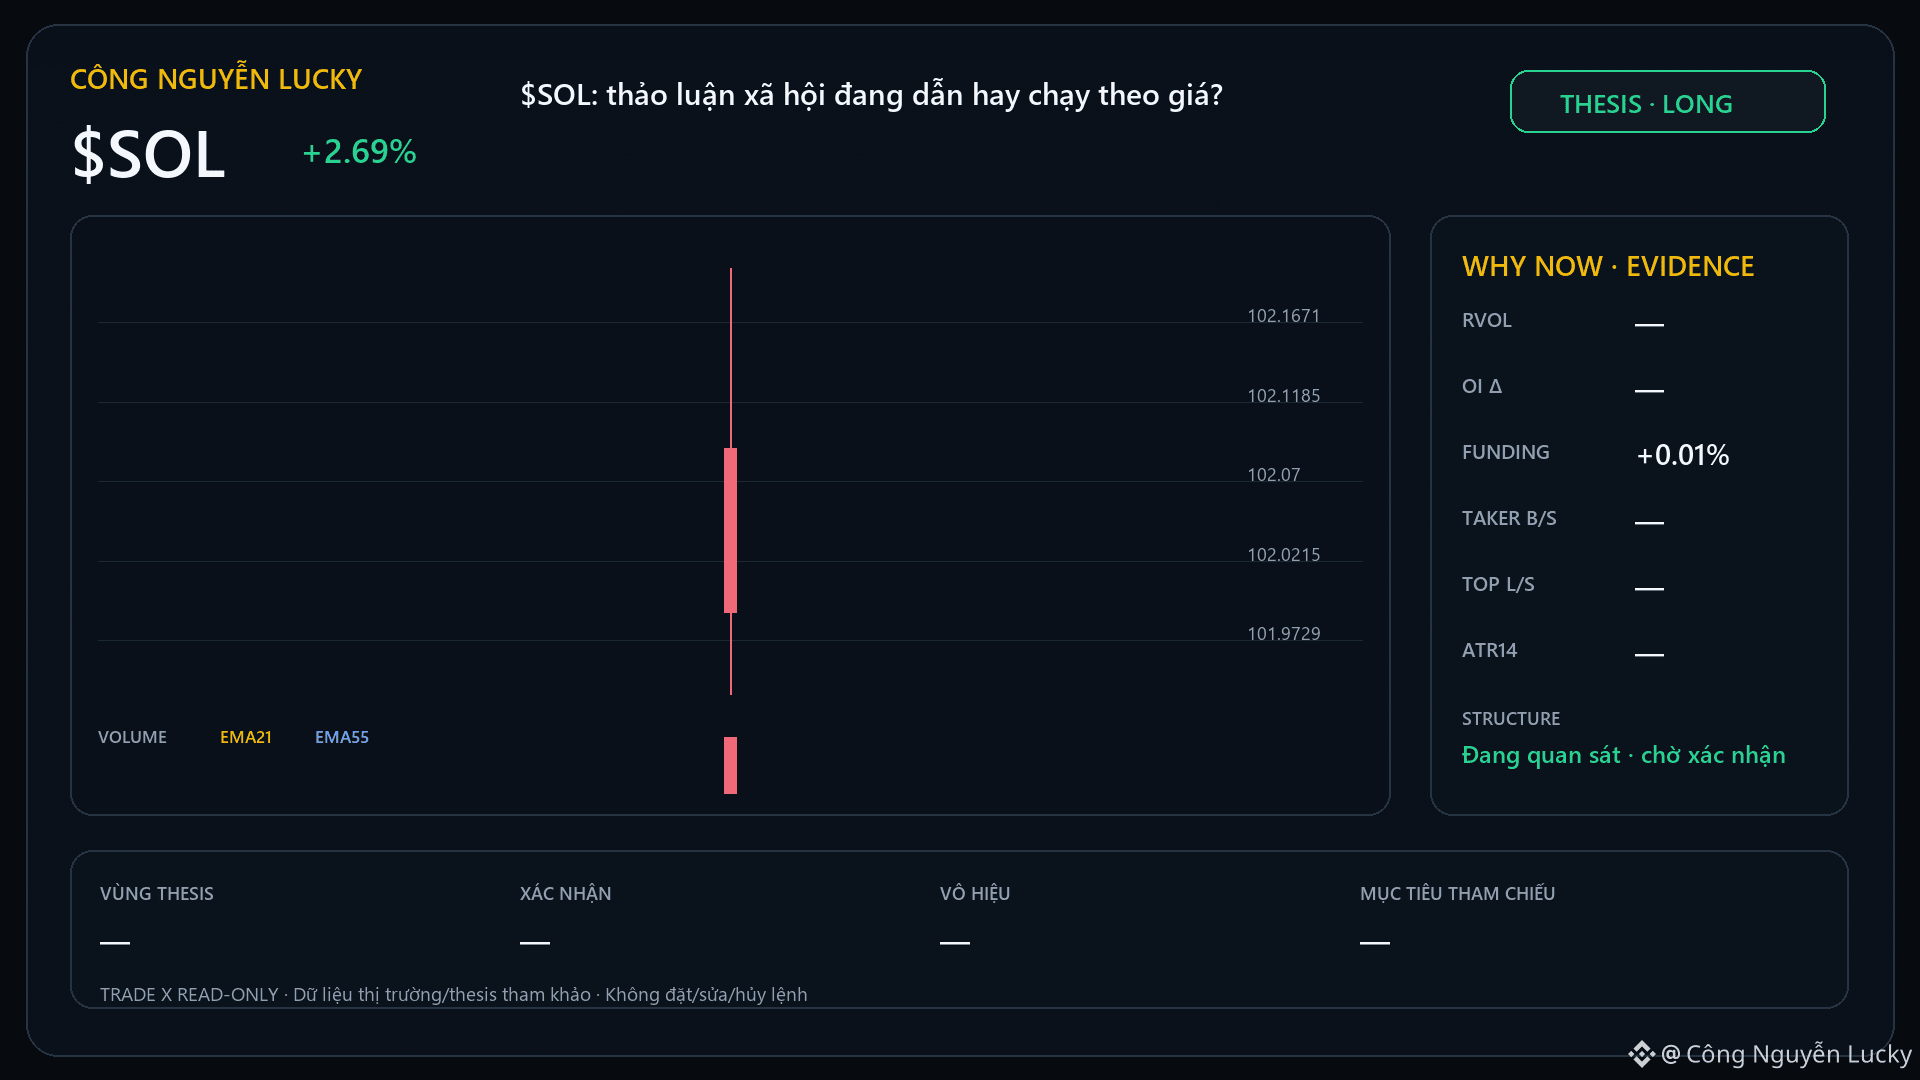
$SOL: is social discussion leading or chasing the price?🗣️ $SOL is seeing unusually high levels of social discussion on Binance Web3. Current sentiment: Positive.
Market: 102.02 · 24h +2.69% · volume ~2,268.4M USDT · 2,496,775 transactions.
Social backdrop: Bullish Shift in the Solana Ecosystem, Record SPL Token Issuance, Solana ETF Net Inflows.
Social attention can drive price, but it can also be latecomers joining the crowd.
Confirmation: A break above 105.77 with expanded open interest will make the continuation scenario more credible.
$SOL: is social discussion leading or chasing the price?
🗣️ $SOL is seeing unusually high levels of social discussion on Binance Web3. Current sentiment: Positive.
Market: 102.02 · 24h +2.69% · volume ~2,268.4M USDT · 2,496,775 transactions.
Social backdrop: Bullish Shift in the Solana Ecosystem, Record SPL Token Issuance, Solana ETF Net Inflows.
Social attention can drive price, but it can also be latecomers joining the crowd.
Confirmation: A break above 105.77 with expanded open interest will make the continuation scenario more credible.
Market: 102.02 · 24h +2.69% · volume ~2,268.4M USDT · 2,496,775 transactions.
Social backdrop: Bullish Shift in the Solana Ecosystem, Record SPL Token Issuance, Solana ETF Net Inflows.
Social attention can drive price, but it can also be latecomers joining the crowd.
Confirmation: A break above 105.77 with expanded open interest will make the continuation scenario more credible.
15
·
--
$LSK This drop is a bit brutal—within 15 minutes, it slid by 4 percentage points.
I checked the position size: over 15 minutes it fell by 2.81%, and over 1 hour it dropped 5.09%. This doesn’t look like fresh short positions entering—it’s more like longs cutting losses. Price is down while OI is also down—classic long deleveraging script, with stop-loss orders coming in wave after wave.
The abnormal OI percentile has already reached 96%. In the whole pool, ranking is down to #23, and several consecutive cycles have been continuing this condition. The funding rate was previously staying high, and now the long side can’t hold on anymore.
Trading volume is 1.67x the normal level, with a volatility Z-score of 2.65—there’s definitely a panic vibe on the board. The buy/sell ratio is 0.99, which is still relatively balanced, and taker-side execution is only -0.4%, so it doesn’t feel like one-way crushing. However, buy support below is clearly insufficient.
Over the last 24 hours, total turnover is 75 million U, while nominal OI change is only -360k U. The volume behind the sell-off isn’t huge, but the deleveraging is happening faster than the price. With this kind of structure, don’t rush to bottom-fish—wait until OI stabilizes before acting.
$LSK This drop is a bit brutal—within 15 minutes, it slid by 4 percentage points.
I checked the position size: over 15 minutes it fell by 2.81%, and over 1 hour it dropped 5.09%. This doesn’t look like fresh short positions entering—it’s more like longs cutting losses. Price is down while OI is also down—classic long deleveraging script, with stop-loss orders coming in wave after wave.
The abnormal OI percentile has already reached 96%. In the whole pool, ranking is down to #23, and several consecutive cycles have been continuing this condition. The funding rate was previously staying high, and now the long side can’t hold on anymore.
Trading volume is 1.67x the normal level, with a volatility Z-score of 2.65—there’s definitely a panic vibe on the board. The buy/sell ratio is 0.99, which is still relatively balanced, and taker-side execution is only -0.4%, so it doesn’t feel like one-way crushing. However, buy support below is clearly insufficient.
Over the last 24 hours, total turnover is 75 million U, while nominal OI change is only -360k U. The volume behind the sell-off isn’t huge, but the deleveraging is happening faster than the price. With this kind of structure, don’t rush to bottom-fish—wait until OI stabilizes before acting.
I checked the position size: over 15 minutes it fell by 2.81%, and over 1 hour it dropped 5.09%. This doesn’t look like fresh short positions entering—it’s more like longs cutting losses. Price is down while OI is also down—classic long deleveraging script, with stop-loss orders coming in wave after wave.
The abnormal OI percentile has already reached 96%. In the whole pool, ranking is down to #23, and several consecutive cycles have been continuing this condition. The funding rate was previously staying high, and now the long side can’t hold on anymore.
Trading volume is 1.67x the normal level, with a volatility Z-score of 2.65—there’s definitely a panic vibe on the board. The buy/sell ratio is 0.99, which is still relatively balanced, and taker-side execution is only -0.4%, so it doesn’t feel like one-way crushing. However, buy support below is clearly insufficient.
Over the last 24 hours, total turnover is 75 million U, while nominal OI change is only -360k U. The volume behind the sell-off isn’t huge, but the deleveraging is happening faster than the price. With this kind of structure, don’t rush to bottom-fish—wait until OI stabilizes before acting.
41
·
--
This round of the drop in $MON wasn’t especially brutal, but the structure is quite interesting — price is down 1%, yet OI has also contracted. Notional on the 15m timeframe fell by 277K, and the 1h cumulative drop reached 532K. It’s a classic case of leveraged longs being pushed out. It’s not full-on capitulation yet, but at least someone is unable to hold and is cutting positions.
Trading volume surged to 3.24x normal levels, with a Z-score of 2.25. The share of aggressive selling pressure reached -9.7%, and the buy/sell ratio was 0.82, indicating sellers were more urgent. Also, the 15m close has already broken below the lower bound of nearly 20 recent 5m candles, which means this level has effectively broken the recent support.
What I’m paying more attention to is that the OI anomaly percentile is 95.8%, ranking in the top 8 of the whole pool, and it has persisted across several cycles rather than being just noise from a single volume spike. The notional change ranks #23 in the pool, so capital is genuinely pulling out.
Either this is a shakeout, or it’s making room for the next move. I’m not in a rush to buy here. I’ll wait for OI to stabilize and then see whether the longs have fully flushed out or if this has only just begun.
This round of the drop in $MON wasn’t especially brutal, but the structure is quite interesting — price is down 1%, yet OI has also contracted. Notional on the 15m timeframe fell by 277K, and the 1h cumulative drop reached 532K. It’s a classic case of leveraged longs being pushed out. It’s not full-on capitulation yet, but at least someone is unable to hold and is cutting positions.
Trading volume surged to 3.24x normal levels, with a Z-score of 2.25. The share of aggressive selling pressure reached -9.7%, and the buy/sell ratio was 0.82, indicating sellers were more urgent. Also, the 15m close has already broken below the lower bound of nearly 20 recent 5m candles, which means this level has effectively broken the recent support.
What I’m paying more attention to is that the OI anomaly percentile is 95.8%, ranking in the top 8 of the whole pool, and it has persisted across several cycles rather than being just noise from a single volume spike. The notional change ranks #23 in the pool, so capital is genuinely pulling out.
Either this is a shakeout, or it’s making room for the next move. I’m not in a rush to buy here. I’ll wait for OI to stabilize and then see whether the longs have fully flushed out or if this has only just begun.
Trading volume surged to 3.24x normal levels, with a Z-score of 2.25. The share of aggressive selling pressure reached -9.7%, and the buy/sell ratio was 0.82, indicating sellers were more urgent. Also, the 15m close has already broken below the lower bound of nearly 20 recent 5m candles, which means this level has effectively broken the recent support.
What I’m paying more attention to is that the OI anomaly percentile is 95.8%, ranking in the top 8 of the whole pool, and it has persisted across several cycles rather than being just noise from a single volume spike. The notional change ranks #23 in the pool, so capital is genuinely pulling out.
Either this is a shakeout, or it’s making room for the next move. I’m not in a rush to buy here. I’ll wait for OI to stabilize and then see whether the longs have fully flushed out or if this has only just begun.
54


·
--
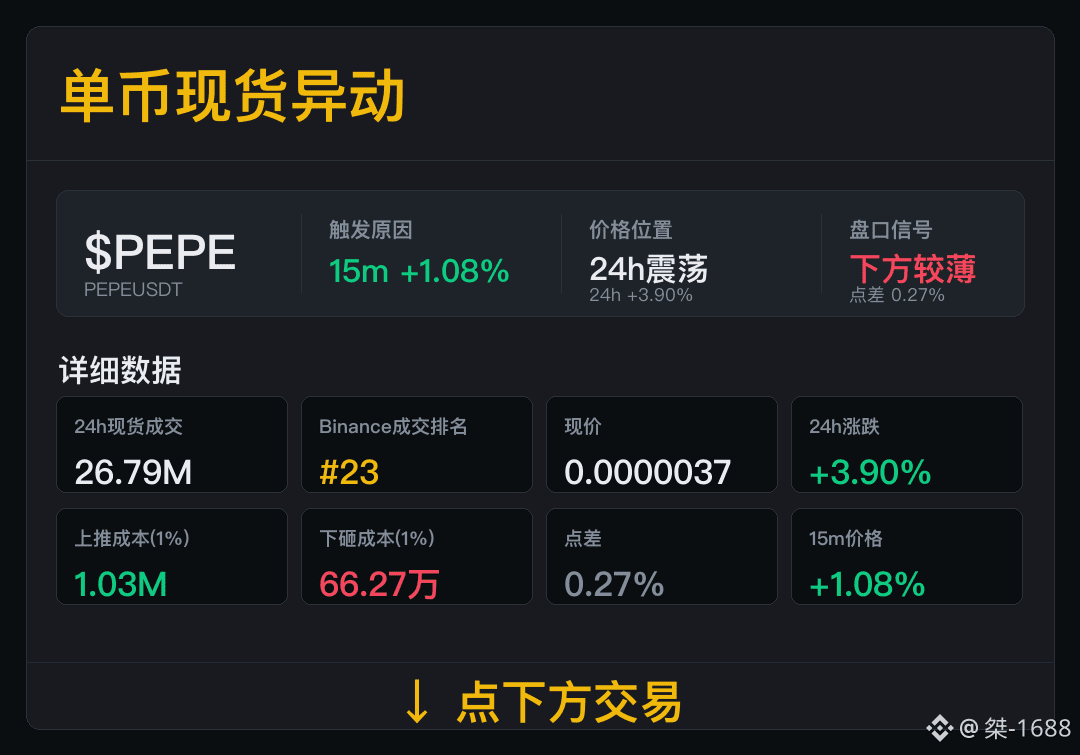
$PEPE 15m Spot market movement—first look at volume, then at positioning and exit routes.
Spot trades: 26.79M, Binance trade rank #23. The trade data is already shown in the chart—next, watch whether volume can carry over into the next round.
Current 24h change: +3.90%; spread: 0.27%. Pushing up cost: 1.03M; dumping cost: 662.7K. In the future, if the spread stays stable and trading continues to pick up, then order-book information will have more value.
For the next round, focus on verifying both成交 (trades) and spread. Only if both stabilize should you continue tracking.
$PEPE 15m Spot market movement—first look at volume, then at positioning and exit routes.
Spot trades: 26.79M, Binance trade rank #23. The trade data is already shown in the chart—next, watch whether volume can carry over into the next round.
Current 24h change: +3.90%; spread: 0.27%. Pushing up cost: 1.03M; dumping cost: 662.7K. In the future, if the spread stays stable and trading continues to pick up, then order-book information will have more value.
For the next round, focus on verifying both成交 (trades) and spread. Only if both stabilize should you continue tracking.
Spot trades: 26.79M, Binance trade rank #23. The trade data is already shown in the chart—next, watch whether volume can carry over into the next round.
Current 24h change: +3.90%; spread: 0.27%. Pushing up cost: 1.03M; dumping cost: 662.7K. In the future, if the spread stays stable and trading continues to pick up, then order-book information will have more value.
For the next round, focus on verifying both成交 (trades) and spread. Only if both stabilize should you continue tracking.
83
·
--
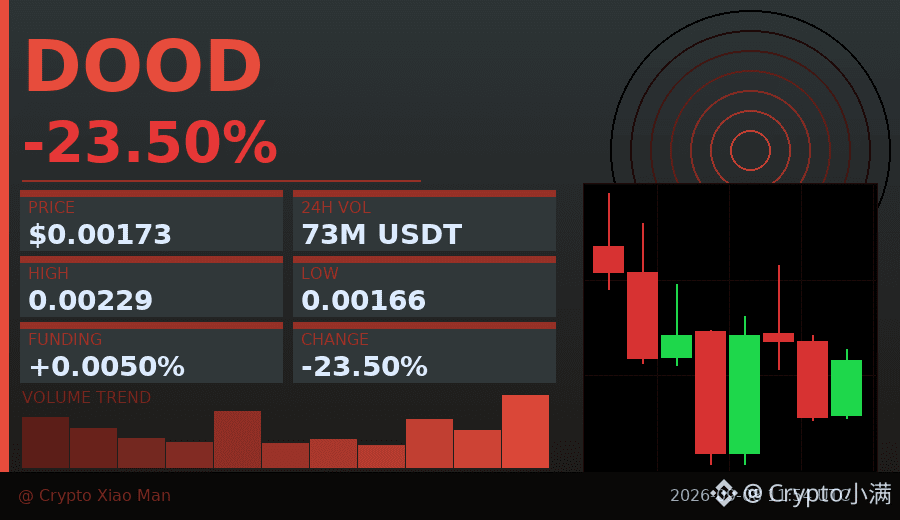
23% drop, 73 million in trading volume, but the bulls still account for 59%—this is a typical “refuse to admit defeat” market.
DOOD has fallen from the high of 0.002287 to 0.001735, showing continued weakness over the past 8 hours.
What’s most interesting is that the funding rate is still positive, indicating leveraged longs are still stubbornly holding on.
At times like this, the worst thing is the mindset of “just wait and it will bounce.”
Price has already broken through a key support level, but volume hasn’t shrunk—showing the sell pressure is real.
I usually wait for two signals: either the funding rate turns negative to wash out leverage, or price holds steady and stops making new lows.
Right now, neither of the two has appeared, so staying on the sidelines is safer than trying to bottom.
$DOOD #山寨币回调 #23%跌幅
Click the small card below to quickly check the market👇
23% drop, 73 million in trading volume, but the bulls still account for 59%—this is a typical “refuse to admit defeat” market.
DOOD has fallen from the high of 0.002287 to 0.001735, showing continued weakness over the past 8 hours.
What’s most interesting is that the funding rate is still positive, indicating leveraged longs are still stubbornly holding on.
At times like this, the worst thing is the mindset of “just wait and it will bounce.”
Price has already broken through a key support level, but volume hasn’t shrunk—showing the sell pressure is real.
I usually wait for two signals: either the funding rate turns negative to wash out leverage, or price holds steady and stops making new lows.
Right now, neither of the two has appeared, so staying on the sidelines is safer than trying to bottom.
$DOOD #山寨币回调 #23%跌幅
Click the small card below to quickly check the market👇
DOOD has fallen from the high of 0.002287 to 0.001735, showing continued weakness over the past 8 hours.
What’s most interesting is that the funding rate is still positive, indicating leveraged longs are still stubbornly holding on.
At times like this, the worst thing is the mindset of “just wait and it will bounce.”
Price has already broken through a key support level, but volume hasn’t shrunk—showing the sell pressure is real.
I usually wait for two signals: either the funding rate turns negative to wash out leverage, or price holds steady and stops making new lows.
Right now, neither of the two has appeared, so staying on the sidelines is safer than trying to bottom.
$DOOD #山寨币回调 #23%跌幅
Click the small card below to quickly check the market👇
17
·
--
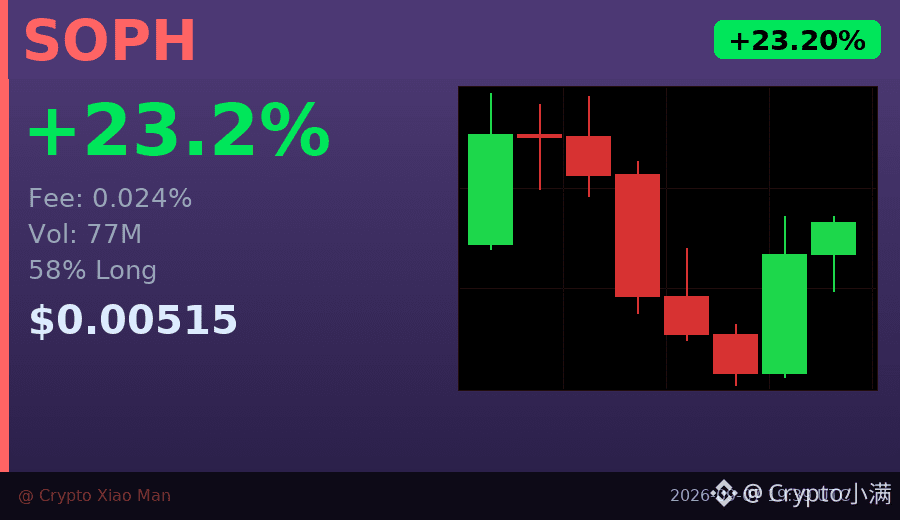
23% increase in rate, but the funding rate has already spiked to 0.024%—this is the most noteworthy signal today.
SOPH trading volume is 77 million USDT, with the long-to-short ratio at 58% to 42%, giving longs a slight edge.
Three consecutive bullish hourly candles, and the price has stabilized around 0.0051.
However, a high funding rate means longs are crowded, and the cost of chasing a breakout is rising quickly.
If the next 1–2 hours can’t break above the previous high at 0.0055, the risk of a pullback will increase.
I lean toward waiting for the funding rate to drop or for price to retrace to 0.0048 before reassessing.
$SOPH #资金费率预警 #23%
Click the small card below to quickly check the行情👇
23% increase in rate, but the funding rate has already spiked to 0.024%—this is the most noteworthy signal today.
SOPH trading volume is 77 million USDT, with the long-to-short ratio at 58% to 42%, giving longs a slight edge.
Three consecutive bullish hourly candles, and the price has stabilized around 0.0051.
However, a high funding rate means longs are crowded, and the cost of chasing a breakout is rising quickly.
If the next 1–2 hours can’t break above the previous high at 0.0055, the risk of a pullback will increase.
I lean toward waiting for the funding rate to drop or for price to retrace to 0.0048 before reassessing.
$SOPH #资金费率预警 #23%
Click the small card below to quickly check the行情👇
SOPH trading volume is 77 million USDT, with the long-to-short ratio at 58% to 42%, giving longs a slight edge.
Three consecutive bullish hourly candles, and the price has stabilized around 0.0051.
However, a high funding rate means longs are crowded, and the cost of chasing a breakout is rising quickly.
If the next 1–2 hours can’t break above the previous high at 0.0055, the risk of a pullback will increase.
I lean toward waiting for the funding rate to drop or for price to retrace to 0.0048 before reassessing.
$SOPH #资金费率预警 #23%
Click the small card below to quickly check the行情👇
30
Log in to explore more content
Join global crypto users on Binance Square
⚡️ Get latest and useful information about crypto.
💬 Trusted by the world’s largest crypto exchange.
👍 Discover real insights from verified creators.
Email / Phone number
Trending Topics
1
#HKCompletesFirstHKDStablecoinUseCase
11,165 views
372 Discussing
2
#VietnamPlansFirstCryptoLicensesIn2026
8,604 views
241 Discussing
3
#BTCBreaks80K
220,009 views
3,502 Discussing
4
#比特币突破8万
131,650 views
389 Discussing
5
#BitcoinMarketCapTopsTesla
25,384 views
633 Discussing
6
#SOLJumpsAbout10%
37,871 views
710 Discussing
7
#EthereumReclaims$2600
2,787 views
85 Discussing
8
#LineraShutsDownAfterFundraisingFallsShort
8,671 views
180 Discussing
9
#SECReceivesAmendedInjectiveETFFiling
20,686 views
446 Discussing
10
#SanDiskToJoinSP100OnSep21
15,374 views
281 Discussing