

pro trader22
17 Beiträge

pro trader22
Melden
Nutzer blockieren
I am a content creator
Trade eröffnen
9 Tage
1 Following
3 Follower
1 Like gegeben
Beiträge
Portfolio
·
--
Übersetzung ansehen
🚨🐸 What if $PEPE PE suddenly surged to $0.010 tomorrow? 🚀
Imagine waking up to an incredible green candle and seeing your PEPE holdings skyrocket in value! 💚📈
The PEPE community remains passionate, and the dream of a massive rally continues to capture attention.
Could $PEPE make history someday? What price target are you hoping to see?
👇 How many PEPE tokens are you holding?
⚠️ This is a hypothetical scenario, not a price prediction. Always DYOR.
PEPE
#KOSPIFalls3.53%BackBelow6000 #BinanceWillListPredictPREDICT #
{spot}(PEPEUSDT)
🚨🐸 What if $PEPE PE suddenly surged to $0.010 tomorrow? 🚀
Imagine waking up to an incredible green candle and seeing your PEPE holdings skyrocket in value! 💚📈
The PEPE community remains passionate, and the dream of a massive rally continues to capture attention.
Could $PEPE make history someday? What price target are you hoping to see?
👇 How many PEPE tokens are you holding?
⚠️ This is a hypothetical scenario, not a price prediction. Always DYOR.
PEPE
#KOSPIFalls3.53%BackBelow6000 #BinanceWillListPredictPREDICT #

75
·
--
Übersetzung ansehen
$SOL OL break 100$ position...📈📊📉
If anyone analysing $SOL coin suggest me is it a perfect time to buy or not??
Comment below 👇👇👇📊
{spot}(SOLUSDT)
#FedWatch #EarningsSeason #USMidtermElections #BrazilCryptoExchangesMustApplyForLicensesByFriday
$SOL OL break 100$ position...📈📊📉
If anyone analysing $SOL coin suggest me is it a perfect time to buy or not??
Comment below 👇👇👇📊
#FedWatch #EarningsSeason #USMidtermElections #BrazilCryptoExchangesMustApplyForLicensesByFriday
If anyone analysing $SOL coin suggest me is it a perfect time to buy or not??
Comment below 👇👇👇📊
#FedWatch #EarningsSeason #USMidtermElections #BrazilCryptoExchangesMustApplyForLicensesByFriday

68
·
--
Übersetzung ansehen
Guys, I’m opening a big short position on $AIN N here!‼️ another major drop could be coming.
entry: $0.13722 – $0.13983
targets: $0.13000 / $0.11000 / $0.09000
sl: $0.16306
$AIN has pumped aggressively, but momentum is showing signs of weakness. I’m watching for a bearish reversal. Don’t chase green candles, and manage your risk!#FedWatch #USMidtermElections #AlphabetSharesSlide10%InLateTrading
{alpha}(560x9558a9254890b2a8b057a789f413631b9084f4a3)
Guys, I’m opening a big short position on $AIN N here!‼️ another major drop could be coming.
entry: $0.13722 – $0.13983
targets: $0.13000 / $0.11000 / $0.09000
sl: $0.16306
$AIN has pumped aggressively, but momentum is showing signs of weakness. I’m watching for a bearish reversal. Don’t chase green candles, and manage your risk!#FedWatch #USMidtermElections #AlphabetSharesSlide10%InLateTrading

75
·
--
Übersetzung ansehen
$APR R 130% in just 5 days
Ruling Binance
We added 0.027
Current price 0.06
Gave to my subs Than gave in public with proper analysis why it will go huge everyone printed with me ❤️
Next $HANA most perfect chart falling channel breaking out
Like if you learn and earn with crypto
trader
{alpha}(560x299ad4299da5b2b93fba4c96967b040c7f611099)
{alpha}(560x6261963ebe9ff014aad10ecc3b0238d4d04e8353)
#CanMicrosoftDeliverOnAI #EarningsSeason #CanGoogleDefindItsCore #FOMCWatch #EarningsSeason
$APR R 130% in just 5 days
Ruling Binance
We added 0.027
Current price 0.06
Gave to my subs Than gave in public with proper analysis why it will go huge everyone printed with me ❤️
Next $HANA most perfect chart falling channel breaking out
Like if you learn and earn with crypto
trader
#CanMicrosoftDeliverOnAI #EarningsSeason #CanGoogleDefindItsCore #FOMCWatch #EarningsSeason

73
·
--
Übersetzung ansehen
Earnings Season is live on Binance Pick!
Predict who beats expectations this quarter and earn points.👌🏻🍑
My view right now:
Bullish → $AMZN
{stock_us}(AMZN.US)
$GOOGLB
Watching → $MSFTB
What’s your prediction? Drop it + screenshot below 👇
#EarningsSeason #BinancePick
#ThailandLaunchesWORPTStablecoinToQRPaymentApp #BitmineAdds10452ETH
{spot}(GOOGLBUSDT)
{spot}(MSFTBUSDT)
Earnings Season is live on Binance Pick!
Predict who beats expectations this quarter and earn points.👌🏻🍑
My view right now:
Bullish → $AMZN
$GOOGLB
Watching → $MSFTB
What’s your prediction? Drop it + screenshot below 👇
#EarningsSeason #BinancePick
#ThailandLaunchesWORPTStablecoinToQRPaymentApp #BitmineAdds10452ETH
Predict who beats expectations this quarter and earn points.👌🏻🍑
My view right now:
Bullish → $AMZN
$GOOGLB
Watching → $MSFTB
What’s your prediction? Drop it + screenshot below 👇
#EarningsSeason #BinancePick
#ThailandLaunchesWORPTStablecoinToQRPaymentApp #BitmineAdds10452ETH

92
·
--
Übersetzung ansehen
$BNB (Binance Coin) is the native token of the BNB Chain ecosystem and is used for transaction fees and other blockchain-related activities.
Technical outlook
Support: Around $728–$732, where buyers may attempt to defend the price.
Resistance: Around $745–$755, where selling pressure may appear.
Bullish scenario: A strong breakout above resistance with increasing trading volume could support further upward movement.
Bearish scenario: A break below support could lead to additional declines.
My view: BNB's short-term outlook is neutral to cautious. An upward move is possible, but it is not confirmed. Watch price action, trading volume, and Bitcoin's direction before making a trading decision.
{spot}(BNBUSDT)
#BinancePick #EarningsSeason #AnthropicTTMRevenueGrewAbout1200% #ArgentineCourtDismissesLIBRACaseAgainstMilei #StrategyMSTRSurpassesNasdaqInMarketCap
$BNB (Binance Coin) is the native token of the BNB Chain ecosystem and is used for transaction fees and other blockchain-related activities.
Technical outlook
Support: Around $728–$732, where buyers may attempt to defend the price.
Resistance: Around $745–$755, where selling pressure may appear.
Bullish scenario: A strong breakout above resistance with increasing trading volume could support further upward movement.
Bearish scenario: A break below support could lead to additional declines.
My view: BNB's short-term outlook is neutral to cautious. An upward move is possible, but it is not confirmed. Watch price action, trading volume, and Bitcoin's direction before making a trading decision.
#BinancePick #EarningsSeason #AnthropicTTMRevenueGrewAbout1200% #ArgentineCourtDismissesLIBRACaseAgainstMilei #StrategyMSTRSurpassesNasdaqInMarketCap

70
·
--
Übersetzung ansehen
$PEPE latest analysis
$PEPE to $0.001? Is it really possible, or just a dream? The journey would require a massive rally and a huge market cap. Can PEPE surprise everyone this cycle?
{spot}(PEPEUSDT)
$PEPE latest analysis
$PEPE to $0.001? Is it really possible, or just a dream? The journey would require a massive rally and a huge market cap. Can PEPE surprise everyone this cycle?
$PEPE to $0.001? Is it really possible, or just a dream? The journey would require a massive rally and a huge market cap. Can PEPE surprise everyone this cycle?

49
·
--
Übersetzung ansehen
$BTC coin predict
$BTC FINAL BULL TRAP IS OVER.
The market is now entering the cycle-bottom formation phase.
$BTC will dump to $53,000 within the next 12 days before the new cycle begins.
$81K → $73K → $67K → $53K → New Cycle
Save this chart and compare it again in a few weeks.
Turn on notifications. Follow before you’re late.
I’ll post every major update here first.
{spot}(BTCUSDT)
#BinancePick #EarningsSeason #USQ3GDPAndSeptemberPCEDueNextWeek #SouthKoreaDelaysCryptoIncomeTax #DowDrops653Points
$BTC coin predict
$BTC FINAL BULL TRAP IS OVER.
The market is now entering the cycle-bottom formation phase.
$BTC will dump to $53,000 within the next 12 days before the new cycle begins.
$81K → $73K → $67K → $53K → New Cycle
Save this chart and compare it again in a few weeks.
Turn on notifications. Follow before you’re late.
I’ll post every major update here first.
#BinancePick #EarningsSeason #USQ3GDPAndSeptemberPCEDueNextWeek #SouthKoreaDelaysCryptoIncomeTax #DowDrops653Points

52
·
--
Übersetzung ansehen
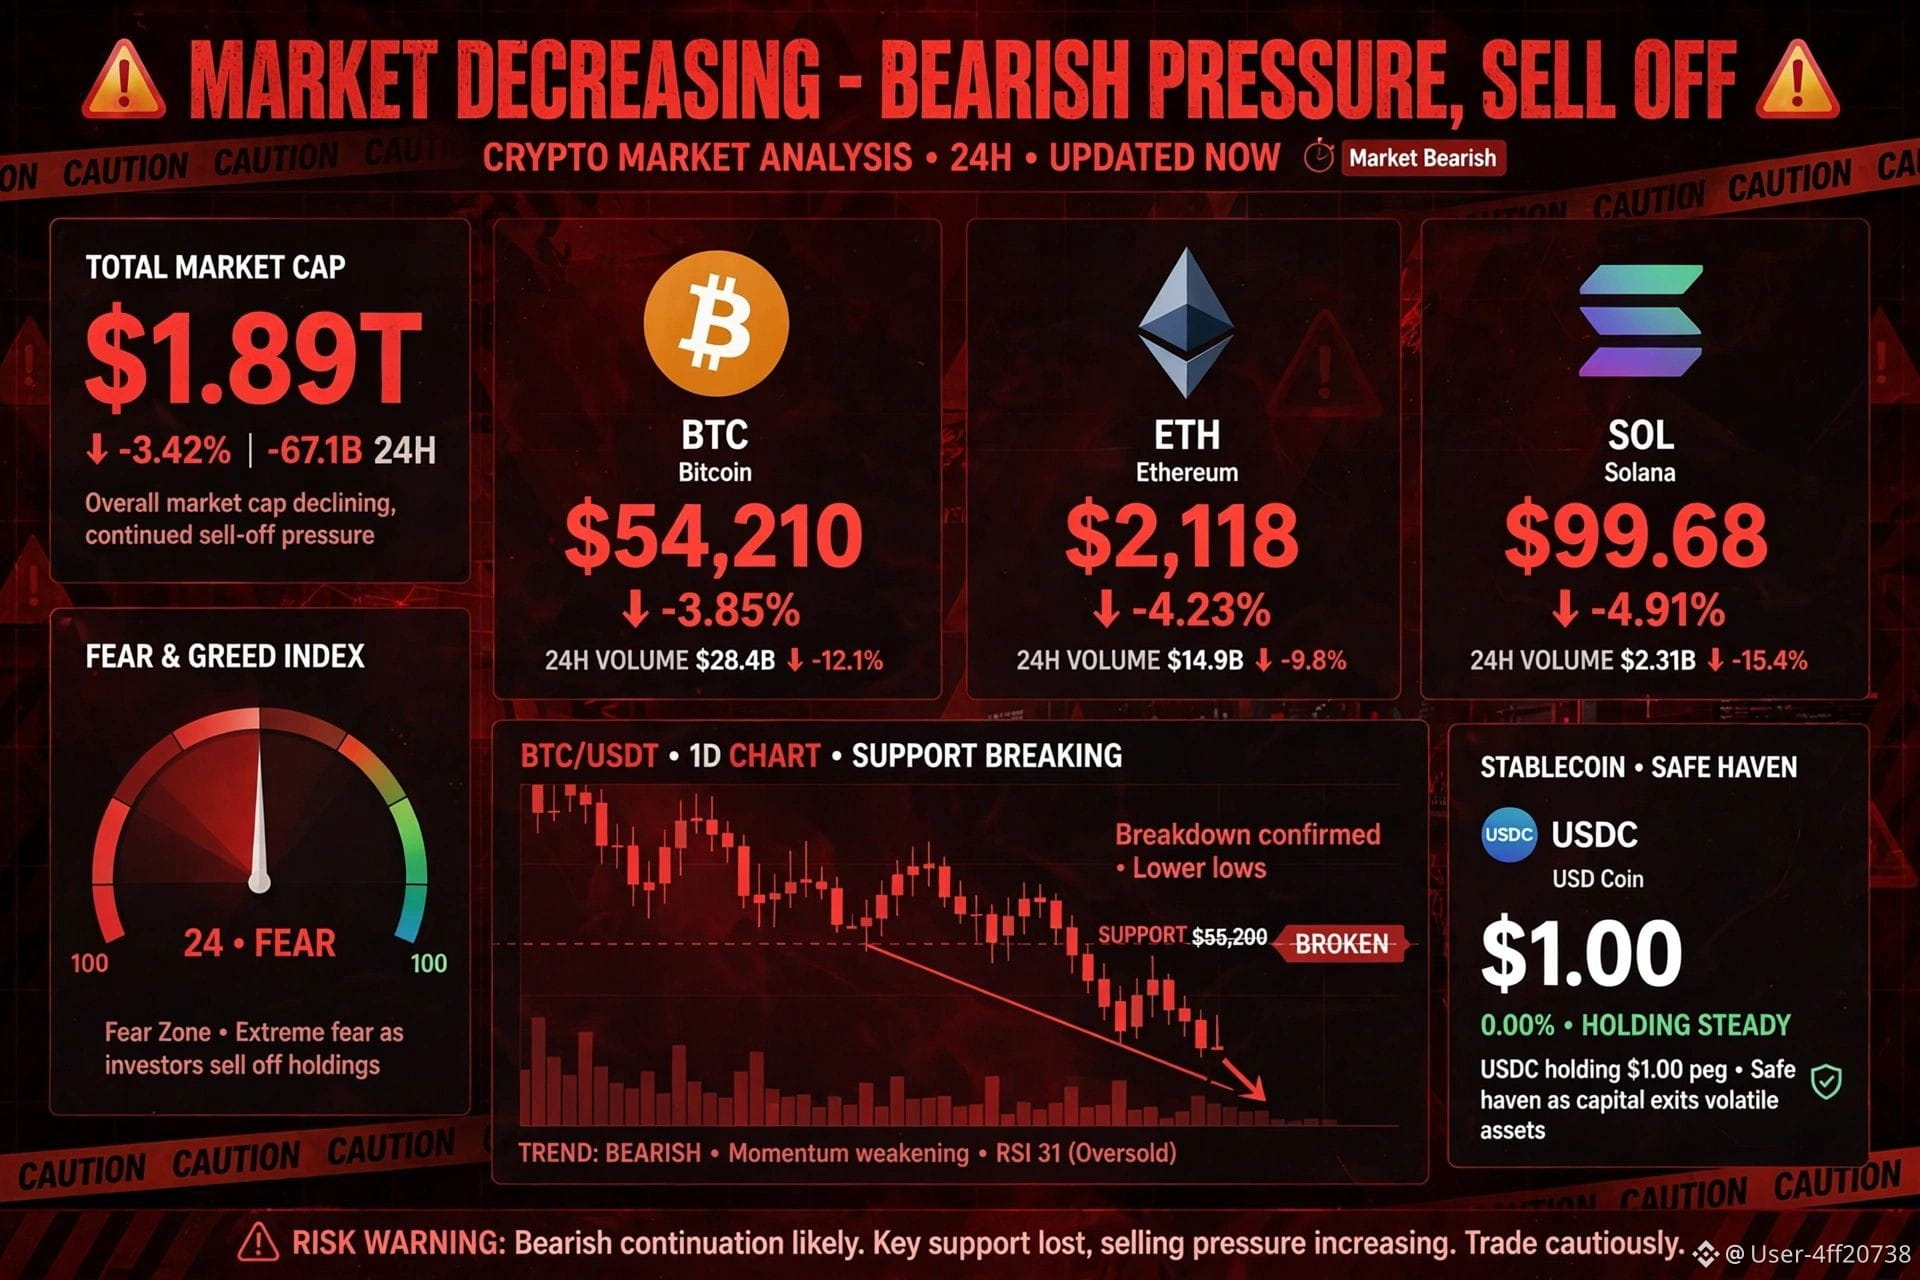
$USDC Coin - Analysis:
Price:$1.00103 pegged to USD (-0.01% 24h)
*lMarket Cap:$71.65B / $72.15B rank #6 Volume:$6.58B - $14.05B 24h
All-time high: $1.040 in May 2021 7e635951acc7
What is it?
USD Coin is a regulated stablecoin issued by Circle, backed 1:1 by fully reserved cash & cash-equivalents, monthly attestation by Big Four auditor. It's not a speculative coin - it's designed to stay at $1. acc7
Analysis:
No volatility:5-day return 0.02%, 1-month 0.1%, YTD 0.01% - that's the point. Flat line chart.
Use case: Payments, trading base pair, DeFi collateral, bridge between TradFi and crypto. Supported on Ethereum, Solana, etc.
Risk:De-peg risk is minimal - last major de-peg was March 2023. Now deemed first of 45 EU significant e-money tokens.
Oversight: EU MiCA oversight starts Nov 12, 2026 - more regulation = more trust. 7e635951acee#BinancePick #EarningsSeason #SouthKoreaDelaysCryptoIncomeTax
Verdict: Don't trade $USDC
{spot}(USDCUSDT)
for profit. Hold USDC when market is dumping (like SOL -4.9% today) to preserve value, then buy dips. It's your cash in crypto.
$USDC Coin - Analysis:
Price:$1.00103 pegged to USD (-0.01% 24h)
*lMarket Cap:$71.65B / $72.15B rank #6 Volume:$6.58B - $14.05B 24h
All-time high: $1.040 in May 2021 7e635951acc7
What is it?
USD Coin is a regulated stablecoin issued by Circle, backed 1:1 by fully reserved cash & cash-equivalents, monthly attestation by Big Four auditor. It's not a speculative coin - it's designed to stay at $1. acc7
Analysis:
No volatility:5-day return 0.02%, 1-month 0.1%, YTD 0.01% - that's the point. Flat line chart.
Use case: Payments, trading base pair, DeFi collateral, bridge between TradFi and crypto. Supported on Ethereum, Solana, etc.
Risk:De-peg risk is minimal - last major de-peg was March 2023. Now deemed first of 45 EU significant e-money tokens.
Oversight: EU MiCA oversight starts Nov 12, 2026 - more regulation = more trust. 7e635951acee#BinancePick #EarningsSeason #SouthKoreaDelaysCryptoIncomeTax
Verdict: Don't trade $USDC
for profit. Hold USDC when market is dumping (like SOL -4.9% today) to preserve value, then buy dips. It's your cash in crypto.
95
·
--
Übersetzung ansehen
$SOL
Coin (solana)
Market Trend: Short-term Bearish, with potential for recovery.
Solana (SOL) is a high-performance blockchain known for fast transactions, low fees, and its growing ecosystem of decentralized applications, DeFi, NFTs, and tokenized assets. SOL is trading around $101–$102, facing selling pressure amid broader cryptocurrency market weakness.
Key Price Levels:
- Support: $100–$101
- Secondary Support: $97–$98
- Resistance: $104–$105
- Bullish Target: $108–$113 if resistance breaks with strong buying volume.
- Bearish Scenario: A confirmed breakdown below $100 could push SOL toward $95 or potentially $88–$90.
Technical Outlook: SOL is showing short-term weakness, with momentum indicators reflecting selling pressure. However, a strong bounce from the $100 support zone could trigger a recovery toward $104–$108. A sustained move above $105 would improve the bullish outlook, while a breakdown below support could extend the decline.
Fundamental Outlook: Solana remains a major blockchain ecosystem with applications in decentralized finance, payments, and digital assets. Network adoption, developer activity, institutional demand, Bitcoin's direction, and overall market sentiment will influence its future performance.
Conclusion: SOL is currently at a critical support zone. Holding above $100 could support a relief rally, while losing this level may lead to further downside. Traders should wait for confirmation from price action and trading volume before entering a position.
Disclaimer: This analysis is for informational purposes only and is not financial advice. Cryptocurrency markets are highly volatile. Always conduct your own research and use proper risk management.
{spot}(SOLUSDT)
#BinancePick #EarningsSeason #DowDrops653Points #PepeJumps14%ToLeadAltcoinRebound #IRSPlansLowerTaxDisclosurePenaltiesForCryptoCases
$SOL
Coin (solana)
Market Trend: Short-term Bearish, with potential for recovery.
Solana (SOL) is a high-performance blockchain known for fast transactions, low fees, and its growing ecosystem of decentralized applications, DeFi, NFTs, and tokenized assets. SOL is trading around $101–$102, facing selling pressure amid broader cryptocurrency market weakness.
Key Price Levels:
- Support: $100–$101
- Secondary Support: $97–$98
- Resistance: $104–$105
- Bullish Target: $108–$113 if resistance breaks with strong buying volume.
- Bearish Scenario: A confirmed breakdown below $100 could push SOL toward $95 or potentially $88–$90.
Technical Outlook: SOL is showing short-term weakness, with momentum indicators reflecting selling pressure. However, a strong bounce from the $100 support zone could trigger a recovery toward $104–$108. A sustained move above $105 would improve the bullish outlook, while a breakdown below support could extend the decline.
Fundamental Outlook: Solana remains a major blockchain ecosystem with applications in decentralized finance, payments, and digital assets. Network adoption, developer activity, institutional demand, Bitcoin's direction, and overall market sentiment will influence its future performance.
Conclusion: SOL is currently at a critical support zone. Holding above $100 could support a relief rally, while losing this level may lead to further downside. Traders should wait for confirmation from price action and trading volume before entering a position.
Disclaimer: This analysis is for informational purposes only and is not financial advice. Cryptocurrency markets are highly volatile. Always conduct your own research and use proper risk management.
#BinancePick #EarningsSeason #DowDrops653Points #PepeJumps14%ToLeadAltcoinRebound #IRSPlansLowerTaxDisclosurePenaltiesForCryptoCases

85
·
--
Übersetzung ansehen
$SPCX Market Trend: Neutral to Bearish in the short term.
SPCX is a tokenized asset linked to SpaceX equity, with different versions available through tokenization platforms. The Backpack Securities version was trading around $146.77, down approximately 0.40% over 24 hours, while gaining 0.80% over the past seven days. Market activity and price movements remain volatile.
Key Price Levels:
- Support: $138–$142
- Resistance: $155–$160
- Bullish Target: $165–$176 if buying pressure increases.
- Bearish Scenario: A break below $138 could trigger further downside.
Technical Outlook: SPCX is showing mixed momentum, with short-term selling pressure and potential for recovery if buyers regain control. A breakout above resistance with strong volume could improve the outlook, while a breakdown below support may indicate further weakness.
Fundamental Outlook: SPCX provides exposure to SpaceX through tokenization, but investors should verify the specific token issuer, redemption rights, custody arrangements, and trading liquidity before investing. Tokenized assets can carry additional risks beyond ordinary cryptocurrencies.
Conclusion: SPCX may offer upside potential if market sentiment improves and resistance levels break. However, the current outlook calls for caution. Monitor price action, trading volume, and broader market conditions before making a decision.
Disclaimer: This analysis is for informational purposes only and is not financial advice. Cryptocurrency and tokenized securities involve significant risks. Always do your own research before investing.
{stock_us}(SPCX.US)
#BinancePick #EarningsSeason #PepeJumps14%ToLeadAltcoinRebound #IRSPlansLowerTaxDisclosurePenaltiesForCryptoCases
$SPCX Market Trend: Neutral to Bearish in the short term.
SPCX is a tokenized asset linked to SpaceX equity, with different versions available through tokenization platforms. The Backpack Securities version was trading around $146.77, down approximately 0.40% over 24 hours, while gaining 0.80% over the past seven days. Market activity and price movements remain volatile.
Key Price Levels:
- Support: $138–$142
- Resistance: $155–$160
- Bullish Target: $165–$176 if buying pressure increases.
- Bearish Scenario: A break below $138 could trigger further downside.
Technical Outlook: SPCX is showing mixed momentum, with short-term selling pressure and potential for recovery if buyers regain control. A breakout above resistance with strong volume could improve the outlook, while a breakdown below support may indicate further weakness.
Fundamental Outlook: SPCX provides exposure to SpaceX through tokenization, but investors should verify the specific token issuer, redemption rights, custody arrangements, and trading liquidity before investing. Tokenized assets can carry additional risks beyond ordinary cryptocurrencies.
Conclusion: SPCX may offer upside potential if market sentiment improves and resistance levels break. However, the current outlook calls for caution. Monitor price action, trading volume, and broader market conditions before making a decision.
Disclaimer: This analysis is for informational purposes only and is not financial advice. Cryptocurrency and tokenized securities involve significant risks. Always do your own research before investing.
#BinancePick #EarningsSeason #PepeJumps14%ToLeadAltcoinRebound #IRSPlansLowerTaxDisclosurePenaltiesForCryptoCases

SPCX-5,61%
SPCXUS-5,80%
2
·
--
Übersetzung ansehen
$NIL Coin (Nillion)
Market Trend: Cautiously Bullish, with short-term pullback risk.
Nillion (NIL) is a privacy-focused blockchain project designed for secure computation and encrypted data. Its technology aims to protect sensitive information while enabling data processing.
Key Price Levels:
- Support: $0.078–$0.080
- Resistance: $0.085–$0.088
- Bullish Target: $0.090–$0.095 if resistance breaks with strong trading volume.
- Bearish Scenario: A breakdown below $0.078 could trigger further downside.
Technical Outlook: NIL may have further upside potential if buyers maintain momentum. However, short-term corrections and consolidation are possible. Traders should monitor trading volume, Bitcoin’s price movement, market sentiment, and project developments.
Conclusion: NIL could move higher if it breaks above resistance with strong buying pressure. If support fails, the price may decline further. Proper risk management is essential when trading volatile cryptocurrencies.
Disclaimer: This analysis is for informational purposes only and is not financial advice. Always conduct your own research before investing.
{spot}(NILUSDT)
#BinancePick #EarningsSeason #DowDrops653Points #DowDrops653Points #IRSPlansLowerTaxDisclosurePenaltiesForCryptoCases
$NIL Coin (Nillion)
Market Trend: Cautiously Bullish, with short-term pullback risk.
Nillion (NIL) is a privacy-focused blockchain project designed for secure computation and encrypted data. Its technology aims to protect sensitive information while enabling data processing.
Key Price Levels:
- Support: $0.078–$0.080
- Resistance: $0.085–$0.088
- Bullish Target: $0.090–$0.095 if resistance breaks with strong trading volume.
- Bearish Scenario: A breakdown below $0.078 could trigger further downside.
Technical Outlook: NIL may have further upside potential if buyers maintain momentum. However, short-term corrections and consolidation are possible. Traders should monitor trading volume, Bitcoin’s price movement, market sentiment, and project developments.
Conclusion: NIL could move higher if it breaks above resistance with strong buying pressure. If support fails, the price may decline further. Proper risk management is essential when trading volatile cryptocurrencies.
Disclaimer: This analysis is for informational purposes only and is not financial advice. Always conduct your own research before investing.
#BinancePick #EarningsSeason #DowDrops653Points #DowDrops653Points #IRSPlansLowerTaxDisclosurePenaltiesForCryptoCases

144
·
--
Übersetzung ansehen
$MU Coin
Coin Name: Mu Coin (MU)
Current Price: Approximately $0.0127 USD (October 23, 2026)
Market Trend: Bearish in the short term. MU Coin recently declined around 3.4% in 24 hours and 23.1% over seven days.
Market Outlook: MU Coin is a highly speculative, small-cap cryptocurrency with limited liquidity. Its price may rise or fall sharply, and low trading volume can make buying or selling difficult.
Investment Opinion: The short-term outlook is risky. Before investing, monitor trading volume, liquidity, project development, and price action. Avoid investing money you cannot afford to lose.
Disclaimer: This is informational analysis, not financial advice. Market prices can change rapidly.
{stock_us}(MU.US)
#BinancePick #EarningsSeason #DowDrops653Points #MarketsPriceJust10%ChanceOfFedHikeNextWeek
$MU Coin
Coin Name: Mu Coin (MU)
Current Price: Approximately $0.0127 USD (October 23, 2026)
Market Trend: Bearish in the short term. MU Coin recently declined around 3.4% in 24 hours and 23.1% over seven days.
Market Outlook: MU Coin is a highly speculative, small-cap cryptocurrency with limited liquidity. Its price may rise or fall sharply, and low trading volume can make buying or selling difficult.
Investment Opinion: The short-term outlook is risky. Before investing, monitor trading volume, liquidity, project development, and price action. Avoid investing money you cannot afford to lose.
Disclaimer: This is informational analysis, not financial advice. Market prices can change rapidly.
#BinancePick #EarningsSeason #DowDrops653Points #MarketsPriceJust10%ChanceOfFedHikeNextWeek

MU-6,39%
MUUS-7,03%
1
940
·
--
Übersetzung ansehen
$ATH Market Analysis**
Aethir (ATH) is gaining attention in the crypto market due to its decentralized GPU cloud computing technology for AI and gaming.
📊 **Latest Price:** Around $0.0062
📈 **24H Change:** Approximately +5.9%
🔥 **Bullish Factor:** Aethir plans to introduce daily ATH token burns from network fees starting in November 2026.
**Market Outlook:** ATH could continue recovering if buying volume remains strong. However, a broader market decline or selling pressure could reverse the gains.
🎯 **Key Levels to Watch:** $0.0055 support and $0.0063 resistance.
⚠️ **Conclusion:** Cautiously bullish, but ATH remains a high-risk altcoin. Monitor volume and actual token burns before making trading decisions.
{alpha}(10xbe0ed4138121ecfc5c0e56b40517da27e6c5226b)
$ATH Market Analysis**
Aethir (ATH) is gaining attention in the crypto market due to its decentralized GPU cloud computing technology for AI and gaming.
📊 **Latest Price:** Around $0.0062
📈 **24H Change:** Approximately +5.9%
🔥 **Bullish Factor:** Aethir plans to introduce daily ATH token burns from network fees starting in November 2026.
**Market Outlook:** ATH could continue recovering if buying volume remains strong. However, a broader market decline or selling pressure could reverse the gains.
🎯 **Key Levels to Watch:** $0.0055 support and $0.0063 resistance.
⚠️ **Conclusion:** Cautiously bullish, but ATH remains a high-risk altcoin. Monitor volume and actual token burns before making trading decisions.

167
·
--
Übersetzung ansehen
$DOT is a blockchain project focused on connecting different networks and enabling cross-chain communication.
- Bullish outlook: Growing adoption, ecosystem development, and stronger crypto market sentiment could support DOT’s price.
- Bearish risk: Weak market conditions, low demand, or selling pressure could push the price lower.
- What to watch: Trading volume, key support and resistance levels, Bitcoin’s trend, and Polkadot network updates.
Latest market note: DOT was around $1.12 in the latest CoinMarketCap snapshot, with short-term bearish pressure. A recent third-party wallet security incident has also affected market sentiment. If DOT recovers above $1.20, momentum may improve; a break below $1.10 could bring further downside risk. These are reference levels, not guaranteed outcomes.
CoinMarketCap
+1
Conclusion: DOT has long-term potential, but short-term volatility remains high. Always use risk management and do your own research. This is not financial advice.
{spot}(DOTUSDT)
$DOT is a blockchain project focused on connecting different networks and enabling cross-chain communication.
- Bullish outlook: Growing adoption, ecosystem development, and stronger crypto market sentiment could support DOT’s price.
- Bearish risk: Weak market conditions, low demand, or selling pressure could push the price lower.
- What to watch: Trading volume, key support and resistance levels, Bitcoin’s trend, and Polkadot network updates.
Latest market note: DOT was around $1.12 in the latest CoinMarketCap snapshot, with short-term bearish pressure. A recent third-party wallet security incident has also affected market sentiment. If DOT recovers above $1.20, momentum may improve; a break below $1.10 could bring further downside risk. These are reference levels, not guaranteed outcomes.
CoinMarketCap
+1
Conclusion: DOT has long-term potential, but short-term volatility remains high. Always use risk management and do your own research. This is not financial advice.

178
·
--
$DASH UMFASSENDE MARKTANALYSE
📅 Datum: 23. Oktober 2026
1. Marktübersicht
Dash (DASH) ist eine etablierte Kryptowährung, die schnelle und kostengünstige digitale Zahlungen ermöglichen soll. Der Fokus liegt auf Benutzerfreundlichkeit, effizienten Transaktionen und Zahlungen im Alltag.
DASH zeigte zuletzt eine positive Kursdynamik und weckte damit das Interesse von Krypto-Tradern. Vor Entscheidungen sollten Trader jedoch das Handelsvolumen, die Entwicklung von Bitcoin sowie wichtige Unterstützungs- und Widerstandsniveaus beobachten.
2. Marktüberblick
• Coin: Dash (DASH)
• Referenzkurs: $52.92
• Angegebene Veränderung innerhalb von 24 Stunden: +6.79%
• Angegebene Marktkapitalisierung: 681.51 Millionen $
• Angegebenes Handelsvolumen innerhalb von 24 Stunden: 115.59 Millionen $
• Angegebenes 24-Stunden-Hoch: $55.65
• Angegebenes 24-Stunden-Tief: $49.42
Hinweis: Diese Zahlen sind eine Marktübersicht vom 23. Oktober 2026 und keine garantierten Live-Kurse.
3. Technische Analyse
DASH zeigte eine positive kurzfristige Dynamik, nachdem der Kurs ein wichtiges technisches Niveau überschritten hatte. Die weitere Entwicklung hängt davon ab, ob die Käufer die Kontrolle behalten und bei einem möglichen erneuten Test des Kurses die Unterstützung verteidigen können.
Wichtige Widerstandsniveaus
Widerstand 1: $55.65
Dies ist das angegebene jüngste 24-Stunden-Hoch. In diesem Bereich könnten Verkäufer aktiv werden. Trader sollten daher beobachten, ob der Kurs mit hohem Volumen darüber ausbricht.
Widerstand 2: $56.67
Ein anhaltender Ausbruch über den ersten Widerstand könnte dieses Niveau als nächstes mögliches Kursziel auf der Oberseite in den Fokus rücken.
Wichtige Unterstützungsniveaus
Unterstützung 1: $52.90
Dies ist der angegebene Ausbruchsbereich. Ein Verbleib darüber könnte dazu beitragen, die bullische Struktur zu erhalten.
Unterstützung 2: $52.00
Ein anhaltender Rückgang unter dieses Niveau könnte die kurzfristige Kaufdynamik schwächen.
Niedrigere Unterstützung: $48.80
Sollte der Verkaufsdruck deutlich zunehmen, ist dies ein weiterer möglicher Bereich, den Trader beobachten könnten.
4. Warum bewegt sich DASH?
Mehrere Faktoren könnten die Kursentwicklung von DASH beeinflussen:
1. Technischer Ausbruch
Ein Anstieg über einen wichtigen gleitenden Durchschnitt kann Trader anziehen, die nach Momentum-Chancen suchen.
⚠️ Haftungsausschluss: Dieser Inhalt dient ausschließlich Bildungszwecken und ist keine Finanzberatung.
{spot}(DASHUSDT)
$DASH UMFASSENDE MARKTANALYSE
📅 Datum: 23. Oktober 2026
1. Marktübersicht
Dash (DASH) ist eine etablierte Kryptowährung, die schnelle und kostengünstige digitale Zahlungen ermöglichen soll. Der Fokus liegt auf Benutzerfreundlichkeit, effizienten Transaktionen und Zahlungen im Alltag.
DASH zeigte zuletzt eine positive Kursdynamik und weckte damit das Interesse von Krypto-Tradern. Vor Entscheidungen sollten Trader jedoch das Handelsvolumen, die Entwicklung von Bitcoin sowie wichtige Unterstützungs- und Widerstandsniveaus beobachten.
2. Marktüberblick
• Coin: Dash (DASH)
• Referenzkurs: $52.92
• Angegebene Veränderung innerhalb von 24 Stunden: +6.79%
• Angegebene Marktkapitalisierung: 681.51 Millionen $
• Angegebenes Handelsvolumen innerhalb von 24 Stunden: 115.59 Millionen $
• Angegebenes 24-Stunden-Hoch: $55.65
• Angegebenes 24-Stunden-Tief: $49.42
Hinweis: Diese Zahlen sind eine Marktübersicht vom 23. Oktober 2026 und keine garantierten Live-Kurse.
3. Technische Analyse
DASH zeigte eine positive kurzfristige Dynamik, nachdem der Kurs ein wichtiges technisches Niveau überschritten hatte. Die weitere Entwicklung hängt davon ab, ob die Käufer die Kontrolle behalten und bei einem möglichen erneuten Test des Kurses die Unterstützung verteidigen können.
Wichtige Widerstandsniveaus
Widerstand 1: $55.65
Dies ist das angegebene jüngste 24-Stunden-Hoch. In diesem Bereich könnten Verkäufer aktiv werden. Trader sollten daher beobachten, ob der Kurs mit hohem Volumen darüber ausbricht.
Widerstand 2: $56.67
Ein anhaltender Ausbruch über den ersten Widerstand könnte dieses Niveau als nächstes mögliches Kursziel auf der Oberseite in den Fokus rücken.
Wichtige Unterstützungsniveaus
Unterstützung 1: $52.90
Dies ist der angegebene Ausbruchsbereich. Ein Verbleib darüber könnte dazu beitragen, die bullische Struktur zu erhalten.
Unterstützung 2: $52.00
Ein anhaltender Rückgang unter dieses Niveau könnte die kurzfristige Kaufdynamik schwächen.
Niedrigere Unterstützung: $48.80
Sollte der Verkaufsdruck deutlich zunehmen, ist dies ein weiterer möglicher Bereich, den Trader beobachten könnten.
4. Warum bewegt sich DASH?
Mehrere Faktoren könnten die Kursentwicklung von DASH beeinflussen:
1. Technischer Ausbruch
Ein Anstieg über einen wichtigen gleitenden Durchschnitt kann Trader anziehen, die nach Momentum-Chancen suchen.
⚠️ Haftungsausschluss: Dieser Inhalt dient ausschließlich Bildungszwecken und ist keine Finanzberatung.

139
·
--
Übersetzung ansehen
$BTC Coin — Medium-Term Analysis
Market update: October 22, 2026
1. Market Overview
Bitcoin (BTC) is showing volatile price action. On October 22, BTC dropped below $82,000 after briefly moving above $84,000, as weakness in global stock markets put pressure on cryptocurrencies. Recent U.S. spot Bitcoin ETF inflows have provided some support, but the market has not confirmed a strong breakout yet.
2. Technical Analysis
Bullish scenario
If BTC reclaims $83,000 and breaks above $85,000, the next potential target is $87,000.
Support zone
$80,800–$81,000 is an important area to watch for buyers.
Bearish scenario
A sustained break below $80,800 could expose support near $77,400 and $76,100.
These are reference levels from the October 22 market analysis, not guaranteed price targets.
3. Medium-Term Outlook
My outlook is neutral to cautiously bullish if BTC holds its key support. Renewed ETF buying could help Bitcoin recover, but global economic uncertainty, oil prices, and interest-rate expectations remain risks. A confirmed move above $85,000 would strengthen the recovery case, while a breakdown below $80,800 would increase downside risk.
Final Verdict
Bitcoin is at an important decision point. Traders should watch the $80,800 support and the $83,000–$85,000 recovery zone before assuming the next major move will be upward.
Risk reminder: Cryptocurrency is highly volatile. Use stop-losses where appropriate and avoid risking money you cannot afford to lose. This analysis is educational, not financial advice.
#BinancePick #TeslaSlides5%PreMarket #KOSPISinks3.52%ToLowestCloseSinceApril #ChinaSeeksToSeize61800BTC
{spot}(BTCUSDT)
$BTC Coin — Medium-Term Analysis
Market update: October 22, 2026
1. Market Overview
Bitcoin (BTC) is showing volatile price action. On October 22, BTC dropped below $82,000 after briefly moving above $84,000, as weakness in global stock markets put pressure on cryptocurrencies. Recent U.S. spot Bitcoin ETF inflows have provided some support, but the market has not confirmed a strong breakout yet.
2. Technical Analysis
Bullish scenario
If BTC reclaims $83,000 and breaks above $85,000, the next potential target is $87,000.
Support zone
$80,800–$81,000 is an important area to watch for buyers.
Bearish scenario
A sustained break below $80,800 could expose support near $77,400 and $76,100.
These are reference levels from the October 22 market analysis, not guaranteed price targets.
3. Medium-Term Outlook
My outlook is neutral to cautiously bullish if BTC holds its key support. Renewed ETF buying could help Bitcoin recover, but global economic uncertainty, oil prices, and interest-rate expectations remain risks. A confirmed move above $85,000 would strengthen the recovery case, while a breakdown below $80,800 would increase downside risk.
Final Verdict
Bitcoin is at an important decision point. Traders should watch the $80,800 support and the $83,000–$85,000 recovery zone before assuming the next major move will be upward.
Risk reminder: Cryptocurrency is highly volatile. Use stop-losses where appropriate and avoid risking money you cannot afford to lose. This analysis is educational, not financial advice.
#BinancePick #TeslaSlides5%PreMarket #KOSPISinks3.52%ToLowestCloseSinceApril #ChinaSeeksToSeize61800BTC

83
Anmelden und weiter Inhalte entdecken
Krypto-Nutzer weltweit auf Binance Square kennenlernen
⚡️ Bleib in Sachen Krypto stets am Puls.
💬 Die weltgrößte Kryptobörse vertraut darauf.
👍 Erhalte verlässliche Einblicke von verifizierten Creators.
E-Mail-Adresse/Telefonnummer
Trendthemen
UniswapA16zSeekDeFiExemptionFromIllinoisCryptoTax
19,430 Aufrufe
668 Kommentare
Die Debatte über die Besteuerung von Kryptowährungen heizt sich auf, da Uniswap und Andreessen Horowitz ( a16z ) sich für eine Ausnahme für DeFi von den vorgeschlagenen Krypto-Steuervorschriften in Illinois einsetzen. Sie befürchten, dass dezentrale Finanzprotokolle und Plattformen ohne Verwahrungspflicht unfairen Steuerlasten ausgesetzt sein könnten, was Innovationen möglicherweise verlangsamt und die Entwicklung von Kryptowährungen erschwert. DeFi-Plattformen ermöglichen es Nutzern, digitale Vermögenswerte ohne traditionelle Intermediäre zu handeln und zu verwalten. Daher könnte die Anwendung herkömmlicher Finanzsteuervorschriften erhebliche Herausforderungen mit sich bringen. Dies könnte ein wichtiger Moment für die US-Kryptoindustrie werden, da die Regulierungsbehörden ein Gleichgewicht zwischen fairer Besteuerung, Anlegerschutz und Innovation finden müssen. 🚀
Die größte Sorge ist, dass die vorgeschlagene Steuer von 0,2 % auf den Transaktionswert und nicht einfach auf die Handelsgewinne berechnet wird. Uniswap, a16z und der DeFi Education Fund wollen Auszahlungen aus Wallets und Cross-Chain-Bridges davon ausnehmen und lehnen zugleich die Anforderungen zur Aufbewahrung von Private-Key-Aufzeichnungen ab. Illinois hat zugestimmt, die Einführung vorbehaltlich der gerichtlichen Genehmigung bis zum 1. Juli 2027 aufzuschieben. Das Ergebnis könnte beeinflussen, wie andere US-Bundesstaaten die Besteuerung von DeFi angehen. The Defiant +2
Was denkst du 🤔 ? Sollten DeFi-Transaktionen steuerfrei sein, um die Dezentralisierung zu schützen, oder sollten Krypto-Plattformen den traditionellen Steuervorschriften folgen ? 🤔
#UniswapA16zSeekDeFiExemptionFromIllinoisCryptoTax
Volatile
·3 Likes
·173 Aufrufe
HKDollarStablecoinHKDAPToLaunchOnSolana
13,518 Aufrufe
410 Kommentare
$1.5BInLeveragedCryptoBetsLiquidated
32,071 Aufrufe
233 Kommentare