
World Of Crypto
401 Beiträge

World Of Crypto
Melden
Nutzer blockieren
Trade eröffnen
Regelmäßiger Trader
2.3 Jahre
5 Following
19 Follower
104 Like gegeben
Beiträge
Portfolio
Alle
Zitierungen
$BTC Bitcoin wird derzeit bei etwa 62.786 $ gehandelt und steht weiterhin unter bärischem Druck. Die allgemeine Marktstruktur bleibt schwach, obwohl überverkaufte Bedingungen eine kurzfristige Erholungsrallye auslösen könnten.
📊 Aktueller Preis: 62.786 $
🔴 Trend: Bärisch
🟢 Unterstützung 1: 61.917 $
🟢 Unterstützung 2: 60.766 $
🔴 Widerstand 1: 64.772 $
🔴 Widerstand 2: 66.012 $
📉 Marktausblick:
Ein Rückgang unter 61.917 $ könnte BTC in Richtung 60.766 $ drücken. Ein kräftiger Ausbruch über 64.772 $ könnte jedoch den Weg in Richtung 66.012 $ freimachen.
{spot}(BTCUSDT)
#FOMCMinutesHighlightAIDebtRisks
$BTC Bitcoin wird derzeit bei etwa 62.786 $ gehandelt und steht weiterhin unter bärischem Druck. Die allgemeine Marktstruktur bleibt schwach, obwohl überverkaufte Bedingungen eine kurzfristige Erholungsrallye auslösen könnten.
📊 Aktueller Preis: 62.786 $
🔴 Trend: Bärisch
🟢 Unterstützung 1: 61.917 $
🟢 Unterstützung 2: 60.766 $
🔴 Widerstand 1: 64.772 $
🔴 Widerstand 2: 66.012 $
📉 Marktausblick:
Ein Rückgang unter 61.917 $ könnte BTC in Richtung 60.766 $ drücken. Ein kräftiger Ausbruch über 64.772 $ könnte jedoch den Weg in Richtung 66.012 $ freimachen.
#FOMCMinutesHighlightAIDebtRisks
📊 Aktueller Preis: 62.786 $
🔴 Trend: Bärisch
🟢 Unterstützung 1: 61.917 $
🟢 Unterstützung 2: 60.766 $
🔴 Widerstand 1: 64.772 $
🔴 Widerstand 2: 66.012 $
📉 Marktausblick:
Ein Rückgang unter 61.917 $ könnte BTC in Richtung 60.766 $ drücken. Ein kräftiger Ausbruch über 64.772 $ könnte jedoch den Weg in Richtung 66.012 $ freimachen.
#FOMCMinutesHighlightAIDebtRisks
12
Übersetzung ansehen
$PEPE /USDT – Professional Market Analysis
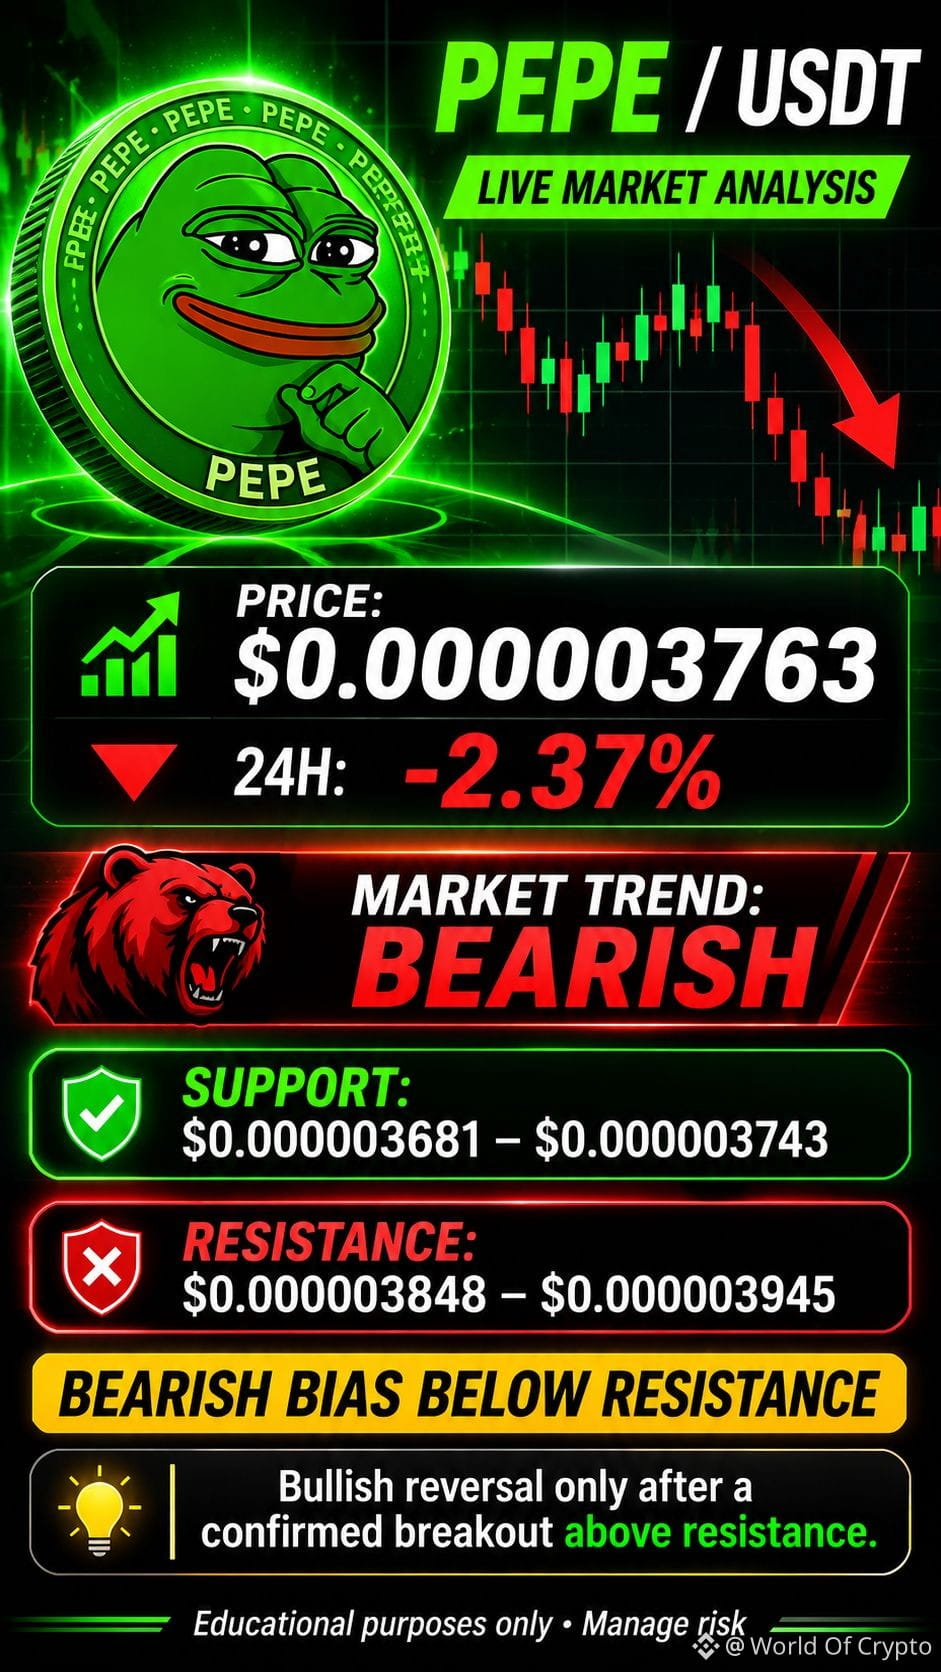
PEPE is currently trading around $0.00000376, down approximately 3.80% in the last 24 hours. The overall short-term structure remains bearish, with sellers maintaining pressure after a sharp weekly decline. Immediate support lies around $0.00000365–$0.00000370, while resistance is positioned near $0.00000383–$0.00000395. A breakdown below support could trigger further downside, whereas a strong recovery above $0.00000395 may open the door for a bullish rebound toward $0.00000410. Trading Outlook: Bearish until resistance is reclaimed. Avoid chasing entries and wait for confirmation with volume before taking a position.
#PEPE
{spot}(PEPEUSDT)
$PEPE /USDT – Professional Market Analysis
PEPE is currently trading around $0.00000376, down approximately 3.80% in the last 24 hours. The overall short-term structure remains bearish, with sellers maintaining pressure after a sharp weekly decline. Immediate support lies around $0.00000365–$0.00000370, while resistance is positioned near $0.00000383–$0.00000395. A breakdown below support could trigger further downside, whereas a strong recovery above $0.00000395 may open the door for a bullish rebound toward $0.00000410. Trading Outlook: Bearish until resistance is reclaimed. Avoid chasing entries and wait for confirmation with volume before taking a position.
#PEPE
PEPE is currently trading around $0.00000376, down approximately 3.80% in the last 24 hours. The overall short-term structure remains bearish, with sellers maintaining pressure after a sharp weekly decline. Immediate support lies around $0.00000365–$0.00000370, while resistance is positioned near $0.00000383–$0.00000395. A breakdown below support could trigger further downside, whereas a strong recovery above $0.00000395 may open the door for a bullish rebound toward $0.00000410. Trading Outlook: Bearish until resistance is reclaimed. Avoid chasing entries and wait for confirmation with volume before taking a position.
#PEPE
112
Übersetzung ansehen
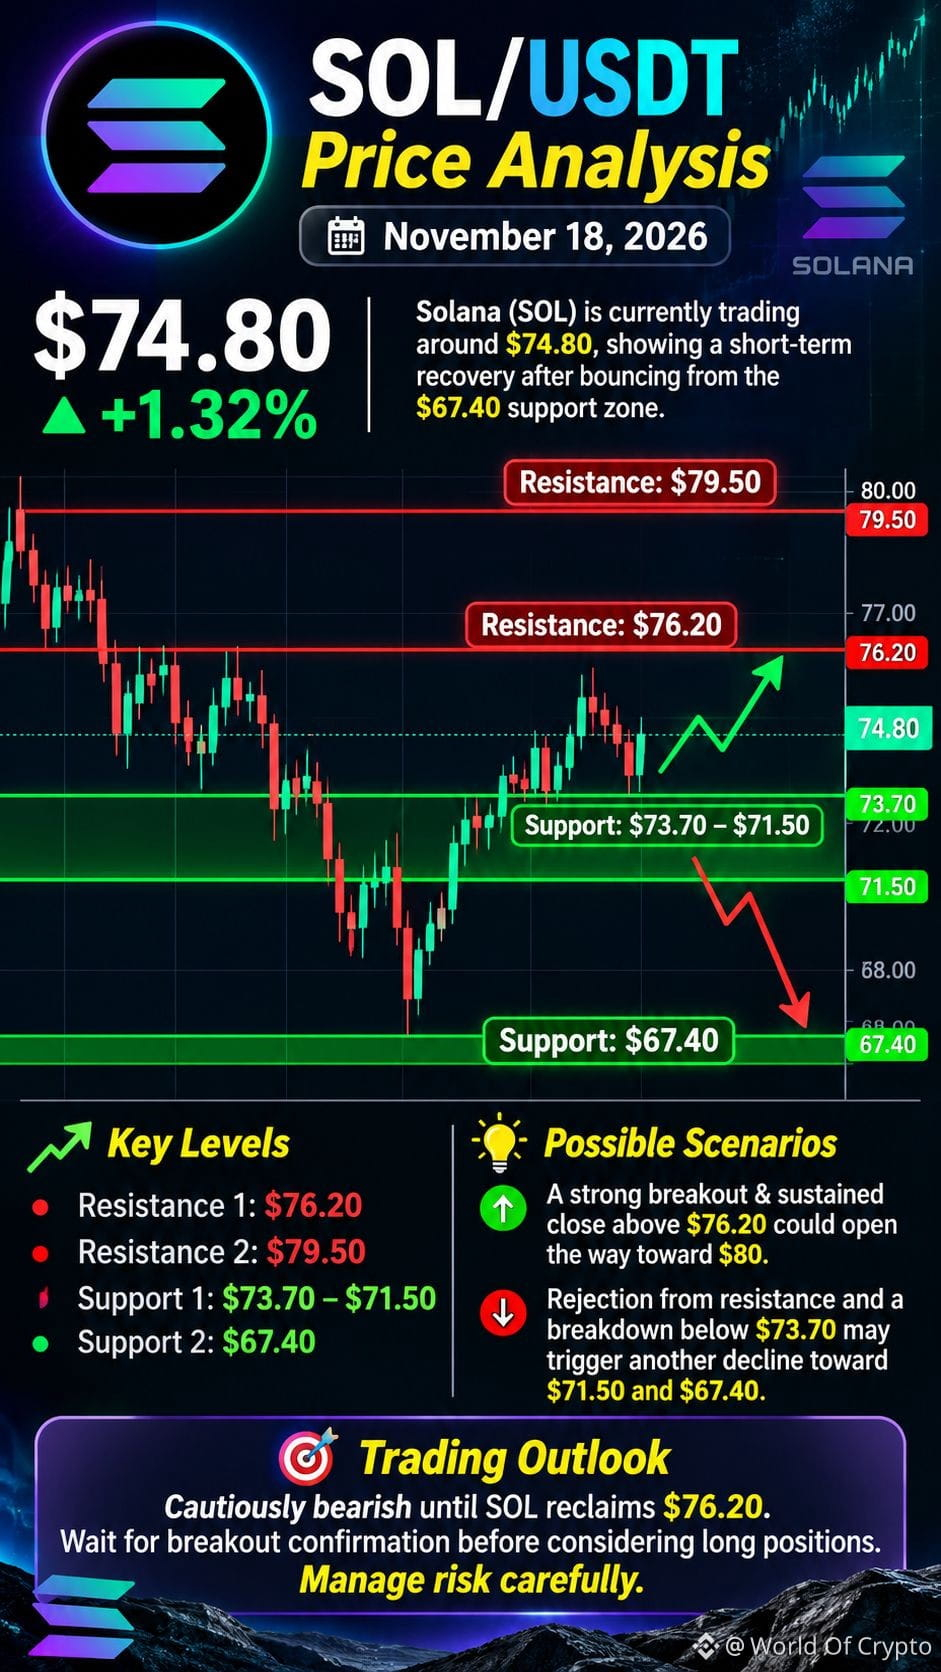
Solana ($SOL ) is currently trading around $74.80, showing a short-term recovery after bouncing from the $67.40 support zone. Buyers are attempting to regain control, but the overall market structure remains bearish. Immediate support is located at $73.70–$71.50, while resistance stands at $76.20 and $79.50. A strong breakout and sustained close above $76.20 could open the way toward $80, whereas rejection from resistance and a breakdown below $73.70 may trigger another decline toward $71.50 and $67.40. Trading Outlook: Cautiously bearish until SOL reclaims $76.20. Wait for breakout confirmation before considering long positions. Manage risk carefully.
{spot}(SOLUSDT)
Solana ($SOL ) is currently trading around $74.80, showing a short-term recovery after bouncing from the $67.40 support zone. Buyers are attempting to regain control, but the overall market structure remains bearish. Immediate support is located at $73.70–$71.50, while resistance stands at $76.20 and $79.50. A strong breakout and sustained close above $76.20 could open the way toward $80, whereas rejection from resistance and a breakdown below $73.70 may trigger another decline toward $71.50 and $67.40. Trading Outlook: Cautiously bearish until SOL reclaims $76.20. Wait for breakout confirmation before considering long positions. Manage risk carefully.
76
Übersetzung ansehen
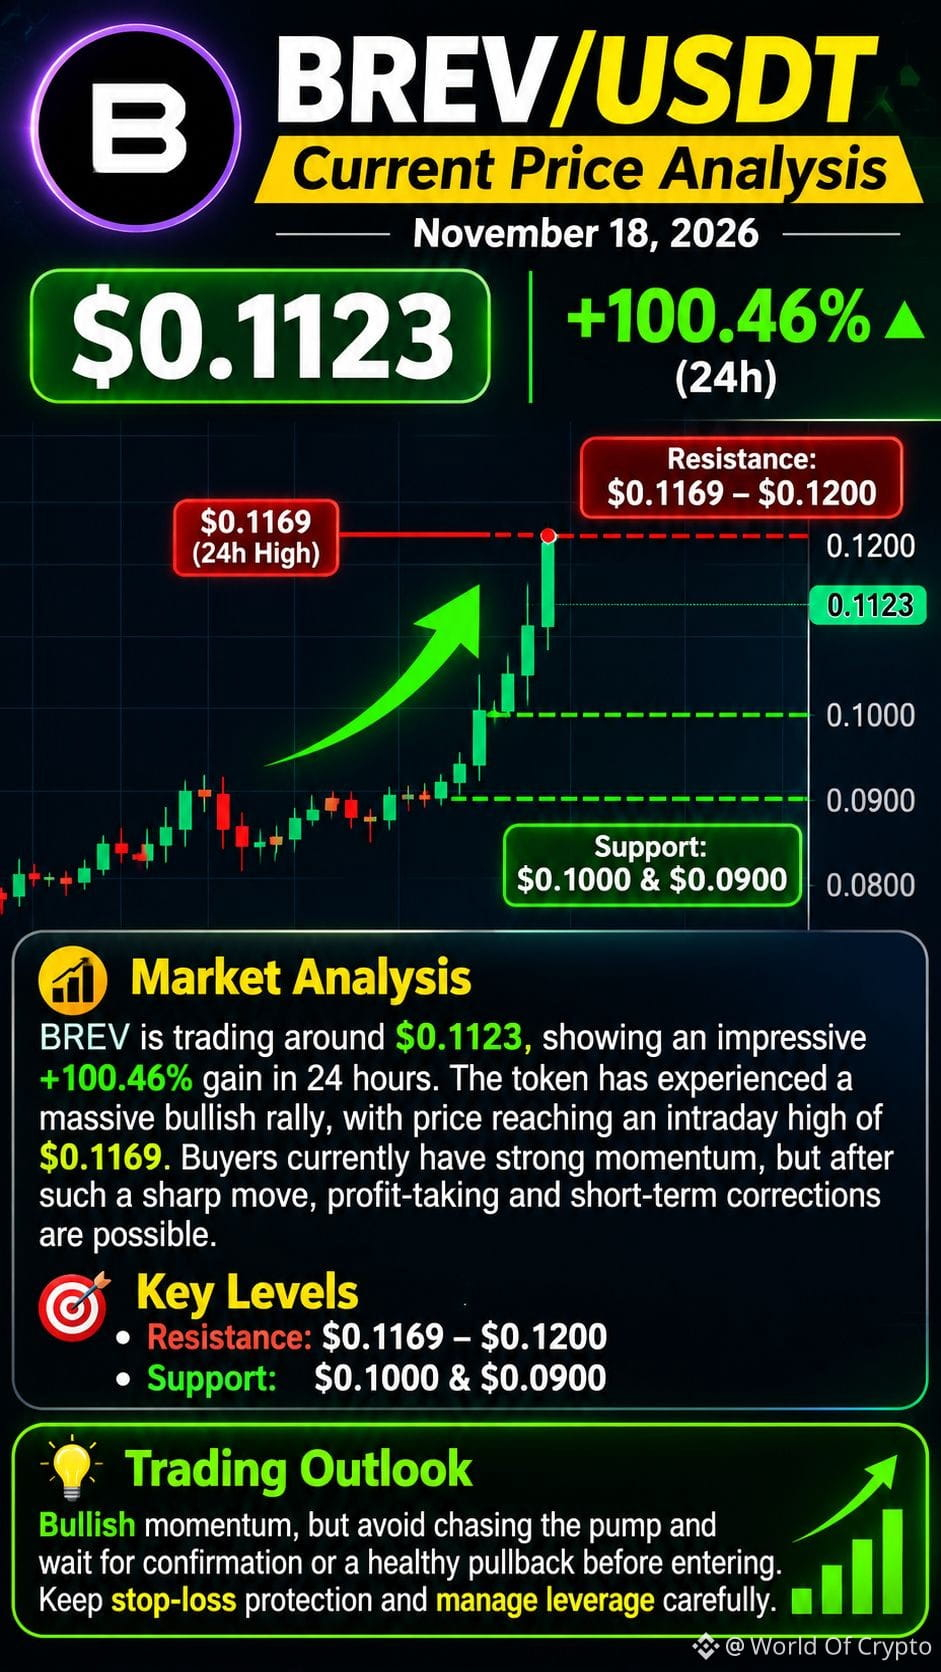
$BREV is trading around $0.1123, showing an impressive +100.46% gain in 24 hours. The token has experienced a massive bullish rally, with price reaching an intraday high of $0.1169. Buyers currently have strong momentum, but after such a sharp move, profit-taking and short-term corrections are possible. Immediate resistance is around $0.1169–$0.1200, while $0.1000 and $0.0900 are important psychological support zones. A confirmed breakout above $0.1200 could open the door for further upside, whereas losing $0.1000 may trigger a deeper correction. Trading Outlook: Bullish momentum, but avoid chasing the pump and wait for confirmation or a healthy pullback before entering. Keep stop-loss protection and manage leverage carefully.
{spot}(BREVUSDT)
#KOSPIFalls2.59%ToLowestCloseSinceFebruary
$BREV is trading around $0.1123, showing an impressive +100.46% gain in 24 hours. The token has experienced a massive bullish rally, with price reaching an intraday high of $0.1169. Buyers currently have strong momentum, but after such a sharp move, profit-taking and short-term corrections are possible. Immediate resistance is around $0.1169–$0.1200, while $0.1000 and $0.0900 are important psychological support zones. A confirmed breakout above $0.1200 could open the door for further upside, whereas losing $0.1000 may trigger a deeper correction. Trading Outlook: Bullish momentum, but avoid chasing the pump and wait for confirmation or a healthy pullback before entering. Keep stop-loss protection and manage leverage carefully.
#KOSPIFalls2.59%ToLowestCloseSinceFebruary
#KOSPIFalls2.59%ToLowestCloseSinceFebruary
72
Übersetzung ansehen
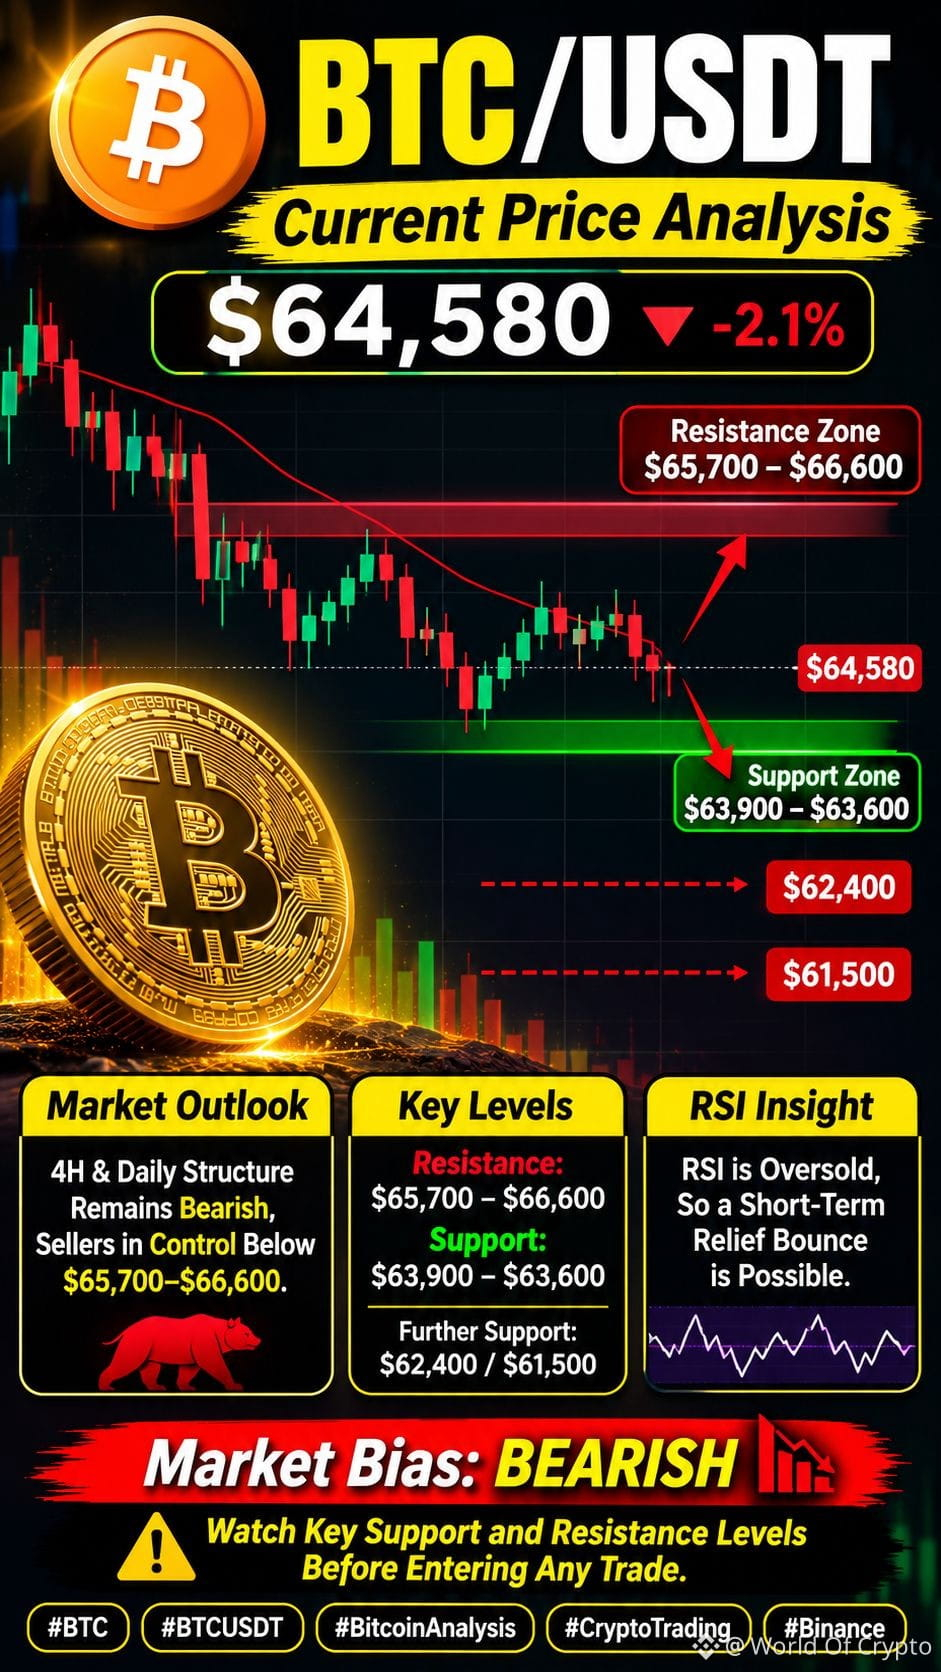
$BTC Bitcoin is currently trading around $64,580, showing continued bearish momentum. The overall 4H and daily market structure remains bearish, with sellers maintaining control below the $65,700–$66,600 resistance zone. Immediate support is located at $63,900–$63,600, while a breakdown could push BTC towards $62,400 and potentially $61,500. On the upside, a strong breakout above $65,700 could trigger a recovery towards $66,600. RSI is showing oversold conditions, so a short-term relief bounce is possible, but bullish confirmation is still missing. Market Bias: BEARISH — Watch key support and resistance levels before entering any trade.
{spot}(BTCUSDT)
#KOSPIFalls2.59%ToLowestCloseSinceFebruary
$BTC Bitcoin is currently trading around $64,580, showing continued bearish momentum. The overall 4H and daily market structure remains bearish, with sellers maintaining control below the $65,700–$66,600 resistance zone. Immediate support is located at $63,900–$63,600, while a breakdown could push BTC towards $62,400 and potentially $61,500. On the upside, a strong breakout above $65,700 could trigger a recovery towards $66,600. RSI is showing oversold conditions, so a short-term relief bounce is possible, but bullish confirmation is still missing. Market Bias: BEARISH — Watch key support and resistance levels before entering any trade.
#KOSPIFalls2.59%ToLowestCloseSinceFebruary
#KOSPIFalls2.59%ToLowestCloseSinceFebruary
67
Übersetzung ansehen
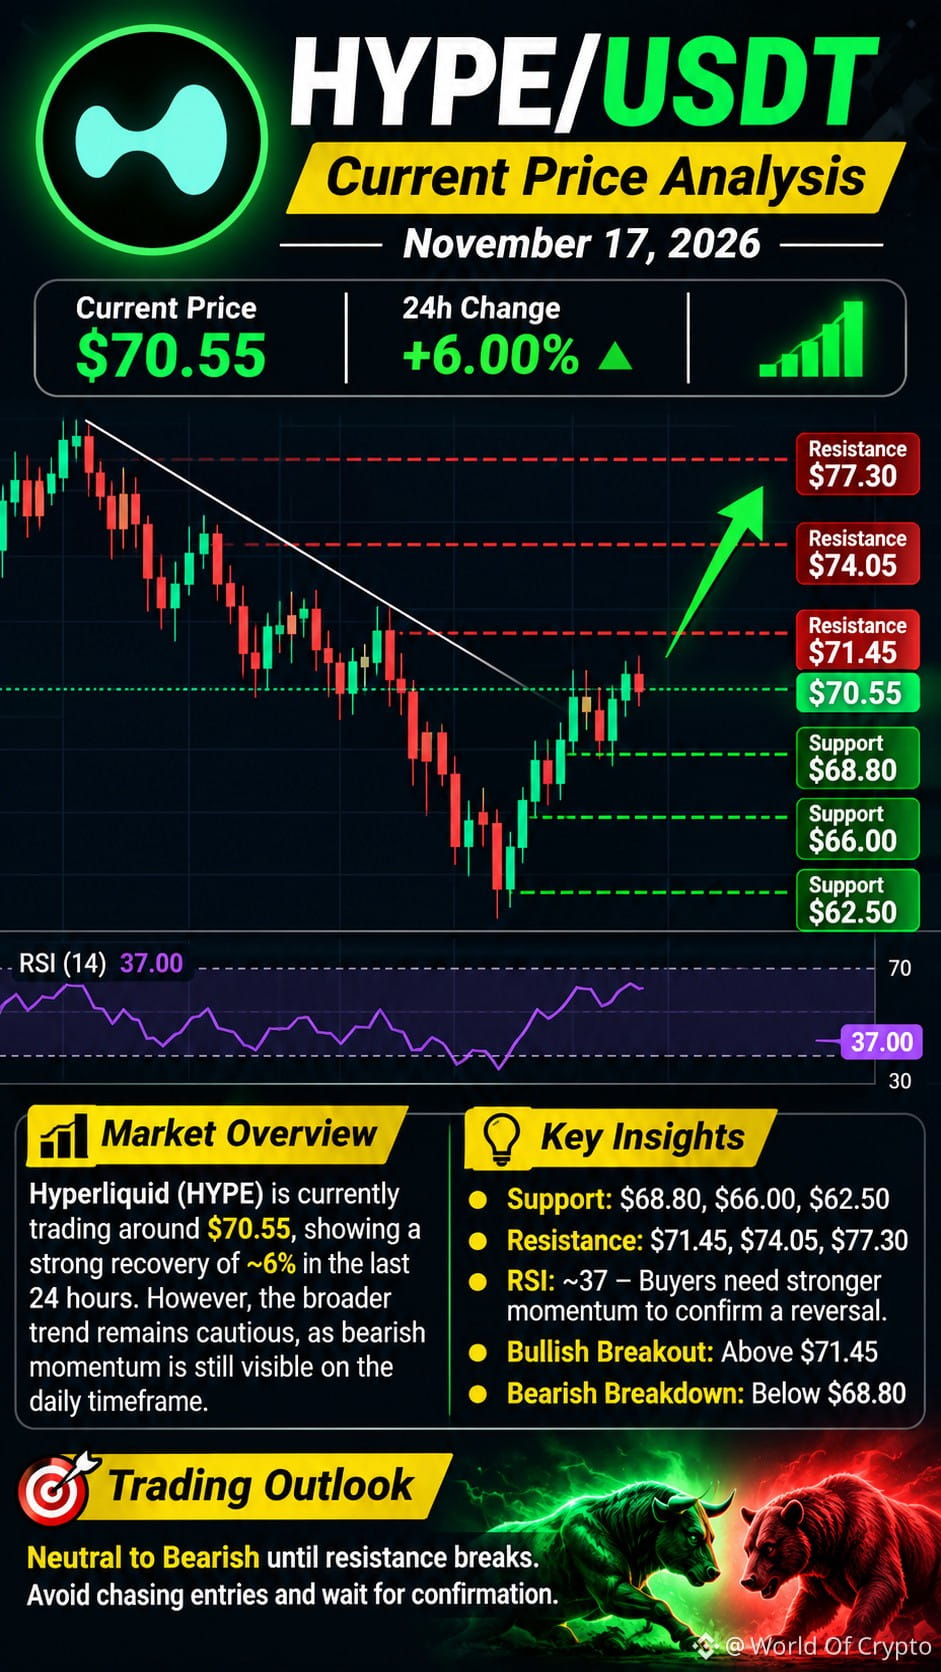
Hyperliquid ($HYPE ) is currently trading around $70.55, showing a strong recovery of approximately 6% in the last 24 hours. However, the broader trend remains cautious, as bearish momentum is still visible on the daily timeframe. Immediate support is located at $68.80, followed by $66.00 and $62.50, while resistance stands at $71.45, $74.05 and $77.30. A confirmed breakout above $71.45 with strong volume could trigger further upside toward $74–$77. On the downside, losing $68.80 may expose HYPE to another correction toward $66.00. RSI remains relatively weak near 37, suggesting buyers still need stronger momentum to confirm a trend reversal. Trading Outlook: Neutral to Bearish until resistance breaks. Avoid chasing entries and wait for confirmation
{spot}(HYPEUSDT)
#NvidiaBoardNotConsideringHuang’sReturnasCEO
Hyperliquid ($HYPE ) is currently trading around $70.55, showing a strong recovery of approximately 6% in the last 24 hours. However, the broader trend remains cautious, as bearish momentum is still visible on the daily timeframe. Immediate support is located at $68.80, followed by $66.00 and $62.50, while resistance stands at $71.45, $74.05 and $77.30. A confirmed breakout above $71.45 with strong volume could trigger further upside toward $74–$77. On the downside, losing $68.80 may expose HYPE to another correction toward $66.00. RSI remains relatively weak near 37, suggesting buyers still need stronger momentum to confirm a trend reversal. Trading Outlook: Neutral to Bearish until resistance breaks. Avoid chasing entries and wait for confirmation
#NvidiaBoardNotConsideringHuang’sReturnasCEO
#NvidiaBoardNotConsideringHuang’sReturnasCEO
38
Übersetzung ansehen
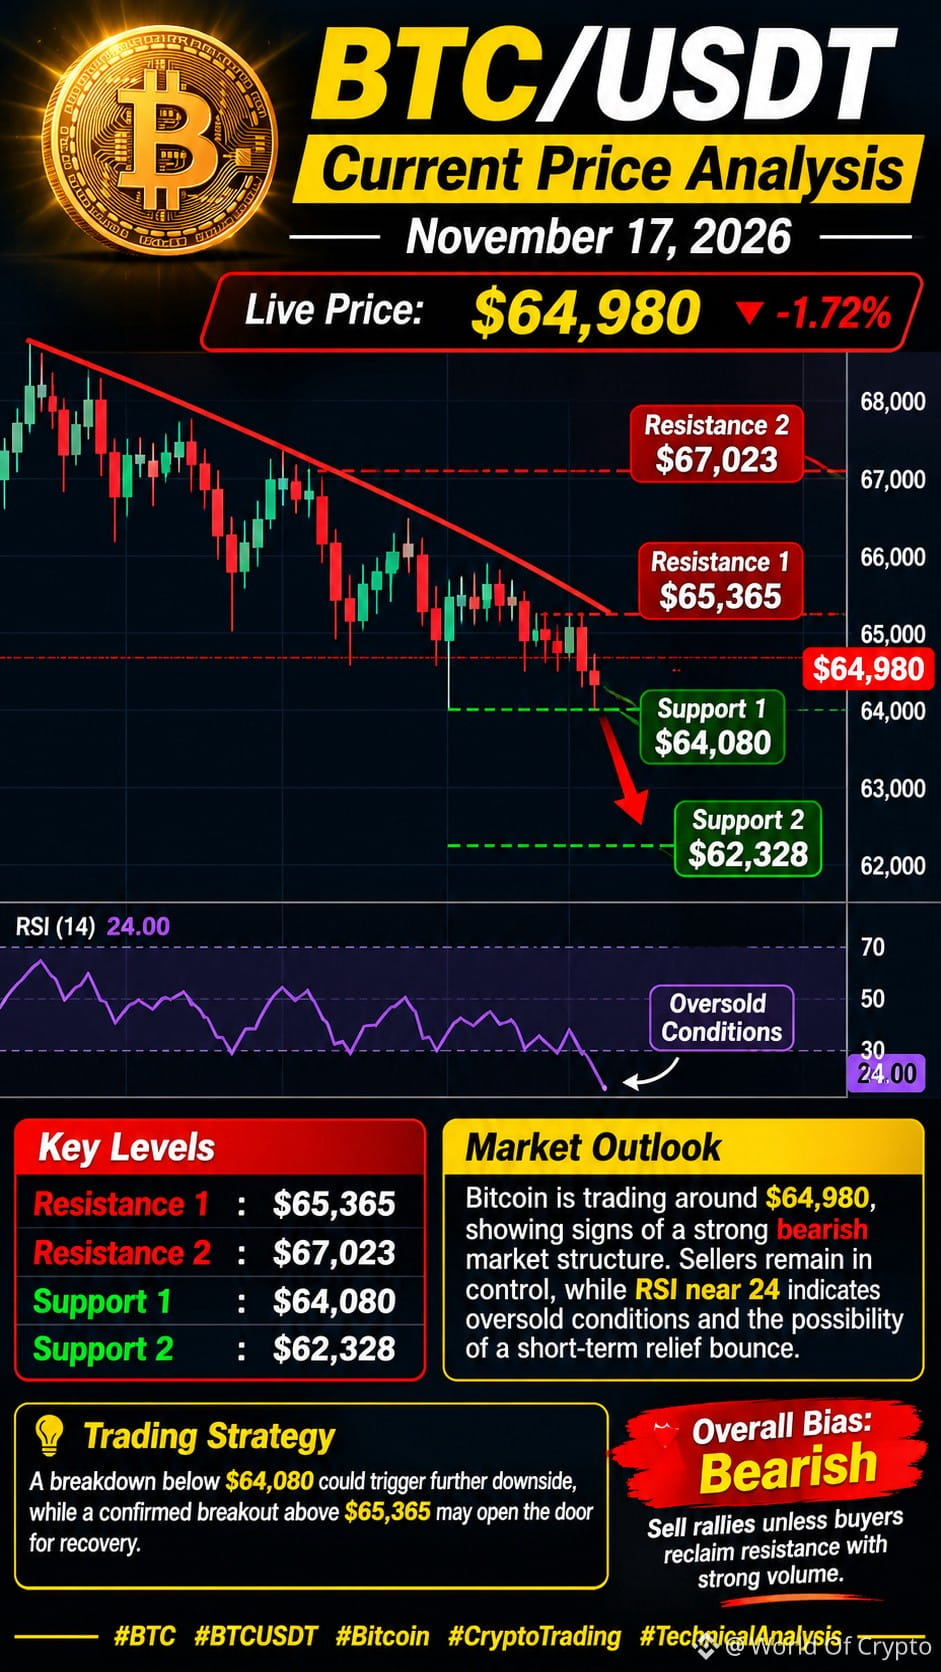
$BTC Bitcoin is trading around $64,980, showing signs of a strong bearish market structure. Sellers remain in control, while RSI near 24 indicates oversold conditions and the possibility of a short-term relief bounce. Immediate support is located at $64,080, followed by $62,328. On the upside, BTC needs to reclaim $65,365 to build bullish momentum, with $67,023 as the next resistance. A breakdown below $64,080 could trigger further downside, while a confirmed breakout above $65,365 may open the door to recovery. Overall Bias: Bearish – Sell rallies unless buyers reclaim resistance with strong volume.
{spot}(BTCUSDT)
#AnthropicIPOTestsInvestorAppetiteForAI
$BTC Bitcoin is trading around $64,980, showing signs of a strong bearish market structure. Sellers remain in control, while RSI near 24 indicates oversold conditions and the possibility of a short-term relief bounce. Immediate support is located at $64,080, followed by $62,328. On the upside, BTC needs to reclaim $65,365 to build bullish momentum, with $67,023 as the next resistance. A breakdown below $64,080 could trigger further downside, while a confirmed breakout above $65,365 may open the door to recovery. Overall Bias: Bearish – Sell rallies unless buyers reclaim resistance with strong volume.
#AnthropicIPOTestsInvestorAppetiteForAI
#AnthropicIPOTestsInvestorAppetiteForAI
2
Übersetzung ansehen
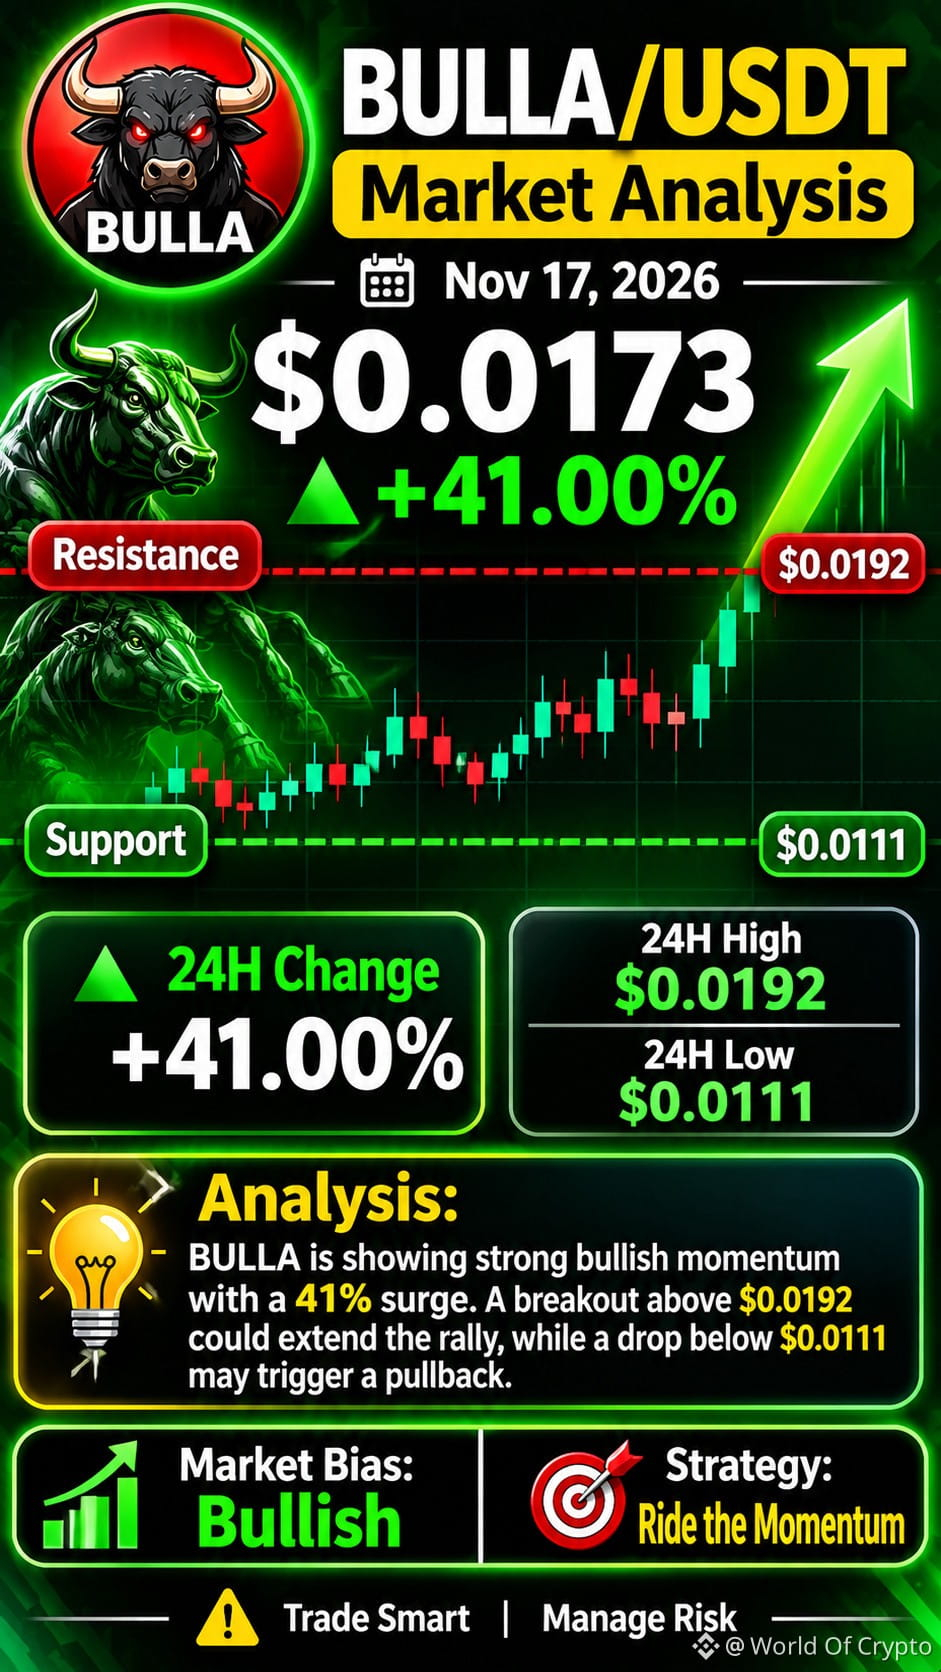
$BULLA is trading around $0.0168–$0.0173, facing heavy selling pressure after a sharp 24-hour decline of approximately 36%. Immediate resistance stands near $0.0192, while support is around $0.0111. A recovery above resistance could trigger a short-term bounce, but a breakdown below support may extend bearish momentum. Wait for strong buying volume and confirmation before entering.
{future}(BULLAUSDT)
#AnthropicIPOTestsInvestorAppetiteForAI
$BULLA is trading around $0.0168–$0.0173, facing heavy selling pressure after a sharp 24-hour decline of approximately 36%. Immediate resistance stands near $0.0192, while support is around $0.0111. A recovery above resistance could trigger a short-term bounce, but a breakdown below support may extend bearish momentum. Wait for strong buying volume and confirmation before entering.
#AnthropicIPOTestsInvestorAppetiteForAI
#AnthropicIPOTestsInvestorAppetiteForAI
125
$BLESS /USDT – Professionelle Marktanalyse
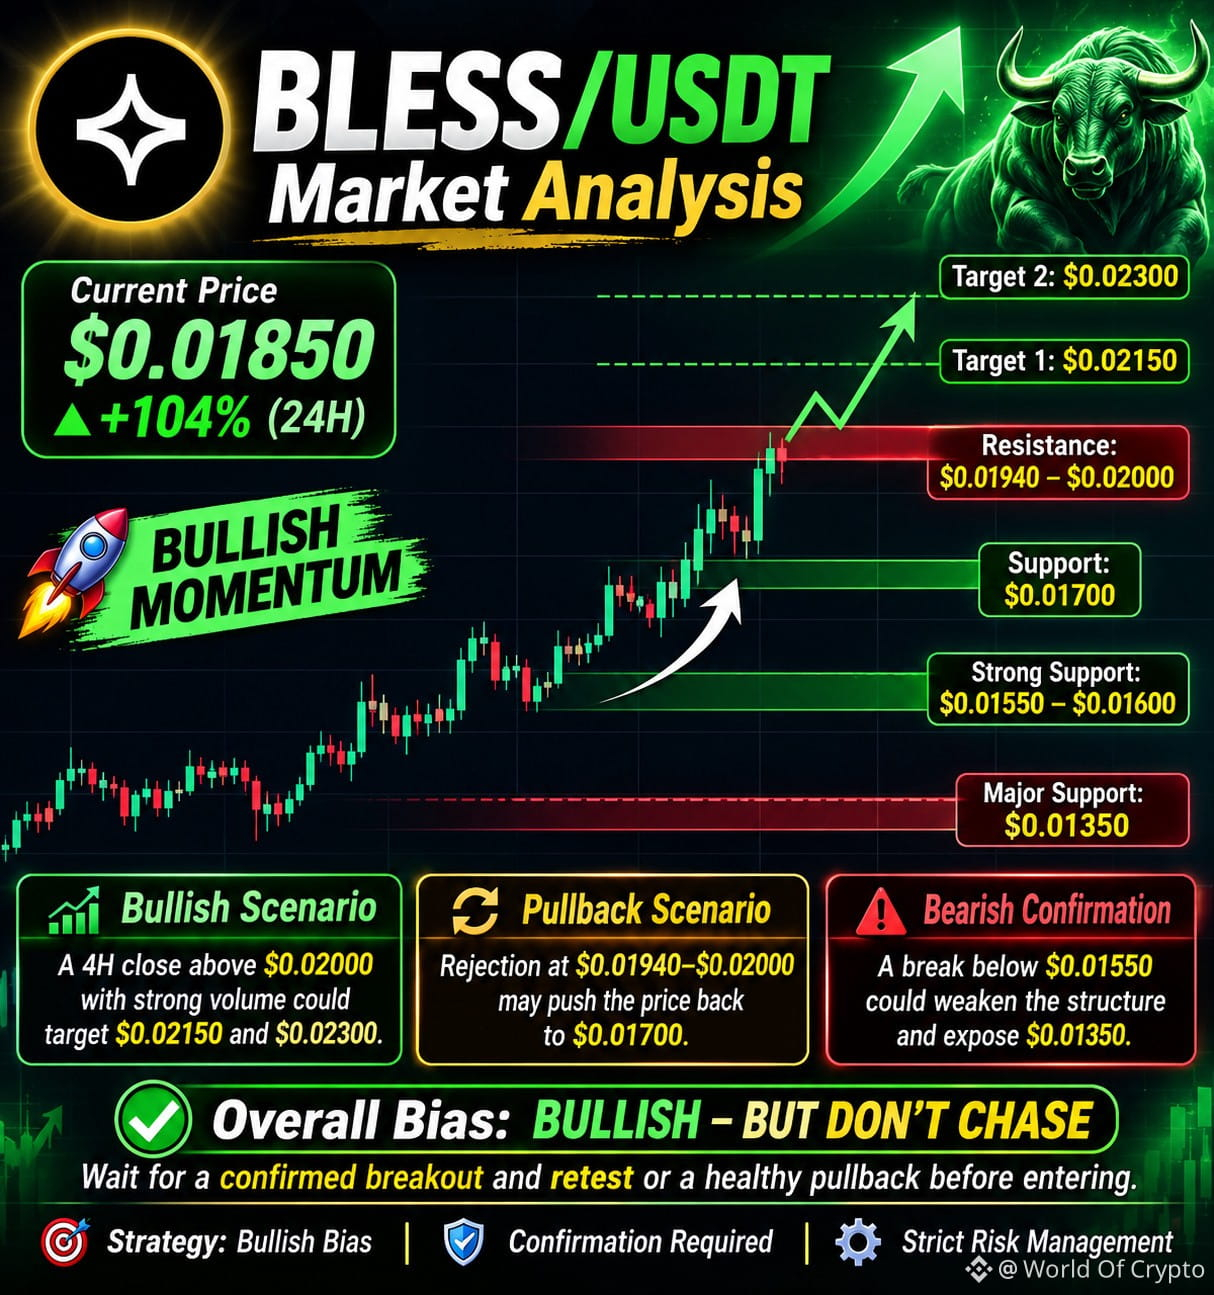
BLESS zeigt nach einer beeindruckenden Rallye eine starke Aufwärtsdynamik, während die Käufer die Kontrolle über die kurzfristige Marktstruktur behalten. Der wichtige Widerstandsbereich liegt bei 0,01940–0,02000 $, und ein bestätigter 4-Stunden-Ausbruch über dieses Niveau bei hohem Volumen könnte den Weg in Richtung 0,02150 $ und 0,02300 $ ebnen. Auf der Unterseite liegt die unmittelbare Unterstützung bei etwa 0,01700 $, gefolgt von einer stärkeren Nachfragezone bei 0,01550–0,01600 $. Ein Durchbruch unter 0,01550 $ könnte die Aufwärtsdynamik schwächen und einen Rückgang bis auf 0,01350 $ ermöglichen. Aus professioneller Trading-Perspektive bleibt die Gesamteinschätzung bullisch, doch es ist mit erheblichen Risiken verbunden, dem Kurs nach einer derart starken Rallye hinterherzulaufen. Trader sollten auf einen bestätigten Ausbruch mit anschließendem Retest oder einen gesunden Rücksetzer warten, bevor sie neue Positionen eingehen. Strategie: Bullische Einschätzung | Bestätigung erforderlich | Striktes Risikomanagement.
{future}(BLESSUSDT)
$BLESS /USDT – Professionelle Marktanalyse
BLESS zeigt nach einer beeindruckenden Rallye eine starke Aufwärtsdynamik, während die Käufer die Kontrolle über die kurzfristige Marktstruktur behalten. Der wichtige Widerstandsbereich liegt bei 0,01940–0,02000 $, und ein bestätigter 4-Stunden-Ausbruch über dieses Niveau bei hohem Volumen könnte den Weg in Richtung 0,02150 $ und 0,02300 $ ebnen. Auf der Unterseite liegt die unmittelbare Unterstützung bei etwa 0,01700 $, gefolgt von einer stärkeren Nachfragezone bei 0,01550–0,01600 $. Ein Durchbruch unter 0,01550 $ könnte die Aufwärtsdynamik schwächen und einen Rückgang bis auf 0,01350 $ ermöglichen. Aus professioneller Trading-Perspektive bleibt die Gesamteinschätzung bullisch, doch es ist mit erheblichen Risiken verbunden, dem Kurs nach einer derart starken Rallye hinterherzulaufen. Trader sollten auf einen bestätigten Ausbruch mit anschließendem Retest oder einen gesunden Rücksetzer warten, bevor sie neue Positionen eingehen. Strategie: Bullische Einschätzung | Bestätigung erforderlich | Striktes Risikomanagement.
BLESS zeigt nach einer beeindruckenden Rallye eine starke Aufwärtsdynamik, während die Käufer die Kontrolle über die kurzfristige Marktstruktur behalten. Der wichtige Widerstandsbereich liegt bei 0,01940–0,02000 $, und ein bestätigter 4-Stunden-Ausbruch über dieses Niveau bei hohem Volumen könnte den Weg in Richtung 0,02150 $ und 0,02300 $ ebnen. Auf der Unterseite liegt die unmittelbare Unterstützung bei etwa 0,01700 $, gefolgt von einer stärkeren Nachfragezone bei 0,01550–0,01600 $. Ein Durchbruch unter 0,01550 $ könnte die Aufwärtsdynamik schwächen und einen Rückgang bis auf 0,01350 $ ermöglichen. Aus professioneller Trading-Perspektive bleibt die Gesamteinschätzung bullisch, doch es ist mit erheblichen Risiken verbunden, dem Kurs nach einer derart starken Rallye hinterherzulaufen. Trader sollten auf einen bestätigten Ausbruch mit anschließendem Retest oder einen gesunden Rücksetzer warten, bevor sie neue Positionen eingehen. Strategie: Bullische Einschätzung | Bestätigung erforderlich | Striktes Risikomanagement.
286
🚀 HYPE/USDT-Kursanalyse
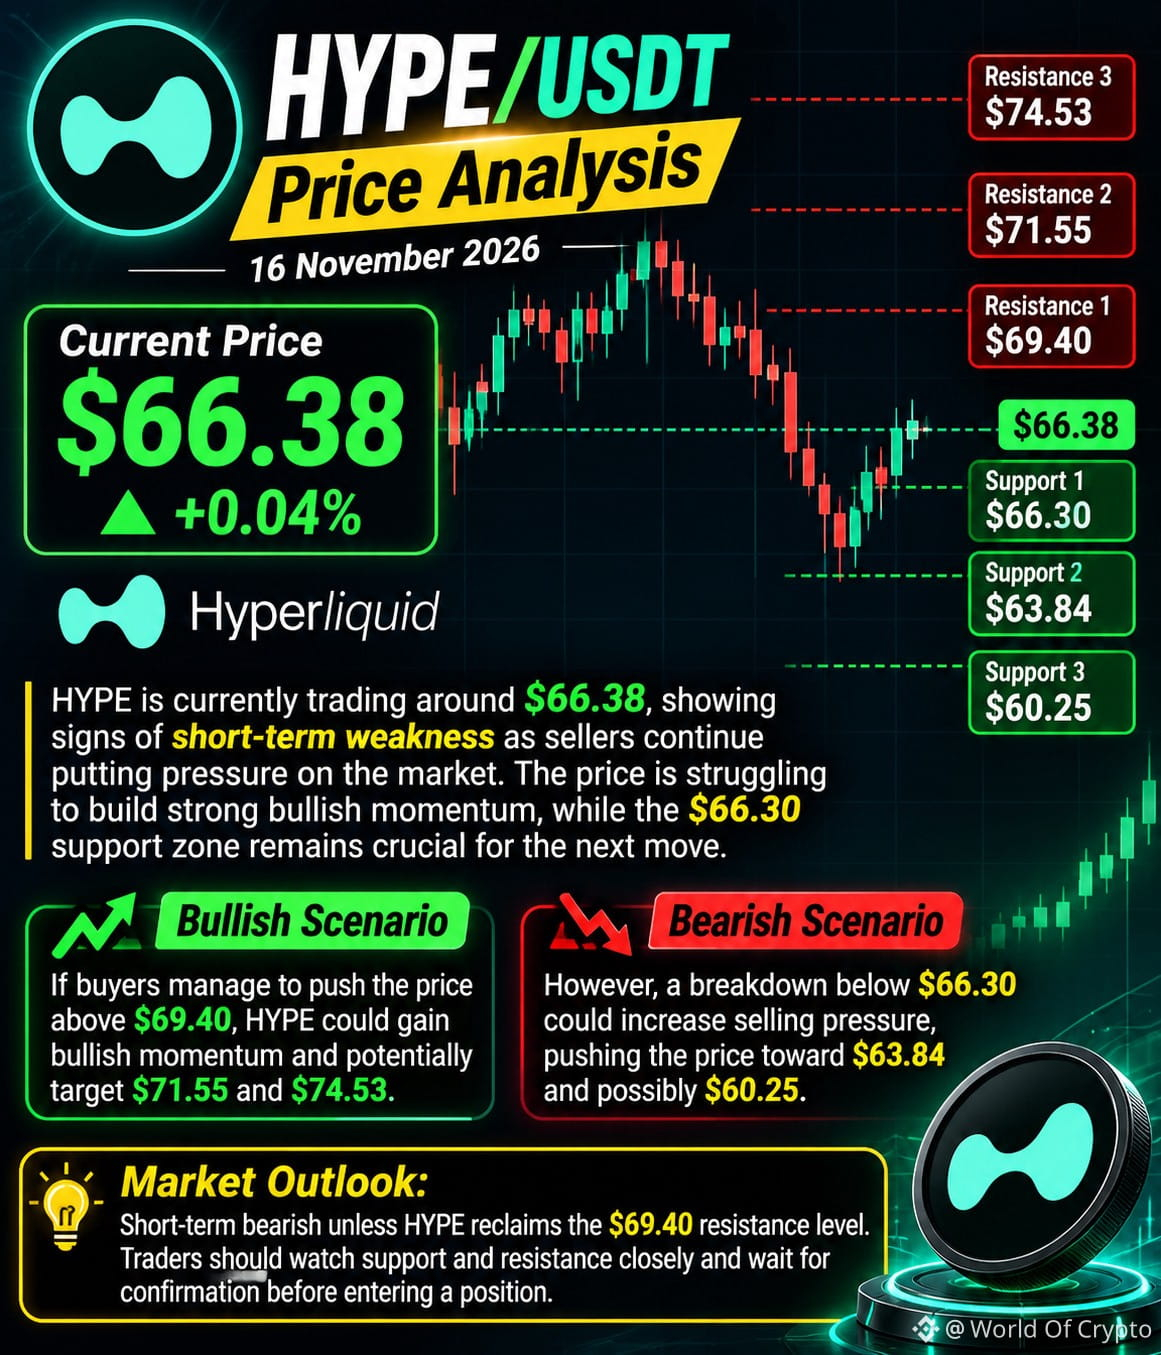
HYPE wird derzeit bei etwa 66,38 $ gehandelt und zeigt Anzeichen kurzfristiger Schwäche, da Verkäufer weiterhin Druck auf den Markt ausüben. Der Kurs tut sich schwer, eine starke Aufwärtsdynamik aufzubauen, während die Unterstützungszone bei 66,30 $ für die nächste Bewegung entscheidend bleibt.
Sollten die Käufer den Kurs über 69,40 $ treiben, könnte HYPE an Aufwärtsdynamik gewinnen und möglicherweise 71,55 $ und 74,53 $ anvisieren. Ein Durchbruch unter 66,30 $ könnte jedoch den Verkaufsdruck erhöhen und den Kurs in Richtung 63,84 $ und möglicherweise 60,25 $ drücken.
Marktausblick: Kurzfristig bearish, solange HYPE nicht wieder über den Widerstand bei 69,40 $ steigt. Händler sollten die Unterstützungs- und Widerstandsniveaus genau beobachten und vor dem Einstieg auf eine Bestätigung warten.
{spot}(HYPEUSDT)
#HYPE
🚀 HYPE/USDT-Kursanalyse
HYPE wird derzeit bei etwa 66,38 $ gehandelt und zeigt Anzeichen kurzfristiger Schwäche, da Verkäufer weiterhin Druck auf den Markt ausüben. Der Kurs tut sich schwer, eine starke Aufwärtsdynamik aufzubauen, während die Unterstützungszone bei 66,30 $ für die nächste Bewegung entscheidend bleibt.
Sollten die Käufer den Kurs über 69,40 $ treiben, könnte HYPE an Aufwärtsdynamik gewinnen und möglicherweise 71,55 $ und 74,53 $ anvisieren. Ein Durchbruch unter 66,30 $ könnte jedoch den Verkaufsdruck erhöhen und den Kurs in Richtung 63,84 $ und möglicherweise 60,25 $ drücken.
Marktausblick: Kurzfristig bearish, solange HYPE nicht wieder über den Widerstand bei 69,40 $ steigt. Händler sollten die Unterstützungs- und Widerstandsniveaus genau beobachten und vor dem Einstieg auf eine Bestätigung warten.
#HYPE
HYPE wird derzeit bei etwa 66,38 $ gehandelt und zeigt Anzeichen kurzfristiger Schwäche, da Verkäufer weiterhin Druck auf den Markt ausüben. Der Kurs tut sich schwer, eine starke Aufwärtsdynamik aufzubauen, während die Unterstützungszone bei 66,30 $ für die nächste Bewegung entscheidend bleibt.
Sollten die Käufer den Kurs über 69,40 $ treiben, könnte HYPE an Aufwärtsdynamik gewinnen und möglicherweise 71,55 $ und 74,53 $ anvisieren. Ein Durchbruch unter 66,30 $ könnte jedoch den Verkaufsdruck erhöhen und den Kurs in Richtung 63,84 $ und möglicherweise 60,25 $ drücken.
Marktausblick: Kurzfristig bearish, solange HYPE nicht wieder über den Widerstand bei 69,40 $ steigt. Händler sollten die Unterstützungs- und Widerstandsniveaus genau beobachten und vor dem Einstieg auf eine Bestätigung warten.
#HYPE
1
312
Übersetzung ansehen
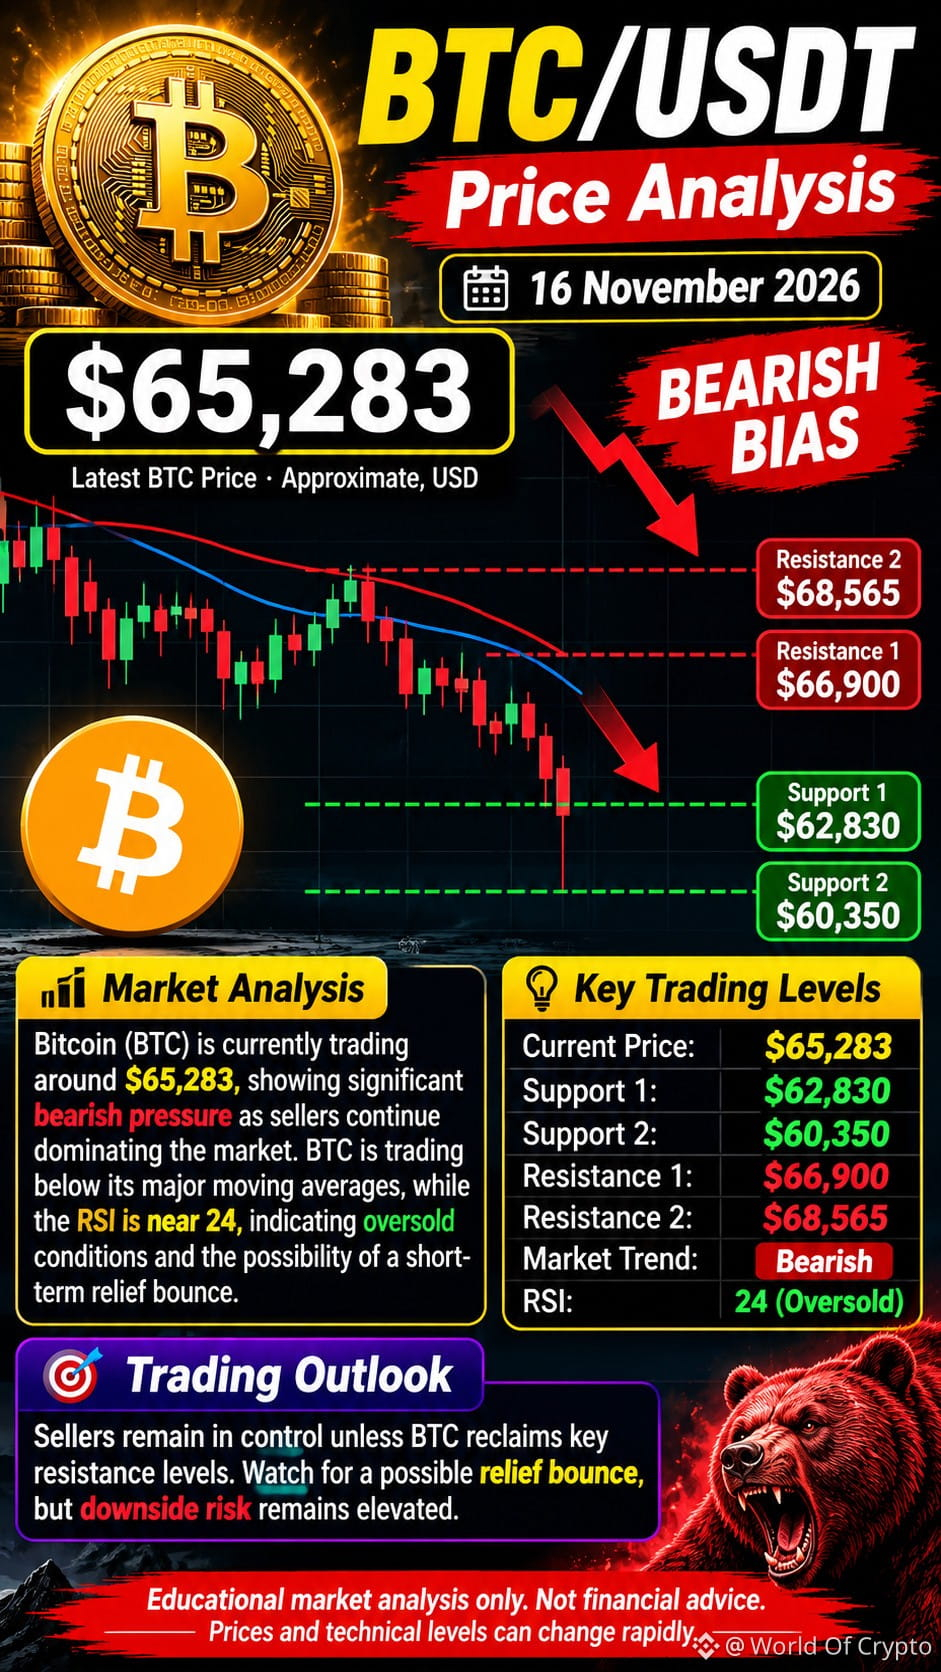
Bitcoin ($BTC ) is currently trading around $65,283, showing significant bearish pressure as sellers continue dominating the market. BTC is trading below its major moving averages, while the RSI is near 24, indicating oversold conditions and the possibility of a short-term relief bounce. Immediate resistance stands at $66,900, followed by $68,500. On the downside, $62,800 is an important support level, while a breakdown could push BTC toward $60,350. If buyers successfully reclaim $66,900 and maintain momentum above $68,500, a stronger recovery could develop. For now, the overall trend remains bearish, and traders should watch for confirmation before entering new positions.
{spot}(BTCUSDT)
#HuangReportedlyConsidersReturnToNvidia
Bitcoin ($BTC ) is currently trading around $65,283, showing significant bearish pressure as sellers continue dominating the market. BTC is trading below its major moving averages, while the RSI is near 24, indicating oversold conditions and the possibility of a short-term relief bounce. Immediate resistance stands at $66,900, followed by $68,500. On the downside, $62,800 is an important support level, while a breakdown could push BTC toward $60,350. If buyers successfully reclaim $66,900 and maintain momentum above $68,500, a stronger recovery could develop. For now, the overall trend remains bearish, and traders should watch for confirmation before entering new positions.
#HuangReportedlyConsidersReturnToNvidia
#HuangReportedlyConsidersReturnToNvidia
42
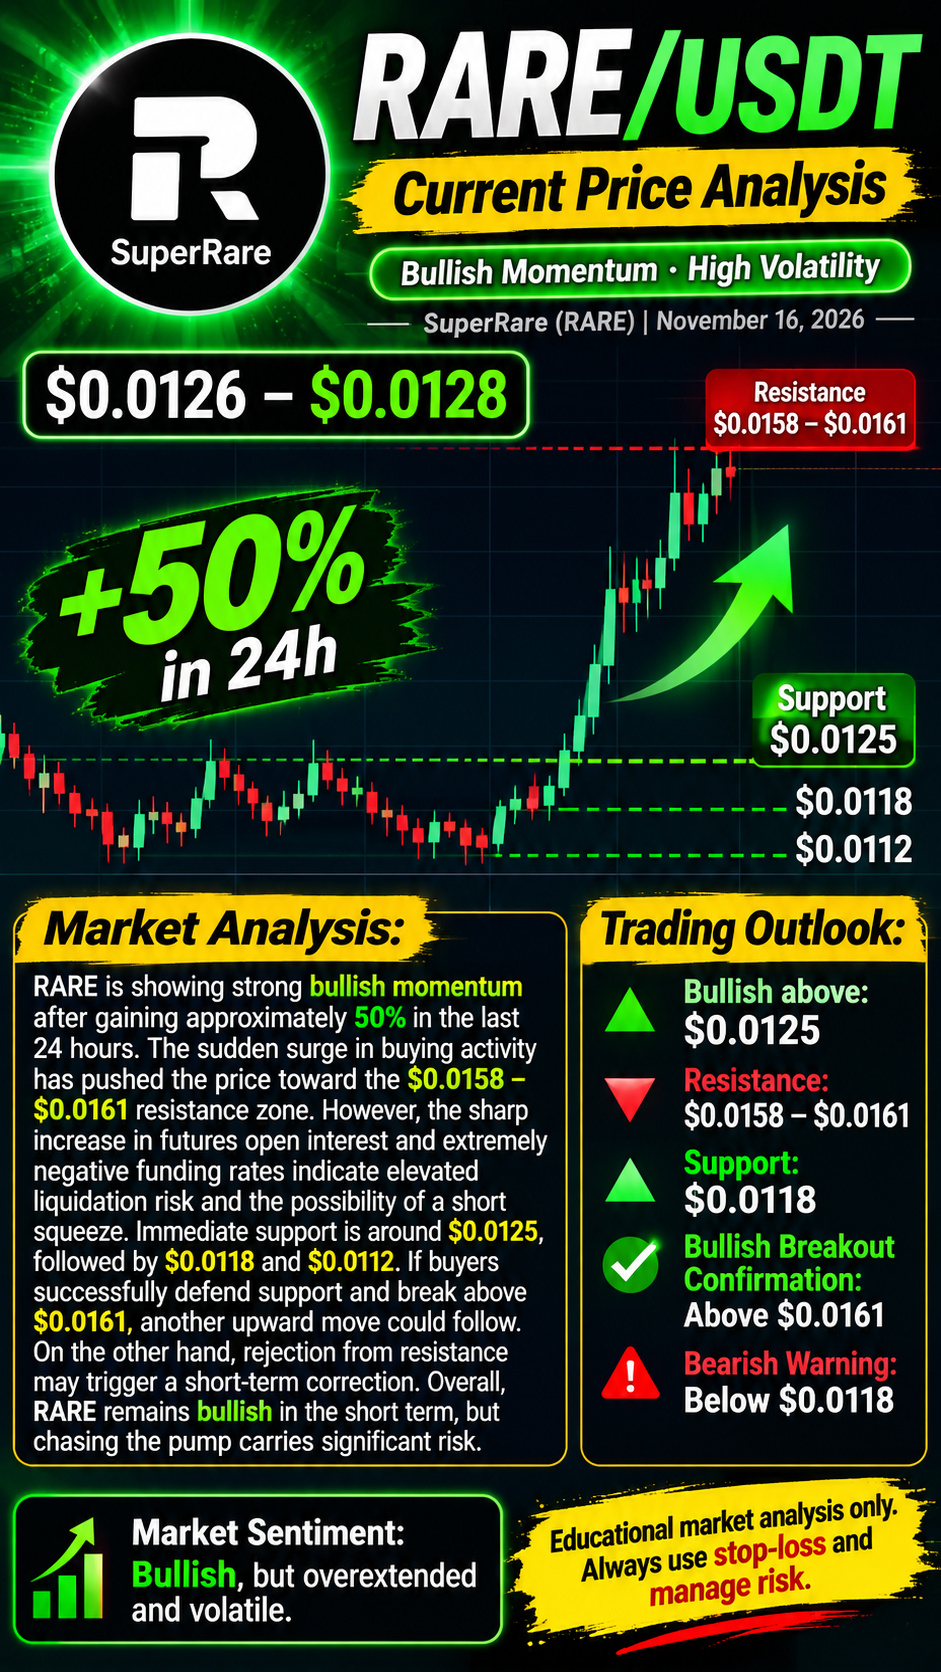
$RARE zeigt nach einem Anstieg von etwa 50 % innerhalb der letzten 24 Stunden eine starke Aufwärtsdynamik. Der plötzliche Anstieg der Kaufaktivität hat den Preis in Richtung der Widerstandszone bei 0,0158–0,0161 $ getrieben. Der starke Anstieg des Open Interest bei Futures und die extrem negativen Finanzierungssätze deuten jedoch auf ein erhöhtes Liquidationsrisiko und die Möglichkeit eines Short Squeeze hin. Die unmittelbare Unterstützung liegt bei etwa 0,0125 $, gefolgt von 0,0118 $ und 0,0112 $. Sollten die Käufer die Unterstützung erfolgreich verteidigen und die Marke von 0,0161 $ überschreiten, könnte ein weiterer Aufwärtsimpuls folgen. Eine Zurückweisung am Widerstand könnte hingegen eine kurzfristige Korrektur auslösen. Insgesamt bleibt RARE kurzfristig bullisch, doch dem Pump hinterherzujagen ist mit erheblichen Risiken verbunden.
{spot}(RAREUSDT)
#RAREBULLISH
$RARE zeigt nach einem Anstieg von etwa 50 % innerhalb der letzten 24 Stunden eine starke Aufwärtsdynamik. Der plötzliche Anstieg der Kaufaktivität hat den Preis in Richtung der Widerstandszone bei 0,0158–0,0161 $ getrieben. Der starke Anstieg des Open Interest bei Futures und die extrem negativen Finanzierungssätze deuten jedoch auf ein erhöhtes Liquidationsrisiko und die Möglichkeit eines Short Squeeze hin. Die unmittelbare Unterstützung liegt bei etwa 0,0125 $, gefolgt von 0,0118 $ und 0,0112 $. Sollten die Käufer die Unterstützung erfolgreich verteidigen und die Marke von 0,0161 $ überschreiten, könnte ein weiterer Aufwärtsimpuls folgen. Eine Zurückweisung am Widerstand könnte hingegen eine kurzfristige Korrektur auslösen. Insgesamt bleibt RARE kurzfristig bullisch, doch dem Pump hinterherzujagen ist mit erheblichen Risiken verbunden.
#RAREBULLISH
#RAREBULLISH
116
Übersetzung ansehen
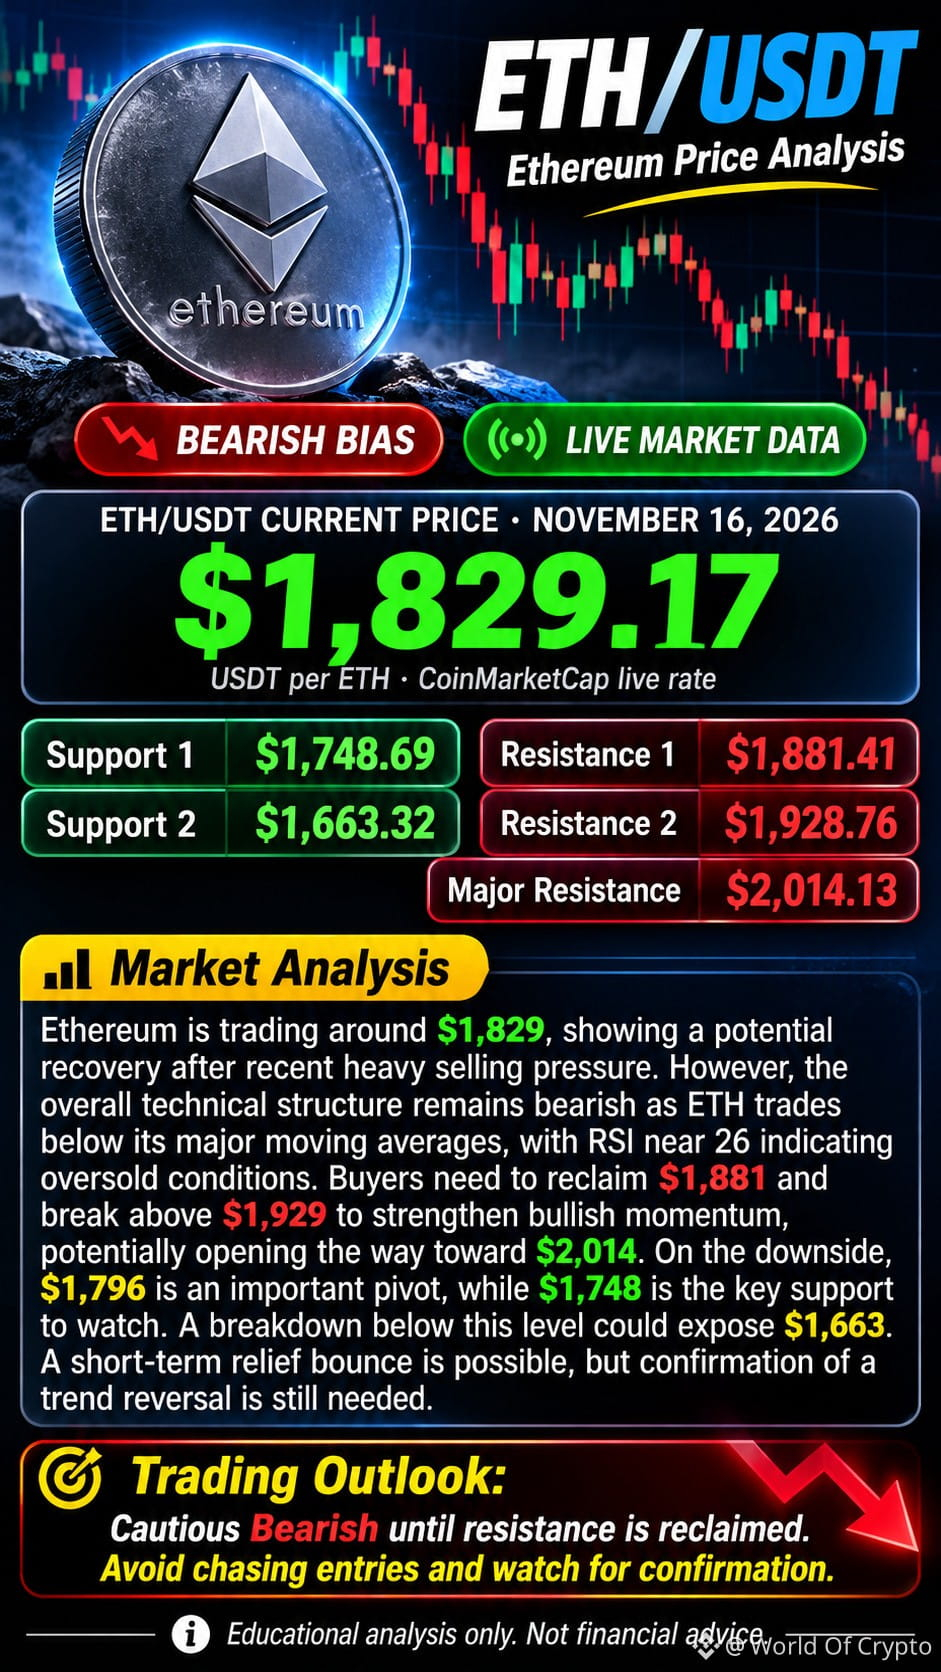
$ETH Ethereum is trading around $1,829, showing a potential recovery after recent heavy selling pressure. However, the overall technical structure remains bearish as ETH trades below its major moving averages, with RSI near 26 indicating oversold conditions. Buyers need to reclaim $1,881 and break above $1,929 to strengthen bullish momentum, potentially opening the way toward $2,014. On the downside, $1,796 is an important pivot, while $1,748 is the key support to watch. A breakdown below this level could expose $1,663. A short-term relief bounce is possible, but confirmation of a trend reversal is still needed.
{spot}(ETHUSDT)
#CryptoSelloffTriggersMultipleWhaleLiquidations
$ETH Ethereum is trading around $1,829, showing a potential recovery after recent heavy selling pressure. However, the overall technical structure remains bearish as ETH trades below its major moving averages, with RSI near 26 indicating oversold conditions. Buyers need to reclaim $1,881 and break above $1,929 to strengthen bullish momentum, potentially opening the way toward $2,014. On the downside, $1,796 is an important pivot, while $1,748 is the key support to watch. A breakdown below this level could expose $1,663. A short-term relief bounce is possible, but confirmation of a trend reversal is still needed.
#CryptoSelloffTriggersMultipleWhaleLiquidations
#CryptoSelloffTriggersMultipleWhaleLiquidations
90
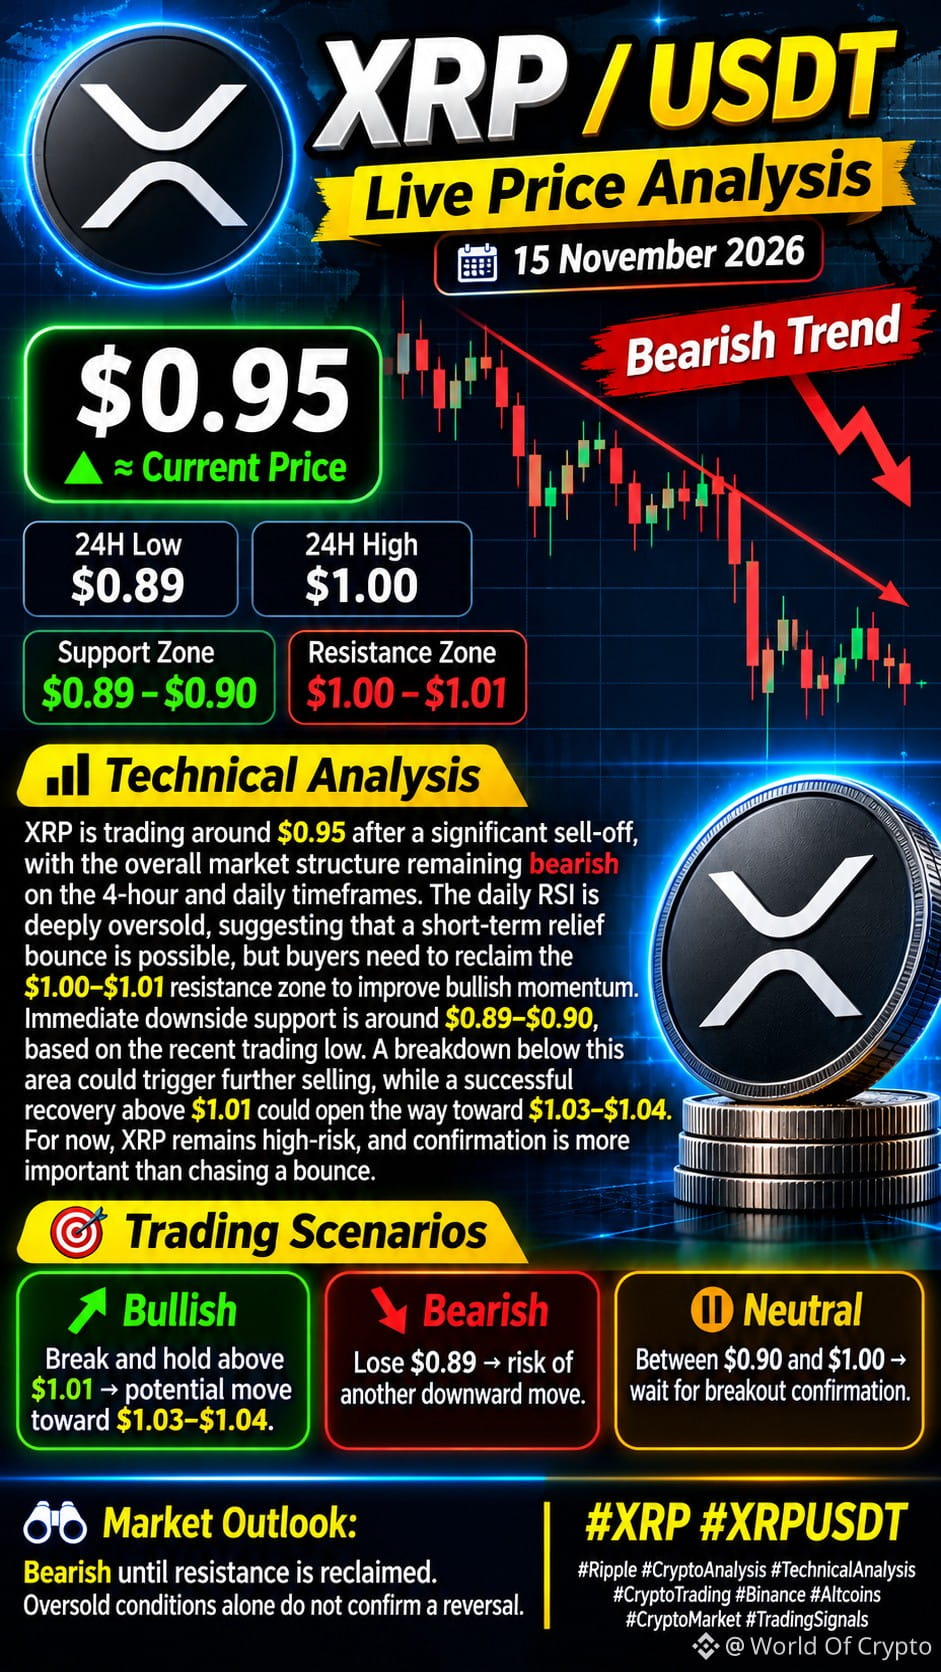
$XRP wird nach einem deutlichen Ausverkauf bei etwa 0,95 $ gehandelt, während die übergeordnete Marktstruktur sowohl im 4-Stunden- als auch im Tageschart weiterhin bearish ist. Der tägliche RSI befindet sich tief im überverkauften Bereich, was auf eine mögliche kurzfristige Erholungsrallye hindeutet. Um die bullische Dynamik zu verbessern, müssen Käufer jedoch die Widerstandszone bei 1,00–1,01 $ zurückerobern. Die unmittelbare Unterstützung nach unten liegt aufgrund des jüngsten Handelstiefs bei etwa 0,89–0,90 $. Ein Durchbruch unter diesen Bereich könnte weitere Verkäufe auslösen, während eine erfolgreiche Erholung über 1,01 $ den Weg in Richtung 1,03–1,04 $ ebnen könnte. Vorerst bleibt XRP mit hohem Risiko verbunden, und eine Bestätigung ist wichtiger, als einer Erholung hinterherzujagen.
{spot}(XRPUSDT)
#USSpotXRPETFsSeeLargestWeeklyOutflowIn8Months
$XRP wird nach einem deutlichen Ausverkauf bei etwa 0,95 $ gehandelt, während die übergeordnete Marktstruktur sowohl im 4-Stunden- als auch im Tageschart weiterhin bearish ist. Der tägliche RSI befindet sich tief im überverkauften Bereich, was auf eine mögliche kurzfristige Erholungsrallye hindeutet. Um die bullische Dynamik zu verbessern, müssen Käufer jedoch die Widerstandszone bei 1,00–1,01 $ zurückerobern. Die unmittelbare Unterstützung nach unten liegt aufgrund des jüngsten Handelstiefs bei etwa 0,89–0,90 $. Ein Durchbruch unter diesen Bereich könnte weitere Verkäufe auslösen, während eine erfolgreiche Erholung über 1,01 $ den Weg in Richtung 1,03–1,04 $ ebnen könnte. Vorerst bleibt XRP mit hohem Risiko verbunden, und eine Bestätigung ist wichtiger, als einer Erholung hinterherzujagen.
#USSpotXRPETFsSeeLargestWeeklyOutflowIn8Months
#USSpotXRPETFsSeeLargestWeeklyOutflowIn8Months
44
Übersetzung ansehen
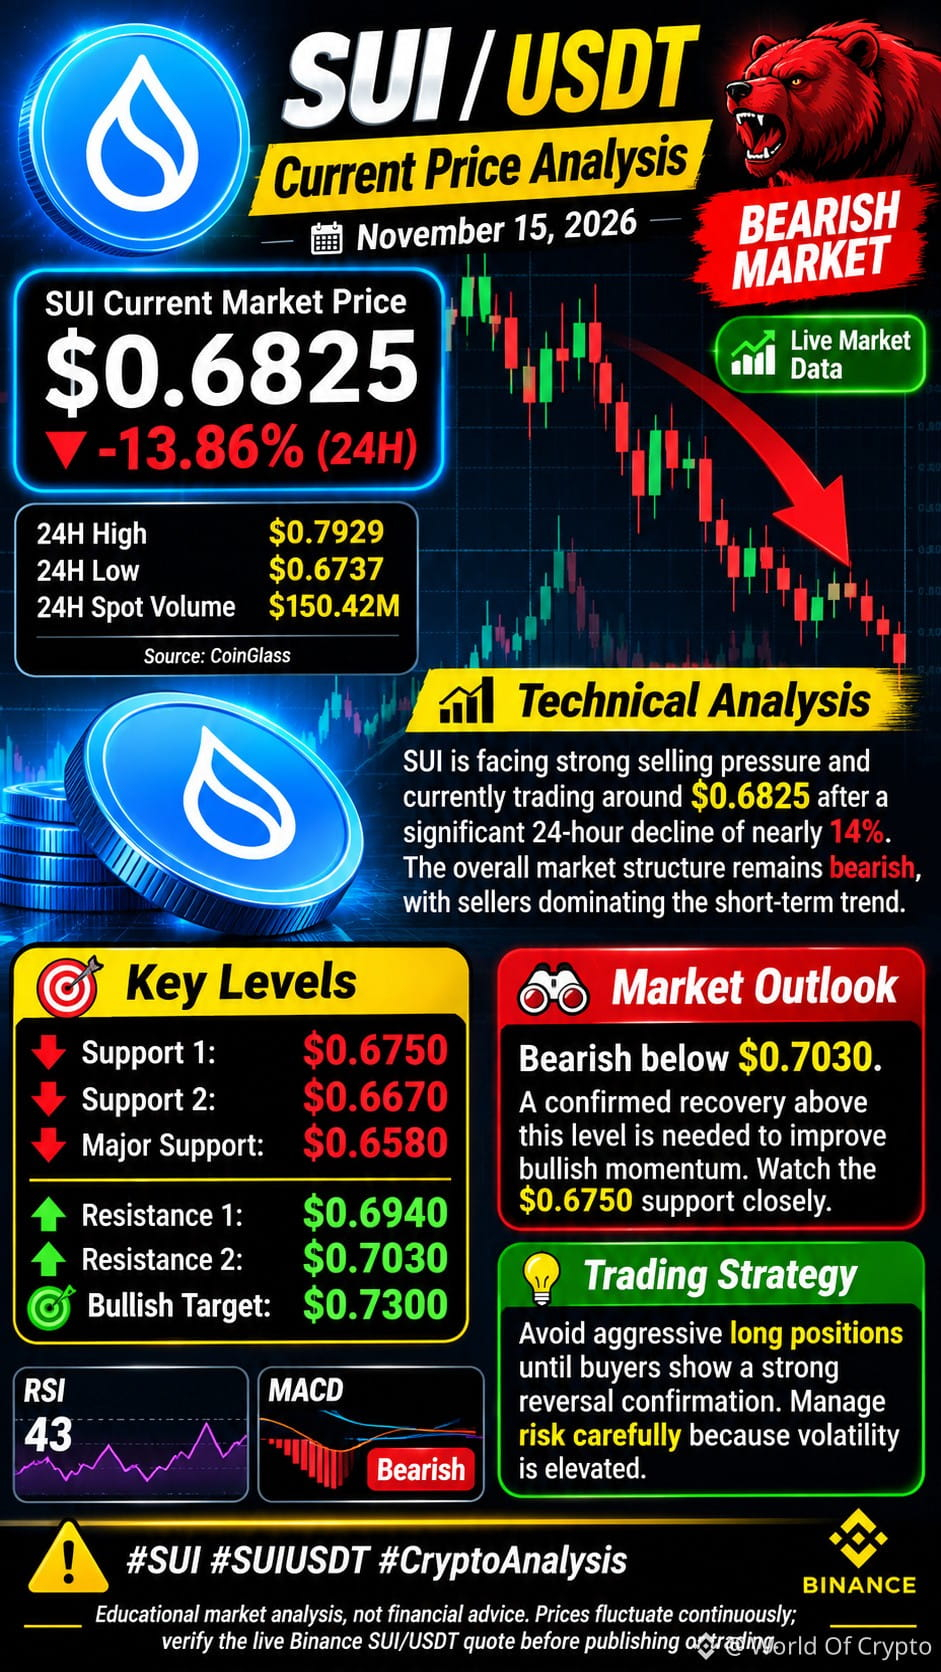
$SUI is facing strong selling pressure and currently trading around $0.6825 after a significant 24-hour decline of nearly 14%. The overall market structure remains bearish, with sellers dominating the short-term trend. The immediate support zone is around $0.6750–$0.6670. If this zone breaks, further downside toward $0.6580 could become possible. On the upside, $0.6940 and $0.7030 are immediate resistance levels. A strong breakout above $0.7030 could open the door for a recovery toward $0.7300. RSI is around 43, while MACD remains bearish, confirming weak momentum.
{spot}(SUIUSDT)
#USSpotXRPETFsSeeLargestWeeklyOutflowIn8Months
$SUI is facing strong selling pressure and currently trading around $0.6825 after a significant 24-hour decline of nearly 14%. The overall market structure remains bearish, with sellers dominating the short-term trend. The immediate support zone is around $0.6750–$0.6670. If this zone breaks, further downside toward $0.6580 could become possible. On the upside, $0.6940 and $0.7030 are immediate resistance levels. A strong breakout above $0.7030 could open the door for a recovery toward $0.7300. RSI is around 43, while MACD remains bearish, confirming weak momentum.
#USSpotXRPETFsSeeLargestWeeklyOutflowIn8Months
#USSpotXRPETFsSeeLargestWeeklyOutflowIn8Months
1
143
Übersetzung ansehen
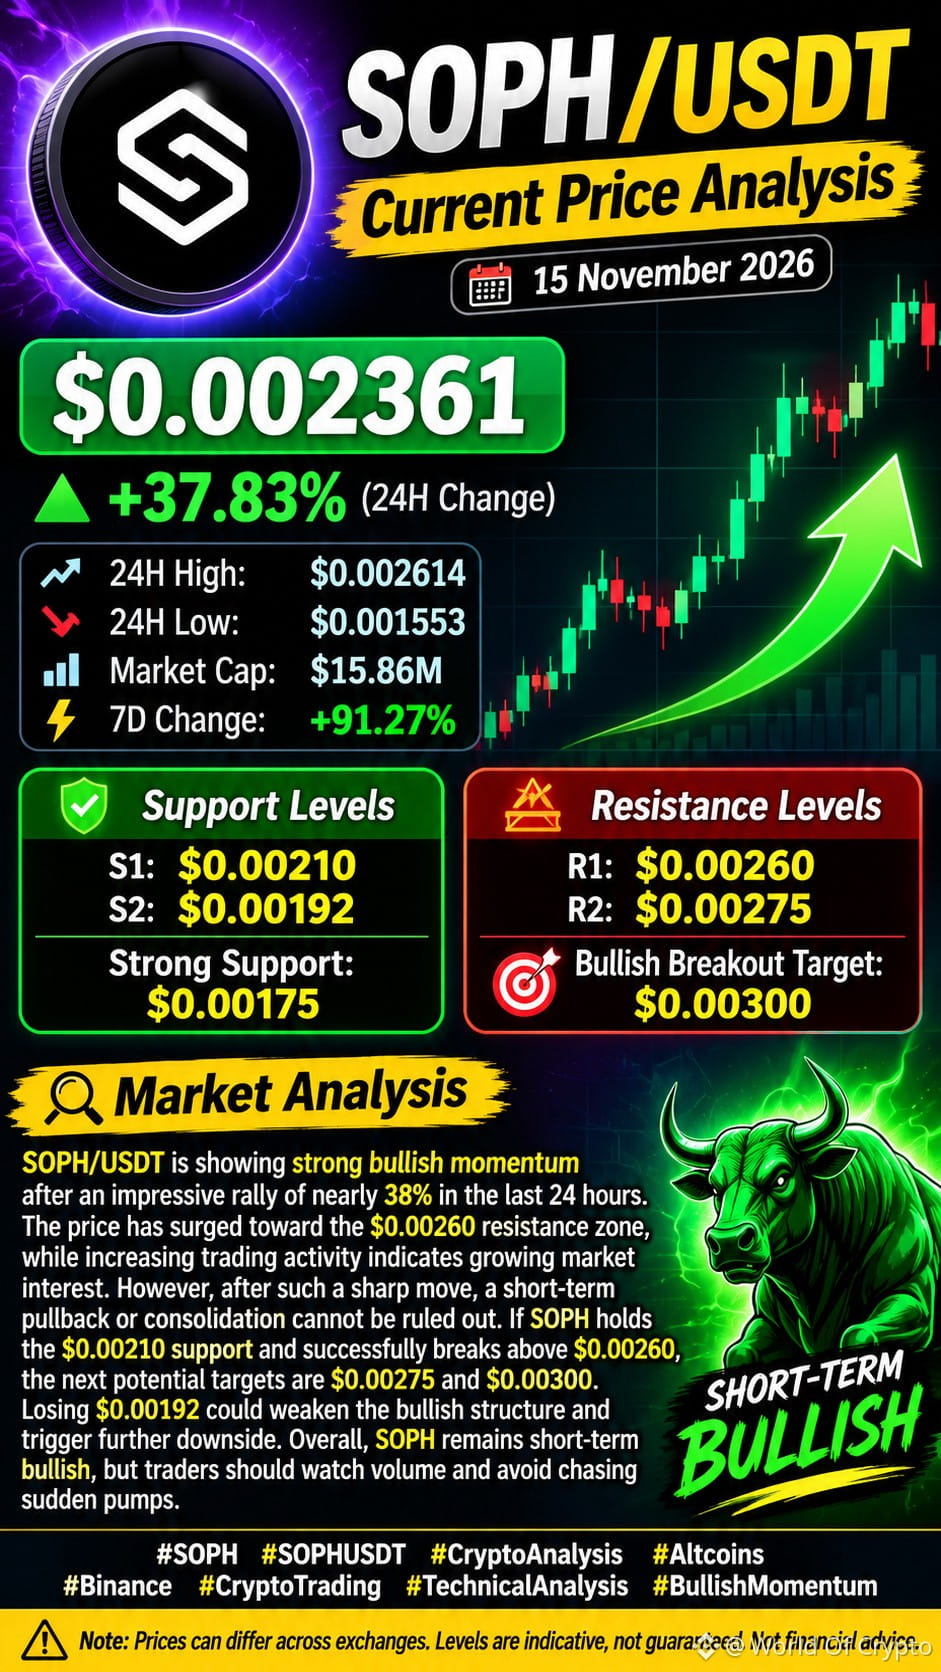
$SOPH /USDT is showing strong bullish momentum after an impressive rally of nearly 38% in the last 24 hours. The price has surged toward the $0.00260 resistance zone, while increasing trading activity indicates growing market interest. However, after such a sharp move, a short-term pullback or consolidation cannot be ruled out. If SOPH holds the $0.00210 support and successfully breaks above $0.00260, the next potential targets are $0.00275 and $0.00300. Losing $0.00192 could weaken the bullish structure and trigger further downside. Overall, SOPH remains short-term bullish, but traders should watch volume and avoid chasing sudden pumps.
{spot}(SOPHUSDT)
#USPPIMissMayEaseBTCPressure
$SOPH /USDT is showing strong bullish momentum after an impressive rally of nearly 38% in the last 24 hours. The price has surged toward the $0.00260 resistance zone, while increasing trading activity indicates growing market interest. However, after such a sharp move, a short-term pullback or consolidation cannot be ruled out. If SOPH holds the $0.00210 support and successfully breaks above $0.00260, the next potential targets are $0.00275 and $0.00300. Losing $0.00192 could weaken the bullish structure and trigger further downside. Overall, SOPH remains short-term bullish, but traders should watch volume and avoid chasing sudden pumps.
#USPPIMissMayEaseBTCPressure
#USPPIMissMayEaseBTCPressure
185
Übersetzung ansehen
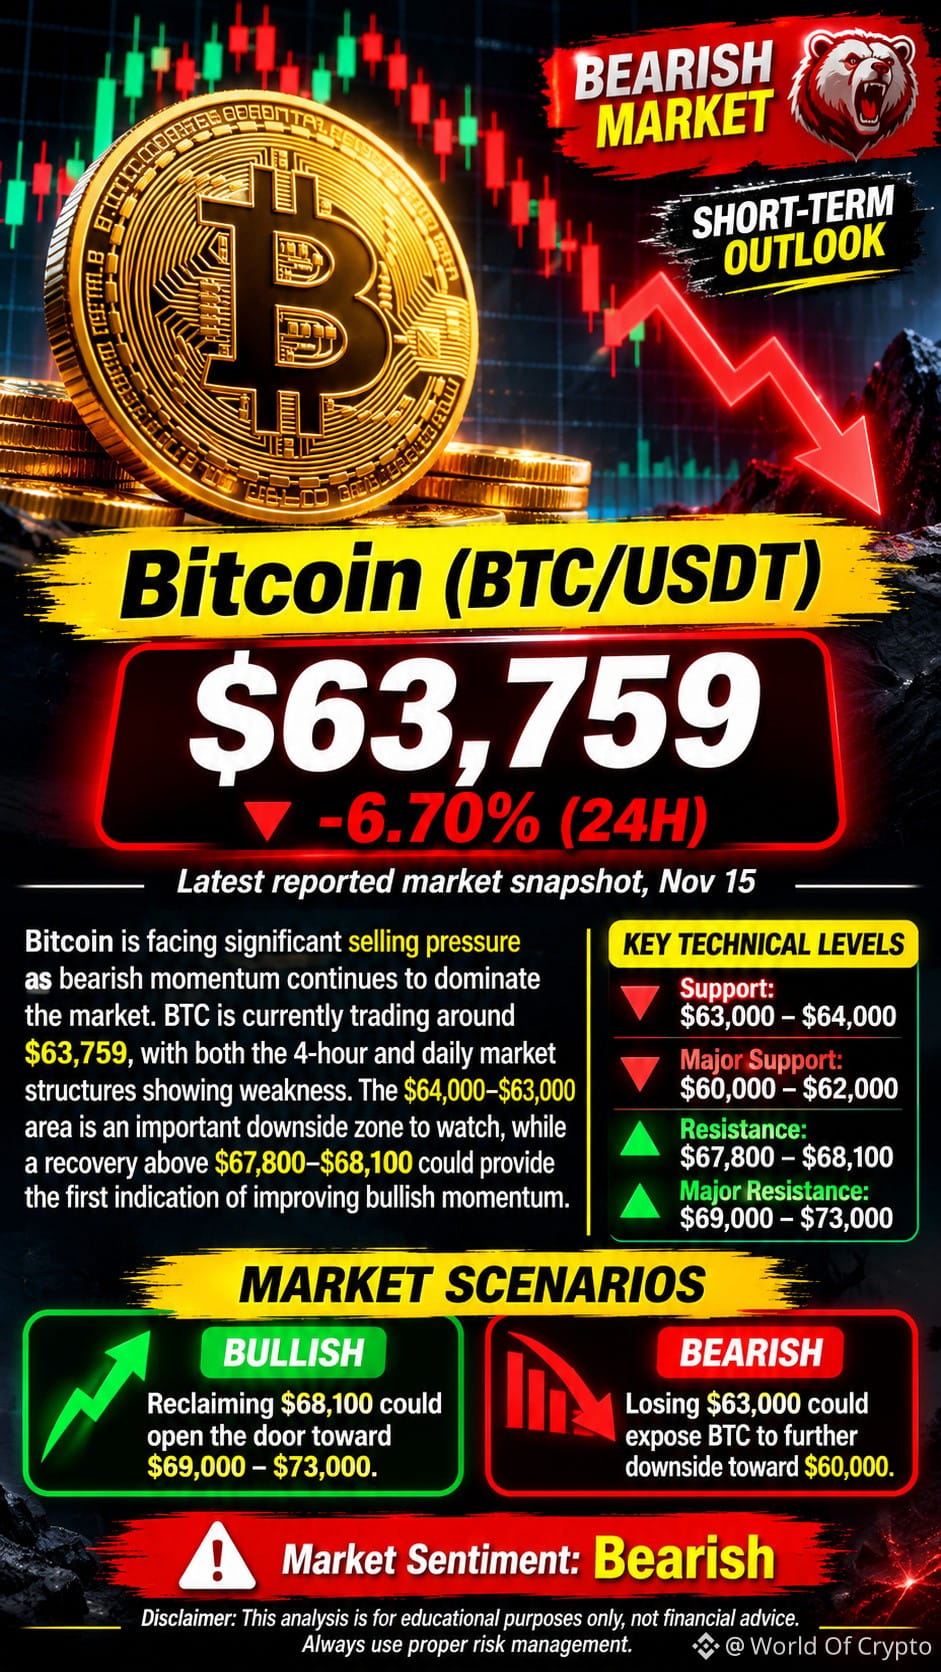
$BTC Bitcoin is facing significant selling pressure as bearish momentum continues to dominate the market. BTC is currently trading around $63,759, with both the 4-hour and daily market structures showing weakness. The $64,000–$63,000 area is an important downside zone to watch, while a recovery above $67,800–$68,100 could provide the first indication of improving bullish momentum. Extreme fear, ETF outflows and weak market liquidity are adding pressure to Bitcoin. Although oversold conditions could trigger a temporary relief bounce, buyers need to reclaim major resistance levels before a trend reversal can be confirmed.
{spot}(BTCUSDT)
$BTC Bitcoin is facing significant selling pressure as bearish momentum continues to dominate the market. BTC is currently trading around $63,759, with both the 4-hour and daily market structures showing weakness. The $64,000–$63,000 area is an important downside zone to watch, while a recovery above $67,800–$68,100 could provide the first indication of improving bullish momentum. Extreme fear, ETF outflows and weak market liquidity are adding pressure to Bitcoin. Although oversold conditions could trigger a temporary relief bounce, buyers need to reclaim major resistance levels before a trend reversal can be confirmed.
84
Übersetzung ansehen
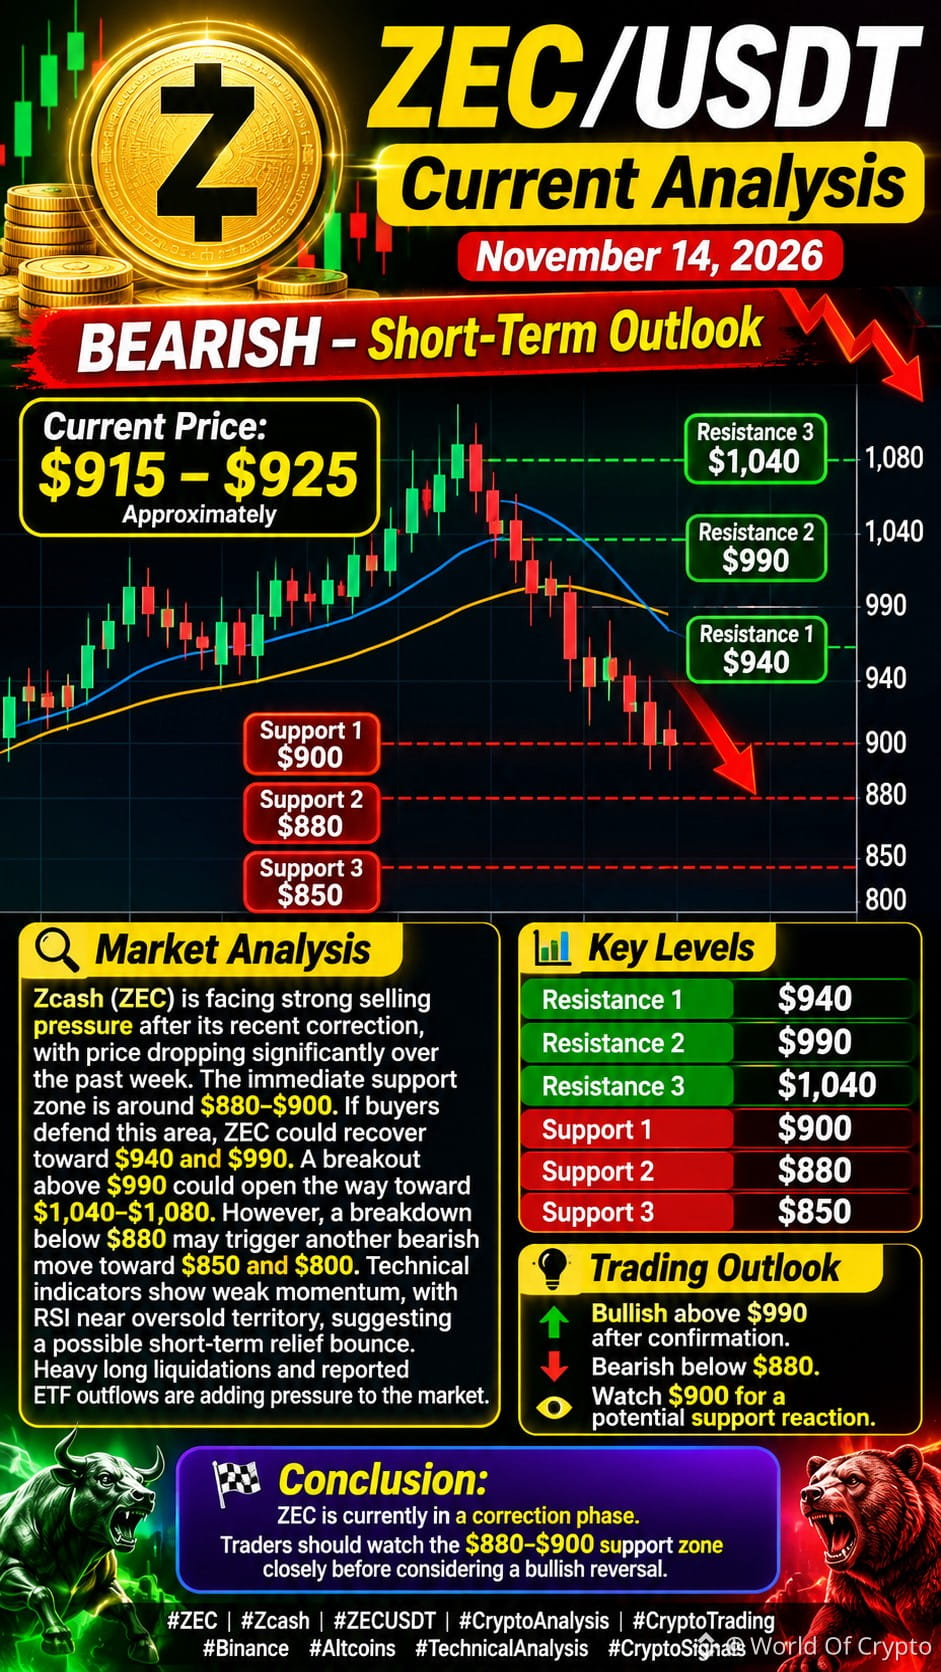
Zcash ($ZEC ) is facing strong selling pressure after its recent correction, with price dropping significantly over the past week. The immediate support zone is around $880–$900. If buyers defend this area, ZEC could recover toward $940 and $990. A breakout above $990 could open the way toward $1,040–$1,080. However, a breakdown below $880 may trigger another bearish move toward $850 and $800. Technical indicators show weak momentum, with RSI near oversold territory, suggesting a possible short-term relief bounce. Heavy long liquidations and reported ETF outflows are adding pressure to the market.
{spot}(ZECUSDT)
#WhatWillDriveCryptoandStocks’NextRebound?
Zcash ($ZEC ) is facing strong selling pressure after its recent correction, with price dropping significantly over the past week. The immediate support zone is around $880–$900. If buyers defend this area, ZEC could recover toward $940 and $990. A breakout above $990 could open the way toward $1,040–$1,080. However, a breakdown below $880 may trigger another bearish move toward $850 and $800. Technical indicators show weak momentum, with RSI near oversold territory, suggesting a possible short-term relief bounce. Heavy long liquidations and reported ETF outflows are adding pressure to the market.
#WhatWillDriveCryptoandStocks’NextRebound?
#WhatWillDriveCryptoandStocks’NextRebound?
59
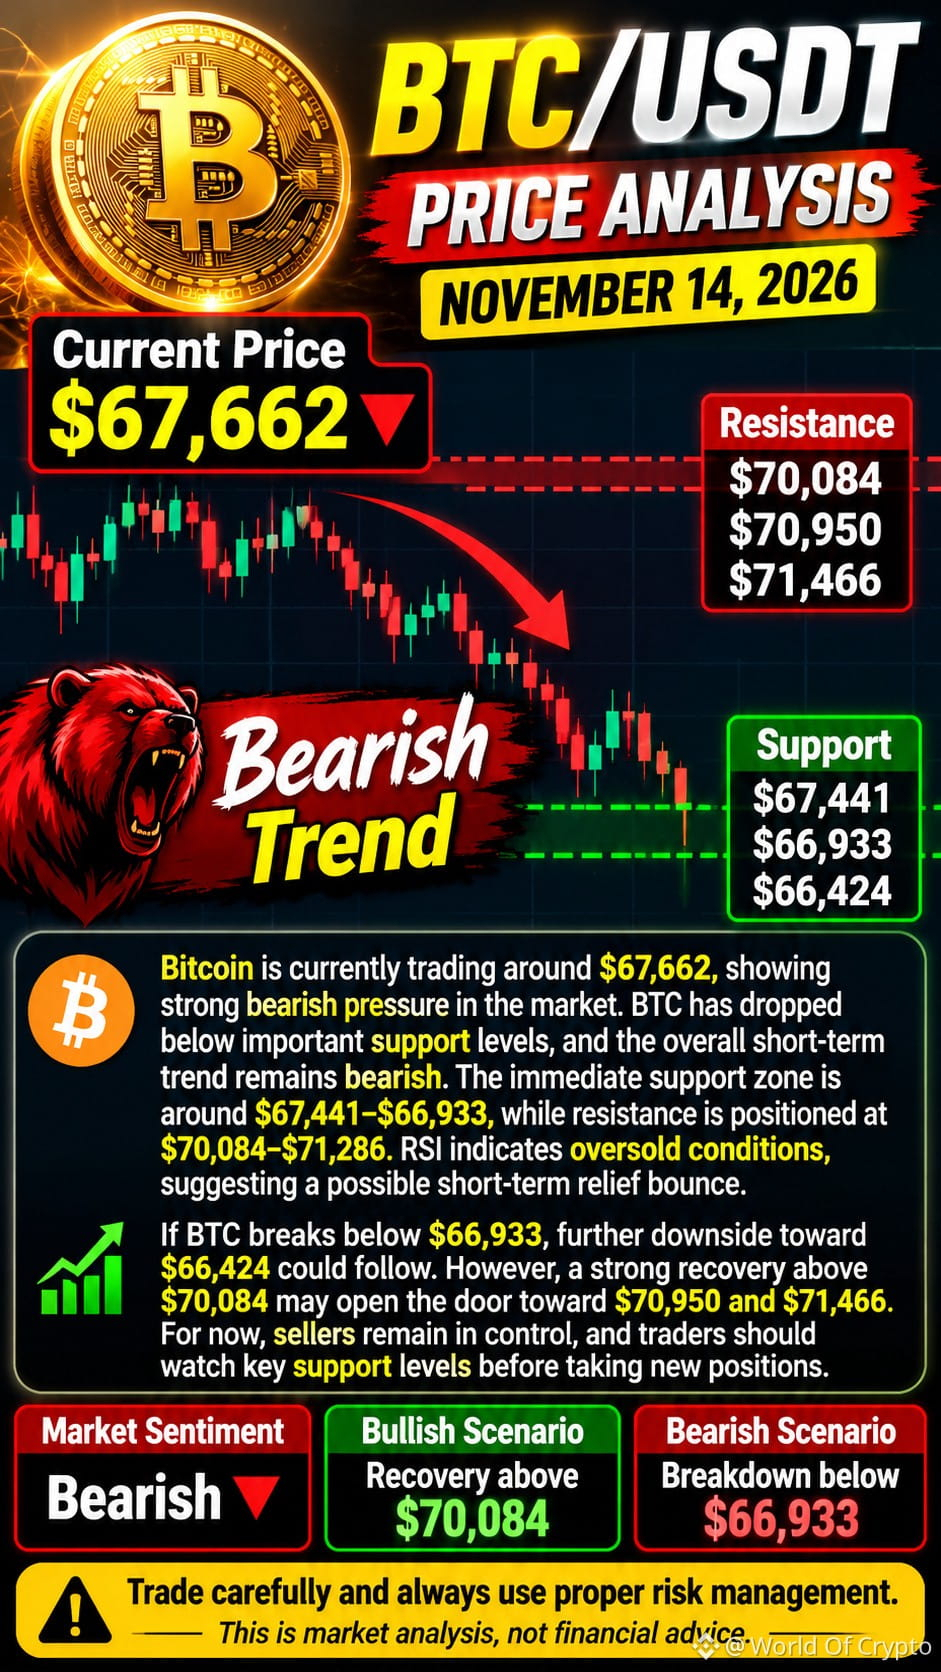
$BTC Bitcoin wird derzeit bei etwa 67.662 $ gehandelt, was auf einen starken Abwärtsdruck am Markt hindeutet. BTC ist unter wichtige Unterstützungsniveaus gefallen, und der kurzfristige Gesamttrend bleibt bearish. Die unmittelbare Unterstützungszone liegt bei etwa 67.441–66.933 $, während der Widerstand bei 70.084–71.286 $ angesiedelt ist. Der RSI deutet auf überverkaufte Bedingungen hin, was auf eine mögliche kurzfristige Erholungsbewegung hindeutet. Sollte BTC unter 66.933 $ fallen, könnte ein weiterer Rückgang in Richtung 66.424 $ folgen. Eine starke Erholung über 70.084 $ könnte hingegen den Weg in Richtung 70.950 $ und 71.466 $ ebnen. Derzeit haben die Verkäufer weiterhin die Kontrolle, und Händler sollten vor dem Eingehen neuer Positionen die wichtigen Unterstützungsniveaus im Auge behalten.
{spot}(BTCUSDT)
#WhatWillDriveCryptoandStocks’NextRebound?
$BTC Bitcoin wird derzeit bei etwa 67.662 $ gehandelt, was auf einen starken Abwärtsdruck am Markt hindeutet. BTC ist unter wichtige Unterstützungsniveaus gefallen, und der kurzfristige Gesamttrend bleibt bearish. Die unmittelbare Unterstützungszone liegt bei etwa 67.441–66.933 $, während der Widerstand bei 70.084–71.286 $ angesiedelt ist. Der RSI deutet auf überverkaufte Bedingungen hin, was auf eine mögliche kurzfristige Erholungsbewegung hindeutet. Sollte BTC unter 66.933 $ fallen, könnte ein weiterer Rückgang in Richtung 66.424 $ folgen. Eine starke Erholung über 70.084 $ könnte hingegen den Weg in Richtung 70.950 $ und 71.466 $ ebnen. Derzeit haben die Verkäufer weiterhin die Kontrolle, und Händler sollten vor dem Eingehen neuer Positionen die wichtigen Unterstützungsniveaus im Auge behalten.
#WhatWillDriveCryptoandStocks’NextRebound?
#WhatWillDriveCryptoandStocks’NextRebound?
50
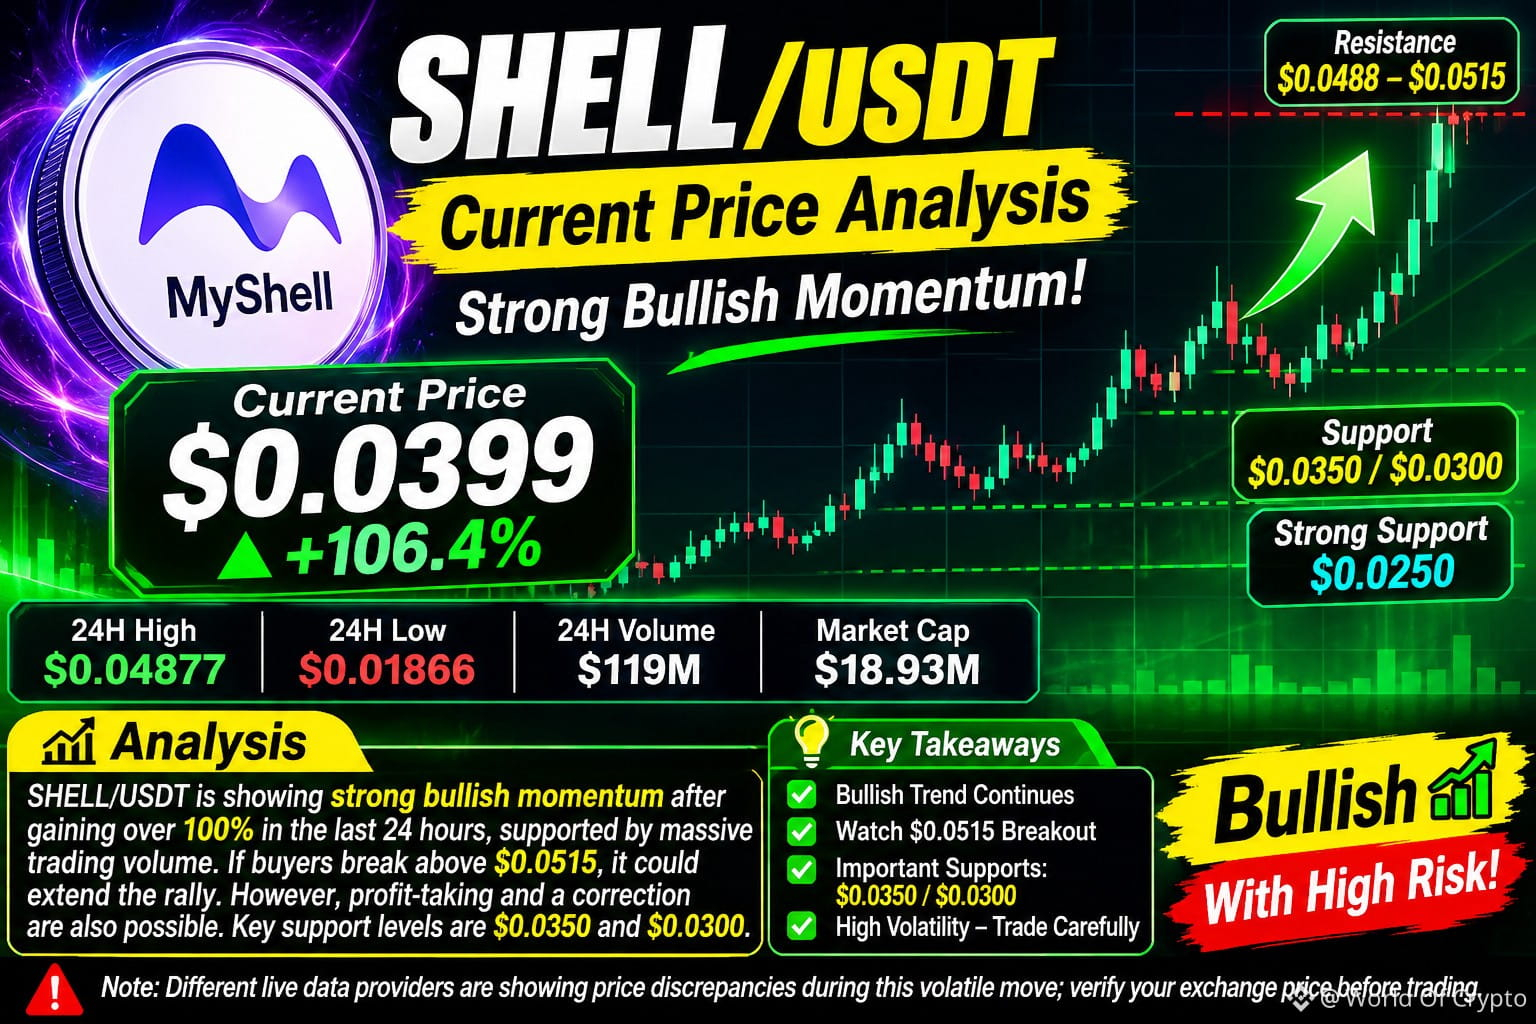
$SHELL /USDT zeigt nach einem Anstieg von über 100 % in den letzten 24 Stunden eine starke bullische Dynamik, die durch einen massiven Anstieg des Handelsvolumens gestützt wird. Der Preis liegt derzeit bei etwa 0,0399 $, wobei der unmittelbare Widerstand bei etwa 0,0488–0,0515 $ liegt. Wenn es den Käufern gelingt, diese Widerstandszone bei starkem Volumen zu durchbrechen, könnte SHELL seine Rallye auf höhere Niveaus ausweiten. Nach einem derart starken Anstieg sind jedoch Gewinnmitnahmen und eine kurzfristige Korrektur weiterhin möglich. Wichtige Unterstützungsniveaus liegen bei 0,0350 $ und 0,0300 $. Händler sollten auf eine Bestätigung durch das Volumen achten und vermeiden, grünen Kerzen hinterherzujagen. Insgesamt bleibt SHELL bullisch, birgt jedoch eine hohe Volatilität und ein erhebliches Korrekturrisiko.
{spot}(SHELLUSDT)
#USPPIMissMayEaseBTCPressure
$SHELL /USDT zeigt nach einem Anstieg von über 100 % in den letzten 24 Stunden eine starke bullische Dynamik, die durch einen massiven Anstieg des Handelsvolumens gestützt wird. Der Preis liegt derzeit bei etwa 0,0399 $, wobei der unmittelbare Widerstand bei etwa 0,0488–0,0515 $ liegt. Wenn es den Käufern gelingt, diese Widerstandszone bei starkem Volumen zu durchbrechen, könnte SHELL seine Rallye auf höhere Niveaus ausweiten. Nach einem derart starken Anstieg sind jedoch Gewinnmitnahmen und eine kurzfristige Korrektur weiterhin möglich. Wichtige Unterstützungsniveaus liegen bei 0,0350 $ und 0,0300 $. Händler sollten auf eine Bestätigung durch das Volumen achten und vermeiden, grünen Kerzen hinterherzujagen. Insgesamt bleibt SHELL bullisch, birgt jedoch eine hohe Volatilität und ein erhebliches Korrekturrisiko.
#USPPIMissMayEaseBTCPressure
#USPPIMissMayEaseBTCPressure
122
Anmelden und weiter Inhalte entdecken
Krypto-Nutzer weltweit auf Binance Square kennenlernen
⚡️ Bleib in Sachen Krypto stets am Puls.
💬 Die weltgrößte Kryptobörse vertraut darauf.
👍 Erhalte verlässliche Einblicke von verifizierten Creators.
E-Mail-Adresse/Telefonnummer
Trendthemen
BTCRemainsUnderPressureAfterHawkishFOMCMinutes
16,475 Aufrufe
254 Kommentare
FOMC-Protokoll | Fed-Protokoll zeigt: Fast alle Vertreter rechnen mit weiteren Zinserhöhungen, einige halten im Dezember einen größeren Schritt für möglich
Binance News
·36 Likes
·49.4k Aufrufe
AnthropicToDebutAfter$83IPOPricing
6,315 Aufrufe
32 Kommentare
NvidiaBoardReportedlySplitOverHuang’sReturn
1,067 Aufrufe
41 Kommentare