
SuMo_GiLl
12 Beiträge

SuMo_GiLl
Melden
Nutzer blockieren
Trade eröffnen
4 Tage
0 Following
2 Follower
2 Like gegeben
Beiträge
Portfolio
·
--
Übersetzung ansehen
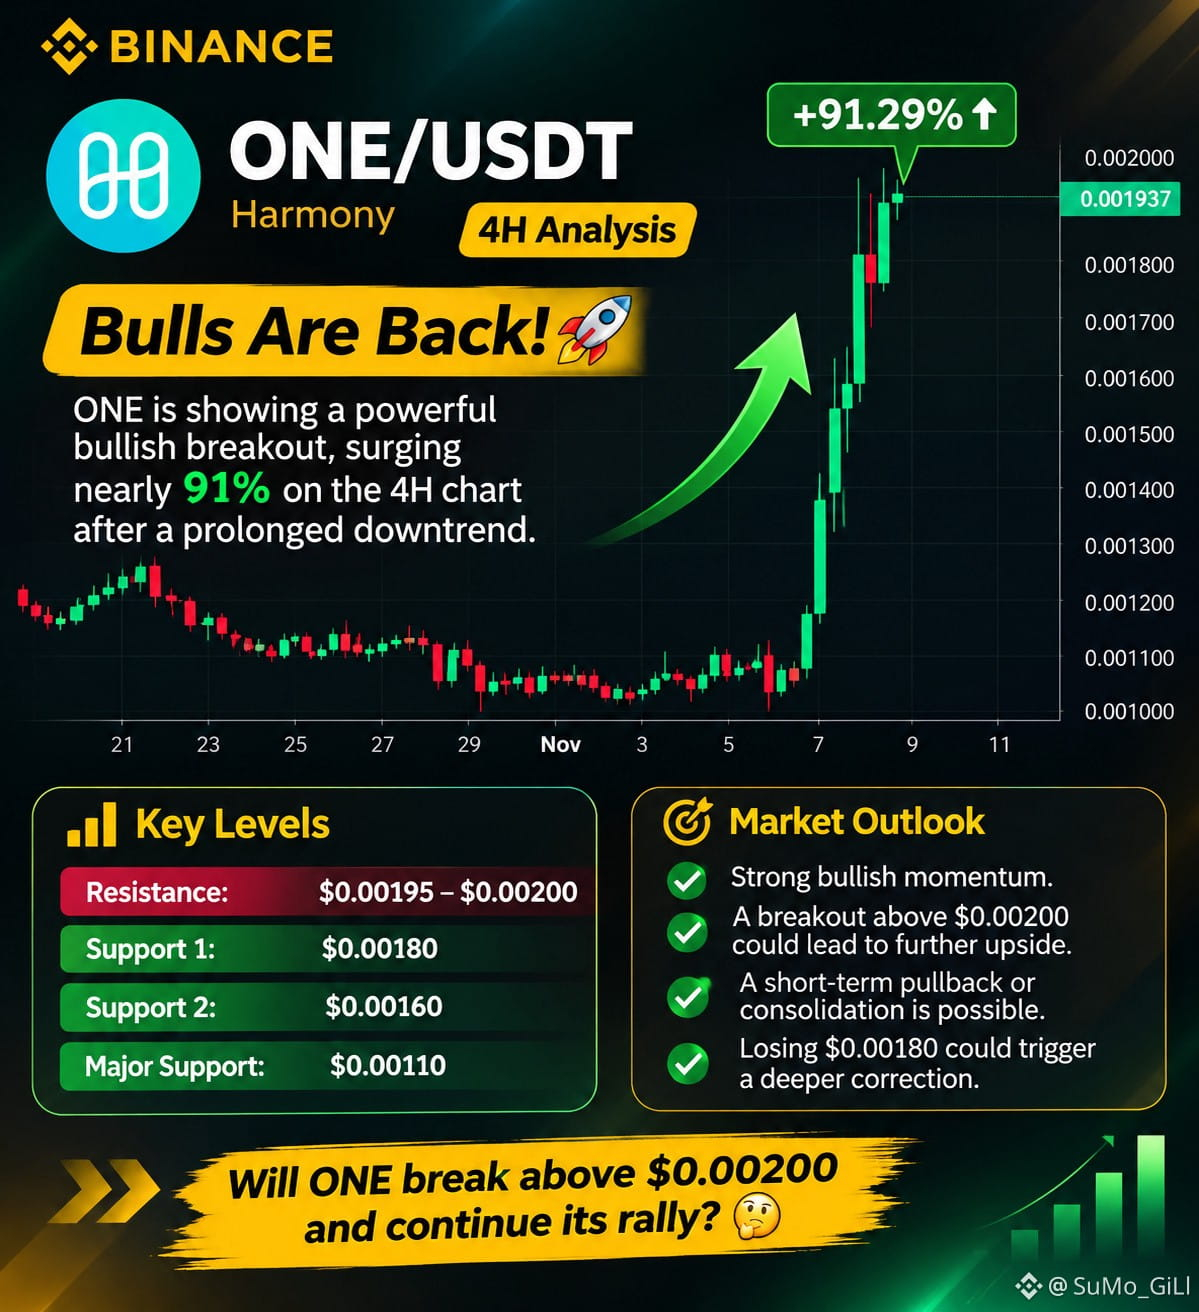
Harmony $ONE is making a powerful move, surging nearly 91% on the 4H chart! 📈
After a prolonged downtrend, buyers have stepped in with strong momentum.
🎯 Key Resistance: $USDT 0.00200
🛡️ Key Support: $0.00180
📊 Bullish momentum remains strong, but a short-term pullback is possible
{spot}(ONEUSDT)
Harmony $ONE is making a powerful move, surging nearly 91% on the 4H chart! 📈
After a prolonged downtrend, buyers have stepped in with strong momentum.
🎯 Key Resistance: $USDT 0.00200
🛡️ Key Support: $0.00180
📊 Bullish momentum remains strong, but a short-term pullback is possible
After a prolonged downtrend, buyers have stepped in with strong momentum.
🎯 Key Resistance: $USDT 0.00200
🛡️ Key Support: $0.00180
📊 Bullish momentum remains strong, but a short-term pullback is possible
267
·
--
Übersetzung ansehen
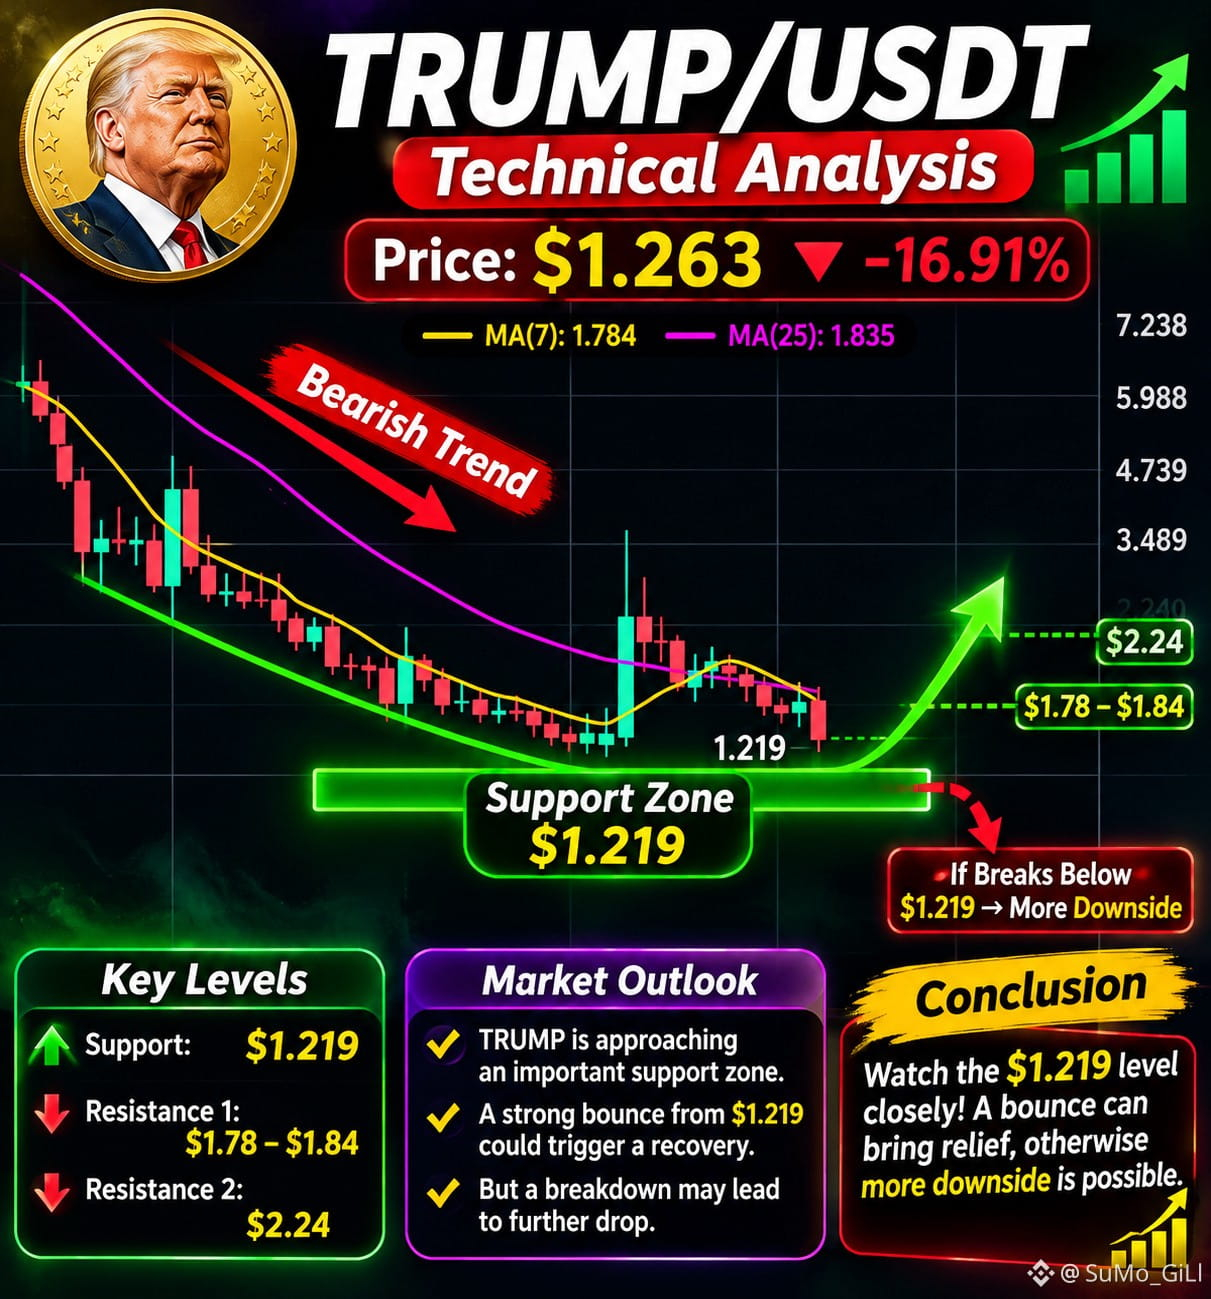
$TRUMP is currently trading at $USDT 1.263, down 16.91%. The weekly chart shows strong bearish momentum, with price trading below both MA(7) at $1.784 and MA(25) at $1.835.
Support Zone: $1.219 – A critical area where buyers may step in.
Resistance 1: $1.78 – $1.84.
Resistance 2: $2.24.
Trend: Bearish, with continued selling pressure.
Potential Reversal: A strong bounce from $1.219 could trigger a recovery toward $1.80 and higher.
Market Outlook: TRUMP is approaching an important support zone. If buyers defend $1.219, a short-term recovery may develop. However, a breakdown below this level could lead to further downside.
{spot}(TRUMPUSDT)
#TrumpCryptoSupport #TRUMPUSDT💪🏻
$TRUMP is currently trading at $USDT 1.263, down 16.91%. The weekly chart shows strong bearish momentum, with price trading below both MA(7) at $1.784 and MA(25) at $1.835.
Support Zone: $1.219 – A critical area where buyers may step in.
Resistance 1: $1.78 – $1.84.
Resistance 2: $2.24.
Trend: Bearish, with continued selling pressure.
Potential Reversal: A strong bounce from $1.219 could trigger a recovery toward $1.80 and higher.
Market Outlook: TRUMP is approaching an important support zone. If buyers defend $1.219, a short-term recovery may develop. However, a breakdown below this level could lead to further downside.
#TrumpCryptoSupport #TRUMPUSDT💪🏻
Support Zone: $1.219 – A critical area where buyers may step in.
Resistance 1: $1.78 – $1.84.
Resistance 2: $2.24.
Trend: Bearish, with continued selling pressure.
Potential Reversal: A strong bounce from $1.219 could trigger a recovery toward $1.80 and higher.
Market Outlook: TRUMP is approaching an important support zone. If buyers defend $1.219, a short-term recovery may develop. However, a breakdown below this level could lead to further downside.
#TrumpCryptoSupport #TRUMPUSDT💪🏻
192
·
--
Übersetzung ansehen
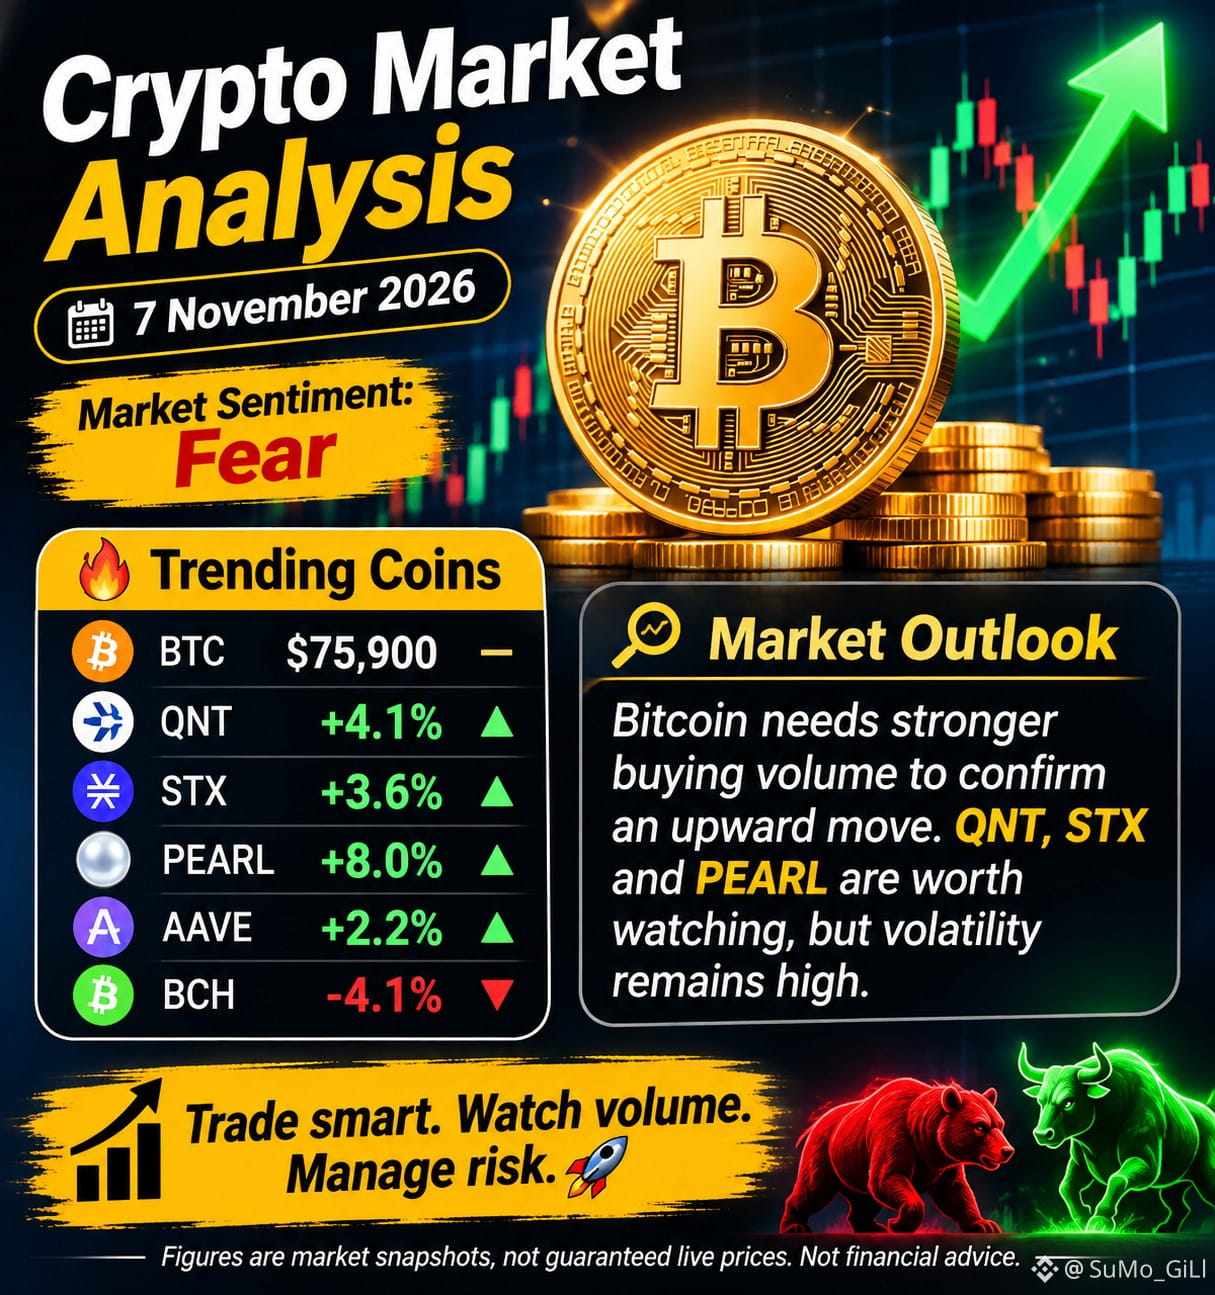
The crypto market is showing mixed momentum, with Bitcoin trading near $BTC 75,900. BTC remains relatively stable, while several altcoins are attracting attention.
🔥 Trending Coins
$BTC : $75,900 – holding near current levels.
$QNT : +4.1% – showing positive momentum.
STX: +3.6% – gaining strength.
PEARL: +8.0% – among the notable gainers.
AAVE: +2.2% – showing recovery.
BCH: -4.1% – facing selling pressure.
Market Outlook: Bitcoin needs stronger buying volume to confirm an upward move. QNT, STX and PEARL are worth watching, but volatility remains high.
The crypto market is showing mixed momentum, with Bitcoin trading near $BTC 75,900. BTC remains relatively stable, while several altcoins are attracting attention.
🔥 Trending Coins
$BTC : $75,900 – holding near current levels.
$QNT : +4.1% – showing positive momentum.
STX: +3.6% – gaining strength.
PEARL: +8.0% – among the notable gainers.
AAVE: +2.2% – showing recovery.
BCH: -4.1% – facing selling pressure.
Market Outlook: Bitcoin needs stronger buying volume to confirm an upward move. QNT, STX and PEARL are worth watching, but volatility remains high.
🔥 Trending Coins
$BTC : $75,900 – holding near current levels.
$QNT : +4.1% – showing positive momentum.
STX: +3.6% – gaining strength.
PEARL: +8.0% – among the notable gainers.
AAVE: +2.2% – showing recovery.
BCH: -4.1% – facing selling pressure.
Market Outlook: Bitcoin needs stronger buying volume to confirm an upward move. QNT, STX and PEARL are worth watching, but volatility remains high.
84
·
--
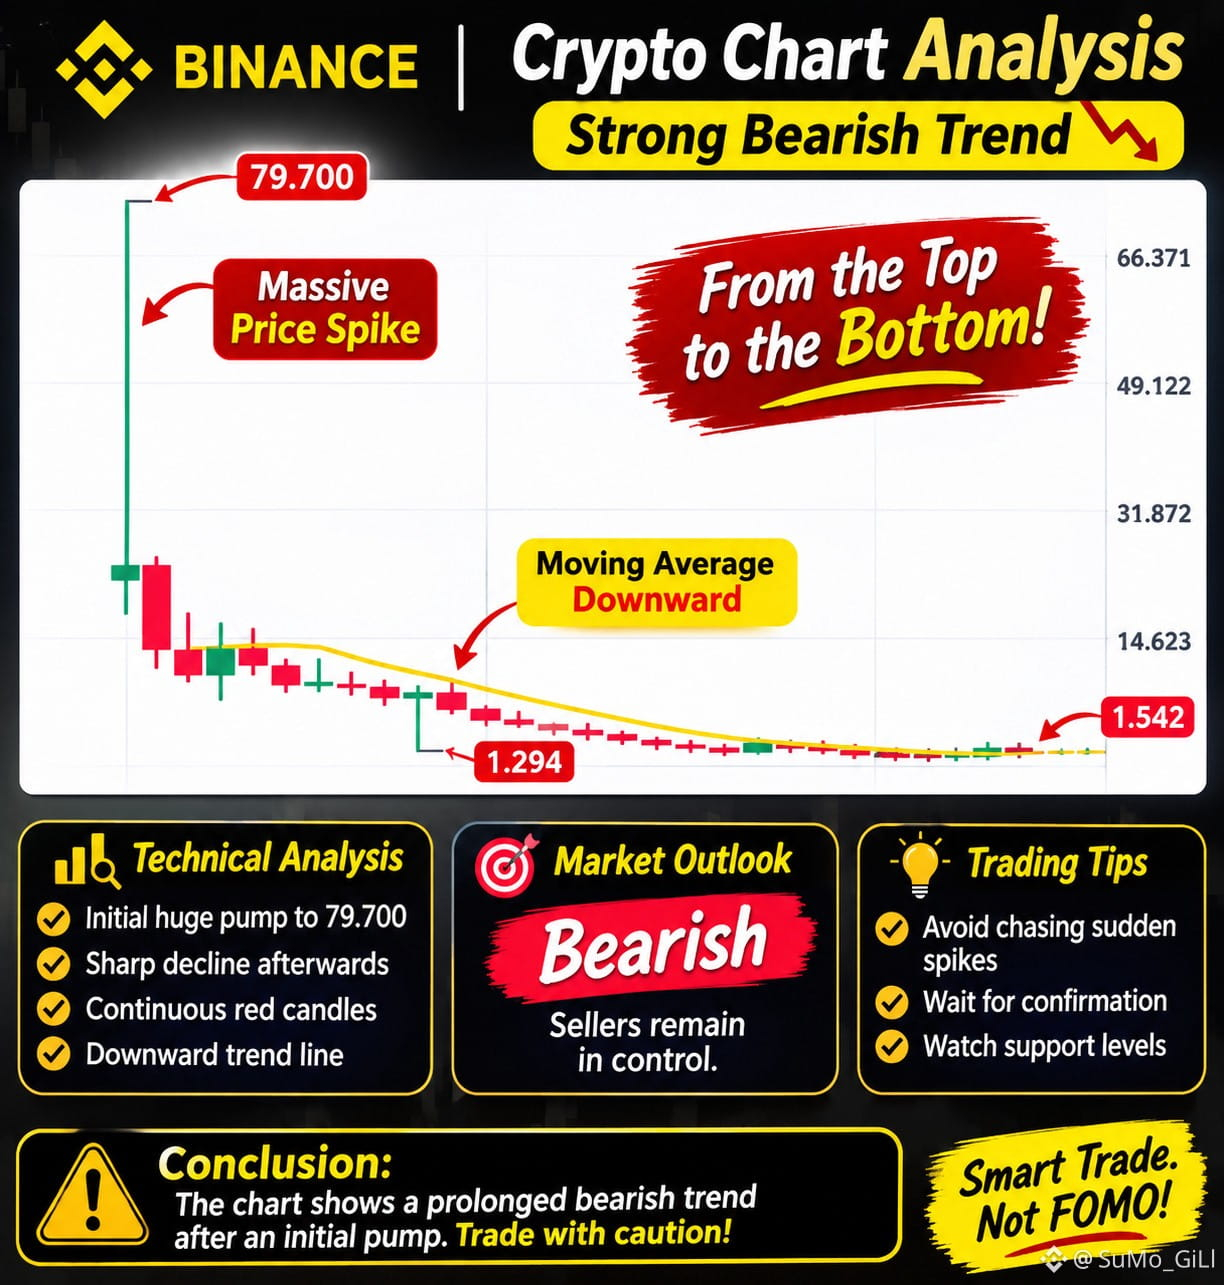
Technische Analyse
Erste Bewegung: Ein plötzlicher Kurssprung trieb den Preis in Richtung $TRUMP 79.700.
Starke Korrektur: Die Verkäufer übernahmen schnell die Kontrolle und lösten einen erheblichen Preisrückgang aus.
Abwärtstrend: Aufeinanderfolgende rote Kerzen deuten auf anhaltenden Abwärtsdruck hin.
Gleitender Durchschnitt: Die gelbe Linie des gleitenden Durchschnitts fällt und bestätigt die Schwäche.
Aktueller Preis: Etwa 1.542, wie im Chart angezeigt.
Marktausblick
Bärisch — Die Verkäufer behalten die Kontrolle.
Weitere Kursverluste sind möglich, wenn der Verkaufsdruck anhält.
Eine Erholung erfordert ein starkes Kaufvolumen.
Ein Anstieg über den gleitenden Durchschnitt könnte ein erstes Erholungssignal sein.
{spot}(TRUMPUSDT)
#TRUMP
Technische Analyse
Erste Bewegung: Ein plötzlicher Kurssprung trieb den Preis in Richtung $TRUMP 79.700.
Starke Korrektur: Die Verkäufer übernahmen schnell die Kontrolle und lösten einen erheblichen Preisrückgang aus.
Abwärtstrend: Aufeinanderfolgende rote Kerzen deuten auf anhaltenden Abwärtsdruck hin.
Gleitender Durchschnitt: Die gelbe Linie des gleitenden Durchschnitts fällt und bestätigt die Schwäche.
Aktueller Preis: Etwa 1.542, wie im Chart angezeigt.
Marktausblick
Bärisch — Die Verkäufer behalten die Kontrolle.
Weitere Kursverluste sind möglich, wenn der Verkaufsdruck anhält.
Eine Erholung erfordert ein starkes Kaufvolumen.
Ein Anstieg über den gleitenden Durchschnitt könnte ein erstes Erholungssignal sein.
#TRUMP
Erste Bewegung: Ein plötzlicher Kurssprung trieb den Preis in Richtung $TRUMP 79.700.
Starke Korrektur: Die Verkäufer übernahmen schnell die Kontrolle und lösten einen erheblichen Preisrückgang aus.
Abwärtstrend: Aufeinanderfolgende rote Kerzen deuten auf anhaltenden Abwärtsdruck hin.
Gleitender Durchschnitt: Die gelbe Linie des gleitenden Durchschnitts fällt und bestätigt die Schwäche.
Aktueller Preis: Etwa 1.542, wie im Chart angezeigt.
Marktausblick
Bärisch — Die Verkäufer behalten die Kontrolle.
Weitere Kursverluste sind möglich, wenn der Verkaufsdruck anhält.
Eine Erholung erfordert ein starkes Kaufvolumen.
Ein Anstieg über den gleitenden Durchschnitt könnte ein erstes Erholungssignal sein.
#TRUMP
2
1.1k
·
--
Übersetzung ansehen
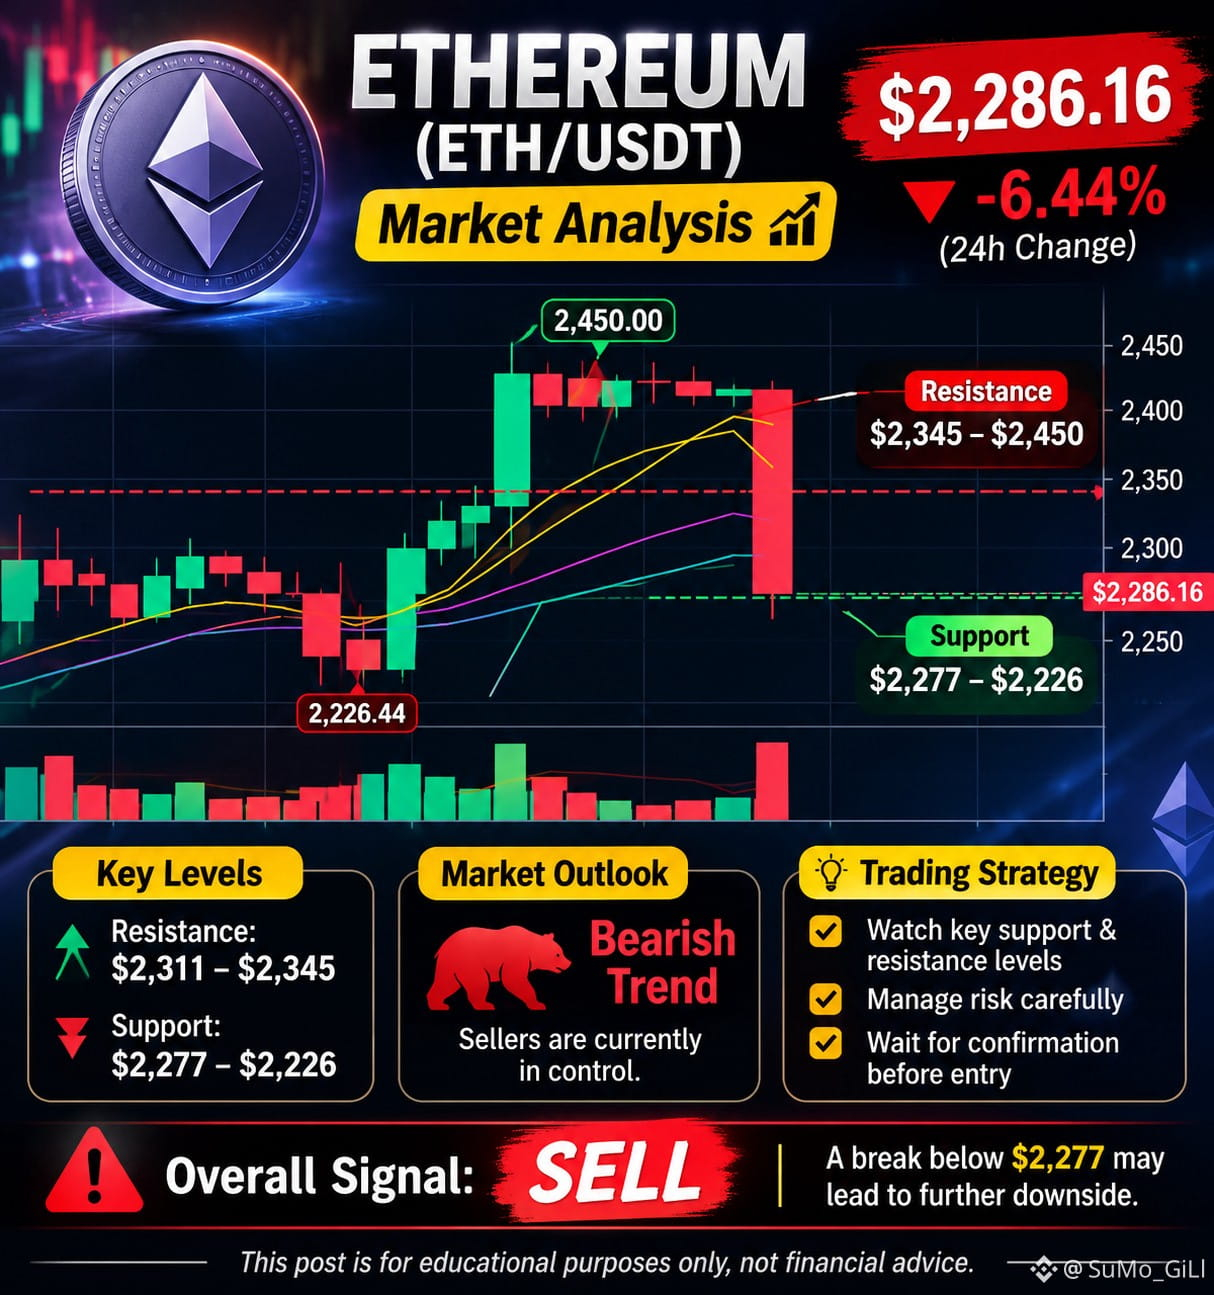
📊 ETHEREUM (ETH/USDT) MARKET ANALYSIS
🔴 Ethereum Faces Strong Selling Pressure!
Ethereum is currently trading around $ETH 2,286, down 6.44% in the last 24 hours.
📉 Technical Analysis:
- Current Price: $2,286.16
- 24H High: $2,446.28
- 24H Low: $2,277.53
- Support Zone: $2,277 – $2,226
- Resistance Zone: $2,311 – $2,345
Market Outlook:
ETH is showing bearish momentum on the 4-hour chart. Increased selling volume suggests that sellers are dominating the market.
⚠️ A break below $2,277 could trigger further downside, while a recovery above $ETH 2,345 may indicate a possible bullish reversal.
📌 Trading Strategy: Watch key support and resistance levels before entering any trade. Manage risk carefully.
{spot}(ETHUSDT)
#CryptoTrends2024 #CryptocurrencyWealth
📊 ETHEREUM (ETH/USDT) MARKET ANALYSIS
🔴 Ethereum Faces Strong Selling Pressure!
Ethereum is currently trading around $ETH 2,286, down 6.44% in the last 24 hours.
📉 Technical Analysis:
- Current Price: $2,286.16
- 24H High: $2,446.28
- 24H Low: $2,277.53
- Support Zone: $2,277 – $2,226
- Resistance Zone: $2,311 – $2,345
Market Outlook:
ETH is showing bearish momentum on the 4-hour chart. Increased selling volume suggests that sellers are dominating the market.
⚠️ A break below $2,277 could trigger further downside, while a recovery above $ETH 2,345 may indicate a possible bullish reversal.
📌 Trading Strategy: Watch key support and resistance levels before entering any trade. Manage risk carefully.
#CryptoTrends2024 #CryptocurrencyWealth
🔴 Ethereum Faces Strong Selling Pressure!
Ethereum is currently trading around $ETH 2,286, down 6.44% in the last 24 hours.
📉 Technical Analysis:
- Current Price: $2,286.16
- 24H High: $2,446.28
- 24H Low: $2,277.53
- Support Zone: $2,277 – $2,226
- Resistance Zone: $2,311 – $2,345
Market Outlook:
ETH is showing bearish momentum on the 4-hour chart. Increased selling volume suggests that sellers are dominating the market.
⚠️ A break below $2,277 could trigger further downside, while a recovery above $ETH 2,345 may indicate a possible bullish reversal.
📌 Trading Strategy: Watch key support and resistance levels before entering any trade. Manage risk carefully.
#CryptoTrends2024 #CryptocurrencyWealth
65
·
--
Übersetzung ansehen
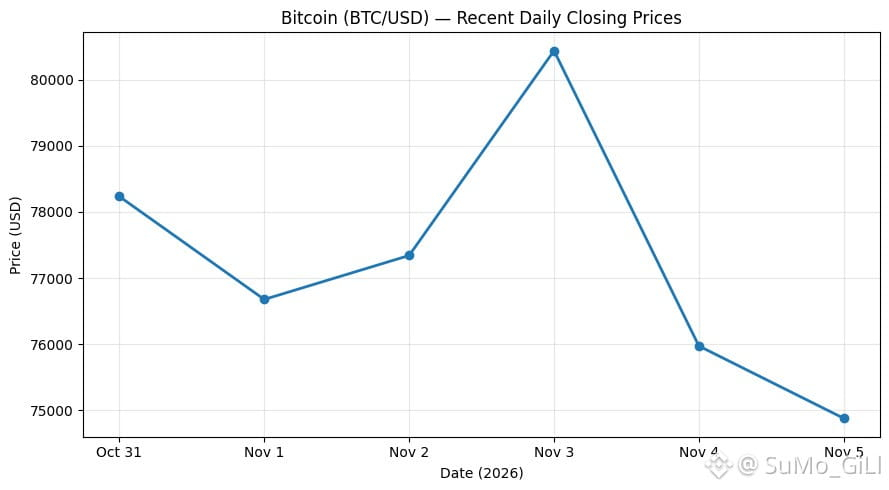
Bitcoin is facing selling pressure after a recent market decline. $BTC is testing important support around $74,979. Weak momentum and market uncertainty suggest caution.
Key levels:
Support: $74,979
Resistance: $76,647
Next target: $78,008
Lower target: $73,294
Market Outlook: If BTC breaks above $76,647, a recovery toward $78,008 is possible. If it falls below $74,979, further downside may follow.
{spot}(BTCUSDT)
#CanUSStocksReboundAfterNonfarmPayrolls? #BinanceReopensWithdrawalsForMoreAssets
Bitcoin is facing selling pressure after a recent market decline. $BTC is testing important support around $74,979. Weak momentum and market uncertainty suggest caution.
Key levels:
Support: $74,979
Resistance: $76,647
Next target: $78,008
Lower target: $73,294
Market Outlook: If BTC breaks above $76,647, a recovery toward $78,008 is possible. If it falls below $74,979, further downside may follow.
#CanUSStocksReboundAfterNonfarmPayrolls? #BinanceReopensWithdrawalsForMoreAssets
Key levels:
Support: $74,979
Resistance: $76,647
Next target: $78,008
Lower target: $73,294
Market Outlook: If BTC breaks above $76,647, a recovery toward $78,008 is possible. If it falls below $74,979, further downside may follow.
#CanUSStocksReboundAfterNonfarmPayrolls? #BinanceReopensWithdrawalsForMoreAssets
65
·
--
Übersetzung ansehen
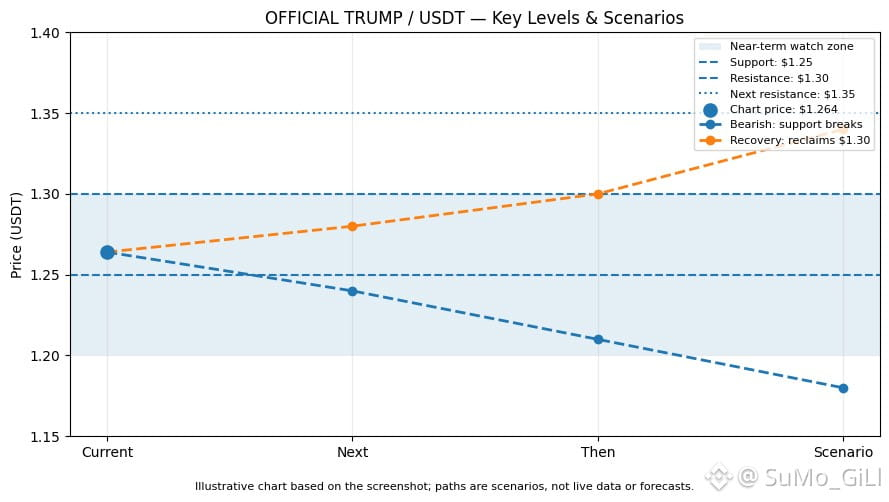
$TRUMP is experiencing strong selling pressure, dropping sharply from around $1.70 to $1.264. The chart shows consecutive red candles, indicating strong bearish momentum.
Support: $1.25 – $1.20
Resistance: $1.30 – $1.35
Bullish Scenario: A recovery above $1.30 could push the price toward $1.35.
Bearish Scenario: A break below $1.25 may trigger further downside.
{spot}(TRUMPUSDT)
#US10YearTreasuryYieldFallsTo4.845% #USMidterms-WhatAreMarketsExpecting?
$TRUMP is experiencing strong selling pressure, dropping sharply from around $1.70 to $1.264. The chart shows consecutive red candles, indicating strong bearish momentum.
Support: $1.25 – $1.20
Resistance: $1.30 – $1.35
Bullish Scenario: A recovery above $1.30 could push the price toward $1.35.
Bearish Scenario: A break below $1.25 may trigger further downside.
#US10YearTreasuryYieldFallsTo4.845% #USMidterms-WhatAreMarketsExpecting?
Support: $1.25 – $1.20
Resistance: $1.30 – $1.35
Bullish Scenario: A recovery above $1.30 could push the price toward $1.35.
Bearish Scenario: A break below $1.25 may trigger further downside.
#US10YearTreasuryYieldFallsTo4.845% #USMidterms-WhatAreMarketsExpecting?
230
·
--
Übersetzung ansehen
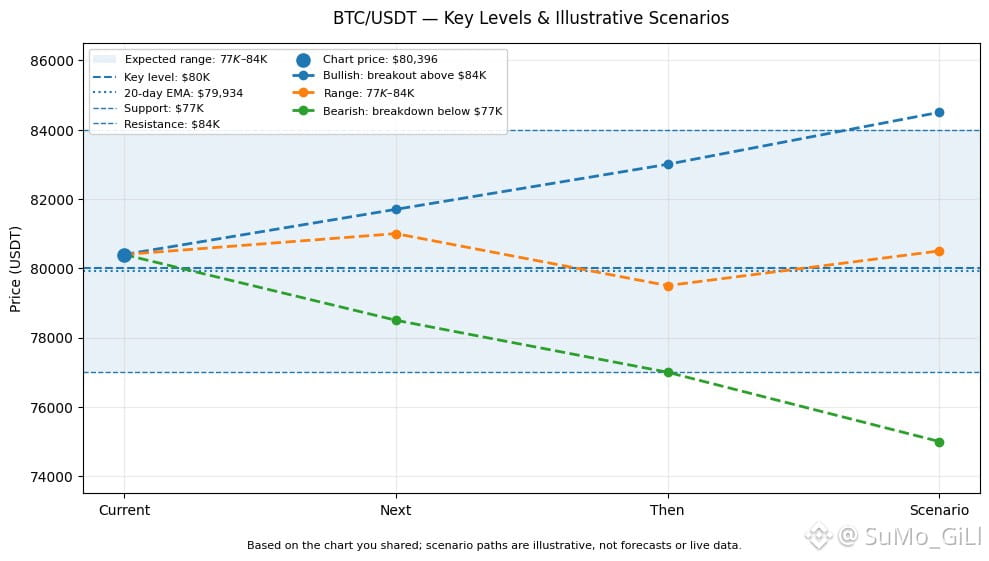
Bitcoin is trading around $BTC 80,396 (+3.6%), showing positive short-term momentum after moving above the 20-day EMA ($79,934).
🟢 Support: $80,000 / $77,000
🔴 Resistance: $82,000 / $84,000
Bullish Scenario: A breakout above $84K could trigger further upside.
Bearish Scenario: A drop below $77K may lead to stronger selling pressure.
Overall Outlook: Slightly bullish, but BTC may remain range-bound between $77K and $84K.
{spot}(BTCUSDT)
#BinanceReopensWithdrawalsForMoreAssets #Binance98PercentReplenished
Bitcoin is trading around $BTC 80,396 (+3.6%), showing positive short-term momentum after moving above the 20-day EMA ($79,934).
🟢 Support: $80,000 / $77,000
🔴 Resistance: $82,000 / $84,000
Bullish Scenario: A breakout above $84K could trigger further upside.
Bearish Scenario: A drop below $77K may lead to stronger selling pressure.
Overall Outlook: Slightly bullish, but BTC may remain range-bound between $77K and $84K.
#BinanceReopensWithdrawalsForMoreAssets #Binance98PercentReplenished
🟢 Support: $80,000 / $77,000
🔴 Resistance: $82,000 / $84,000
Bullish Scenario: A breakout above $84K could trigger further upside.
Bearish Scenario: A drop below $77K may lead to stronger selling pressure.
Overall Outlook: Slightly bullish, but BTC may remain range-bound between $77K and $84K.
#BinanceReopensWithdrawalsForMoreAssets #Binance98PercentReplenished
68
·
--
Bullisch
Übersetzung ansehen
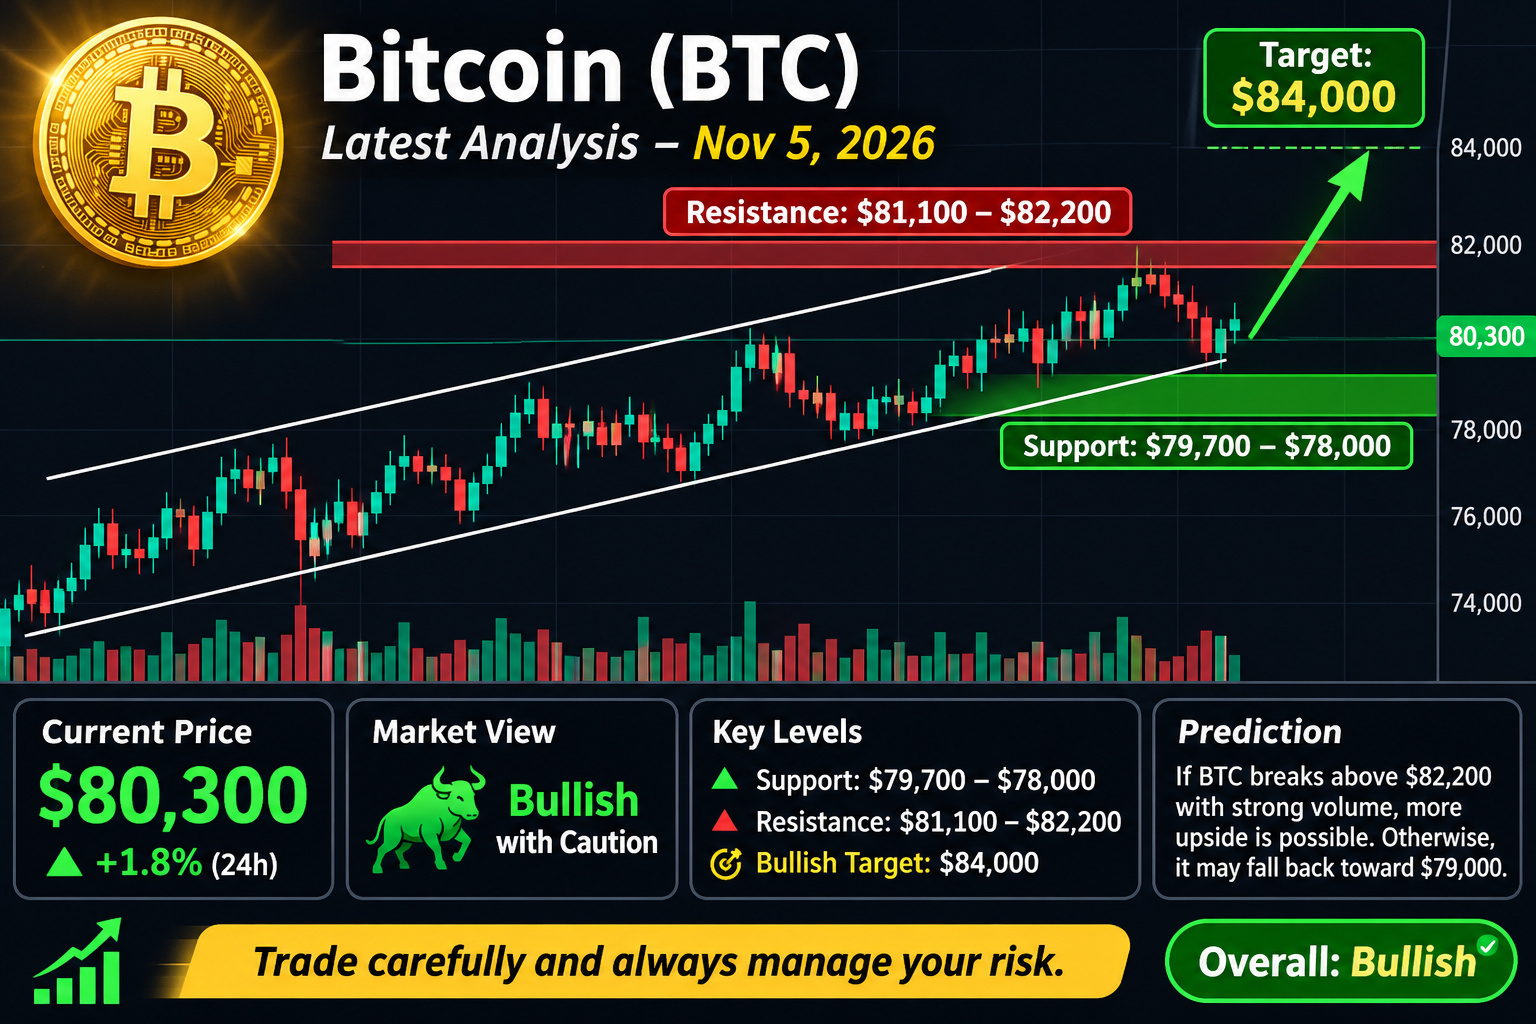
Bitcoin is showing signs of recovery after recent volatility, holding around the $BTC 80,000 level. Buyers are gaining momentum, but strong resistance remains ahead.
Key Levels:
🟢 Support: $79,700 – $78,000
🔴 Resistance: $81,100 – $82,200
🎯 Bullish Target: $84,000
My Market Prediction:
If BTC breaks above $82,200 with strong volume, further upside is possible. However, a rejection could push the price back toward $79,000 or lower.
{spot}(BTCUSDT)
#BinanceReopensWithdrawalsForMoreAssets #Binance98PercentReplenished
Bitcoin is showing signs of recovery after recent volatility, holding around the $BTC 80,000 level. Buyers are gaining momentum, but strong resistance remains ahead.
Key Levels:
🟢 Support: $79,700 – $78,000
🔴 Resistance: $81,100 – $82,200
🎯 Bullish Target: $84,000
My Market Prediction:
If BTC breaks above $82,200 with strong volume, further upside is possible. However, a rejection could push the price back toward $79,000 or lower.
#BinanceReopensWithdrawalsForMoreAssets #Binance98PercentReplenished
Key Levels:
🟢 Support: $79,700 – $78,000
🔴 Resistance: $81,100 – $82,200
🎯 Bullish Target: $84,000
My Market Prediction:
If BTC breaks above $82,200 with strong volume, further upside is possible. However, a rejection could push the price back toward $79,000 or lower.
#BinanceReopensWithdrawalsForMoreAssets #Binance98PercentReplenished
76
·
--
Übersetzung ansehen
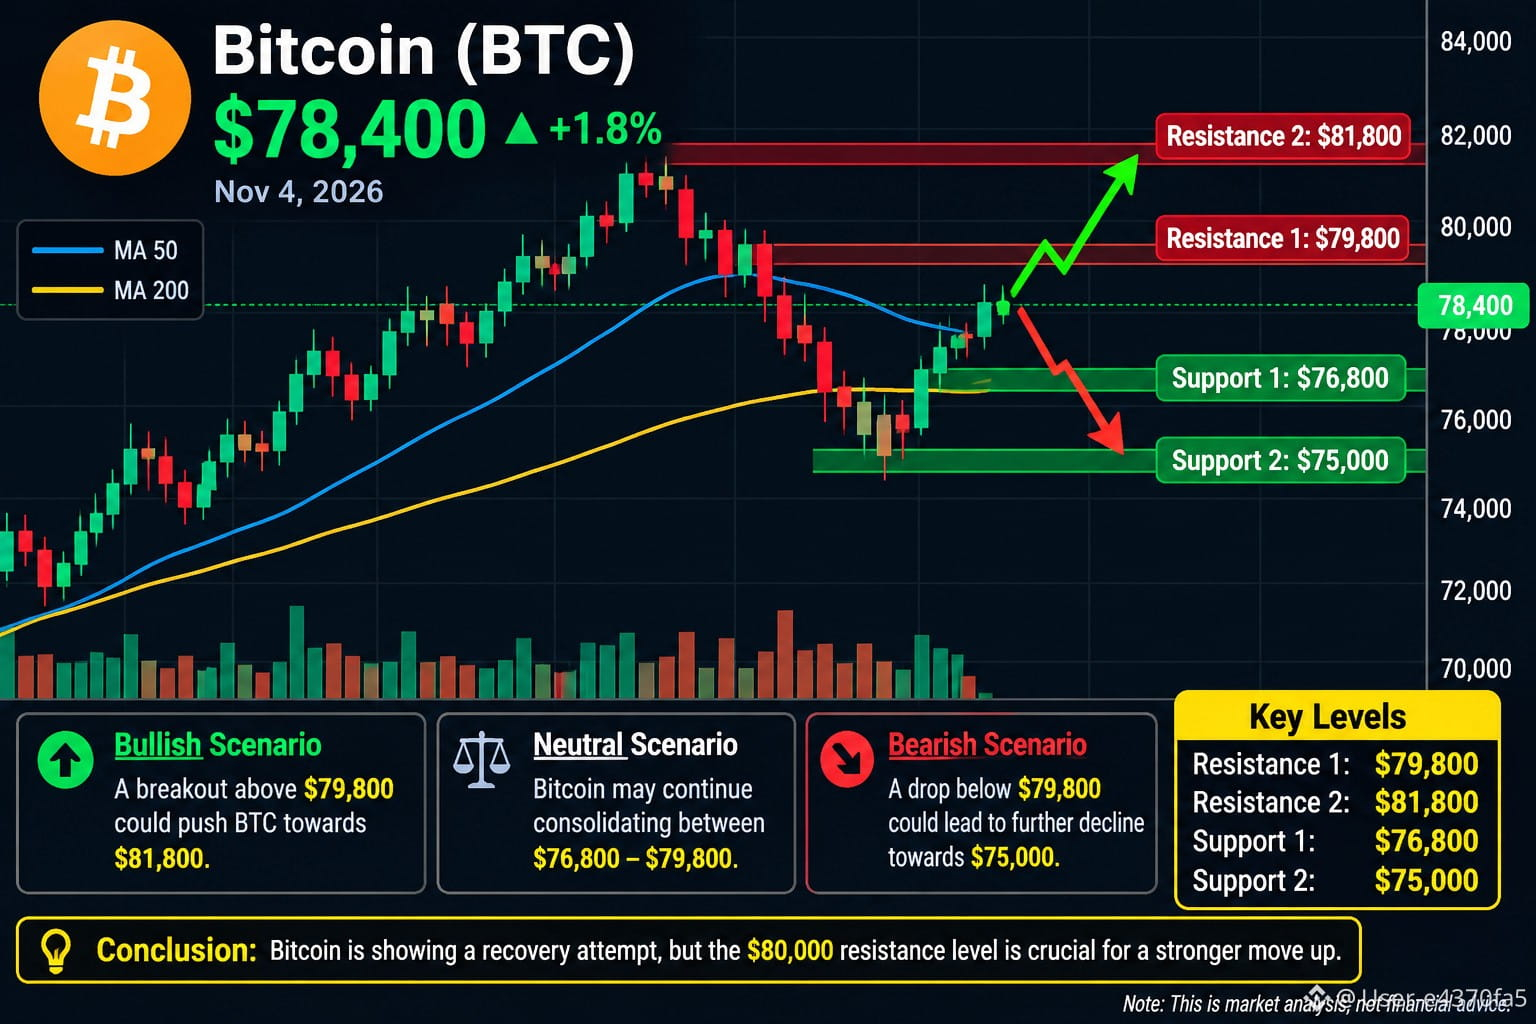
Bitcoin is showing signs of a short-term recovery after recent selling pressure. is trading around
$BTC 78,400, but the overall market remains cautious. Investors are watching the $76,000 support zone and whether Bitcoin can break above $80,000.
Key Technical Levels
Indicator Price
Resistance 1 $79,800
Resistance 2 $81,800
Support 1 $76,800
Support 2 $75,000
Market Outlook
Bullish: A strong breakout above $79,800 could push BTC towards $81,800.
Bearish: A breakdown below $76,800 could lead to further downside towars $75,000.
Neutral: Bitcoin may continue consolidating between $76,800 and $79,800.
{spot}(BTCUSDT)
Bitcoin is showing signs of a short-term recovery after recent selling pressure. is trading around
$BTC 78,400, but the overall market remains cautious. Investors are watching the $76,000 support zone and whether Bitcoin can break above $80,000.
Key Technical Levels
Indicator Price
Resistance 1 $79,800
Resistance 2 $81,800
Support 1 $76,800
Support 2 $75,000
Market Outlook
Bullish: A strong breakout above $79,800 could push BTC towards $81,800.
Bearish: A breakdown below $76,800 could lead to further downside towars $75,000.
Neutral: Bitcoin may continue consolidating between $76,800 and $79,800.
$BTC 78,400, but the overall market remains cautious. Investors are watching the $76,000 support zone and whether Bitcoin can break above $80,000.
Key Technical Levels
Indicator Price
Resistance 1 $79,800
Resistance 2 $81,800
Support 1 $76,800
Support 2 $75,000
Market Outlook
Bullish: A strong breakout above $79,800 could push BTC towards $81,800.
Bearish: A breakdown below $76,800 could lead to further downside towars $75,000.
Neutral: Bitcoin may continue consolidating between $76,800 and $79,800.
48
·
--
Übersetzung ansehen
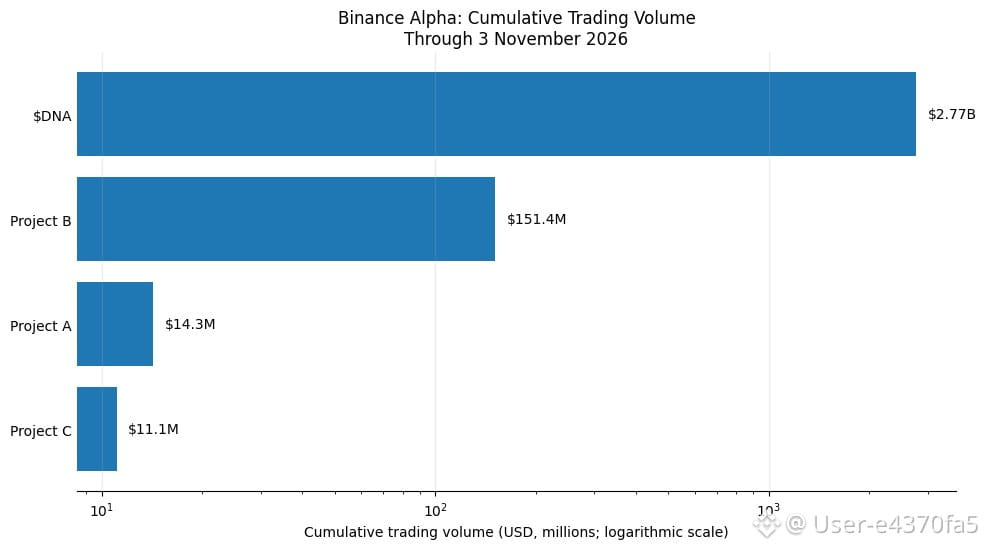
$DNA is showing impressive trading activity on Binance Alpha, recording $2.77 billion in cumulative volume and 85.4 million trades within just 19 days. It has also recorded 14 days with trading volume above $100 million, showing strong market participation.
Compared with similar projects, $DNA is demonstrating significantly higher trading activity, suggesting growing market interest and liquidity.
Market Outlook: Strong trading volume is a positive signal, but investors should monitor price action, liquidity sustainability, and market sentiment before making trading decisions.#DNA_Token #BinanceReopensWithdrawalsForMoreAssets #HongKongToLicenseVirtualAssetCustodyAndAdvisory #BinanceHourlyDepositsExceedWithdrawals #BinanceReopensWithdrawalsForMoreAssets
{alpha}(560xa991f61940095aea0724ef54077223b048c5cf7b)
$DNA is showing impressive trading activity on Binance Alpha, recording $2.77 billion in cumulative volume and 85.4 million trades within just 19 days. It has also recorded 14 days with trading volume above $100 million, showing strong market participation.
Compared with similar projects, $DNA is demonstrating significantly higher trading activity, suggesting growing market interest and liquidity.
Market Outlook: Strong trading volume is a positive signal, but investors should monitor price action, liquidity sustainability, and market sentiment before making trading decisions.#DNA_Token #BinanceReopensWithdrawalsForMoreAssets #HongKongToLicenseVirtualAssetCustodyAndAdvisory #BinanceHourlyDepositsExceedWithdrawals #BinanceReopensWithdrawalsForMoreAssets
Compared with similar projects, $DNA is demonstrating significantly higher trading activity, suggesting growing market interest and liquidity.
Market Outlook: Strong trading volume is a positive signal, but investors should monitor price action, liquidity sustainability, and market sentiment before making trading decisions.#DNA_Token #BinanceReopensWithdrawalsForMoreAssets #HongKongToLicenseVirtualAssetCustodyAndAdvisory #BinanceHourlyDepositsExceedWithdrawals #BinanceReopensWithdrawalsForMoreAssets
103
·
--
Übersetzung ansehen
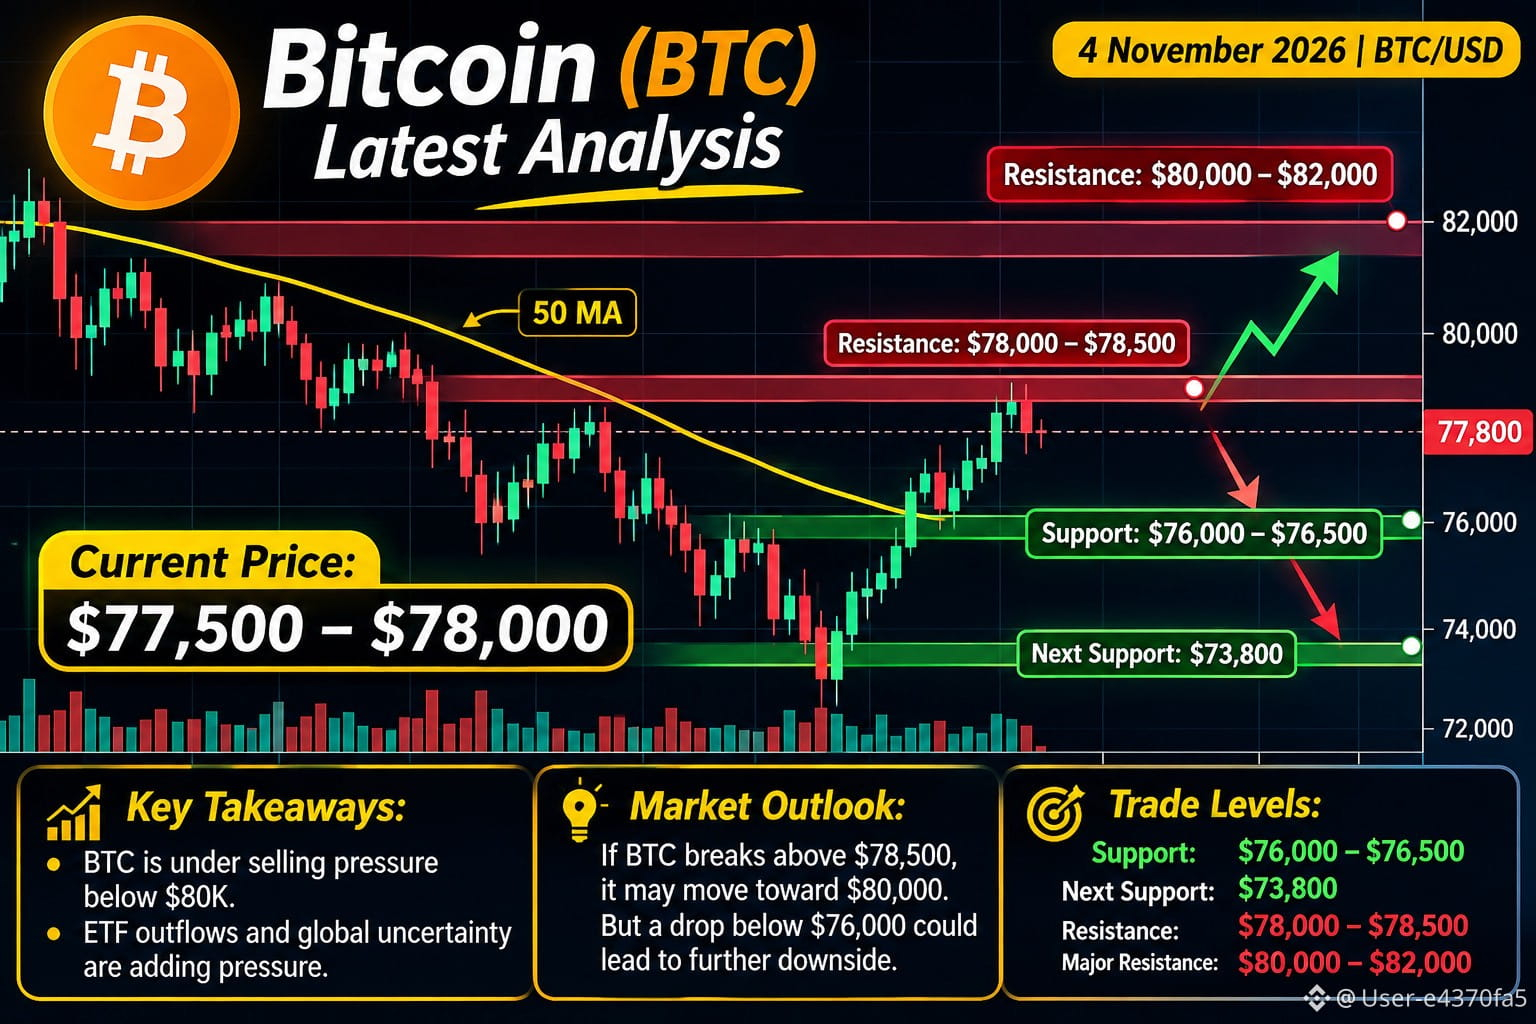
Current price: Around $BTC 78,300
{future}(BTCUSDT)
Bitcoin has recovered after briefly dropping below $76,000. However, selling pressure and institutional ETF outflows are keeping the market uncertain. BTC needs to break above $78,500 to strengthen its recovery.
Key trading levels:
Support: $76,400–$75,600
Stronger support: $73,800
Resistance: $78,500
Next resistance: $80,000–$82,000
Prediction: A breakout above $78,500 could push BTC toward $80,000. A fall below $75,600 could lead to further losses.#USMidterms-WhatAreMarketsExpecting? #USOctoberNFP-AreRateCutsStillPossible #AMDBeatsExpectations-AINarrativeContinues #BinanceIncidentReport #37thQuarterlyBNBBurnRemoves1.64MillionBNB
Current price: Around $BTC 78,300
Bitcoin has recovered after briefly dropping below $76,000. However, selling pressure and institutional ETF outflows are keeping the market uncertain. BTC needs to break above $78,500 to strengthen its recovery.
Key trading levels:
Support: $76,400–$75,600
Stronger support: $73,800
Resistance: $78,500
Next resistance: $80,000–$82,000
Prediction: A breakout above $78,500 could push BTC toward $80,000. A fall below $75,600 could lead to further losses.#USMidterms-WhatAreMarketsExpecting? #USOctoberNFP-AreRateCutsStillPossible #AMDBeatsExpectations-AINarrativeContinues #BinanceIncidentReport #37thQuarterlyBNBBurnRemoves1.64MillionBNB
Bitcoin has recovered after briefly dropping below $76,000. However, selling pressure and institutional ETF outflows are keeping the market uncertain. BTC needs to break above $78,500 to strengthen its recovery.
Key trading levels:
Support: $76,400–$75,600
Stronger support: $73,800
Resistance: $78,500
Next resistance: $80,000–$82,000
Prediction: A breakout above $78,500 could push BTC toward $80,000. A fall below $75,600 could lead to further losses.#USMidterms-WhatAreMarketsExpecting? #USOctoberNFP-AreRateCutsStillPossible #AMDBeatsExpectations-AINarrativeContinues #BinanceIncidentReport #37thQuarterlyBNBBurnRemoves1.64MillionBNB
78
Anmelden und weiter Inhalte entdecken
Krypto-Nutzer weltweit auf Binance Square kennenlernen
⚡️ Bleib in Sachen Krypto stets am Puls.
💬 Die weltgrößte Kryptobörse vertraut darauf.
👍 Erhalte verlässliche Einblicke von verifizierten Creators.
E-Mail-Adresse/Telefonnummer
Trendthemen
BinanceReopensWithdrawalsForHYPE&APT
58,505 Aufrufe
799 Kommentare
Binance schaltet Auszahlungen für HYPE und APT wieder frei und erweitert die Liste der wiederhergestellten Assets
Binance News
·31 Likes
·20.1k Aufrufe
SouthKoreaDraftLawTargets15To20%ShareholderCap
60,288 Aufrufe
522 Kommentare
TradFiForBeginners
163,536 Aufrufe
1,711 Kommentare