
ABO-GHITA
16 Beiträge

ABO-GHITA
Melden
Nutzer blockieren
11 Following
4 Follower
22 Like gegeben
Beiträge
·
--
Nachrichten
Top 3 Kursprognosen: Bitcoin, Ethereum, Ripple – Bären haben die Kontrolle, nächste Unterstützung bei BT09. Nov. 2026, 03:24:49
Bitcoin wird am Montag bei etwa 75.530 $ gehandelt, nachdem der Kurs unter wichtigen EMAs geschlossen hatte. Die nächste Unterstützung liegt bei 70.000 $.
Ethereum notiert bei etwa 2.155 $, nachdem der Kurs vergangene Woche um über 6,5 % korrigiert hatte. Die Bären haben die psychologisch wichtige Marke von 2.000 $ im Visier.
XRP wird am Montag bei etwa 1,11 $ gehandelt, nachdem der Kurs vergangene Woche um über 10 % korrigiert hatte. Die nächste wichtige Zone liegt bei etwa 1 $.
Die Bären haben Bitcoin (BTC), Ethereum (ETH) und Ripple (XRP) weiterhin unter Kontrolle. Die drei größten Kryptowährungen korrigierten vergangene Woche um über 4 %, 6 % beziehungsweise 10 % und verzeichneten damit ihre fünfte Verlustwoche in Folge. BTC wird am Montag bei etwa 75.530 $ gehandelt, nachdem der Kurs unter wichtigen exponentiellen gleitenden Durchschnitten (EMAs) geschlossen hatte. Damit ist die Marke von 70.000 $ die nächste wichtige Unterstützung. ETH bewegt sich unterdessen nahe 2.155 $, während XRP bei etwa 1,11 $ gehandelt wird. Beide Altcoins sind Abwärtsrisiken in Richtung 2.000 $ beziehungsweise 1 $ ausgesetzt.
Nachrichten Top 3 Kursprognosen: Bitcoin, Ethereum, Ripple – Bären haben die Kontrolle, nächste Unterstützung bei BT
09. Nov. 2026, 03:24:49
Bitcoin wird am Montag bei etwa 75.530 $ gehandelt, nachdem der Kurs unter wichtigen EMAs geschlossen hatte. Die nächste Unterstützung liegt bei 70.000 $.
Ethereum notiert bei etwa 2.155 $, nachdem der Kurs vergangene Woche um über 6,5 % korrigiert hatte. Die Bären haben die psychologisch wichtige Marke von 2.000 $ im Visier.
XRP wird am Montag bei etwa 1,11 $ gehandelt, nachdem der Kurs vergangene Woche um über 10 % korrigiert hatte. Die nächste wichtige Zone liegt bei etwa 1 $.
Die Bären haben Bitcoin (BTC), Ethereum (ETH) und Ripple (XRP) weiterhin unter Kontrolle. Die drei größten Kryptowährungen korrigierten vergangene Woche um über 4 %, 6 % beziehungsweise 10 % und verzeichneten damit ihre fünfte Verlustwoche in Folge. BTC wird am Montag bei etwa 75.530 $ gehandelt, nachdem der Kurs unter wichtigen exponentiellen gleitenden Durchschnitten (EMAs) geschlossen hatte. Damit ist die Marke von 70.000 $ die nächste wichtige Unterstützung. ETH bewegt sich unterdessen nahe 2.155 $, während XRP bei etwa 1,11 $ gehandelt wird. Beide Altcoins sind Abwärtsrisiken in Richtung 2.000 $ beziehungsweise 1 $ ausgesetzt.
Bitcoin wird am Montag bei etwa 75.530 $ gehandelt, nachdem der Kurs unter wichtigen EMAs geschlossen hatte. Die nächste Unterstützung liegt bei 70.000 $.
Ethereum notiert bei etwa 2.155 $, nachdem der Kurs vergangene Woche um über 6,5 % korrigiert hatte. Die Bären haben die psychologisch wichtige Marke von 2.000 $ im Visier.
XRP wird am Montag bei etwa 1,11 $ gehandelt, nachdem der Kurs vergangene Woche um über 10 % korrigiert hatte. Die nächste wichtige Zone liegt bei etwa 1 $.
Die Bären haben Bitcoin (BTC), Ethereum (ETH) und Ripple (XRP) weiterhin unter Kontrolle. Die drei größten Kryptowährungen korrigierten vergangene Woche um über 4 %, 6 % beziehungsweise 10 % und verzeichneten damit ihre fünfte Verlustwoche in Folge. BTC wird am Montag bei etwa 75.530 $ gehandelt, nachdem der Kurs unter wichtigen exponentiellen gleitenden Durchschnitten (EMAs) geschlossen hatte. Damit ist die Marke von 70.000 $ die nächste wichtige Unterstützung. ETH bewegt sich unterdessen nahe 2.155 $, während XRP bei etwa 1,11 $ gehandelt wird. Beide Altcoins sind Abwärtsrisiken in Richtung 2.000 $ beziehungsweise 1 $ ausgesetzt.
138
·
--
Übersetzung ansehen
United States CFTC Gold NC Net Positions down to $179.5K from previous $186.5K
06 Nov 2026, 20:33:53
United States CFTC Gold NC Net Positions down to $179.5K from previous $186.5K
06 Nov 2026, 20:33:53
06 Nov 2026, 20:33:53
130
·
--
Aktie von IONQ Inc (IONQ) gab am 12. Okt. um 9,21 % nach: Die Hintergründe der Kursbewegung12. Okt. 2026, 19:15:25
IONQ Inc (IONQ) gab um 9,21 % nach. Der Sektor Software und IT-Dienstleistungen legte um 0,54 % zu. Das Unternehmen entwickelte sich schlechter als die Branche. Die drei umsatzstärksten Aktien des Sektors: Meta Platforms Inc (META) legte um 3,41 % zu; Microsoft Corp (MSFT) um 0,91 %; Alphabet Inc Class A (GOOGL) um 0,28 %.
Was lässt den Aktienkurs von IONQ Inc (IONQ) heute sinken?
IonQ geriet nach der Bekanntgabe einer verbindlichen Vereinbarung zur Übernahme des auf Zero-Trust-Cybersicherheit spezialisierten Unternehmens Elisity in einer reinen Aktientransaktion im Wert von bis zu 1,3 Milliarden US-Dollar stark unter Abwärtsdruck. Während das Management den Deal als strategischen Schritt zur Integration von Post-Quanten-Kryptografie in die Sicherheit von Unternehmensnetzwerken darstellte, reagierten die Marktteilnehmer negativ auf die Struktur der Transaktion. Da der Kauf durch die Ausgabe neuer Aktien finanziert wird, äußerten Anleger umgehend Bedenken hinsichtlich einer Verwässerung ihrer Anteile. Die Marktreaktion wurde durch die zunächst begrenzten Angaben zu Elisitys eigenständigen Finanzkennzahlen und Umsatzzahlen zusätzlich verstärkt, sodass Händler das genaue Übernahmevielfache nicht beurteilen konnten.
Aktie von IONQ Inc (IONQ) gab am 12. Okt. um 9,21 % nach: Die Hintergründe der Kursbewegung
12. Okt. 2026, 19:15:25
IONQ Inc (IONQ) gab um 9,21 % nach. Der Sektor Software und IT-Dienstleistungen legte um 0,54 % zu. Das Unternehmen entwickelte sich schlechter als die Branche. Die drei umsatzstärksten Aktien des Sektors: Meta Platforms Inc (META) legte um 3,41 % zu; Microsoft Corp (MSFT) um 0,91 %; Alphabet Inc Class A (GOOGL) um 0,28 %.
Was lässt den Aktienkurs von IONQ Inc (IONQ) heute sinken?
IonQ geriet nach der Bekanntgabe einer verbindlichen Vereinbarung zur Übernahme des auf Zero-Trust-Cybersicherheit spezialisierten Unternehmens Elisity in einer reinen Aktientransaktion im Wert von bis zu 1,3 Milliarden US-Dollar stark unter Abwärtsdruck. Während das Management den Deal als strategischen Schritt zur Integration von Post-Quanten-Kryptografie in die Sicherheit von Unternehmensnetzwerken darstellte, reagierten die Marktteilnehmer negativ auf die Struktur der Transaktion. Da der Kauf durch die Ausgabe neuer Aktien finanziert wird, äußerten Anleger umgehend Bedenken hinsichtlich einer Verwässerung ihrer Anteile. Die Marktreaktion wurde durch die zunächst begrenzten Angaben zu Elisitys eigenständigen Finanzkennzahlen und Umsatzzahlen zusätzlich verstärkt, sodass Händler das genaue Übernahmevielfache nicht beurteilen konnten.
IONQ Inc (IONQ) gab um 9,21 % nach. Der Sektor Software und IT-Dienstleistungen legte um 0,54 % zu. Das Unternehmen entwickelte sich schlechter als die Branche. Die drei umsatzstärksten Aktien des Sektors: Meta Platforms Inc (META) legte um 3,41 % zu; Microsoft Corp (MSFT) um 0,91 %; Alphabet Inc Class A (GOOGL) um 0,28 %.
Was lässt den Aktienkurs von IONQ Inc (IONQ) heute sinken?
IonQ geriet nach der Bekanntgabe einer verbindlichen Vereinbarung zur Übernahme des auf Zero-Trust-Cybersicherheit spezialisierten Unternehmens Elisity in einer reinen Aktientransaktion im Wert von bis zu 1,3 Milliarden US-Dollar stark unter Abwärtsdruck. Während das Management den Deal als strategischen Schritt zur Integration von Post-Quanten-Kryptografie in die Sicherheit von Unternehmensnetzwerken darstellte, reagierten die Marktteilnehmer negativ auf die Struktur der Transaktion. Da der Kauf durch die Ausgabe neuer Aktien finanziert wird, äußerten Anleger umgehend Bedenken hinsichtlich einer Verwässerung ihrer Anteile. Die Marktreaktion wurde durch die zunächst begrenzten Angaben zu Elisitys eigenständigen Finanzkennzahlen und Umsatzzahlen zusätzlich verstärkt, sodass Händler das genaue Übernahmevielfache nicht beurteilen konnten.
195
·
--
Übersetzung ansehen
News
India Gold price today: Gold falls, according to FXStreet data
06 Nov 2026, 04:41:08
Gold prices fell in India on Friday, according to data compiled by FXStreet.
The price for Gold stood at 12,272.80 Indian Rupees (INR) per gram, down compared with the INR 12,437.96 it cost on Thursday.
The price for Gold decreased to INR 143,147.50 per tola from INR 145,073.90 per tola a day earlier.
Unit measure
Gold Price in INR
1 Gram
12,272.80
10 Grams
122,731.50
Tola
143,147.50
Troy Ounce
381,739.80
FXStreet calculates Gold prices in India by adapting international prices (USD/INR) to the local currency and measurement units. Prices are updated daily based on the market rates taken at the time of publication. Prices are just for reference and local rates could diverge slightly.
News
India Gold price today: Gold falls, according to FXStreet data
06 Nov 2026, 04:41:08
Gold prices fell in India on Friday, according to data compiled by FXStreet.
The price for Gold stood at 12,272.80 Indian Rupees (INR) per gram, down compared with the INR 12,437.96 it cost on Thursday.
The price for Gold decreased to INR 143,147.50 per tola from INR 145,073.90 per tola a day earlier.
Unit measure
Gold Price in INR
1 Gram
12,272.80
10 Grams
122,731.50
Tola
143,147.50
Troy Ounce
381,739.80
FXStreet calculates Gold prices in India by adapting international prices (USD/INR) to the local currency and measurement units. Prices are updated daily based on the market rates taken at the time of publication. Prices are just for reference and local rates could diverge slightly.
India Gold price today: Gold falls, according to FXStreet data
06 Nov 2026, 04:41:08
Gold prices fell in India on Friday, according to data compiled by FXStreet.
The price for Gold stood at 12,272.80 Indian Rupees (INR) per gram, down compared with the INR 12,437.96 it cost on Thursday.
The price for Gold decreased to INR 143,147.50 per tola from INR 145,073.90 per tola a day earlier.
Unit measure
Gold Price in INR
1 Gram
12,272.80
10 Grams
122,731.50
Tola
143,147.50
Troy Ounce
381,739.80
FXStreet calculates Gold prices in India by adapting international prices (USD/INR) to the local currency and measurement units. Prices are updated daily based on the market rates taken at the time of publication. Prices are just for reference and local rates could diverge slightly.
2
200
·
--
Übersetzung ansehen
Inflationary or deflationary tendencies are measured by periodically summing the prices of a basket of representative goods and services and presenting the data as The Consumer Price Index (CPI). CPI data is compiled on a monthly basis and released by the US Department of Labor Statistics. The YoY reading compares the prices of goods in the reference month to the same month a year earlier.The CPI is a key indicator to measure inflation and changes in purchasing trends. Generally speaking, a high reading is seen as bullish for the US Dollar (USD), while a low reading is seen as bearish.
Inflationary or deflationary tendencies are measured by periodically summing the prices of a basket of representative goods and services and presenting the data as The Consumer Price Index (CPI). CPI data is compiled on a monthly basis and released by the US Department of Labor Statistics. The YoY reading compares the prices of goods in the reference month to the same month a year earlier.The CPI is a key indicator to measure inflation and changes in purchasing trends. Generally speaking, a high reading is seen as bullish for the US Dollar (USD), while a low reading is seen as bearish.
2
2
·
--
Übersetzung ansehen
The Unemployment Rate released by the Eurostat is the percentage of unemployed workers in the total civilian labor force. It is a leading indicator for the economy of the European Union. If the rate goes up, it indicates a lack of expansion within the European labor market and a weakening of the economy. Generally speaking, a decrease of the figure is seen as bullish for the Euro (EUR), while an increase is seen as bearish
The Unemployment Rate released by the Eurostat is the percentage of unemployed workers in the total civilian labor force. It is a leading indicator for the economy of the European Union. If the rate goes up, it indicates a lack of expansion within the European labor market and a weakening of the economy. Generally speaking, a decrease of the figure is seen as bullish for the Euro (EUR), while an increase is seen as bearish
2
99
·
--
Übersetzung ansehen
News
Copper: Supply risks grow despite strong US imports – Commerzbank
03 Nov 2026, 20:26:00
Commerzbank’s commodity team highlights disappointing Chilean Copper output, leaving third‑quarter production at a two‑decade low. Cochilco now forecasts an 8.4% slump in 2026 output and only a modest 3% recovery in 2027. Strong US import demand offers support, but Copper prices have still fallen below USD 14,000 per ton amid broader risk aversion and tech‑stock selling.
Chile cuts forecasts, prices under pressure
"Accordingly, the state copper commission Cochilco has revised its production forecast sharply downwards: instead of a marginal decline of 0.6%, it now expects production in the world’s largest copper-producing country to slump by 8.4% to 4.94 million tons this year."
"For next year, the commission at least forecasts a modest recovery of 3% to just under 5.1 million tons (previous forecast: 5.55 million tons)."
"Copper also receives support from persistently strong US import demand: according to information provider IHS Markit, 207,000 tons of copper were imported in October."
"However, the figures are not helping copper prices this morning: amid increased risk aversion towards technology stocks, copper is also being dragged lower, falling below USD 14,000 per ton to a seven-week low."
(This article was created with the help of an Artificial Intelligence tool and reviewed by an editor. Know more.)
Source:Fxstreet
News
Copper: Supply risks grow despite strong US imports – Commerzbank
03 Nov 2026, 20:26:00
Commerzbank’s commodity team highlights disappointing Chilean Copper output, leaving third‑quarter production at a two‑decade low. Cochilco now forecasts an 8.4% slump in 2026 output and only a modest 3% recovery in 2027. Strong US import demand offers support, but Copper prices have still fallen below USD 14,000 per ton amid broader risk aversion and tech‑stock selling.
Chile cuts forecasts, prices under pressure
"Accordingly, the state copper commission Cochilco has revised its production forecast sharply downwards: instead of a marginal decline of 0.6%, it now expects production in the world’s largest copper-producing country to slump by 8.4% to 4.94 million tons this year."
"For next year, the commission at least forecasts a modest recovery of 3% to just under 5.1 million tons (previous forecast: 5.55 million tons)."
"Copper also receives support from persistently strong US import demand: according to information provider IHS Markit, 207,000 tons of copper were imported in October."
"However, the figures are not helping copper prices this morning: amid increased risk aversion towards technology stocks, copper is also being dragged lower, falling below USD 14,000 per ton to a seven-week low."
(This article was created with the help of an Artificial Intelligence tool and reviewed by an editor. Know more.)
Source:Fxstreet
Copper: Supply risks grow despite strong US imports – Commerzbank
03 Nov 2026, 20:26:00
Commerzbank’s commodity team highlights disappointing Chilean Copper output, leaving third‑quarter production at a two‑decade low. Cochilco now forecasts an 8.4% slump in 2026 output and only a modest 3% recovery in 2027. Strong US import demand offers support, but Copper prices have still fallen below USD 14,000 per ton amid broader risk aversion and tech‑stock selling.
Chile cuts forecasts, prices under pressure
"Accordingly, the state copper commission Cochilco has revised its production forecast sharply downwards: instead of a marginal decline of 0.6%, it now expects production in the world’s largest copper-producing country to slump by 8.4% to 4.94 million tons this year."
"For next year, the commission at least forecasts a modest recovery of 3% to just under 5.1 million tons (previous forecast: 5.55 million tons)."
"Copper also receives support from persistently strong US import demand: according to information provider IHS Markit, 207,000 tons of copper were imported in October."
"However, the figures are not helping copper prices this morning: amid increased risk aversion towards technology stocks, copper is also being dragged lower, falling below USD 14,000 per ton to a seven-week low."
(This article was created with the help of an Artificial Intelligence tool and reviewed by an editor. Know more.)
Source:Fxstreet
2
203
·
--
Übersetzung ansehen
News
Federal Reserve: One more 2026 hike then murkier path – BNY
03 Nov 2026, 11:59:40
BNY Markets’ John Velis maintains the view that the Federal Reserve will deliver one additional rate hike in December to preserve credibility after its latest hold. He sees a murkier outlook heading into 2027, arguing inflation is mainly supply-driven and expectations anchored. Velis doubts higher rates can address supply pressures but warns demand-side risks could justify more tightening later.
December hike then uncertain 2027 path
"After last week’s anticipated hold by the FOMC, we maintain our view that there will be one additional rate hike in December this year, to preserve Fed credibility. Heading into 2027, the landscape appears much murkier."
"Yes, inflation remains high, and the recent bout of higher oil prices will undoubtedly keep the pressure on prices. We’ve argued, and continue to argue, that inflation is mainly supply driven, and that inflation expectations remain well anchored over long horizons."
"We’re not convinced that higher rates will be able to rein in supply pressures, as they are indeed a demand-management tool. Nevertheless, it bears watching to see if demand-side pressures emerge in 2027, in which case interest rate remedies would be appropriate."
"We noted with some interest Warsh’s assertion at last week’s press conference that the interest rate hike in September tightened financial conditions meaningfully, since aside from the AI-related wobbles in October, there’s scant evidence of such tightening pervading across the real economy."
"Still, should financial jitters persist, conditions will naturally tighten, requiring fewer hikes in 2027 than the two currently priced in."
(This article was created with the help of an Artificial Intelligence tool and reviewed by an editor. Know more.)
Source:Fxstreet
News
Federal Reserve: One more 2026 hike then murkier path – BNY
03 Nov 2026, 11:59:40
BNY Markets’ John Velis maintains the view that the Federal Reserve will deliver one additional rate hike in December to preserve credibility after its latest hold. He sees a murkier outlook heading into 2027, arguing inflation is mainly supply-driven and expectations anchored. Velis doubts higher rates can address supply pressures but warns demand-side risks could justify more tightening later.
December hike then uncertain 2027 path
"After last week’s anticipated hold by the FOMC, we maintain our view that there will be one additional rate hike in December this year, to preserve Fed credibility. Heading into 2027, the landscape appears much murkier."
"Yes, inflation remains high, and the recent bout of higher oil prices will undoubtedly keep the pressure on prices. We’ve argued, and continue to argue, that inflation is mainly supply driven, and that inflation expectations remain well anchored over long horizons."
"We’re not convinced that higher rates will be able to rein in supply pressures, as they are indeed a demand-management tool. Nevertheless, it bears watching to see if demand-side pressures emerge in 2027, in which case interest rate remedies would be appropriate."
"We noted with some interest Warsh’s assertion at last week’s press conference that the interest rate hike in September tightened financial conditions meaningfully, since aside from the AI-related wobbles in October, there’s scant evidence of such tightening pervading across the real economy."
"Still, should financial jitters persist, conditions will naturally tighten, requiring fewer hikes in 2027 than the two currently priced in."
(This article was created with the help of an Artificial Intelligence tool and reviewed by an editor. Know more.)
Source:Fxstreet
Federal Reserve: One more 2026 hike then murkier path – BNY
03 Nov 2026, 11:59:40
BNY Markets’ John Velis maintains the view that the Federal Reserve will deliver one additional rate hike in December to preserve credibility after its latest hold. He sees a murkier outlook heading into 2027, arguing inflation is mainly supply-driven and expectations anchored. Velis doubts higher rates can address supply pressures but warns demand-side risks could justify more tightening later.
December hike then uncertain 2027 path
"After last week’s anticipated hold by the FOMC, we maintain our view that there will be one additional rate hike in December this year, to preserve Fed credibility. Heading into 2027, the landscape appears much murkier."
"Yes, inflation remains high, and the recent bout of higher oil prices will undoubtedly keep the pressure on prices. We’ve argued, and continue to argue, that inflation is mainly supply driven, and that inflation expectations remain well anchored over long horizons."
"We’re not convinced that higher rates will be able to rein in supply pressures, as they are indeed a demand-management tool. Nevertheless, it bears watching to see if demand-side pressures emerge in 2027, in which case interest rate remedies would be appropriate."
"We noted with some interest Warsh’s assertion at last week’s press conference that the interest rate hike in September tightened financial conditions meaningfully, since aside from the AI-related wobbles in October, there’s scant evidence of such tightening pervading across the real economy."
"Still, should financial jitters persist, conditions will naturally tighten, requiring fewer hikes in 2027 than the two currently priced in."
(This article was created with the help of an Artificial Intelligence tool and reviewed by an editor. Know more.)
Source:Fxstreet
2
57
·
--
Nachrichten
Gold: Abwärtstendenz hält an, aber mit begrenzter Anschlussbewegung – UOB
03. Nov. 2026, 11:23:06
Quek Ser Leang von der United Overseas Bank (UOB) merkt an, dass Spotgold weiter unter Druck steht, nachdem es am 22. Oktober eine aufsteigende Trendlinie durchbrochen hatte und am 30. Oktober unter 3.943 $ auf ein Jahrestief nahe 3.870 $ gefallen war. Die starke Abwärtsdynamik deutet auf ein weiteres Abwärtsrisiko in Richtung 3.700 $ hin, obwohl die Bank eine geringe Wahrscheinlichkeit für anhaltende Verluste unterhalb dieses Niveaus sieht.
Gold setzt seinen Rückgang in Richtung 3.700 $ fort
„Zwar durchbrach Spotgold am 22. Oktober die oben erwähnte Trendlinie, zunächst folgte darauf jedoch kaum eine weitere Bewegung.“
„Am vergangenen Freitag fiel der Kurs jedoch in einer kräftigen Bewegung unter 3.943 $ und erreichte mit 3.870 $ ein Jahrestief.“
„Der Rückgang bewegt sich zwar in den überverkauften Bereich, doch die starke Abwärtsdynamik deutet darauf hin, dass Gold weiter bis auf 3.700 $ fallen könnte.“
„Derzeit ist die Wahrscheinlichkeit eines anhaltenden Rückgangs unter 3.700 $ gering.“
(Dieser Artikel wurde mithilfe eines Tools für künstliche Intelligenz erstellt und von einem Redakteur geprüft. Mehr erfahren.)
Quelle: Fxstreet
Nachrichten
Gold: Abwärtstendenz hält an, aber mit begrenzter Anschlussbewegung – UOB
03. Nov. 2026, 11:23:06
Quek Ser Leang von der United Overseas Bank (UOB) merkt an, dass Spotgold weiter unter Druck steht, nachdem es am 22. Oktober eine aufsteigende Trendlinie durchbrochen hatte und am 30. Oktober unter 3.943 $ auf ein Jahrestief nahe 3.870 $ gefallen war. Die starke Abwärtsdynamik deutet auf ein weiteres Abwärtsrisiko in Richtung 3.700 $ hin, obwohl die Bank eine geringe Wahrscheinlichkeit für anhaltende Verluste unterhalb dieses Niveaus sieht.
Gold setzt seinen Rückgang in Richtung 3.700 $ fort
„Zwar durchbrach Spotgold am 22. Oktober die oben erwähnte Trendlinie, zunächst folgte darauf jedoch kaum eine weitere Bewegung.“
„Am vergangenen Freitag fiel der Kurs jedoch in einer kräftigen Bewegung unter 3.943 $ und erreichte mit 3.870 $ ein Jahrestief.“
„Der Rückgang bewegt sich zwar in den überverkauften Bereich, doch die starke Abwärtsdynamik deutet darauf hin, dass Gold weiter bis auf 3.700 $ fallen könnte.“
„Derzeit ist die Wahrscheinlichkeit eines anhaltenden Rückgangs unter 3.700 $ gering.“
(Dieser Artikel wurde mithilfe eines Tools für künstliche Intelligenz erstellt und von einem Redakteur geprüft. Mehr erfahren.)
Quelle: Fxstreet
Gold: Abwärtstendenz hält an, aber mit begrenzter Anschlussbewegung – UOB
03. Nov. 2026, 11:23:06
Quek Ser Leang von der United Overseas Bank (UOB) merkt an, dass Spotgold weiter unter Druck steht, nachdem es am 22. Oktober eine aufsteigende Trendlinie durchbrochen hatte und am 30. Oktober unter 3.943 $ auf ein Jahrestief nahe 3.870 $ gefallen war. Die starke Abwärtsdynamik deutet auf ein weiteres Abwärtsrisiko in Richtung 3.700 $ hin, obwohl die Bank eine geringe Wahrscheinlichkeit für anhaltende Verluste unterhalb dieses Niveaus sieht.
Gold setzt seinen Rückgang in Richtung 3.700 $ fort
„Zwar durchbrach Spotgold am 22. Oktober die oben erwähnte Trendlinie, zunächst folgte darauf jedoch kaum eine weitere Bewegung.“
„Am vergangenen Freitag fiel der Kurs jedoch in einer kräftigen Bewegung unter 3.943 $ und erreichte mit 3.870 $ ein Jahrestief.“
„Der Rückgang bewegt sich zwar in den überverkauften Bereich, doch die starke Abwärtsdynamik deutet darauf hin, dass Gold weiter bis auf 3.700 $ fallen könnte.“
„Derzeit ist die Wahrscheinlichkeit eines anhaltenden Rückgangs unter 3.700 $ gering.“
(Dieser Artikel wurde mithilfe eines Tools für künstliche Intelligenz erstellt und von einem Redakteur geprüft. Mehr erfahren.)
Quelle: Fxstreet
2
166
·
--
Übersetzung ansehen
Calculate your profit yourself .. 💸💰🫵
— Aramco: Annual return 5.23%
— Alinma Bank: Annual return 4.63%
— STC: Annual return 5.32%
— Savola: Annual return 5.71%
— SABIC: Annual return 4.79%
— Al Rajhi Bank: Annual return 3.78%
— Qassim Cement: Annual return 7.49%
— Extra: Annual return 8.52%
— Jarir: Annual return 5.41%
— SABIC Agri-Nutrients: Annual return 6.15%
— Nahdi: Annual return 6.16%
Calculation method:
Multiply the investment amount * the rate
Example: If you invested 10 thousand riyals in Aramco, then your annual profit is 523 riyals ✅️☝️
Of course, the return is not fixed and changes with changes in the share price and the amount of distributions.
Calculate your profit yourself .. 💸💰🫵
— Aramco: Annual return 5.23%
— Alinma Bank: Annual return 4.63%
— STC: Annual return 5.32%
— Savola: Annual return 5.71%
— SABIC: Annual return 4.79%
— Al Rajhi Bank: Annual return 3.78%
— Qassim Cement: Annual return 7.49%
— Extra: Annual return 8.52%
— Jarir: Annual return 5.41%
— SABIC Agri-Nutrients: Annual return 6.15%
— Nahdi: Annual return 6.16%
Calculation method:
Multiply the investment amount * the rate
Example: If you invested 10 thousand riyals in Aramco, then your annual profit is 523 riyals ✅️☝️
Of course, the return is not fixed and changes with changes in the share price and the amount of distributions.
— Aramco: Annual return 5.23%
— Alinma Bank: Annual return 4.63%
— STC: Annual return 5.32%
— Savola: Annual return 5.71%
— SABIC: Annual return 4.79%
— Al Rajhi Bank: Annual return 3.78%
— Qassim Cement: Annual return 7.49%
— Extra: Annual return 8.52%
— Jarir: Annual return 5.41%
— SABIC Agri-Nutrients: Annual return 6.15%
— Nahdi: Annual return 6.16%
Calculation method:
Multiply the investment amount * the rate
Example: If you invested 10 thousand riyals in Aramco, then your annual profit is 523 riyals ✅️☝️
Of course, the return is not fixed and changes with changes in the share price and the amount of distributions.
2
45
·
--
Übersetzung ansehen
Will US Stocks Rise After Midterm Elections? Analysis of Historical Election Data and Market Patte2026-11-2 10:03
Fact CheckerMitrade
fengmian
TradingKey - As the U.S. midterm elections approach, in addition to focusing on the election results and their impact on economic policies, investors are also searching for clues regarding the next phase of U.S. stock market trends.
Although the S&P 500 Index remains near record highs, semiconductor and popular AI stocks have experienced a noticeable pullback recently, and market concerns over high valuations, returns on AI capital expenditure, and the interest rate outlook have not faded.
Historical data offers a relatively optimistic answer. Following the conclusion of midterm elections, U.S. stocks typically enter a phase of stronger performance. However, this pattern primarily reflects a decrease in political uncertainty, stabilizing policy expectations, and improving corporate earnings, and does not mean the market will inevitably rise.
US Stocks Are Typically Strong After Midterm Elections
According to statistics from Matt Cerminaro, founder of Exhibit A, the S&P 500 Index has posted an average gain of 15.5% from Midterm Election Day through June 30 of the following year since 1950. Another study by JPMorgan also shows that since 1950, the S&P 500 has generated positive returns in the 12 months following every midterm election, with an average gain of approximately 15%.
sp500-1421509181b94902b75108c205eae41b
If the observation window is narrowed to the six months following an election, the seasonal pattern is equally evident. Since the S&P 500 Index was established in 1957, the index has never posted a negative return during the November-to-April period following a midterm election, and its overall performance has significantly outperformed the same period in other years of a presidential term.
Why US Stocks Are More Likely to Rise After Midterm Elections
A decline in political uncertainty is an important factor explaining this pattern. Research by Terry Marsh, professor emeritus of finance at UC Berkeley, and Kam Fong Chan, professor at the University of Western Australia, found that the U.S. Economic Policy Uncertainty Index typically rises in the months leading up to midterm elections and falls significantly after the elections.
After the election results are announced, investors can more accurately gauge the congressional power structure and the future direction of taxation, fiscal spending, and industry regulation. As political risks that need to be priced into stock prices decrease, capital often flows back into risk assets such as equities.
Historical data also shows that the market does not consistently favor any single political party. Compared to a victory by the Republicans or Democrats, whether the policy environment is stable and whether the structure of government power is clear generally have a more direct impact on asset prices. Fidelity research shows that weak performance in midterm election years is often linked to rising policy uncertainty rather than investors simply supporting a specific party.
Seasonal factors also help: the period from November after the midterm elections through April of the following year is inherently a traditionally strong period for U.S. equities. The waning of election uncertainty coinciding with favorable seasonality makes historical returns during these six months particularly notable.
Why the Third Year of a Presidential Term Usually Performs Best
Following the midterm elections, the U.S. will enter the third year of the presidential four-year term. According to data from CFRA Research, the S&P 500 Index has averaged a gain of 16.3% in the third year of a presidential term, higher than the first year's 9.5%, the second year's 3.8%, and the fourth year's 6.8%.
In terms of quarterly performance, the fourth quarter of a midterm election year rises by an average of 6.4%, ranking second among all 16 quarters in the four-year cycle; closely following it, the first quarter of the third year averages a 7% gain, making it historically the strongest quarter.
This pattern may be linked to policy cycles: to campaign for the next presidential election, the governing party typically pushes policies in the second half of its term to stimulate the economy, improve employment, or raise household income. These measures are gradually reflected in consumption, investment, and corporate earnings, thereby providing fundamental support for the stock market.
However, fiscal stimulus does not come without a price. If policies further drive up deficits, inflation, and Treasury yields, highly valued growth stocks may instead face greater pressure. Therefore, the historical advantage of the third year still requires support from the interest rate and corporate earnings environment.
Can US Stocks Repeat Historical Patterns in 2026
One of the market's biggest headwinds currently is high interest rates. Even as the 10-year U.S. Treasury yield once pulled back below 5%, long-term financing costs remain at multi-year highs. Higher risk-free yields diminish the relative appeal of equities and increase the costs for companies to construct data centers, procure AI chips, and expand production capacity.
The return on AI capital expenditures will also impact the post-election market trend. Big tech companies such as Meta are committing massive funds to build computing infrastructure, but the market is increasingly focused on when this capex can translate into revenue and free cash flow. If growth in cloud computing, advertising, and enterprise AI businesses fails to cover depreciation and financing costs, tech stock valuations may remain under pressure.
The upcoming Anthropic IPO may also add liquidity-drainage pressure to the stock market. A large-scale initial public offering requires absorbing substantial liquidity; if it coincides with high interest rates and waning risk appetite, short-term volatility in the tech sector could amplify further.
On a relatively positive note, U.S. mega-cap corporate earnings remain resilient. As long as 2027 earnings expectations are not significantly revised downward, corporate profit growth could offset some of the pressure from interest rates and oil prices. Given that tech stocks account for nearly 40% of the S&P 500's weight, for the index to replicate historical post-election gains, tech giants including Microsoft, Nvidia, Apple, Amazon, and Meta will still need to participate in the rally.
Overall, historical data following U.S. midterm elections is relatively optimistic for U.S. equities, but what truly drives the market is not the election itself, but rather reduced political uncertainty, stable policy expectations, and corporate earnings growth. The historical average gain of around 15% can serve as a reference for market research, but should not be viewed as a definitive forecast. Once the election concludes, investors will still need to closely monitor Treasury yields, inflation, AI investment returns, and earnings guidance from big tech companies.
Disclaimer: For information purposes only. Past performance is not indicative of future results.
Get it on
Will US Stocks Rise After Midterm Elections? Analysis of Historical Election Data and Market Patterns
TradingKey
2026-11-2 10:03
Fact CheckerMitrade
fengmian
TradingKey - As the U.S. midterm elections approach, in addition to focusing on the election results and their impact on economic policies, investors are also searching for clues regarding the next phase of U.S. stock market trends.
Although the S&P 500 Index remains near record highs, semiconductor and popular AI stocks have experienced a noticeable pullback recently, and market concerns over high valuations, returns on AI capital expenditure, and the interest rate outlook have not faded.
Historical data offers a relatively optimistic answer. Following the conclusion of midterm elections, U.S. stocks typically enter a phase of stronger performance. However, this pattern primarily reflects a decrease in political uncertainty, stabilizing policy expectations, and improving corporate earnings, and does not mean the market will inevitably rise.
US Stocks Are Typically Strong After Midterm Elections
According to statistics from Matt Cerminaro, founder of Exhibit A, the S&P 500 Index has posted an average gain of 15.5% from Midterm Election Day through June 30 of the following year since 1950. Another study by JPMorgan also shows that since 1950, the S&P 500 has generated positive returns in the 12 months following every midterm election, with an average gain of approximately 15%.
sp500-1421509181b94902b75108c205eae41b
If the observation window is narrowed to the six months following an election, the seasonal pattern is equally evident. Since the S&P 500 Index was established in 1957, the index has never posted a negative return during the November-to-April period following a midterm election, and its overall performance has significantly outperformed the same period in other years of a presidential term.
Why US Stocks Are More Likely to Rise After Midterm Elections
A decline in political uncertainty is an important factor explaining this pattern. Research by Terry Marsh, professor emeritus of finance at UC Berkeley, and Kam Fong Chan, professor at the University of Western Australia, found that the U.S. Economic Policy Uncertainty Index typically rises in the months leading up to midterm elections and falls significantly after the elections.
After the election results are announced, investors can more accurately gauge the congressional power structure and the future direction of taxation, fiscal spending, and industry regulation. As political risks that need to be priced into stock prices decrease, capital often flows back into risk assets such as equities.
Historical data also shows that the market does not consistently favor any single political party. Compared to a victory by the Republicans or Democrats, whether the policy environment is stable and whether the structure of government power is clear generally have a more direct impact on asset prices. Fidelity research shows that weak performance in midterm election years is often linked to rising policy uncertainty rather than investors simply supporting a specific party.
Seasonal factors also help: the period from November after the midterm elections through April of the following year is inherently a traditionally strong period for U.S. equities. The waning of election uncertainty coinciding with favorable seasonality makes historical returns during these six months particularly notable.
Why the Third Year of a Presidential Term Usually Performs Best
Following the midterm elections, the U.S. will enter the third year of the presidential four-year term. According to data from CFRA Research, the S&P 500 Index has averaged a gain of 16.3% in the third year of a presidential term, higher than the first year's 9.5%, the second year's 3.8%, and the fourth year's 6.8%.
In terms of quarterly performance, the fourth quarter of a midterm election year rises by an average of 6.4%, ranking second among all 16 quarters in the four-year cycle; closely following it, the first quarter of the third year averages a 7% gain, making it historically the strongest quarter.
This pattern may be linked to policy cycles: to campaign for the next presidential election, the governing party typically pushes policies in the second half of its term to stimulate the economy, improve employment, or raise household income. These measures are gradually reflected in consumption, investment, and corporate earnings, thereby providing fundamental support for the stock market.
However, fiscal stimulus does not come without a price. If policies further drive up deficits, inflation, and Treasury yields, highly valued growth stocks may instead face greater pressure. Therefore, the historical advantage of the third year still requires support from the interest rate and corporate earnings environment.
Can US Stocks Repeat Historical Patterns in 2026
One of the market's biggest headwinds currently is high interest rates. Even as the 10-year U.S. Treasury yield once pulled back below 5%, long-term financing costs remain at multi-year highs. Higher risk-free yields diminish the relative appeal of equities and increase the costs for companies to construct data centers, procure AI chips, and expand production capacity.
The return on AI capital expenditures will also impact the post-election market trend. Big tech companies such as Meta are committing massive funds to build computing infrastructure, but the market is increasingly focused on when this capex can translate into revenue and free cash flow. If growth in cloud computing, advertising, and enterprise AI businesses fails to cover depreciation and financing costs, tech stock valuations may remain under pressure.
The upcoming Anthropic IPO may also add liquidity-drainage pressure to the stock market. A large-scale initial public offering requires absorbing substantial liquidity; if it coincides with high interest rates and waning risk appetite, short-term volatility in the tech sector could amplify further.
On a relatively positive note, U.S. mega-cap corporate earnings remain resilient. As long as 2027 earnings expectations are not significantly revised downward, corporate profit growth could offset some of the pressure from interest rates and oil prices. Given that tech stocks account for nearly 40% of the S&P 500's weight, for the index to replicate historical post-election gains, tech giants including Microsoft, Nvidia, Apple, Amazon, and Meta will still need to participate in the rally.
Overall, historical data following U.S. midterm elections is relatively optimistic for U.S. equities, but what truly drives the market is not the election itself, but rather reduced political uncertainty, stable policy expectations, and corporate earnings growth. The historical average gain of around 15% can serve as a reference for market research, but should not be viewed as a definitive forecast. Once the election concludes, investors will still need to closely monitor Treasury yields, inflation, AI investment returns, and earnings guidance from big tech companies.
Will US Stocks Rise After Midterm Elections? Analysis of Historical Election Data and Market Patte
2026-11-2 10:03
Fact CheckerMitrade
fengmian
TradingKey - As the U.S. midterm elections approach, in addition to focusing on the election results and their impact on economic policies, investors are also searching for clues regarding the next phase of U.S. stock market trends.
Although the S&P 500 Index remains near record highs, semiconductor and popular AI stocks have experienced a noticeable pullback recently, and market concerns over high valuations, returns on AI capital expenditure, and the interest rate outlook have not faded.
Historical data offers a relatively optimistic answer. Following the conclusion of midterm elections, U.S. stocks typically enter a phase of stronger performance. However, this pattern primarily reflects a decrease in political uncertainty, stabilizing policy expectations, and improving corporate earnings, and does not mean the market will inevitably rise.
US Stocks Are Typically Strong After Midterm Elections
According to statistics from Matt Cerminaro, founder of Exhibit A, the S&P 500 Index has posted an average gain of 15.5% from Midterm Election Day through June 30 of the following year since 1950. Another study by JPMorgan also shows that since 1950, the S&P 500 has generated positive returns in the 12 months following every midterm election, with an average gain of approximately 15%.
sp500-1421509181b94902b75108c205eae41b
If the observation window is narrowed to the six months following an election, the seasonal pattern is equally evident. Since the S&P 500 Index was established in 1957, the index has never posted a negative return during the November-to-April period following a midterm election, and its overall performance has significantly outperformed the same period in other years of a presidential term.
Why US Stocks Are More Likely to Rise After Midterm Elections
A decline in political uncertainty is an important factor explaining this pattern. Research by Terry Marsh, professor emeritus of finance at UC Berkeley, and Kam Fong Chan, professor at the University of Western Australia, found that the U.S. Economic Policy Uncertainty Index typically rises in the months leading up to midterm elections and falls significantly after the elections.
After the election results are announced, investors can more accurately gauge the congressional power structure and the future direction of taxation, fiscal spending, and industry regulation. As political risks that need to be priced into stock prices decrease, capital often flows back into risk assets such as equities.
Historical data also shows that the market does not consistently favor any single political party. Compared to a victory by the Republicans or Democrats, whether the policy environment is stable and whether the structure of government power is clear generally have a more direct impact on asset prices. Fidelity research shows that weak performance in midterm election years is often linked to rising policy uncertainty rather than investors simply supporting a specific party.
Seasonal factors also help: the period from November after the midterm elections through April of the following year is inherently a traditionally strong period for U.S. equities. The waning of election uncertainty coinciding with favorable seasonality makes historical returns during these six months particularly notable.
Why the Third Year of a Presidential Term Usually Performs Best
Following the midterm elections, the U.S. will enter the third year of the presidential four-year term. According to data from CFRA Research, the S&P 500 Index has averaged a gain of 16.3% in the third year of a presidential term, higher than the first year's 9.5%, the second year's 3.8%, and the fourth year's 6.8%.
In terms of quarterly performance, the fourth quarter of a midterm election year rises by an average of 6.4%, ranking second among all 16 quarters in the four-year cycle; closely following it, the first quarter of the third year averages a 7% gain, making it historically the strongest quarter.
This pattern may be linked to policy cycles: to campaign for the next presidential election, the governing party typically pushes policies in the second half of its term to stimulate the economy, improve employment, or raise household income. These measures are gradually reflected in consumption, investment, and corporate earnings, thereby providing fundamental support for the stock market.
However, fiscal stimulus does not come without a price. If policies further drive up deficits, inflation, and Treasury yields, highly valued growth stocks may instead face greater pressure. Therefore, the historical advantage of the third year still requires support from the interest rate and corporate earnings environment.
Can US Stocks Repeat Historical Patterns in 2026
One of the market's biggest headwinds currently is high interest rates. Even as the 10-year U.S. Treasury yield once pulled back below 5%, long-term financing costs remain at multi-year highs. Higher risk-free yields diminish the relative appeal of equities and increase the costs for companies to construct data centers, procure AI chips, and expand production capacity.
The return on AI capital expenditures will also impact the post-election market trend. Big tech companies such as Meta are committing massive funds to build computing infrastructure, but the market is increasingly focused on when this capex can translate into revenue and free cash flow. If growth in cloud computing, advertising, and enterprise AI businesses fails to cover depreciation and financing costs, tech stock valuations may remain under pressure.
The upcoming Anthropic IPO may also add liquidity-drainage pressure to the stock market. A large-scale initial public offering requires absorbing substantial liquidity; if it coincides with high interest rates and waning risk appetite, short-term volatility in the tech sector could amplify further.
On a relatively positive note, U.S. mega-cap corporate earnings remain resilient. As long as 2027 earnings expectations are not significantly revised downward, corporate profit growth could offset some of the pressure from interest rates and oil prices. Given that tech stocks account for nearly 40% of the S&P 500's weight, for the index to replicate historical post-election gains, tech giants including Microsoft, Nvidia, Apple, Amazon, and Meta will still need to participate in the rally.
Overall, historical data following U.S. midterm elections is relatively optimistic for U.S. equities, but what truly drives the market is not the election itself, but rather reduced political uncertainty, stable policy expectations, and corporate earnings growth. The historical average gain of around 15% can serve as a reference for market research, but should not be viewed as a definitive forecast. Once the election concludes, investors will still need to closely monitor Treasury yields, inflation, AI investment returns, and earnings guidance from big tech companies.
Disclaimer: For information purposes only. Past performance is not indicative of future results.
Get it on
Will US Stocks Rise After Midterm Elections? Analysis of Historical Election Data and Market Patterns
TradingKey
2026-11-2 10:03
Fact CheckerMitrade
fengmian
TradingKey - As the U.S. midterm elections approach, in addition to focusing on the election results and their impact on economic policies, investors are also searching for clues regarding the next phase of U.S. stock market trends.
Although the S&P 500 Index remains near record highs, semiconductor and popular AI stocks have experienced a noticeable pullback recently, and market concerns over high valuations, returns on AI capital expenditure, and the interest rate outlook have not faded.
Historical data offers a relatively optimistic answer. Following the conclusion of midterm elections, U.S. stocks typically enter a phase of stronger performance. However, this pattern primarily reflects a decrease in political uncertainty, stabilizing policy expectations, and improving corporate earnings, and does not mean the market will inevitably rise.
US Stocks Are Typically Strong After Midterm Elections
According to statistics from Matt Cerminaro, founder of Exhibit A, the S&P 500 Index has posted an average gain of 15.5% from Midterm Election Day through June 30 of the following year since 1950. Another study by JPMorgan also shows that since 1950, the S&P 500 has generated positive returns in the 12 months following every midterm election, with an average gain of approximately 15%.
sp500-1421509181b94902b75108c205eae41b
If the observation window is narrowed to the six months following an election, the seasonal pattern is equally evident. Since the S&P 500 Index was established in 1957, the index has never posted a negative return during the November-to-April period following a midterm election, and its overall performance has significantly outperformed the same period in other years of a presidential term.
Why US Stocks Are More Likely to Rise After Midterm Elections
A decline in political uncertainty is an important factor explaining this pattern. Research by Terry Marsh, professor emeritus of finance at UC Berkeley, and Kam Fong Chan, professor at the University of Western Australia, found that the U.S. Economic Policy Uncertainty Index typically rises in the months leading up to midterm elections and falls significantly after the elections.
After the election results are announced, investors can more accurately gauge the congressional power structure and the future direction of taxation, fiscal spending, and industry regulation. As political risks that need to be priced into stock prices decrease, capital often flows back into risk assets such as equities.
Historical data also shows that the market does not consistently favor any single political party. Compared to a victory by the Republicans or Democrats, whether the policy environment is stable and whether the structure of government power is clear generally have a more direct impact on asset prices. Fidelity research shows that weak performance in midterm election years is often linked to rising policy uncertainty rather than investors simply supporting a specific party.
Seasonal factors also help: the period from November after the midterm elections through April of the following year is inherently a traditionally strong period for U.S. equities. The waning of election uncertainty coinciding with favorable seasonality makes historical returns during these six months particularly notable.
Why the Third Year of a Presidential Term Usually Performs Best
Following the midterm elections, the U.S. will enter the third year of the presidential four-year term. According to data from CFRA Research, the S&P 500 Index has averaged a gain of 16.3% in the third year of a presidential term, higher than the first year's 9.5%, the second year's 3.8%, and the fourth year's 6.8%.
In terms of quarterly performance, the fourth quarter of a midterm election year rises by an average of 6.4%, ranking second among all 16 quarters in the four-year cycle; closely following it, the first quarter of the third year averages a 7% gain, making it historically the strongest quarter.
This pattern may be linked to policy cycles: to campaign for the next presidential election, the governing party typically pushes policies in the second half of its term to stimulate the economy, improve employment, or raise household income. These measures are gradually reflected in consumption, investment, and corporate earnings, thereby providing fundamental support for the stock market.
However, fiscal stimulus does not come without a price. If policies further drive up deficits, inflation, and Treasury yields, highly valued growth stocks may instead face greater pressure. Therefore, the historical advantage of the third year still requires support from the interest rate and corporate earnings environment.
Can US Stocks Repeat Historical Patterns in 2026
One of the market's biggest headwinds currently is high interest rates. Even as the 10-year U.S. Treasury yield once pulled back below 5%, long-term financing costs remain at multi-year highs. Higher risk-free yields diminish the relative appeal of equities and increase the costs for companies to construct data centers, procure AI chips, and expand production capacity.
The return on AI capital expenditures will also impact the post-election market trend. Big tech companies such as Meta are committing massive funds to build computing infrastructure, but the market is increasingly focused on when this capex can translate into revenue and free cash flow. If growth in cloud computing, advertising, and enterprise AI businesses fails to cover depreciation and financing costs, tech stock valuations may remain under pressure.
The upcoming Anthropic IPO may also add liquidity-drainage pressure to the stock market. A large-scale initial public offering requires absorbing substantial liquidity; if it coincides with high interest rates and waning risk appetite, short-term volatility in the tech sector could amplify further.
On a relatively positive note, U.S. mega-cap corporate earnings remain resilient. As long as 2027 earnings expectations are not significantly revised downward, corporate profit growth could offset some of the pressure from interest rates and oil prices. Given that tech stocks account for nearly 40% of the S&P 500's weight, for the index to replicate historical post-election gains, tech giants including Microsoft, Nvidia, Apple, Amazon, and Meta will still need to participate in the rally.
Overall, historical data following U.S. midterm elections is relatively optimistic for U.S. equities, but what truly drives the market is not the election itself, but rather reduced political uncertainty, stable policy expectations, and corporate earnings growth. The historical average gain of around 15% can serve as a reference for market research, but should not be viewed as a definitive forecast. Once the election concludes, investors will still need to closely monitor Treasury yields, inflation, AI investment returns, and earnings guidance from big tech companies.
Fact CheckerMitrade
fengmian
TradingKey - As the U.S. midterm elections approach, in addition to focusing on the election results and their impact on economic policies, investors are also searching for clues regarding the next phase of U.S. stock market trends.
Although the S&P 500 Index remains near record highs, semiconductor and popular AI stocks have experienced a noticeable pullback recently, and market concerns over high valuations, returns on AI capital expenditure, and the interest rate outlook have not faded.
Historical data offers a relatively optimistic answer. Following the conclusion of midterm elections, U.S. stocks typically enter a phase of stronger performance. However, this pattern primarily reflects a decrease in political uncertainty, stabilizing policy expectations, and improving corporate earnings, and does not mean the market will inevitably rise.
US Stocks Are Typically Strong After Midterm Elections
According to statistics from Matt Cerminaro, founder of Exhibit A, the S&P 500 Index has posted an average gain of 15.5% from Midterm Election Day through June 30 of the following year since 1950. Another study by JPMorgan also shows that since 1950, the S&P 500 has generated positive returns in the 12 months following every midterm election, with an average gain of approximately 15%.
sp500-1421509181b94902b75108c205eae41b
If the observation window is narrowed to the six months following an election, the seasonal pattern is equally evident. Since the S&P 500 Index was established in 1957, the index has never posted a negative return during the November-to-April period following a midterm election, and its overall performance has significantly outperformed the same period in other years of a presidential term.
Why US Stocks Are More Likely to Rise After Midterm Elections
A decline in political uncertainty is an important factor explaining this pattern. Research by Terry Marsh, professor emeritus of finance at UC Berkeley, and Kam Fong Chan, professor at the University of Western Australia, found that the U.S. Economic Policy Uncertainty Index typically rises in the months leading up to midterm elections and falls significantly after the elections.
After the election results are announced, investors can more accurately gauge the congressional power structure and the future direction of taxation, fiscal spending, and industry regulation. As political risks that need to be priced into stock prices decrease, capital often flows back into risk assets such as equities.
Historical data also shows that the market does not consistently favor any single political party. Compared to a victory by the Republicans or Democrats, whether the policy environment is stable and whether the structure of government power is clear generally have a more direct impact on asset prices. Fidelity research shows that weak performance in midterm election years is often linked to rising policy uncertainty rather than investors simply supporting a specific party.
Seasonal factors also help: the period from November after the midterm elections through April of the following year is inherently a traditionally strong period for U.S. equities. The waning of election uncertainty coinciding with favorable seasonality makes historical returns during these six months particularly notable.
Why the Third Year of a Presidential Term Usually Performs Best
Following the midterm elections, the U.S. will enter the third year of the presidential four-year term. According to data from CFRA Research, the S&P 500 Index has averaged a gain of 16.3% in the third year of a presidential term, higher than the first year's 9.5%, the second year's 3.8%, and the fourth year's 6.8%.
In terms of quarterly performance, the fourth quarter of a midterm election year rises by an average of 6.4%, ranking second among all 16 quarters in the four-year cycle; closely following it, the first quarter of the third year averages a 7% gain, making it historically the strongest quarter.
This pattern may be linked to policy cycles: to campaign for the next presidential election, the governing party typically pushes policies in the second half of its term to stimulate the economy, improve employment, or raise household income. These measures are gradually reflected in consumption, investment, and corporate earnings, thereby providing fundamental support for the stock market.
However, fiscal stimulus does not come without a price. If policies further drive up deficits, inflation, and Treasury yields, highly valued growth stocks may instead face greater pressure. Therefore, the historical advantage of the third year still requires support from the interest rate and corporate earnings environment.
Can US Stocks Repeat Historical Patterns in 2026
One of the market's biggest headwinds currently is high interest rates. Even as the 10-year U.S. Treasury yield once pulled back below 5%, long-term financing costs remain at multi-year highs. Higher risk-free yields diminish the relative appeal of equities and increase the costs for companies to construct data centers, procure AI chips, and expand production capacity.
The return on AI capital expenditures will also impact the post-election market trend. Big tech companies such as Meta are committing massive funds to build computing infrastructure, but the market is increasingly focused on when this capex can translate into revenue and free cash flow. If growth in cloud computing, advertising, and enterprise AI businesses fails to cover depreciation and financing costs, tech stock valuations may remain under pressure.
The upcoming Anthropic IPO may also add liquidity-drainage pressure to the stock market. A large-scale initial public offering requires absorbing substantial liquidity; if it coincides with high interest rates and waning risk appetite, short-term volatility in the tech sector could amplify further.
On a relatively positive note, U.S. mega-cap corporate earnings remain resilient. As long as 2027 earnings expectations are not significantly revised downward, corporate profit growth could offset some of the pressure from interest rates and oil prices. Given that tech stocks account for nearly 40% of the S&P 500's weight, for the index to replicate historical post-election gains, tech giants including Microsoft, Nvidia, Apple, Amazon, and Meta will still need to participate in the rally.
Overall, historical data following U.S. midterm elections is relatively optimistic for U.S. equities, but what truly drives the market is not the election itself, but rather reduced political uncertainty, stable policy expectations, and corporate earnings growth. The historical average gain of around 15% can serve as a reference for market research, but should not be viewed as a definitive forecast. Once the election concludes, investors will still need to closely monitor Treasury yields, inflation, AI investment returns, and earnings guidance from big tech companies.
Disclaimer: For information purposes only. Past performance is not indicative of future results.
Get it on
Will US Stocks Rise After Midterm Elections? Analysis of Historical Election Data and Market Patterns
TradingKey
2026-11-2 10:03
Fact CheckerMitrade
fengmian
TradingKey - As the U.S. midterm elections approach, in addition to focusing on the election results and their impact on economic policies, investors are also searching for clues regarding the next phase of U.S. stock market trends.
Although the S&P 500 Index remains near record highs, semiconductor and popular AI stocks have experienced a noticeable pullback recently, and market concerns over high valuations, returns on AI capital expenditure, and the interest rate outlook have not faded.
Historical data offers a relatively optimistic answer. Following the conclusion of midterm elections, U.S. stocks typically enter a phase of stronger performance. However, this pattern primarily reflects a decrease in political uncertainty, stabilizing policy expectations, and improving corporate earnings, and does not mean the market will inevitably rise.
US Stocks Are Typically Strong After Midterm Elections
According to statistics from Matt Cerminaro, founder of Exhibit A, the S&P 500 Index has posted an average gain of 15.5% from Midterm Election Day through June 30 of the following year since 1950. Another study by JPMorgan also shows that since 1950, the S&P 500 has generated positive returns in the 12 months following every midterm election, with an average gain of approximately 15%.
sp500-1421509181b94902b75108c205eae41b
If the observation window is narrowed to the six months following an election, the seasonal pattern is equally evident. Since the S&P 500 Index was established in 1957, the index has never posted a negative return during the November-to-April period following a midterm election, and its overall performance has significantly outperformed the same period in other years of a presidential term.
Why US Stocks Are More Likely to Rise After Midterm Elections
A decline in political uncertainty is an important factor explaining this pattern. Research by Terry Marsh, professor emeritus of finance at UC Berkeley, and Kam Fong Chan, professor at the University of Western Australia, found that the U.S. Economic Policy Uncertainty Index typically rises in the months leading up to midterm elections and falls significantly after the elections.
After the election results are announced, investors can more accurately gauge the congressional power structure and the future direction of taxation, fiscal spending, and industry regulation. As political risks that need to be priced into stock prices decrease, capital often flows back into risk assets such as equities.
Historical data also shows that the market does not consistently favor any single political party. Compared to a victory by the Republicans or Democrats, whether the policy environment is stable and whether the structure of government power is clear generally have a more direct impact on asset prices. Fidelity research shows that weak performance in midterm election years is often linked to rising policy uncertainty rather than investors simply supporting a specific party.
Seasonal factors also help: the period from November after the midterm elections through April of the following year is inherently a traditionally strong period for U.S. equities. The waning of election uncertainty coinciding with favorable seasonality makes historical returns during these six months particularly notable.
Why the Third Year of a Presidential Term Usually Performs Best
Following the midterm elections, the U.S. will enter the third year of the presidential four-year term. According to data from CFRA Research, the S&P 500 Index has averaged a gain of 16.3% in the third year of a presidential term, higher than the first year's 9.5%, the second year's 3.8%, and the fourth year's 6.8%.
In terms of quarterly performance, the fourth quarter of a midterm election year rises by an average of 6.4%, ranking second among all 16 quarters in the four-year cycle; closely following it, the first quarter of the third year averages a 7% gain, making it historically the strongest quarter.
This pattern may be linked to policy cycles: to campaign for the next presidential election, the governing party typically pushes policies in the second half of its term to stimulate the economy, improve employment, or raise household income. These measures are gradually reflected in consumption, investment, and corporate earnings, thereby providing fundamental support for the stock market.
However, fiscal stimulus does not come without a price. If policies further drive up deficits, inflation, and Treasury yields, highly valued growth stocks may instead face greater pressure. Therefore, the historical advantage of the third year still requires support from the interest rate and corporate earnings environment.
Can US Stocks Repeat Historical Patterns in 2026
One of the market's biggest headwinds currently is high interest rates. Even as the 10-year U.S. Treasury yield once pulled back below 5%, long-term financing costs remain at multi-year highs. Higher risk-free yields diminish the relative appeal of equities and increase the costs for companies to construct data centers, procure AI chips, and expand production capacity.
The return on AI capital expenditures will also impact the post-election market trend. Big tech companies such as Meta are committing massive funds to build computing infrastructure, but the market is increasingly focused on when this capex can translate into revenue and free cash flow. If growth in cloud computing, advertising, and enterprise AI businesses fails to cover depreciation and financing costs, tech stock valuations may remain under pressure.
The upcoming Anthropic IPO may also add liquidity-drainage pressure to the stock market. A large-scale initial public offering requires absorbing substantial liquidity; if it coincides with high interest rates and waning risk appetite, short-term volatility in the tech sector could amplify further.
On a relatively positive note, U.S. mega-cap corporate earnings remain resilient. As long as 2027 earnings expectations are not significantly revised downward, corporate profit growth could offset some of the pressure from interest rates and oil prices. Given that tech stocks account for nearly 40% of the S&P 500's weight, for the index to replicate historical post-election gains, tech giants including Microsoft, Nvidia, Apple, Amazon, and Meta will still need to participate in the rally.
Overall, historical data following U.S. midterm elections is relatively optimistic for U.S. equities, but what truly drives the market is not the election itself, but rather reduced political uncertainty, stable policy expectations, and corporate earnings growth. The historical average gain of around 15% can serve as a reference for market research, but should not be viewed as a definitive forecast. Once the election concludes, investors will still need to closely monitor Treasury yields, inflation, AI investment returns, and earnings guidance from big tech companies.
IEFETF-0,04%
SPYB+0,47%
2
65
·
--
Indische Rupie legt weiter zu, während die Ölpreise deutlich korrigieren02. Nov. 2026, 05:30:30
Die indische Rupie setzt ihren Aufwärtstrend gegenüber dem US-Dollar fort, während die Ölpreise deutlich nachgeben.
Die USA signalisieren, dass sie eine diplomatische Lösung mit dem Iran einer Wiederaufnahme militärischer Maßnahmen vorziehen.
Anleger richten ihren Fokus auf die US-Zwischenwahlen.
Die indische Rupie (INR) baut am Montag ihre Gewinne vom vorherigen Handelstag gegenüber dem US-Dollar (USD) aus, gestützt durch eine deutliche Korrektur der Ölpreise. Im Eröffnungshandel fällt das Währungspaar USD/INR um 0,23 % auf etwa 94,72.
Zu Wochenbeginn liegt der am 19. November auslaufende MCX-Rohölkontrakt deutlich im Minus und fällt um fast 4 % auf etwa 9.545 Rs. Der Ölpreis hat sich von seinem am Freitag erreichten Mehrmonatshoch von 9.972 Rs korrigiert.
Indische Rupie legt weiter zu, während die Ölpreise deutlich korrigieren
02. Nov. 2026, 05:30:30
Die indische Rupie setzt ihren Aufwärtstrend gegenüber dem US-Dollar fort, während die Ölpreise deutlich nachgeben.
Die USA signalisieren, dass sie eine diplomatische Lösung mit dem Iran einer Wiederaufnahme militärischer Maßnahmen vorziehen.
Anleger richten ihren Fokus auf die US-Zwischenwahlen.
Die indische Rupie (INR) baut am Montag ihre Gewinne vom vorherigen Handelstag gegenüber dem US-Dollar (USD) aus, gestützt durch eine deutliche Korrektur der Ölpreise. Im Eröffnungshandel fällt das Währungspaar USD/INR um 0,23 % auf etwa 94,72.
Zu Wochenbeginn liegt der am 19. November auslaufende MCX-Rohölkontrakt deutlich im Minus und fällt um fast 4 % auf etwa 9.545 Rs. Der Ölpreis hat sich von seinem am Freitag erreichten Mehrmonatshoch von 9.972 Rs korrigiert.
Die indische Rupie setzt ihren Aufwärtstrend gegenüber dem US-Dollar fort, während die Ölpreise deutlich nachgeben.
Die USA signalisieren, dass sie eine diplomatische Lösung mit dem Iran einer Wiederaufnahme militärischer Maßnahmen vorziehen.
Anleger richten ihren Fokus auf die US-Zwischenwahlen.
Die indische Rupie (INR) baut am Montag ihre Gewinne vom vorherigen Handelstag gegenüber dem US-Dollar (USD) aus, gestützt durch eine deutliche Korrektur der Ölpreise. Im Eröffnungshandel fällt das Währungspaar USD/INR um 0,23 % auf etwa 94,72.
Zu Wochenbeginn liegt der am 19. November auslaufende MCX-Rohölkontrakt deutlich im Minus und fällt um fast 4 % auf etwa 9.545 Rs. Der Ölpreis hat sich von seinem am Freitag erreichten Mehrmonatshoch von 9.972 Rs korrigiert.
1
439
·
--
Übersetzung ansehen
The Nonfarm Payrolls release presents the number of new jobs created in the US during the previous month in all non-agricultural businesses; it is released by the US Bureau of Labor Statistics (BLS). The monthly changes in payrolls can be extremely volatile. The number is also subject to strong reviews, which can also trigger volatility in the Forex board. Generally speaking, a high reading is seen as bullish for the US Dollar (USD), while a low reading is seen as bearish, although previous months' reviews and the Unemployment Rate are as relevant as the headline figure. The market's reaction, therefore, depends on how the market assesses all the data contained in the BLS report as a whole.
The Nonfarm Payrolls release presents the number of new jobs created in the US during the previous month in all non-agricultural businesses; it is released by the US Bureau of Labor Statistics (BLS). The monthly changes in payrolls can be extremely volatile. The number is also subject to strong reviews, which can also trigger volatility in the Forex board. Generally speaking, a high reading is seen as bullish for the US Dollar (USD), while a low reading is seen as bearish, although previous months' reviews and the Unemployment Rate are as relevant as the headline figure. The market's reaction, therefore, depends on how the market assesses all the data contained in the BLS report as a whole.
1
74
·
--
Übersetzung ansehen
The Federal Reserve (Fed) deliberates on monetary policy and makes a decision on interest rates at eight pre-scheduled meetings per year. It has two mandates: to keep inflation at 2%, and to maintain full employment. Its main tool for achieving this is by setting interest rates – both at which it lends to banks and banks lend to each other. If it decides to hike rates, the US Dollar (USD) tends to strengthen as it attracts more foreign capital inflows. If it cuts rates, it tends to weaken the USD as capital drains out to countries offering higher returns. If rates are left unchanged, attention turns to the tone of the Federal Open Market Committee (FOMC) statement, and whether it is hawkish (expectant of higher future interest rates), or dovish (expectant of lower future rates).
The Federal Reserve (Fed) deliberates on monetary policy and makes a decision on interest rates at eight pre-scheduled meetings per year. It has two mandates: to keep inflation at 2%, and to maintain full employment. Its main tool for achieving this is by setting interest rates – both at which it lends to banks and banks lend to each other. If it decides to hike rates, the US Dollar (USD) tends to strengthen as it attracts more foreign capital inflows. If it cuts rates, it tends to weaken the USD as capital drains out to countries offering higher returns. If rates are left unchanged, attention turns to the tone of the Federal Open Market Committee (FOMC) statement, and whether it is hawkish (expectant of higher future interest rates), or dovish (expectant of lower future rates).
78
·
--
Übersetzung ansehen
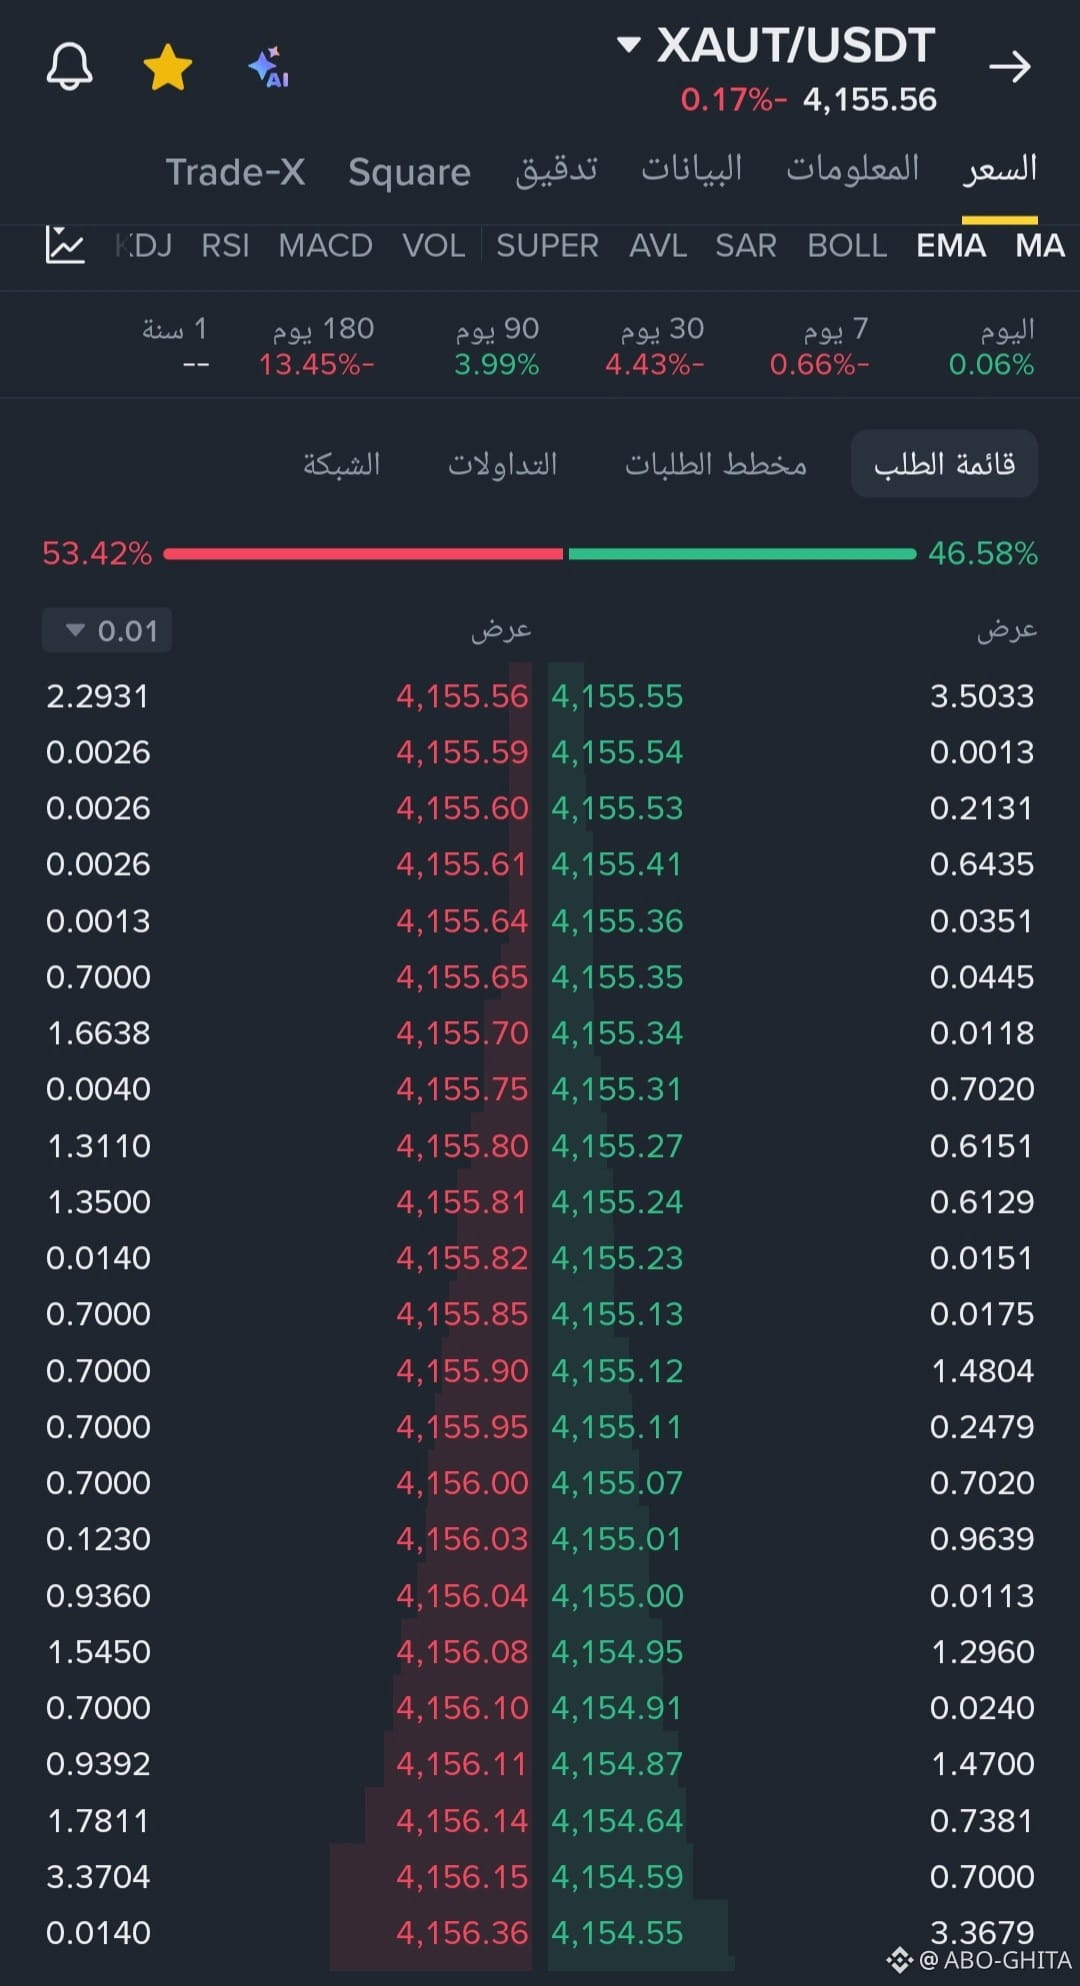
كأنك تشاهد لعبة شد الحبل لكنك تشارك فيها بإرادتك أو بدون إرادتك . أنا أفضل أن أكون عضو في اللعبة
كأنك تشاهد لعبة شد الحبل لكنك تشارك فيها بإرادتك أو بدون إرادتك . أنا أفضل أن أكون عضو في اللعبة
2
139
Anmelden und weiter Inhalte entdecken
Krypto-Nutzer weltweit auf Binance Square kennenlernen
⚡️ Bleib in Sachen Krypto stets am Puls.
💬 Die weltgrößte Kryptobörse vertraut darauf.
👍 Erhalte verlässliche Einblicke von verifizierten Creators.
E-Mail-Adresse/Telefonnummer