
Myhigherself
13 Beiträge

Myhigherself
Melden
Nutzer blockieren
27 Following
14 Follower
13 Like gegeben
Beiträge
·
--
Übersetzung ansehen
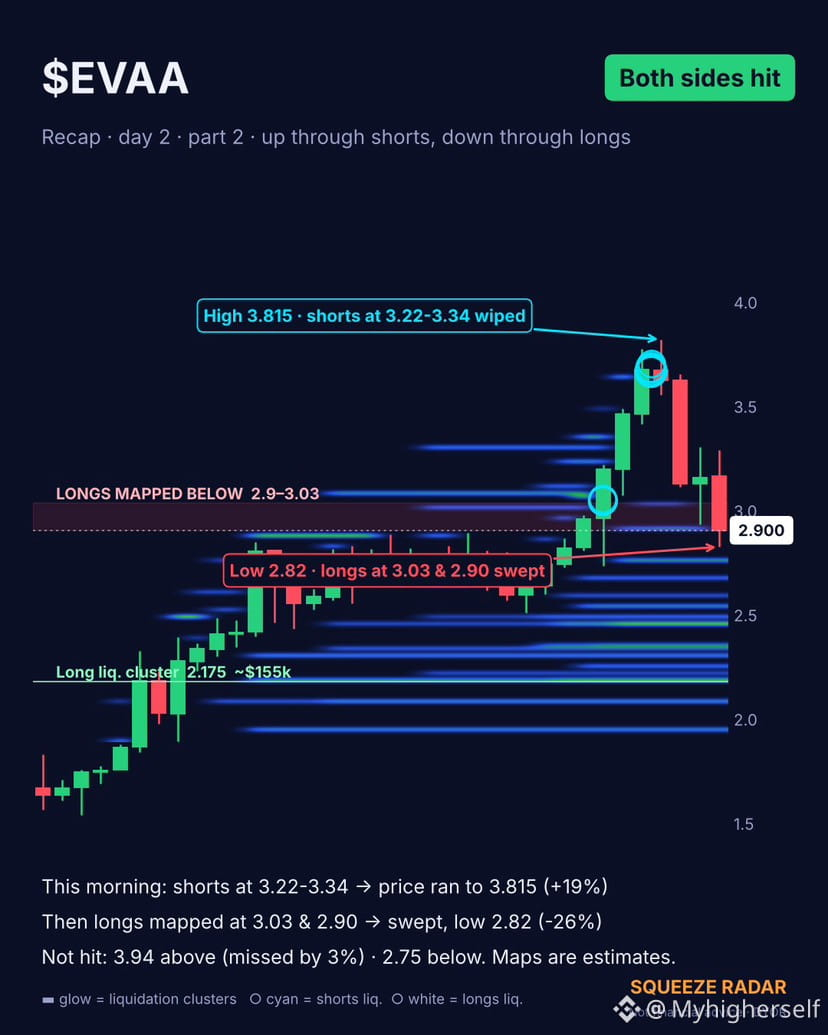
📡 $EVAA RECAP · Day 2, Part 2: the map worked BOTH ways ⚡️
In Part 1 this morning our map showed short clusters at 3.22 · 3.28 · 3.34 above price 🧲
What happened 👇
🚀 Price ran through all of them to 3.815 (+19%)
🔵 Shorts liquidated on the way up (cyan circles)
🔄 Then the fuel flipped: the map showed LONG liquidations below at 3.03 and 2.90
🩸 Price dropped and swept both, low 2.82 (−26% from the high)
📏 Honest check:
❌ The 3.94 short cluster was never reached (high was ~3% below)
❌ The 2.75 long cluster hasn't been hit yet
🧠 Lesson: after a squeeze, the late longs who chased the top become the next fuel. Liquidations don't only push price up, they can drag it back down just as fast 🔁
📚 Not a signal, just a map of where the pain is.
Which coin should I map next? 👇
🔔 Follow for more Squeeze Radar maps & recaps 📡
#EVAA #Binance #Crypto #ShortSqueeze #Futures
⚠️ Educational content. Not financial advice. DYOR.
📡 $EVAA RECAP · Day 2, Part 2: the map worked BOTH ways ⚡️
In Part 1 this morning our map showed short clusters at 3.22 · 3.28 · 3.34 above price 🧲
What happened 👇
🚀 Price ran through all of them to 3.815 (+19%)
🔵 Shorts liquidated on the way up (cyan circles)
🔄 Then the fuel flipped: the map showed LONG liquidations below at 3.03 and 2.90
🩸 Price dropped and swept both, low 2.82 (−26% from the high)
📏 Honest check:
❌ The 3.94 short cluster was never reached (high was ~3% below)
❌ The 2.75 long cluster hasn't been hit yet
🧠 Lesson: after a squeeze, the late longs who chased the top become the next fuel. Liquidations don't only push price up, they can drag it back down just as fast 🔁
📚 Not a signal, just a map of where the pain is.
Which coin should I map next? 👇
🔔 Follow for more Squeeze Radar maps & recaps 📡
#EVAA #Binance #Crypto #ShortSqueeze #Futures
⚠️ Educational content. Not financial advice. DYOR.
In Part 1 this morning our map showed short clusters at 3.22 · 3.28 · 3.34 above price 🧲
What happened 👇
🚀 Price ran through all of them to 3.815 (+19%)
🔵 Shorts liquidated on the way up (cyan circles)
🔄 Then the fuel flipped: the map showed LONG liquidations below at 3.03 and 2.90
🩸 Price dropped and swept both, low 2.82 (−26% from the high)
📏 Honest check:
❌ The 3.94 short cluster was never reached (high was ~3% below)
❌ The 2.75 long cluster hasn't been hit yet
🧠 Lesson: after a squeeze, the late longs who chased the top become the next fuel. Liquidations don't only push price up, they can drag it back down just as fast 🔁
📚 Not a signal, just a map of where the pain is.
Which coin should I map next? 👇
🔔 Follow for more Squeeze Radar maps & recaps 📡
#EVAA #Binance #Crypto #ShortSqueeze #Futures
⚠️ Educational content. Not financial advice. DYOR.
341
·
--
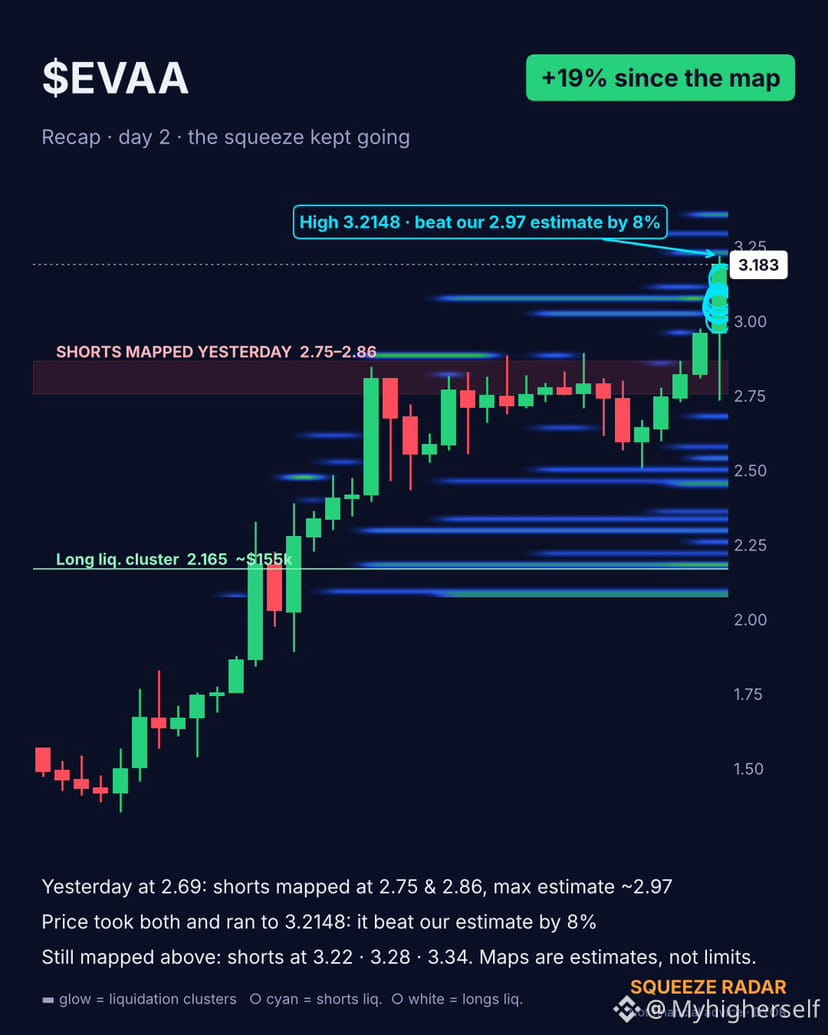
📡 $EVAA #CryptoSelloffTriggersMultipleWhaleLiquidation s RÜCKBLICK · Tag 2: Der Squeeze ging weiter 🔥
Gestern bei 2.69 zeigte unsere Liquidationskarte Short-Liquidationen bei 2.75 und 2.86 🧲 Unsere maximale Schätzung für den Squeeze lag bei ~2.97.
Was passiert ist 👇
🚀 Der Kurs durchbrach BEIDE Niveaus
🔵 Auf dem Weg nach oben wurden weiterhin Shorts liquidiert (türkise Kreise)
🎯 Hoch heute Morgen: 3.2148 (+19 % gegenüber der Karte)
📏 Ehrliche Bilanz: Der Kurs übertraf unsere Schätzung von 2.97 um 8 %
🧠 Lektion: Eine Liquidationskarte zeigt, wo der Treibstoff liegt, nicht, wo die Bewegung enden muss. Wenn immer mehr Shorts gegen einen Trend setzen, ist jede Liquidation ein erzwungener KAUF, der den nächsten Schub antreibt 🔁
👀 Weiterhin darüber eingezeichnet: Short-Cluster bei 3.22 · 3.28 · 3.34
📚 Kein Signal, nur eine Karte, die zeigt, wo es wehtut.
Welche Coin soll ich als Nächstes kartieren? 👇
🔔 Folge mir für weitere Squeeze-Radar-Karten und Rückblicke #Binance #Crypto #Futures #CryptoEducation
⚠️ Bildungsinhalte. Keine Finanzberatung. DYOR.
📡 $EVAA #CryptoSelloffTriggersMultipleWhaleLiquidation s RÜCKBLICK · Tag 2: Der Squeeze ging weiter 🔥
Gestern bei 2.69 zeigte unsere Liquidationskarte Short-Liquidationen bei 2.75 und 2.86 🧲 Unsere maximale Schätzung für den Squeeze lag bei ~2.97.
Was passiert ist 👇
🚀 Der Kurs durchbrach BEIDE Niveaus
🔵 Auf dem Weg nach oben wurden weiterhin Shorts liquidiert (türkise Kreise)
🎯 Hoch heute Morgen: 3.2148 (+19 % gegenüber der Karte)
📏 Ehrliche Bilanz: Der Kurs übertraf unsere Schätzung von 2.97 um 8 %
🧠 Lektion: Eine Liquidationskarte zeigt, wo der Treibstoff liegt, nicht, wo die Bewegung enden muss. Wenn immer mehr Shorts gegen einen Trend setzen, ist jede Liquidation ein erzwungener KAUF, der den nächsten Schub antreibt 🔁
👀 Weiterhin darüber eingezeichnet: Short-Cluster bei 3.22 · 3.28 · 3.34
📚 Kein Signal, nur eine Karte, die zeigt, wo es wehtut.
Welche Coin soll ich als Nächstes kartieren? 👇
🔔 Folge mir für weitere Squeeze-Radar-Karten und Rückblicke #Binance #Crypto #Futures #CryptoEducation
⚠️ Bildungsinhalte. Keine Finanzberatung. DYOR.
Gestern bei 2.69 zeigte unsere Liquidationskarte Short-Liquidationen bei 2.75 und 2.86 🧲 Unsere maximale Schätzung für den Squeeze lag bei ~2.97.
Was passiert ist 👇
🚀 Der Kurs durchbrach BEIDE Niveaus
🔵 Auf dem Weg nach oben wurden weiterhin Shorts liquidiert (türkise Kreise)
🎯 Hoch heute Morgen: 3.2148 (+19 % gegenüber der Karte)
📏 Ehrliche Bilanz: Der Kurs übertraf unsere Schätzung von 2.97 um 8 %
🧠 Lektion: Eine Liquidationskarte zeigt, wo der Treibstoff liegt, nicht, wo die Bewegung enden muss. Wenn immer mehr Shorts gegen einen Trend setzen, ist jede Liquidation ein erzwungener KAUF, der den nächsten Schub antreibt 🔁
👀 Weiterhin darüber eingezeichnet: Short-Cluster bei 3.22 · 3.28 · 3.34
📚 Kein Signal, nur eine Karte, die zeigt, wo es wehtut.
Welche Coin soll ich als Nächstes kartieren? 👇
🔔 Folge mir für weitere Squeeze-Radar-Karten und Rückblicke #Binance #Crypto #Futures #CryptoEducation
⚠️ Bildungsinhalte. Keine Finanzberatung. DYOR.
419
·
--
Übersetzung ansehen
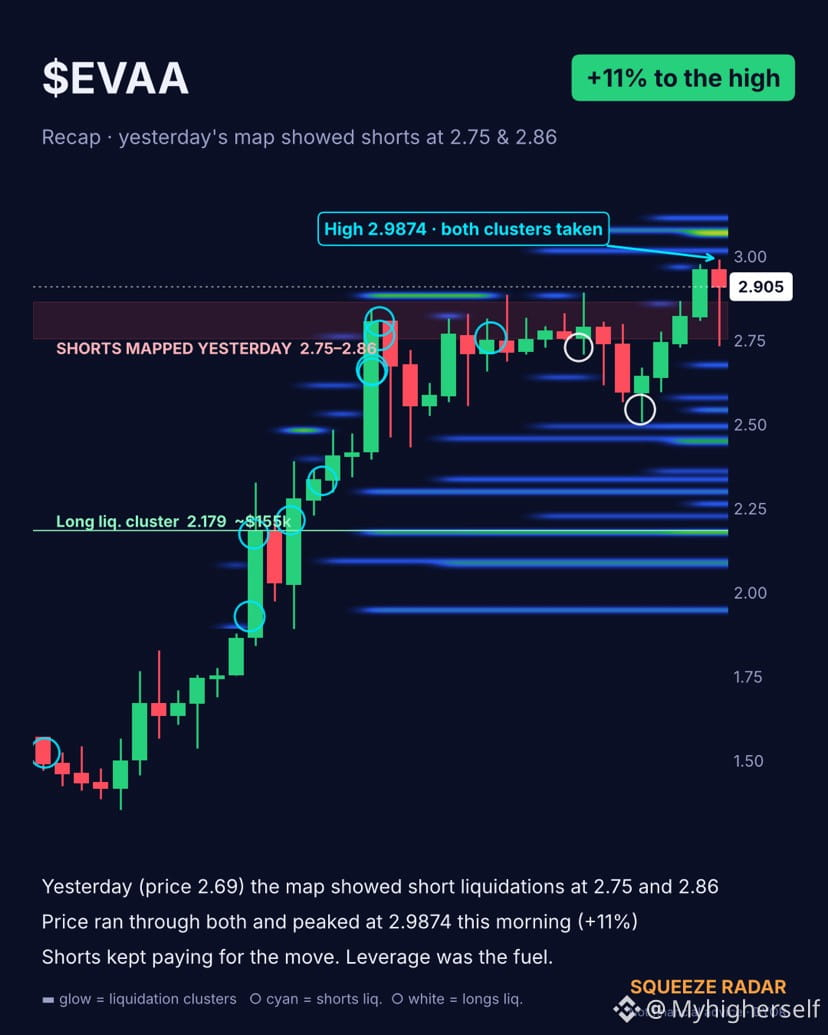
📡 $EVAA RECAP: the map called the fuel 🔥
Yesterday at 2.69 our liquidation map showed short liquidations stacked at 2.75 and 2.86 🧲
What happened next 👇
🚀 Price ran through BOTH levels
🔵 Short liquidations kept firing all the way up (cyan circles)
🎯 Peak this morning: 2.9874 (+11% from the map)
🧠 Why it works:
Every short that gets liquidated is a forced BUY 💸 When shorts are crowded above price, the market tends to go hunt them, and each liquidation pushes it a bit higher 🔁
📚 Not a signal, just a map of where the pain is. Learn to read it and you'll stop being the liquidity 😉
Which coin should I map next? 👇
🔔 Follow for more Squeeze Radar maps & recaps 📡
#EVAA #Binance #Crypto #ShortSqueeze #Liquidations #Futures #CryptoEducation
⚠️ Educational content. Not financial advice. DYOR.
📡 $EVAA RECAP: the map called the fuel 🔥
Yesterday at 2.69 our liquidation map showed short liquidations stacked at 2.75 and 2.86 🧲
What happened next 👇
🚀 Price ran through BOTH levels
🔵 Short liquidations kept firing all the way up (cyan circles)
🎯 Peak this morning: 2.9874 (+11% from the map)
🧠 Why it works:
Every short that gets liquidated is a forced BUY 💸 When shorts are crowded above price, the market tends to go hunt them, and each liquidation pushes it a bit higher 🔁
📚 Not a signal, just a map of where the pain is. Learn to read it and you'll stop being the liquidity 😉
Which coin should I map next? 👇
🔔 Follow for more Squeeze Radar maps & recaps 📡
#EVAA #Binance #Crypto #ShortSqueeze #Liquidations #Futures #CryptoEducation
⚠️ Educational content. Not financial advice. DYOR.
Yesterday at 2.69 our liquidation map showed short liquidations stacked at 2.75 and 2.86 🧲
What happened next 👇
🚀 Price ran through BOTH levels
🔵 Short liquidations kept firing all the way up (cyan circles)
🎯 Peak this morning: 2.9874 (+11% from the map)
🧠 Why it works:
Every short that gets liquidated is a forced BUY 💸 When shorts are crowded above price, the market tends to go hunt them, and each liquidation pushes it a bit higher 🔁
📚 Not a signal, just a map of where the pain is. Learn to read it and you'll stop being the liquidity 😉
Which coin should I map next? 👇
🔔 Follow for more Squeeze Radar maps & recaps 📡
#EVAA #Binance #Crypto #ShortSqueeze #Liquidations #Futures #CryptoEducation
⚠️ Educational content. Not financial advice. DYOR.
426
·
--
Übersetzung ansehen
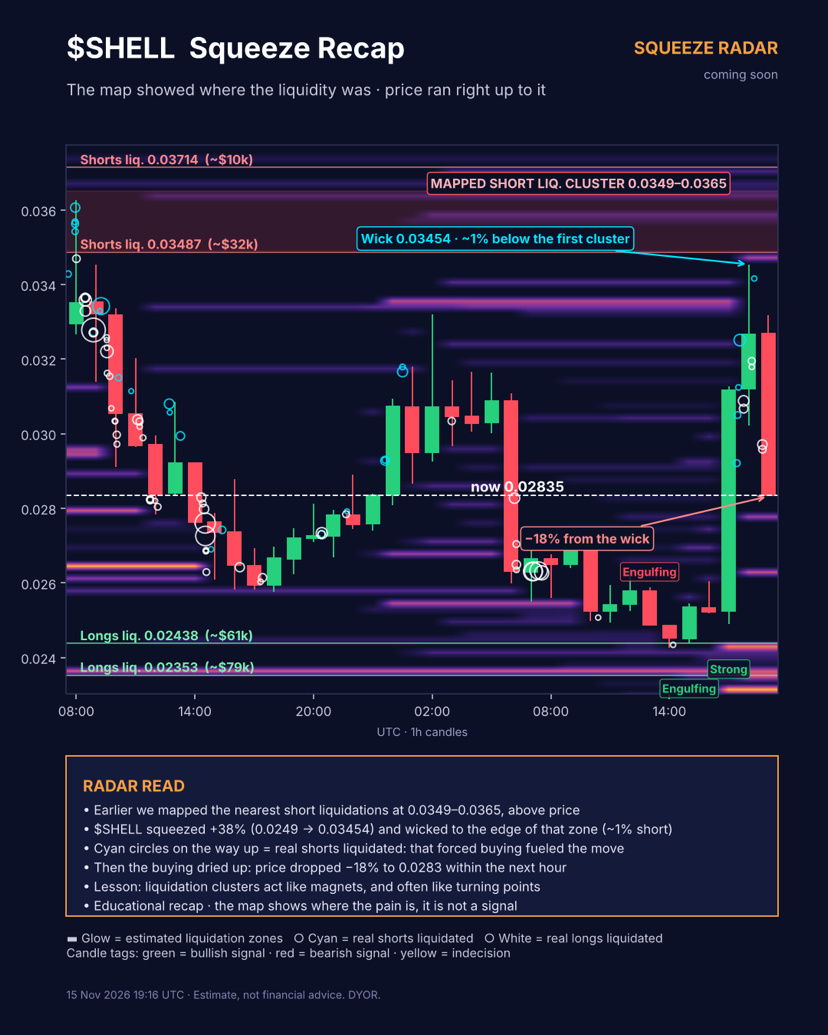
📡 $SHELL SQUEEZE RECAP 🔥
A few hours ago the liquidation map showed short liquidations stacked at 0.0349–0.0365 🧲
Here's what happened next 👇
🚀 $SHELL squeezed +38% (0.0249 ➜ 0.03454)
🎯 The wick ran right up to the edge of that zone (~1% short)
🔵 Real short liquidations fired on the way up = forced buying = fuel
🩸 Then the fuel ran out: −18% to 0.0283 within the next hour
🧠 Why this matters:
Liquidation clusters work like magnets 🧲 Price is often pulled toward them, because that's where forced orders sit.
And once that liquidity is taken, the move can lose its engine ⚙️❌
📚 The map doesn't tell you what to do. It shows you where the pain is.
Understanding it helps you avoid being the liquidity 😉
Would you have expected that reversal? 👇
🔔 Follow for more Squeeze Radar maps & recaps 📡
#SHELL #Binance #Crypto #ShortSqueeze #Liquidations #Futures #CryptoEducation
⚠️ Educational content. Not financial advice. DYOR.
📡 $SHELL SQUEEZE RECAP 🔥
A few hours ago the liquidation map showed short liquidations stacked at 0.0349–0.0365 🧲
Here's what happened next 👇
🚀 $SHELL squeezed +38% (0.0249 ➜ 0.03454)
🎯 The wick ran right up to the edge of that zone (~1% short)
🔵 Real short liquidations fired on the way up = forced buying = fuel
🩸 Then the fuel ran out: −18% to 0.0283 within the next hour
🧠 Why this matters:
Liquidation clusters work like magnets 🧲 Price is often pulled toward them, because that's where forced orders sit.
And once that liquidity is taken, the move can lose its engine ⚙️❌
📚 The map doesn't tell you what to do. It shows you where the pain is.
Understanding it helps you avoid being the liquidity 😉
Would you have expected that reversal? 👇
🔔 Follow for more Squeeze Radar maps & recaps 📡
#SHELL #Binance #Crypto #ShortSqueeze #Liquidations #Futures #CryptoEducation
⚠️ Educational content. Not financial advice. DYOR.
A few hours ago the liquidation map showed short liquidations stacked at 0.0349–0.0365 🧲
Here's what happened next 👇
🚀 $SHELL squeezed +38% (0.0249 ➜ 0.03454)
🎯 The wick ran right up to the edge of that zone (~1% short)
🔵 Real short liquidations fired on the way up = forced buying = fuel
🩸 Then the fuel ran out: −18% to 0.0283 within the next hour
🧠 Why this matters:
Liquidation clusters work like magnets 🧲 Price is often pulled toward them, because that's where forced orders sit.
And once that liquidity is taken, the move can lose its engine ⚙️❌
📚 The map doesn't tell you what to do. It shows you where the pain is.
Understanding it helps you avoid being the liquidity 😉
Would you have expected that reversal? 👇
🔔 Follow for more Squeeze Radar maps & recaps 📡
#SHELL #Binance #Crypto #ShortSqueeze #Liquidations #Futures #CryptoEducation
⚠️ Educational content. Not financial advice. DYOR.
256
·
--
Übersetzung ansehen
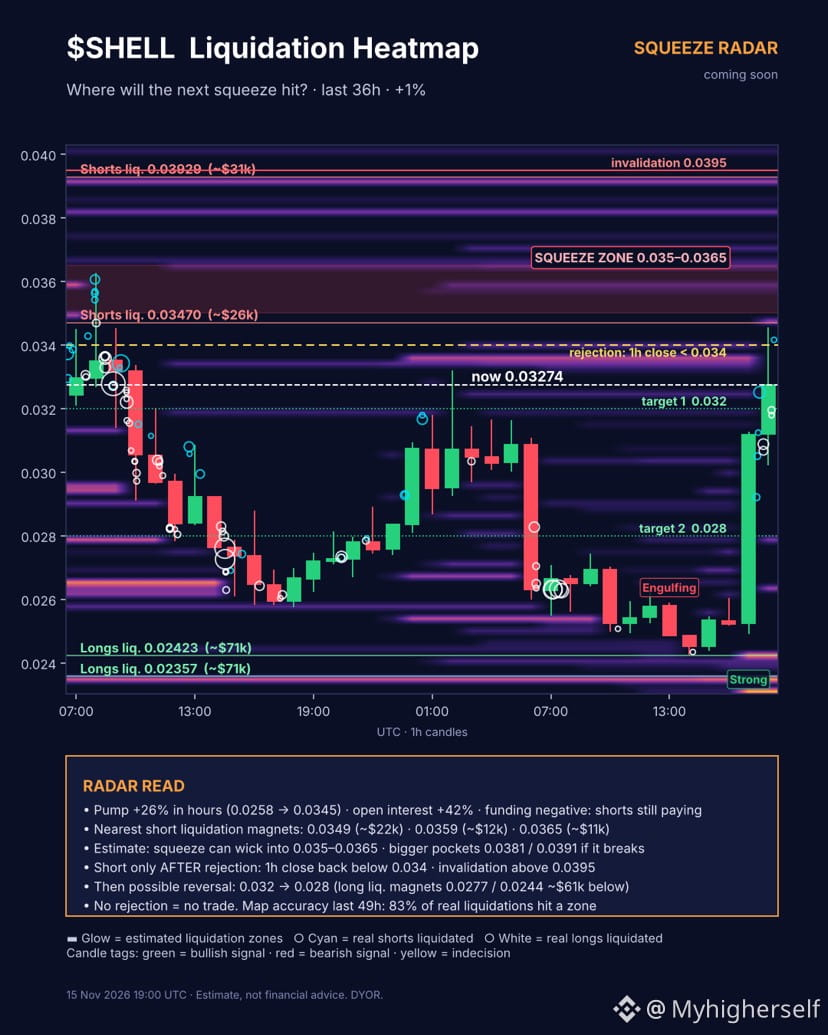
🚨 $SHELL SQUEEZE RADAR 🚨
$SHELL just ripped +26% in a few hours 🚀 (0.0258 ➜ 0.0345) and shorts are still paying funding 🩸
🔥 Short liquidation magnets above:
🎯 0.0349 (~$22k)
🎯 0.0359 (~$12k)
🎯 0.0365 (~$11k)
💣 Bigger pockets if it breaks: 0.0381 / 0.0391
🧲 Long liquidation magnets below:
🟢 0.0277 · 0.0264 · 0.0244 (~$61k) · 0.0231 (~$86k)
👀 My read: the squeeze can still wick into 0.035–0.0365 to hunt those shorts. I only like a short AFTER a clear rejection there (1h close back below 0.034) ❌🐻 Then a reversal toward 0.032 ➜ 0.028 🎯
🛑 Invalidation above 0.0395
No rejection = no trade. Patience pays 🧘♂️
Where do you think $SHELL goes first? 👇 0.036 or 0.028?
🔔 Follow for more Squeeze Radar maps 📡
#SHELL #Binance #Crypto #ShortSqueeze #Liquidations #Futures #Trading
⚠️ Not financial advice. DYOR.
🚨 $SHELL SQUEEZE RADAR 🚨
$SHELL just ripped +26% in a few hours 🚀 (0.0258 ➜ 0.0345) and shorts are still paying funding 🩸
🔥 Short liquidation magnets above:
🎯 0.0349 (~$22k)
🎯 0.0359 (~$12k)
🎯 0.0365 (~$11k)
💣 Bigger pockets if it breaks: 0.0381 / 0.0391
🧲 Long liquidation magnets below:
🟢 0.0277 · 0.0264 · 0.0244 (~$61k) · 0.0231 (~$86k)
👀 My read: the squeeze can still wick into 0.035–0.0365 to hunt those shorts. I only like a short AFTER a clear rejection there (1h close back below 0.034) ❌🐻 Then a reversal toward 0.032 ➜ 0.028 🎯
🛑 Invalidation above 0.0395
No rejection = no trade. Patience pays 🧘♂️
Where do you think $SHELL goes first? 👇 0.036 or 0.028?
🔔 Follow for more Squeeze Radar maps 📡
#SHELL #Binance #Crypto #ShortSqueeze #Liquidations #Futures #Trading
⚠️ Not financial advice. DYOR.
$SHELL just ripped +26% in a few hours 🚀 (0.0258 ➜ 0.0345) and shorts are still paying funding 🩸
🔥 Short liquidation magnets above:
🎯 0.0349 (~$22k)
🎯 0.0359 (~$12k)
🎯 0.0365 (~$11k)
💣 Bigger pockets if it breaks: 0.0381 / 0.0391
🧲 Long liquidation magnets below:
🟢 0.0277 · 0.0264 · 0.0244 (~$61k) · 0.0231 (~$86k)
👀 My read: the squeeze can still wick into 0.035–0.0365 to hunt those shorts. I only like a short AFTER a clear rejection there (1h close back below 0.034) ❌🐻 Then a reversal toward 0.032 ➜ 0.028 🎯
🛑 Invalidation above 0.0395
No rejection = no trade. Patience pays 🧘♂️
Where do you think $SHELL goes first? 👇 0.036 or 0.028?
🔔 Follow for more Squeeze Radar maps 📡
#SHELL #Binance #Crypto #ShortSqueeze #Liquidations #Futures #Trading
⚠️ Not financial advice. DYOR.
353
·
--
Übersetzung ansehen
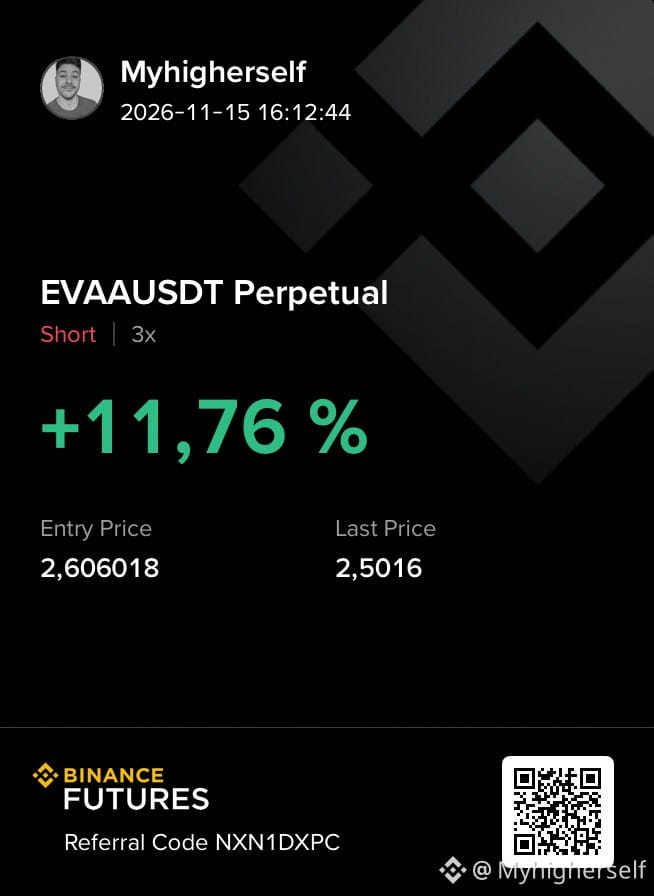
📡✅ Squeeze Radar called it on $EVAA
🔴 The radar marked the short-liquidation zone at ~2.75–2.86
🎯 Price swept it (high 2.80)… and got rejected 🩸
📉 Short from the zone: +11% ROI so far, heading to the long magnet below 🧲
Shorts fuel the pump, the magnet pulls it back 🔁
🤫 Squeeze Radar… coming soon 🛠️⚡
👇 Drop a 📡 for the next one
⚠️ Not financial advice. DYOR.
#EVAA #ShortSqueeze #Crypto #Liquidations #SqueezeRadar
📡✅ Squeeze Radar called it on $EVAA
🔴 The radar marked the short-liquidation zone at ~2.75–2.86
🎯 Price swept it (high 2.80)… and got rejected 🩸
📉 Short from the zone: +11% ROI so far, heading to the long magnet below 🧲
Shorts fuel the pump, the magnet pulls it back 🔁
🤫 Squeeze Radar… coming soon 🛠️⚡
👇 Drop a 📡 for the next one
⚠️ Not financial advice. DYOR.
#EVAA #ShortSqueeze #Crypto #Liquidations #SqueezeRadar
🔴 The radar marked the short-liquidation zone at ~2.75–2.86
🎯 Price swept it (high 2.80)… and got rejected 🩸
📉 Short from the zone: +11% ROI so far, heading to the long magnet below 🧲
Shorts fuel the pump, the magnet pulls it back 🔁
🤫 Squeeze Radar… coming soon 🛠️⚡
👇 Drop a 📡 for the next one
⚠️ Not financial advice. DYOR.
#EVAA #ShortSqueeze #Crypto #Liquidations #SqueezeRadar
283
·
--
Übersetzung ansehen
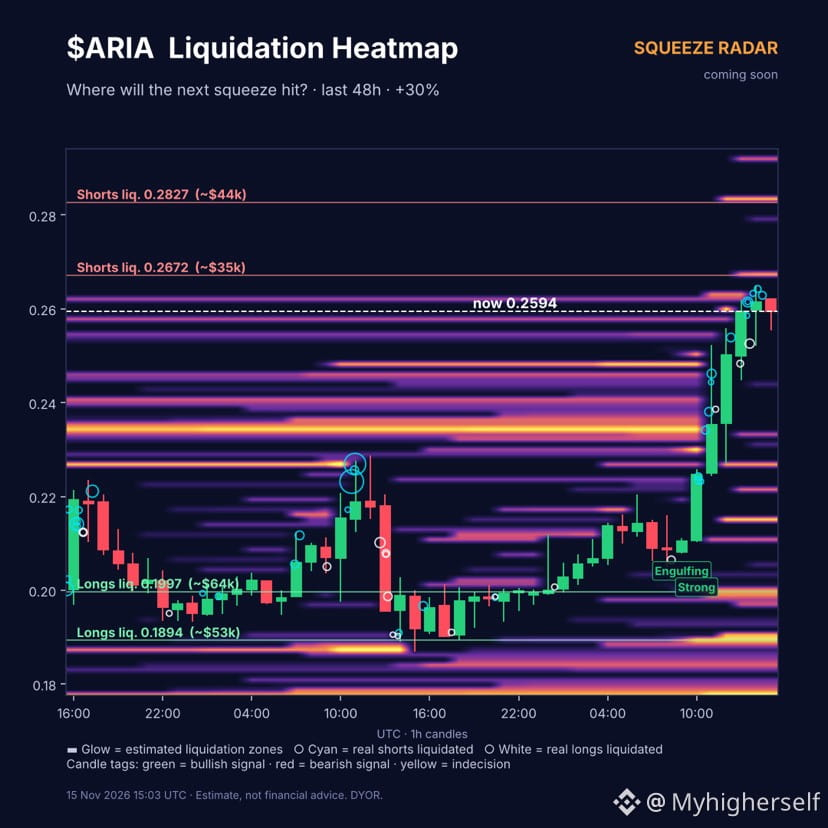
🚨📡 $ARIA +30% in 48h 🚀
Shorts got squeezed all the way up 🩸 (every 🔵 = a real liquidation)
👀 But the radar still sees fuel above:
🔴 ~0.268
🔴 ~0.283 (biggest pocket 🔥)
🧲 And liquidity waiting below:
🟢 ~0.200
🟢 ~0.190
Will it hunt the shorts first… or dump? 🤔
🤫 Squeeze Radar… coming soon 🛠️⚡
👇 Drop a 📡 for the next one
⚠️ Not financial advice. DYOR.
#ARIA #ShortSqueeze #Crypto #Liquidations #Trading # $ARIA
🚨📡 $ARIA +30% in 48h 🚀
Shorts got squeezed all the way up 🩸 (every 🔵 = a real liquidation)
👀 But the radar still sees fuel above:
🔴 ~0.268
🔴 ~0.283 (biggest pocket 🔥)
🧲 And liquidity waiting below:
🟢 ~0.200
🟢 ~0.190
Will it hunt the shorts first… or dump? 🤔
🤫 Squeeze Radar… coming soon 🛠️⚡
👇 Drop a 📡 for the next one
⚠️ Not financial advice. DYOR.
#ARIA #ShortSqueeze #Crypto #Liquidations #Trading # $ARIA
Shorts got squeezed all the way up 🩸 (every 🔵 = a real liquidation)
👀 But the radar still sees fuel above:
🔴 ~0.268
🔴 ~0.283 (biggest pocket 🔥)
🧲 And liquidity waiting below:
🟢 ~0.200
🟢 ~0.190
Will it hunt the shorts first… or dump? 🤔
🤫 Squeeze Radar… coming soon 🛠️⚡
👇 Drop a 📡 for the next one
⚠️ Not financial advice. DYOR.
#ARIA #ShortSqueeze #Crypto #Liquidations #Trading # $ARIA
208
·
--
Übersetzung ansehen
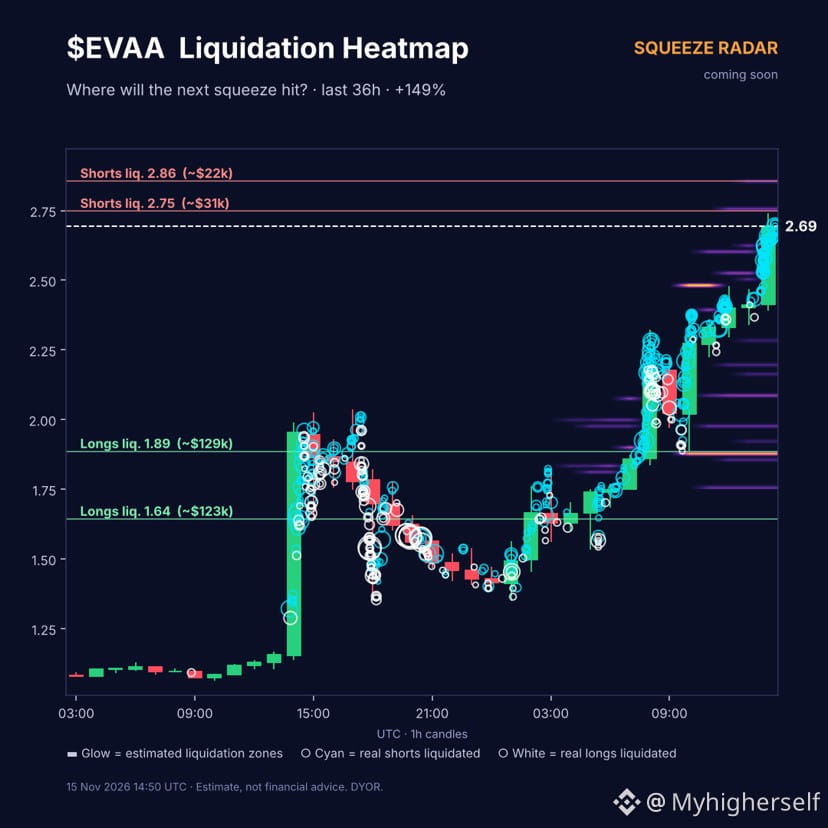
📡 $EVAA liquidation heatmap: estimated vs REAL
+150% in 36h 🚀 and shorts keep getting liquidated (cyan circles).
I'm building my own crypto scanner, Squeeze Radar 🛠️ It estimates where leveraged traders get liquidated from open interest + long/short ratio, then checks it against real liquidations.
🔴 Shorts still alive above: ~2.75 / ~2.86
🟢 Long liquidity below: ~1.86 / ~1.65
⚠️ Estimate, not financial advice. DYOR.
#EVAA #ShortSqueeze #Crypto #Liquidations #Trading #SqueezeRadar
$EVAA
📡 $EVAA liquidation heatmap: estimated vs REAL
+150% in 36h 🚀 and shorts keep getting liquidated (cyan circles).
I'm building my own crypto scanner, Squeeze Radar 🛠️ It estimates where leveraged traders get liquidated from open interest + long/short ratio, then checks it against real liquidations.
🔴 Shorts still alive above: ~2.75 / ~2.86
🟢 Long liquidity below: ~1.86 / ~1.65
⚠️ Estimate, not financial advice. DYOR.
#EVAA #ShortSqueeze #Crypto #Liquidations #Trading #SqueezeRadar
$EVAA
+150% in 36h 🚀 and shorts keep getting liquidated (cyan circles).
I'm building my own crypto scanner, Squeeze Radar 🛠️ It estimates where leveraged traders get liquidated from open interest + long/short ratio, then checks it against real liquidations.
🔴 Shorts still alive above: ~2.75 / ~2.86
🟢 Long liquidity below: ~1.86 / ~1.65
⚠️ Estimate, not financial advice. DYOR.
#EVAA #ShortSqueeze #Crypto #Liquidations #Trading #SqueezeRadar
$EVAA
442
Anmelden und weiter Inhalte entdecken
Krypto-Nutzer weltweit auf Binance Square kennenlernen
⚡️ Bleib in Sachen Krypto stets am Puls.
💬 Die weltgrößte Kryptobörse vertraut darauf.
👍 Erhalte verlässliche Einblicke von verifizierten Creators.
E-Mail-Adresse/Telefonnummer
Trendthemen
A Packed Week of Earnings and Data Tests Markets
34,554 Aufrufe
247 Kommentare
🚨🇺🇸 GROSSE WOCHE FÜR DIE MÄRKTE!
Die Märkte rechnen im Dezember mit einer Zinserhöhung der Fed, und $BTC könnte nächste Woche für starke Bewegungen sorgen.
Das steht an:
• Montag: Fed-Chef Warsh spricht
• Dienstag: US-Einzelhandelsumsätze + Quartalszahlen von $NVDA
• Mittwoch: FOMC-Protokoll
• Donnerstag: Erstanträge auf Arbeitslosenhilfe + Philly-Fed-Index
• Freitag: Verbraucherstimmung + Reden von Fed-Vertretern
Alle Augen richten sich auf $BTC , während eine weitere wichtige Woche beginnt.
#bitcoin
Mookie
·8 Likes
·5.1k Aufrufe
AnthropicIPOTestsInvestorAppetiteForAI
40,857 Aufrufe
736 Kommentare
BitcoinExtendsLosingStreakToSixWeeks
3,874 Aufrufe
117 Kommentare