
KarimJK
7 Beiträge
KarimJK
Melden
Nutzer blockieren
Follow for the latest updates and join the conversation on Binance Feed. Let's navigate the exciting world of cryptocurrency together!
1 Following
10 Follower
10 Like gegeben
Beiträge
·
--
Übersetzung ansehen
🔍 BTC/USDT is currently navigating a crucial phase.
In the 1H chart, we see BTC closing at 64339.2, below the EMA20 (64781.784) and EMA50 (65106.896), indicating bearish momentum. The RSI at 43 suggests potential weakness, while the volume ratio of 1.62 shows increased trading activity.
On the 4H chart, BTC closed at 64740.14, also below key moving averages. The RSI is at 34.7, hinting at oversold conditions but still lacking a strong reversal signal.
The daily chart shows a close of 64882.87, with an RSI of 23.7, indicating significant selling pressure.
Given these factors, what are your thoughts on BTC's next move?
#BTC #USDT #CryptoMarket #TechnicalAnalysis #Binance
🔍 BTC/USDT is currently navigating a crucial phase.
In the 1H chart, we see BTC closing at 64339.2, below the EMA20 (64781.784) and EMA50 (65106.896), indicating bearish momentum. The RSI at 43 suggests potential weakness, while the volume ratio of 1.62 shows increased trading activity.
On the 4H chart, BTC closed at 64740.14, also below key moving averages. The RSI is at 34.7, hinting at oversold conditions but still lacking a strong reversal signal.
The daily chart shows a close of 64882.87, with an RSI of 23.7, indicating significant selling pressure.
Given these factors, what are your thoughts on BTC's next move?
#BTC #USDT #CryptoMarket #TechnicalAnalysis #Binance
In the 1H chart, we see BTC closing at 64339.2, below the EMA20 (64781.784) and EMA50 (65106.896), indicating bearish momentum. The RSI at 43 suggests potential weakness, while the volume ratio of 1.62 shows increased trading activity.
On the 4H chart, BTC closed at 64740.14, also below key moving averages. The RSI is at 34.7, hinting at oversold conditions but still lacking a strong reversal signal.
The daily chart shows a close of 64882.87, with an RSI of 23.7, indicating significant selling pressure.
Given these factors, what are your thoughts on BTC's next move?
#BTC #USDT #CryptoMarket #TechnicalAnalysis #Binance
15
·
--
Übersetzung ansehen
As we analyze the recent BTCUSDT price movements, it's essential to consider the interplay of key indicators.
Currently, the 1-hour chart shows a close of 64882.87, with the EMA20 at 64907.192, indicating a slight bearish trend as the price hovers below the EMA. The RSI is at 49.5, suggesting a neutral momentum, while the MACD histogram is positive, hinting at potential upward movement.
On the 4-hour chart, the situation appears more concerning with an RSI of 34.8, indicating oversold conditions.
Given these insights, what strategies do you think are most effective in navigating such mixed signals in spot trading?
#BTC #CryptoEducation #TradingInsights #Binance #SpotTrading
As we analyze the recent BTCUSDT price movements, it's essential to consider the interplay of key indicators.
Currently, the 1-hour chart shows a close of 64882.87, with the EMA20 at 64907.192, indicating a slight bearish trend as the price hovers below the EMA. The RSI is at 49.5, suggesting a neutral momentum, while the MACD histogram is positive, hinting at potential upward movement.
On the 4-hour chart, the situation appears more concerning with an RSI of 34.8, indicating oversold conditions.
Given these insights, what strategies do you think are most effective in navigating such mixed signals in spot trading?
#BTC #CryptoEducation #TradingInsights #Binance #SpotTrading
Currently, the 1-hour chart shows a close of 64882.87, with the EMA20 at 64907.192, indicating a slight bearish trend as the price hovers below the EMA. The RSI is at 49.5, suggesting a neutral momentum, while the MACD histogram is positive, hinting at potential upward movement.
On the 4-hour chart, the situation appears more concerning with an RSI of 34.8, indicating oversold conditions.
Given these insights, what strategies do you think are most effective in navigating such mixed signals in spot trading?
#BTC #CryptoEducation #TradingInsights #Binance #SpotTrading
25
·
--
📊 Beim Spot-Handel geht es nicht darum, jede Bewegung mitzunehmen.
Bevor ich einen $BTC -Ausbruch als Bestätigung werte, prüfe ich vier Dinge:
1️⃣ Struktur: Hat eine Kerze jenseits eines aussagekräftigen Niveaus geschlossen?
2️⃣ Volumen: Ist die Beteiligung stärker als bei den jüngsten Kerzen?
3️⃣ Retest: Kann der ehemalige Widerstand als Unterstützung halten?
4️⃣ Risiko: Ist klar, wann das Setup ungültig ist, und beträgt das potenzielle Gewinn mindestens das Doppelte des geplanten Risikos?
Eine schnelle grüne Kerze allein ist kein Signal. Wenn die Belege unvollständig sind, ist ABWARTEN eine gültige Entscheidung – keine verpasste Gelegenheit.
Dies ist eine Lehr-Checkliste, kein Live-Handelssignal und keine Kursprognose.
Welcher Filter hilft dir, Fehlausbrüche zu vermeiden?
#Bitcoin #BinanceSquare #SpotTrading #Risikomanagement
📊 Beim Spot-Handel geht es nicht darum, jede Bewegung mitzunehmen.
Bevor ich einen $BTC -Ausbruch als Bestätigung werte, prüfe ich vier Dinge:
1️⃣ Struktur: Hat eine Kerze jenseits eines aussagekräftigen Niveaus geschlossen?
2️⃣ Volumen: Ist die Beteiligung stärker als bei den jüngsten Kerzen?
3️⃣ Retest: Kann der ehemalige Widerstand als Unterstützung halten?
4️⃣ Risiko: Ist klar, wann das Setup ungültig ist, und beträgt das potenzielle Gewinn mindestens das Doppelte des geplanten Risikos?
Eine schnelle grüne Kerze allein ist kein Signal. Wenn die Belege unvollständig sind, ist ABWARTEN eine gültige Entscheidung – keine verpasste Gelegenheit.
Dies ist eine Lehr-Checkliste, kein Live-Handelssignal und keine Kursprognose.
Welcher Filter hilft dir, Fehlausbrüche zu vermeiden?
#Bitcoin #BinanceSquare #SpotTrading #Risikomanagement
Bevor ich einen $BTC -Ausbruch als Bestätigung werte, prüfe ich vier Dinge:
1️⃣ Struktur: Hat eine Kerze jenseits eines aussagekräftigen Niveaus geschlossen?
2️⃣ Volumen: Ist die Beteiligung stärker als bei den jüngsten Kerzen?
3️⃣ Retest: Kann der ehemalige Widerstand als Unterstützung halten?
4️⃣ Risiko: Ist klar, wann das Setup ungültig ist, und beträgt das potenzielle Gewinn mindestens das Doppelte des geplanten Risikos?
Eine schnelle grüne Kerze allein ist kein Signal. Wenn die Belege unvollständig sind, ist ABWARTEN eine gültige Entscheidung – keine verpasste Gelegenheit.
Dies ist eine Lehr-Checkliste, kein Live-Handelssignal und keine Kursprognose.
Welcher Filter hilft dir, Fehlausbrüche zu vermeiden?
#Bitcoin #BinanceSquare #SpotTrading #Risikomanagement
13
·
--
🚨 Der größte Fehler beim Krypto-Trading ist nicht, zu spät einzusteigen!
Die meisten Trader konzentrieren sich darauf, den perfekten Einstieg zu finden.
Doch erfahrene Trader wissen, was noch wichtiger ist:
Dein Kapital zu schützen ist genauso wichtig wie Gewinne zu erzielen. 📊
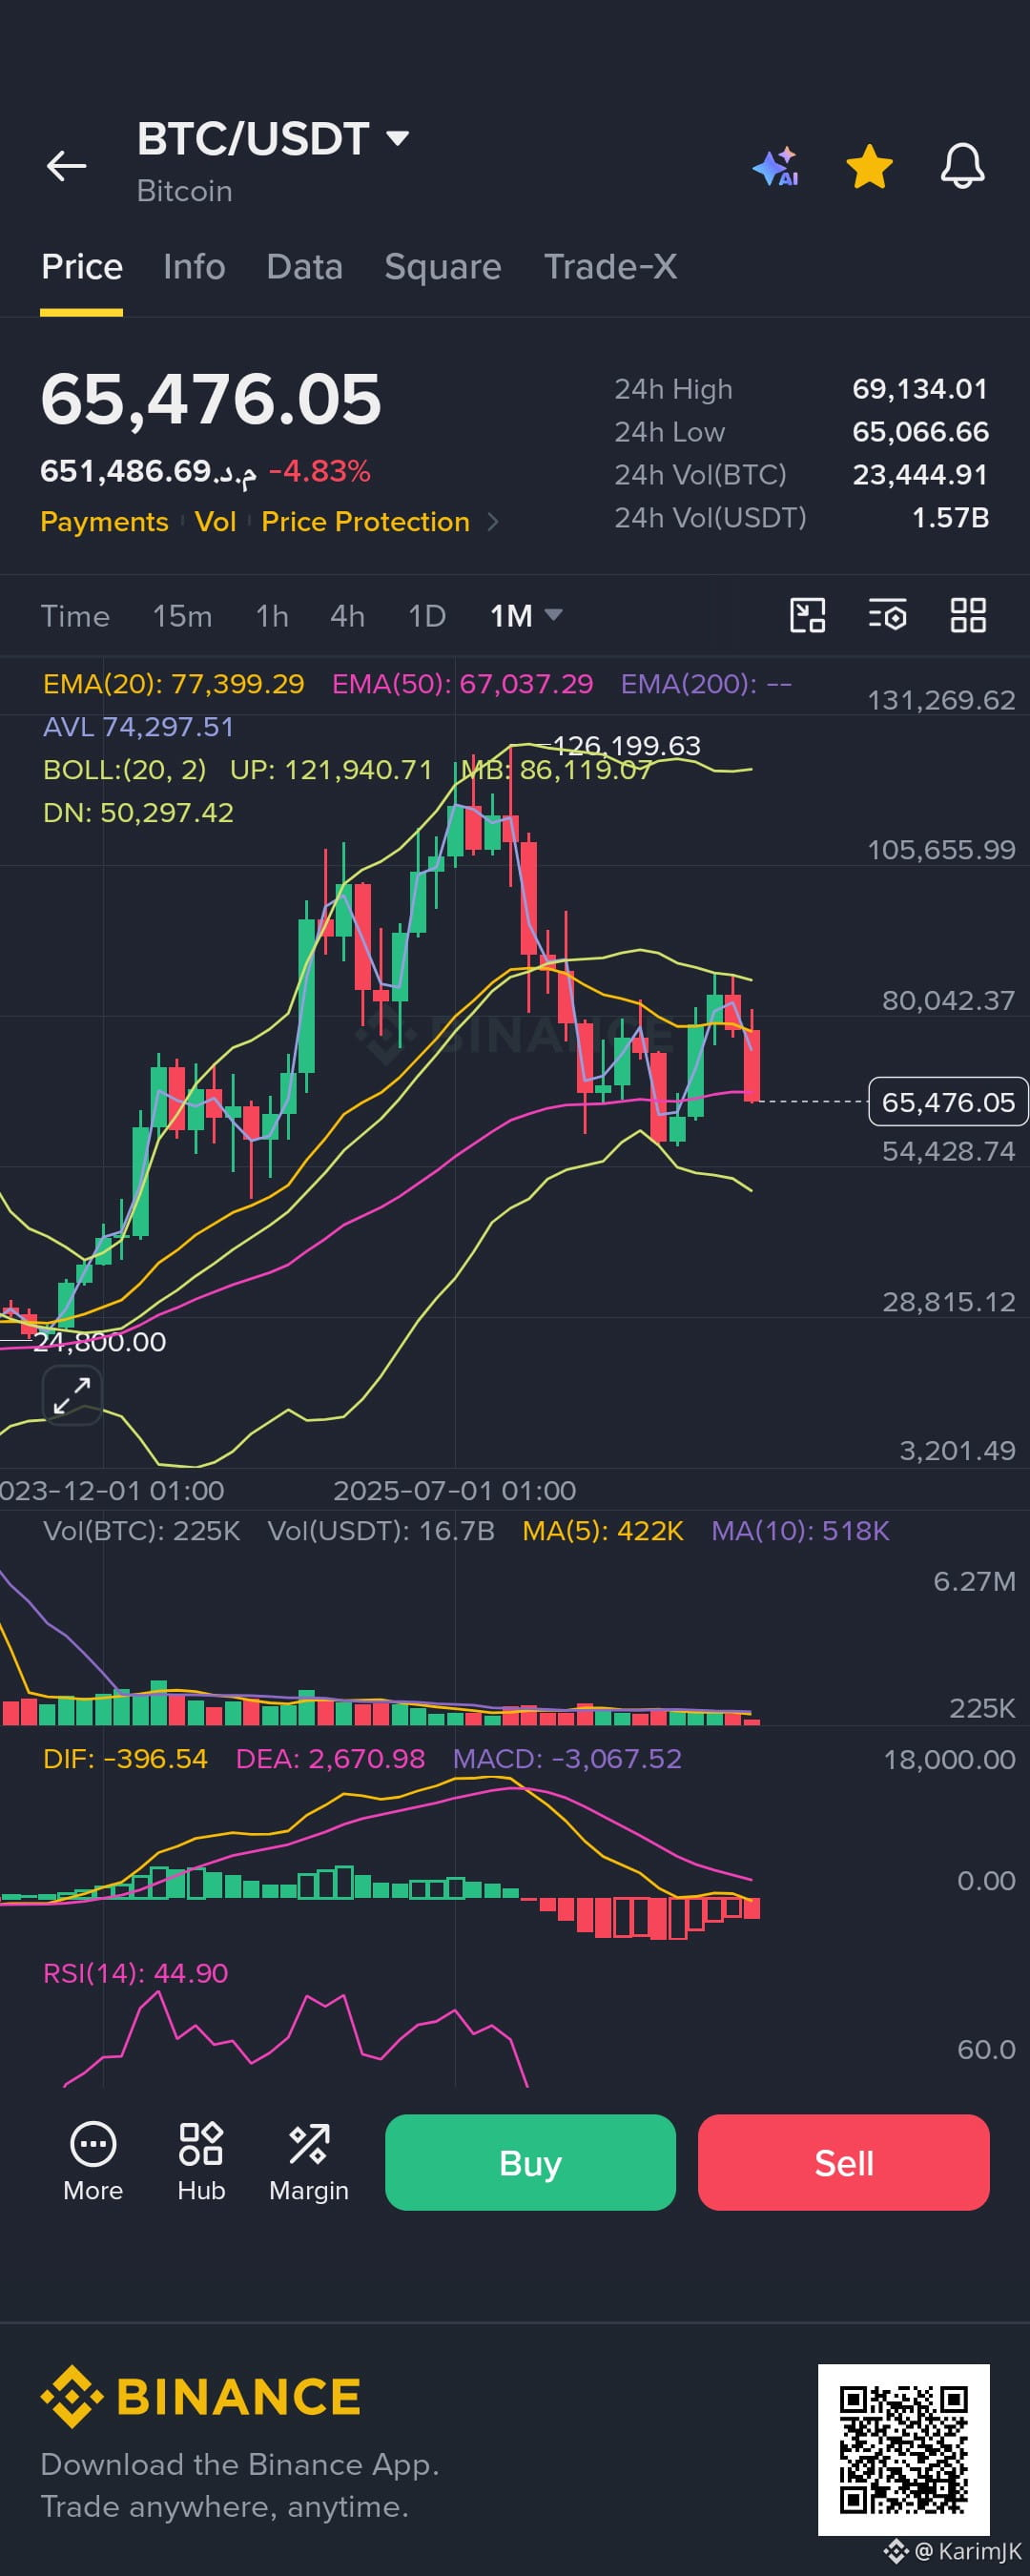
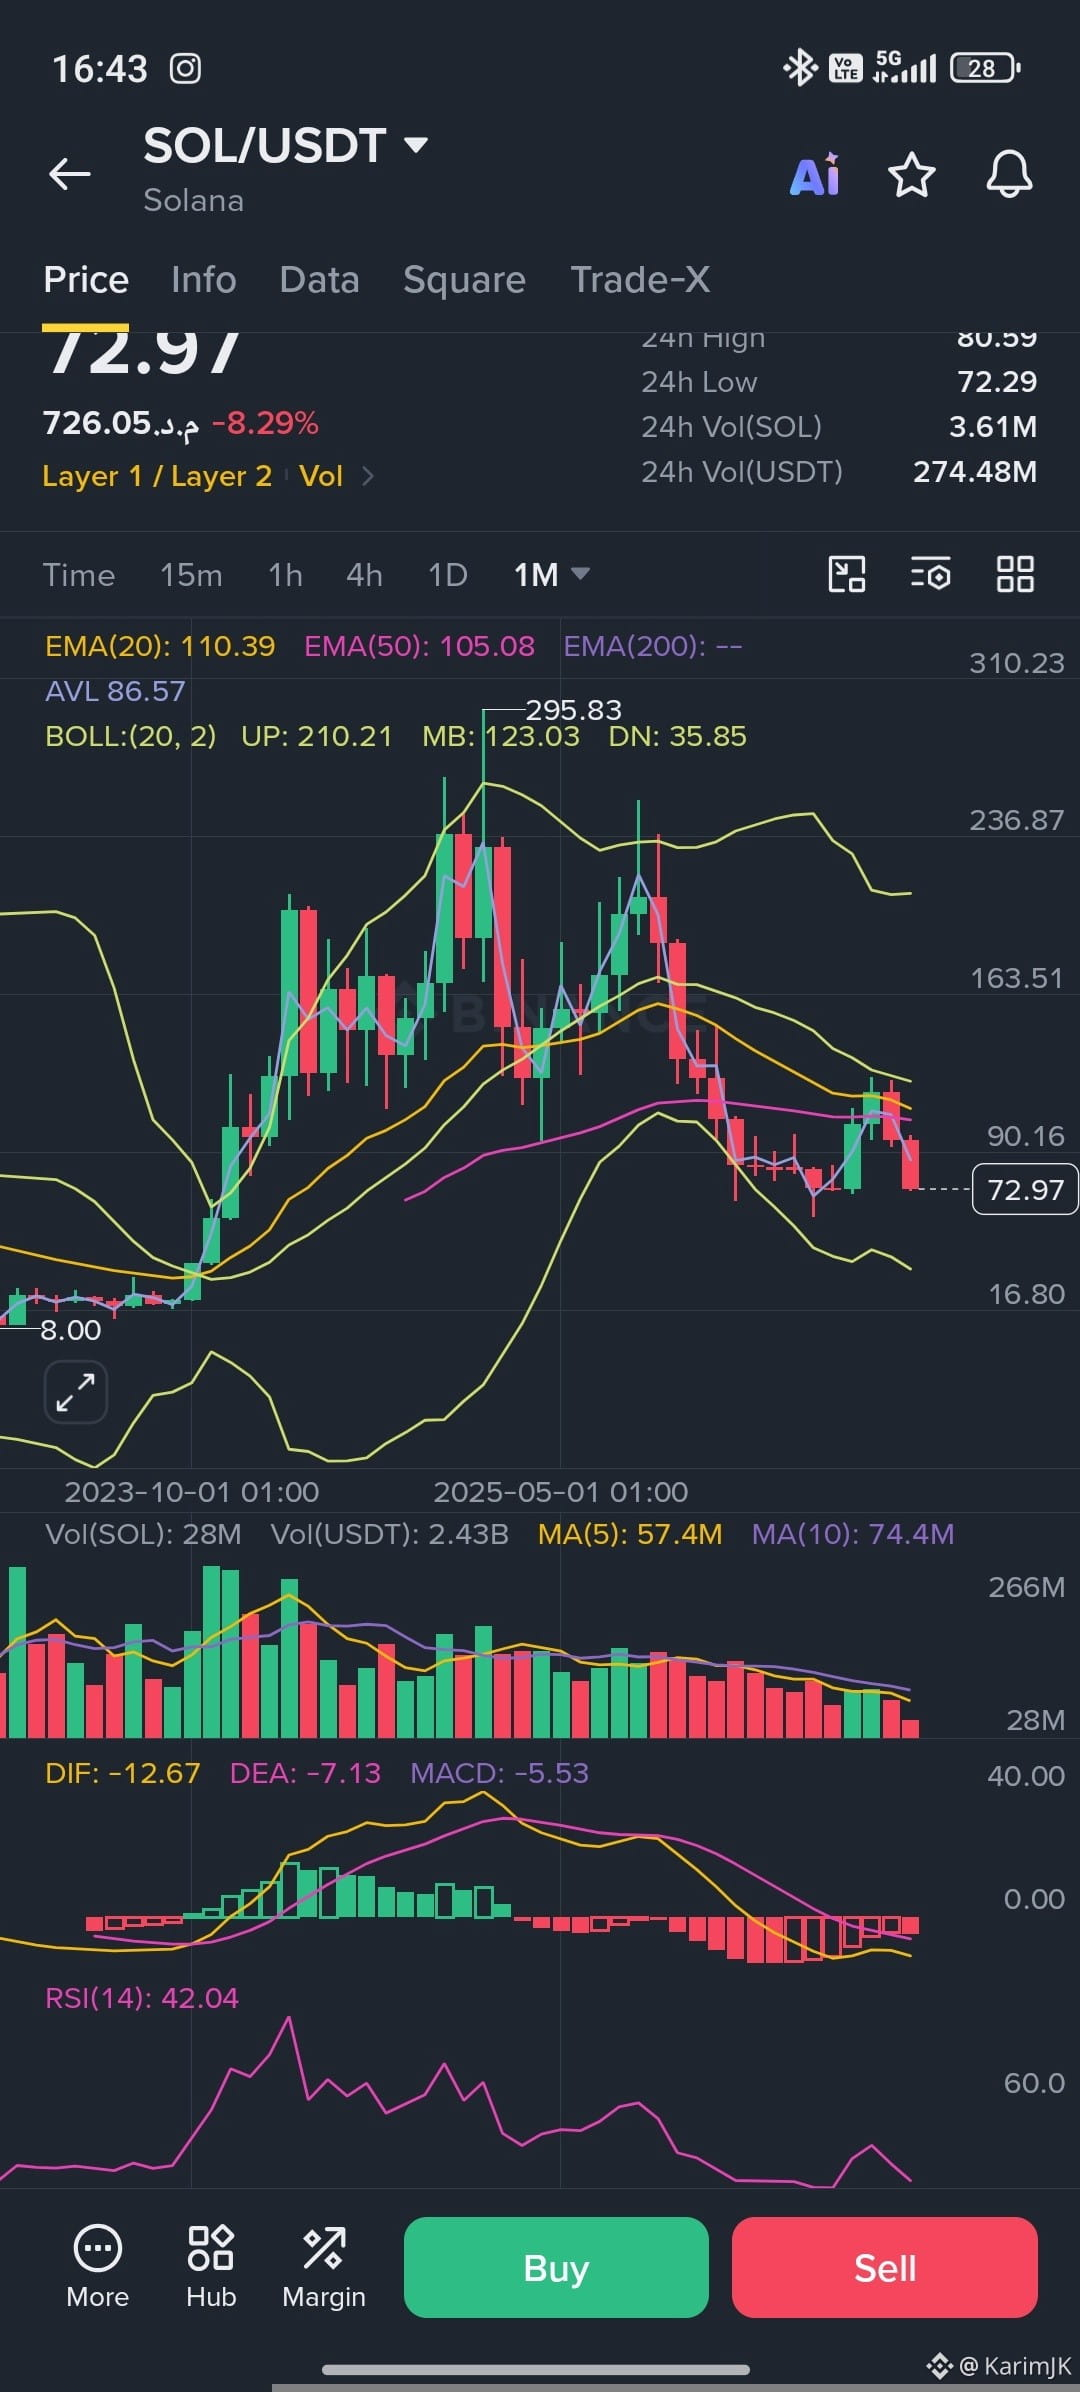
Hier sind 4 Regeln, die ich bei der Analyse von $BTC und $SOL befolge:
✅ Laufe niemals einem plötzlichen Pump hinterher.
✅ Warte mit dem Einstieg auf eine Bestätigung der Unterstützung.
✅ Berechne vor jedem Trade immer das Verhältnis von Risiko zu Rendite.
✅ Manchmal ist der beste Trade, GAR NICHT ZU HANDELN.
🎯 Ein Gewinn von +2 % bedeutet nichts, wenn du dafür -10 % riskierst.
💬 FRAGE AN KRYPTOTRADER:
Was ist deine größte Trading-Herausforderung?
🅰️ Zu früh einsteigen
🅱️ Zu früh verkaufen
🅲️ Stop-Losses verwalten
🅳️ Geduldig abwarten
👇 Teile deine Erfahrungen in den Kommentaren!
#BinanceSquare #Write2Earn #CryptoTrading #Bitcoin #Solana
🚨 Der größte Fehler beim Krypto-Trading ist nicht, zu spät einzusteigen!
Die meisten Trader konzentrieren sich darauf, den perfekten Einstieg zu finden.
Doch erfahrene Trader wissen, was noch wichtiger ist:
Dein Kapital zu schützen ist genauso wichtig wie Gewinne zu erzielen. 📊
Hier sind 4 Regeln, die ich bei der Analyse von $BTC und $SOL befolge:
✅ Laufe niemals einem plötzlichen Pump hinterher.
✅ Warte mit dem Einstieg auf eine Bestätigung der Unterstützung.
✅ Berechne vor jedem Trade immer das Verhältnis von Risiko zu Rendite.
✅ Manchmal ist der beste Trade, GAR NICHT ZU HANDELN.
🎯 Ein Gewinn von +2 % bedeutet nichts, wenn du dafür -10 % riskierst.
💬 FRAGE AN KRYPTOTRADER:
Was ist deine größte Trading-Herausforderung?
🅰️ Zu früh einsteigen
🅱️ Zu früh verkaufen
🅲️ Stop-Losses verwalten
🅳️ Geduldig abwarten
👇 Teile deine Erfahrungen in den Kommentaren!
#BinanceSquare #Write2Earn #CryptoTrading #Bitcoin #Solana
Die meisten Trader konzentrieren sich darauf, den perfekten Einstieg zu finden.
Doch erfahrene Trader wissen, was noch wichtiger ist:
Dein Kapital zu schützen ist genauso wichtig wie Gewinne zu erzielen. 📊
Hier sind 4 Regeln, die ich bei der Analyse von $BTC und $SOL befolge:
✅ Laufe niemals einem plötzlichen Pump hinterher.
✅ Warte mit dem Einstieg auf eine Bestätigung der Unterstützung.
✅ Berechne vor jedem Trade immer das Verhältnis von Risiko zu Rendite.
✅ Manchmal ist der beste Trade, GAR NICHT ZU HANDELN.
🎯 Ein Gewinn von +2 % bedeutet nichts, wenn du dafür -10 % riskierst.
💬 FRAGE AN KRYPTOTRADER:
Was ist deine größte Trading-Herausforderung?
🅰️ Zu früh einsteigen
🅱️ Zu früh verkaufen
🅲️ Stop-Losses verwalten
🅳️ Geduldig abwarten
👇 Teile deine Erfahrungen in den Kommentaren!
#BinanceSquare #Write2Earn #CryptoTrading #Bitcoin #Solana
162
·
--
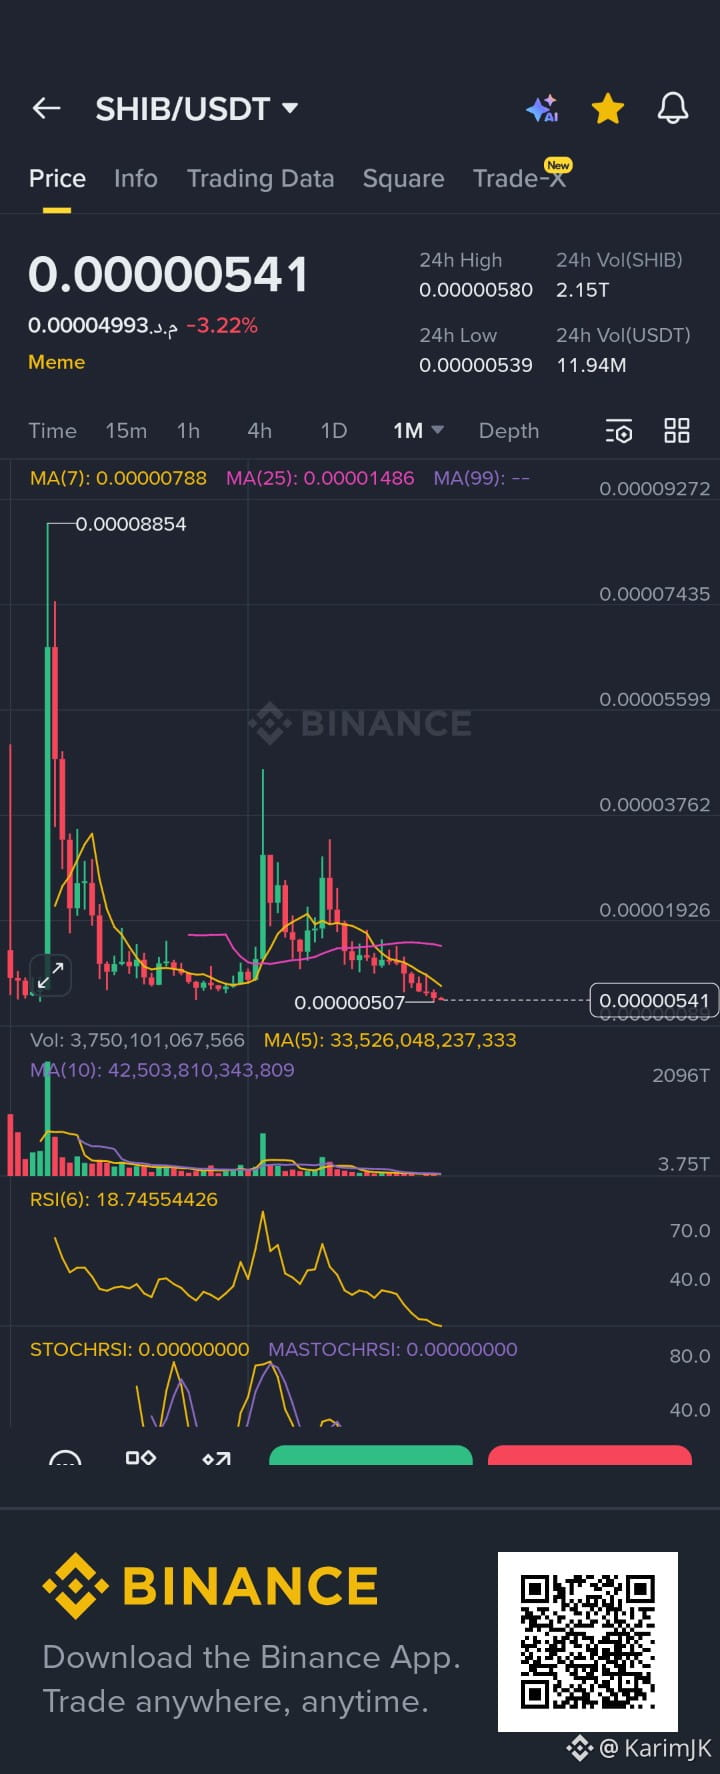
$SHIB
{spot}(SHIBUSDT)
Kaufe Shiba und frag mich nicht "WARUM?" 🥸
$SHIB
Kaufe Shiba und frag mich nicht "WARUM?" 🥸
Kaufe Shiba und frag mich nicht "WARUM?" 🥸
4
2
13
253
Anmelden und weiter Inhalte entdecken
Krypto-Nutzer weltweit auf Binance Square kennenlernen
⚡️ Bleib in Sachen Krypto stets am Puls.
💬 Die weltgrößte Kryptobörse vertraut darauf.
👍 Erhalte verlässliche Einblicke von verifizierten Creators.
E-Mail-Adresse/Telefonnummer
Trendthemen
NvidiaEarningsTonight:AIStocks’NextMove?
50,114 Aufrufe
759 Kommentare
Nvidias Bilanzvorlage: Erster Auftritt der Interims-CEO – Hält die KI-Story stand?
Binance News
·17 Likes
·7.8k Aufrufe
A Packed Week of Earnings and Data Tests Markets
116,750 Aufrufe
588 Kommentare
AnthropicIPOTestsInvestorAppetiteForAI
254,788 Aufrufe
2,500 Kommentare