
The Bitcoin Guy
10 Beiträge

The Bitcoin Guy
Melden
Nutzer blockieren
Trade eröffnen

ETH Halter
Regelmäßiger Trader
3.2 Jahre
1 Following
1 Follower
2 Like gegeben
Beiträge
Portfolio
Alle
Zitierungen
Artikel
Übersetzung ansehen
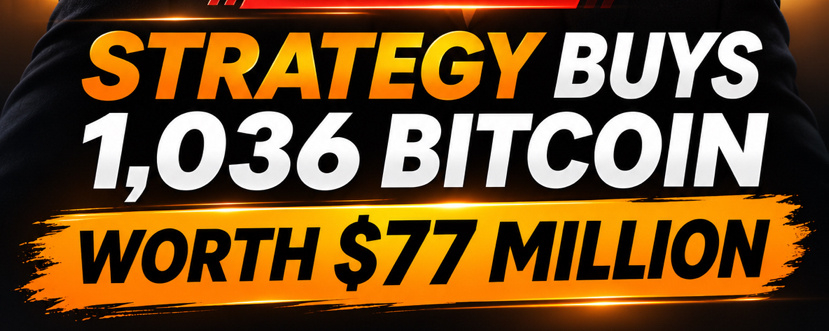
JUST IN: Strategy Adds Another 1,036 BTC Worth $77 MILLION to Its Bitcoin Holdings! 👀The company reportedly purchased the Bitcoin last week at an average price of $79,012 per BTC.
And the accumulation continues! 🚀
Strategy now holds a staggering 850,364 BTC, with a total acquisition cost of approximately $64.16 BILLION.
While others debate Bitcoin’s future, Strategy keeps stacking.
🔥 Is Michael Saylor playing the long game, or is Strategy taking an enormous risk?
What’s your take?
#Bitcoin #BTC #Strategy #MichaelSaylor #CryptoNews
JUST IN: Strategy Adds Another 1,036 BTC Worth $77 MILLION to Its Bitcoin Holdings! 👀
The company reportedly purchased the Bitcoin last week at an average price of $79,012 per BTC.
And the accumulation continues! 🚀
Strategy now holds a staggering 850,364 BTC, with a total acquisition cost of approximately $64.16 BILLION.
While others debate Bitcoin’s future, Strategy keeps stacking.
🔥 Is Michael Saylor playing the long game, or is Strategy taking an enormous risk?
What’s your take?
#Bitcoin #BTC #Strategy #MichaelSaylor #CryptoNews
And the accumulation continues! 🚀
Strategy now holds a staggering 850,364 BTC, with a total acquisition cost of approximately $64.16 BILLION.
While others debate Bitcoin’s future, Strategy keeps stacking.
🔥 Is Michael Saylor playing the long game, or is Strategy taking an enormous risk?
What’s your take?
#Bitcoin #BTC #Strategy #MichaelSaylor #CryptoNews
1
69
Artikel
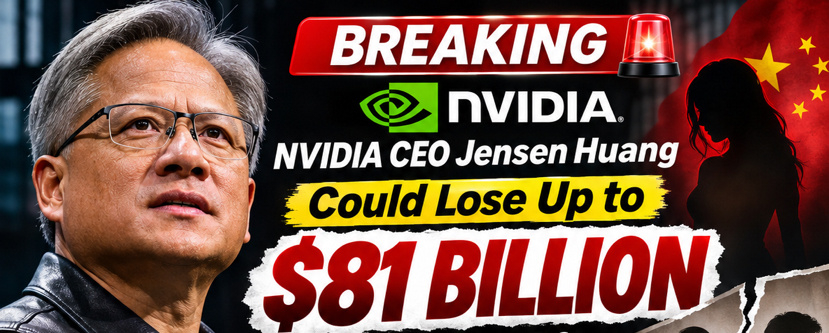
🚨 EILMELDUNG: NVIDIA-CEO Jensen Huang könnte sich bei einer möglichen Scheidung von ATEMBERAUBENDEN 81 MILLIARDEN DOLLAR trennen müssen!Lass diese Zahl einen Moment auf dich wirken. 81 MILLIARDEN DOLLAR.
Das ist mehr als das DOPPELTE von Jeff Bezos’ Scheidungsvereinbarung in Höhe von etwa 35 Milliarden Dollar. 🤯
Jensen Huang hat Jahrzehnte damit verbracht, NVIDIA zu einem der mächtigsten Unternehmen der Welt aufzubauen. Sein geschätztes Privatvermögen beträgt mehr als 160 Milliarden Dollar.
Doch nun haben Berichte über eine angebliche Affäre mit einem mutmaßlichen chinesischen Spion Spekulationen über die möglichen finanziellen Folgen ausgelöst, falls seine Ehe jemals geschieden werden sollte.
Und jetzt wird es noch interessanter:
🚨 EILMELDUNG: NVIDIA-CEO Jensen Huang könnte sich bei einer möglichen Scheidung von ATEMBERAUBENDEN 81 MILLIARDEN DOLLAR trennen müssen!
Lass diese Zahl einen Moment auf dich wirken. 81 MILLIARDEN DOLLAR.
Das ist mehr als das DOPPELTE von Jeff Bezos’ Scheidungsvereinbarung in Höhe von etwa 35 Milliarden Dollar. 🤯
Jensen Huang hat Jahrzehnte damit verbracht, NVIDIA zu einem der mächtigsten Unternehmen der Welt aufzubauen. Sein geschätztes Privatvermögen beträgt mehr als 160 Milliarden Dollar.
Doch nun haben Berichte über eine angebliche Affäre mit einem mutmaßlichen chinesischen Spion Spekulationen über die möglichen finanziellen Folgen ausgelöst, falls seine Ehe jemals geschieden werden sollte.
Und jetzt wird es noch interessanter:
Das ist mehr als das DOPPELTE von Jeff Bezos’ Scheidungsvereinbarung in Höhe von etwa 35 Milliarden Dollar. 🤯
Jensen Huang hat Jahrzehnte damit verbracht, NVIDIA zu einem der mächtigsten Unternehmen der Welt aufzubauen. Sein geschätztes Privatvermögen beträgt mehr als 160 Milliarden Dollar.
Doch nun haben Berichte über eine angebliche Affäre mit einem mutmaßlichen chinesischen Spion Spekulationen über die möglichen finanziellen Folgen ausgelöst, falls seine Ehe jemals geschieden werden sollte.
Und jetzt wird es noch interessanter:
573
Übersetzung ansehen
🚨 BREAKING: Binance CFO Steps Down Just 9 Days After $6.3 BILLION Hack!
The timing is raising eyebrows across the crypto community. 👀
However, Binance’s Co-CEO insists the leadership transition was planned six months ago and has absolutely no connection to the recent security breach.
Coincidence or just an unexpected shake-up? 🤔
What do you think?
$BNB $IDOL $KOMA
#Binance #CryptoNews #bnb #CryptoMarket #BreakingNews
🚨 BREAKING: Binance CFO Steps Down Just 9 Days After $6.3 BILLION Hack!
The timing is raising eyebrows across the crypto community. 👀
However, Binance’s Co-CEO insists the leadership transition was planned six months ago and has absolutely no connection to the recent security breach.
Coincidence or just an unexpected shake-up? 🤔
What do you think?
$BNB $IDOL $KOMA
#Binance #CryptoNews #bnb #CryptoMarket #BreakingNews
The timing is raising eyebrows across the crypto community. 👀
However, Binance’s Co-CEO insists the leadership transition was planned six months ago and has absolutely no connection to the recent security breach.
Coincidence or just an unexpected shake-up? 🤔
What do you think?
$BNB $IDOL $KOMA
#Binance #CryptoNews #bnb #CryptoMarket #BreakingNews

58
Übersetzung ansehen
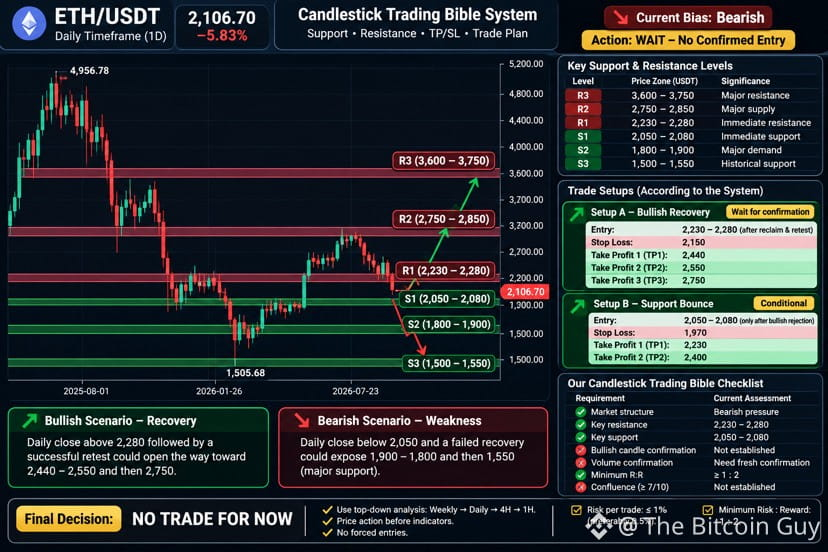
Based on my Candlestick Trading Analysis $ETH /#USDT is currently showing bearish pressure on the Daily timeframe. Price is trading below an important support-turned-resistance level.
1. Important support and resistance levels
Based on Daily chart (current price: $2,106.70):
Level Price zone Significance
R3 $3,600–3,750 Major resistance
R2 $2,750–2,850 Major supply
R1 $2,230–2,280 Immediate resistance
S1 $2,050–2,080 Immediate support
S2 $1,800–1,900 Major demand
S3 $1,500–1,550 Historical support
These are approximate technical zones, not guaranteed reversal prices.
2. Trade setup
Setup A – Bullish recovery (preferred spot setup)
Wait for confirmation
* Entry: $2,230–2,280 after reclaim and successful retest.
* Stop loss: $2,150 (illustrative; below confirmed retest swing).
* TP1: $2,440
* TP2: $2,550
* TP3: $2,750
Setup B – Support bounce
Conditional
* Entry zone: $2,050–2,080, only after bullish rejection.
* Stop loss: $1,970
* TP1: $2,230
* TP2: $2,400
Do not enter simply because price touches support.
3. What happens next?
Bullish scenario
Recovery
Daily close above $2,280 followed by a successful retest could open the way toward $2,440–2,550.
Bearish scenario
Weakness
Daily close below $2,050 and failed recovery could expose $1,900 and then $1,800.
4. Our Candlestick Trading Analysis
Requirement Current assessment
Market structure Bearish pressure
Key resistance $2,230–2,280
Support $2,050–2,080
Bullish candle confirmation Not established
Volume confirmation Need fresh chart
Minimum R:R 1:2
Confluence ≥7/10 Not established
My final decision: NO TRADE for now.
Our rules remain:
* Weekly → Daily → 4H → 1H analysis.
* Price action before indicators.
* No forced entries.
* Maximum 1% account risk, preferably 0.5%.
* Minimum 1:2 risk/reward.
Based on my Candlestick Trading Analysis $ETH /#USDT is currently showing bearish pressure on the Daily timeframe. Price is trading below an important support-turned-resistance level.
1. Important support and resistance levels
Based on Daily chart (current price: $2,106.70):
Level Price zone Significance
R3 $3,600–3,750 Major resistance
R2 $2,750–2,850 Major supply
R1 $2,230–2,280 Immediate resistance
S1 $2,050–2,080 Immediate support
S2 $1,800–1,900 Major demand
S3 $1,500–1,550 Historical support
These are approximate technical zones, not guaranteed reversal prices.
2. Trade setup
Setup A – Bullish recovery (preferred spot setup)
Wait for confirmation
* Entry: $2,230–2,280 after reclaim and successful retest.
* Stop loss: $2,150 (illustrative; below confirmed retest swing).
* TP1: $2,440
* TP2: $2,550
* TP3: $2,750
Setup B – Support bounce
Conditional
* Entry zone: $2,050–2,080, only after bullish rejection.
* Stop loss: $1,970
* TP1: $2,230
* TP2: $2,400
Do not enter simply because price touches support.
3. What happens next?
Bullish scenario
Recovery
Daily close above $2,280 followed by a successful retest could open the way toward $2,440–2,550.
Bearish scenario
Weakness
Daily close below $2,050 and failed recovery could expose $1,900 and then $1,800.
4. Our Candlestick Trading Analysis
Requirement Current assessment
Market structure Bearish pressure
Key resistance $2,230–2,280
Support $2,050–2,080
Bullish candle confirmation Not established
Volume confirmation Need fresh chart
Minimum R:R 1:2
Confluence ≥7/10 Not established
My final decision: NO TRADE for now.
Our rules remain:
* Weekly → Daily → 4H → 1H analysis.
* Price action before indicators.
* No forced entries.
* Maximum 1% account risk, preferably 0.5%.
* Minimum 1:2 risk/reward.
1. Important support and resistance levels
Based on Daily chart (current price: $2,106.70):
Level Price zone Significance
R3 $3,600–3,750 Major resistance
R2 $2,750–2,850 Major supply
R1 $2,230–2,280 Immediate resistance
S1 $2,050–2,080 Immediate support
S2 $1,800–1,900 Major demand
S3 $1,500–1,550 Historical support
These are approximate technical zones, not guaranteed reversal prices.
2. Trade setup
Setup A – Bullish recovery (preferred spot setup)
Wait for confirmation
* Entry: $2,230–2,280 after reclaim and successful retest.
* Stop loss: $2,150 (illustrative; below confirmed retest swing).
* TP1: $2,440
* TP2: $2,550
* TP3: $2,750
Setup B – Support bounce
Conditional
* Entry zone: $2,050–2,080, only after bullish rejection.
* Stop loss: $1,970
* TP1: $2,230
* TP2: $2,400
Do not enter simply because price touches support.
3. What happens next?
Bullish scenario
Recovery
Daily close above $2,280 followed by a successful retest could open the way toward $2,440–2,550.
Bearish scenario
Weakness
Daily close below $2,050 and failed recovery could expose $1,900 and then $1,800.
4. Our Candlestick Trading Analysis
Requirement Current assessment
Market structure Bearish pressure
Key resistance $2,230–2,280
Support $2,050–2,080
Bullish candle confirmation Not established
Volume confirmation Need fresh chart
Minimum R:R 1:2
Confluence ≥7/10 Not established
My final decision: NO TRADE for now.
Our rules remain:
* Weekly → Daily → 4H → 1H analysis.
* Price action before indicators.
* No forced entries.
* Maximum 1% account risk, preferably 0.5%.
* Minimum 1:2 risk/reward.
118
@Bitcoinworld : Smart Money wartet, Anfänger jagen hinterher!
Der größte Fehler beim Krypto-Trading ist, einen Trade einzugehen, nur weil sich der Kurs bewegt.
Professionelle Trader konzentrieren sich auf:
📊 Marktstruktur
📈 Unterstützung und Widerstand
📉 Handelsvolumen
🎯 Chance-Risiko-Verhältnis
Mein Ansatz ist einfach:
Jage keinen grünen Kerzen hinterher.
Gerate bei roten Kerzen nicht in Panik.
Warte auf eine Bestätigung.
Ich beobachte $BTC und $ETH genau.
🔥 Frage: Treten wir in eine weitere Aufwärtsphase ein, oder bereitet sich der Markt auf eine Korrektur vor?
Teile deine Gedanken!
#bitcoin #BTC #Ethereum #ETH🔥🔥🔥🔥🔥🔥 #CryptoNewss
@Bitcoinworld : Smart Money wartet, Anfänger jagen hinterher!
Der größte Fehler beim Krypto-Trading ist, einen Trade einzugehen, nur weil sich der Kurs bewegt.
Professionelle Trader konzentrieren sich auf:
📊 Marktstruktur
📈 Unterstützung und Widerstand
📉 Handelsvolumen
🎯 Chance-Risiko-Verhältnis
Mein Ansatz ist einfach:
Jage keinen grünen Kerzen hinterher.
Gerate bei roten Kerzen nicht in Panik.
Warte auf eine Bestätigung.
Ich beobachte $BTC und $ETH genau.
🔥 Frage: Treten wir in eine weitere Aufwärtsphase ein, oder bereitet sich der Markt auf eine Korrektur vor?
Teile deine Gedanken!
#bitcoin #BTC #Ethereum #ETH🔥🔥🔥🔥🔥🔥 #CryptoNewss
Der größte Fehler beim Krypto-Trading ist, einen Trade einzugehen, nur weil sich der Kurs bewegt.
Professionelle Trader konzentrieren sich auf:
📊 Marktstruktur
📈 Unterstützung und Widerstand
📉 Handelsvolumen
🎯 Chance-Risiko-Verhältnis
Mein Ansatz ist einfach:
Jage keinen grünen Kerzen hinterher.
Gerate bei roten Kerzen nicht in Panik.
Warte auf eine Bestätigung.
Ich beobachte $BTC und $ETH genau.
🔥 Frage: Treten wir in eine weitere Aufwärtsphase ein, oder bereitet sich der Markt auf eine Korrektur vor?
Teile deine Gedanken!
#bitcoin #BTC #Ethereum #ETH🔥🔥🔥🔥🔥🔥 #CryptoNewss
1
86
Übersetzung ansehen
My daughter came into this world during the toughest chapter of my life.
The rent was overdue, hospital bills kept growing, and I felt like I was already letting her down. One night at 3 a.m., I held her tiny hand and made a promise: “I’ll find a way to give you a better future.”
That promise led me to crypto. When I discovered @Babylon and $BABY, I didn’t see just another token—I saw hope. It wasn’t about chasing hype or getting rich overnight. It was about believing that one opportunity could change everything.
Today, my daughter still holds my hand, but the fear that once kept me awake is gone. Sometimes, the smallest coin carries the biggest dream. 💛🖤
@BabylonLabs_io #BabyBonkCoin #Memecoin $BABY $EUL
My daughter came into this world during the toughest chapter of my life.
The rent was overdue, hospital bills kept growing, and I felt like I was already letting her down. One night at 3 a.m., I held her tiny hand and made a promise: “I’ll find a way to give you a better future.”
That promise led me to crypto. When I discovered @Babylon and $BABY, I didn’t see just another token—I saw hope. It wasn’t about chasing hype or getting rich overnight. It was about believing that one opportunity could change everything.
Today, my daughter still holds my hand, but the fear that once kept me awake is gone. Sometimes, the smallest coin carries the biggest dream. 💛🖤
@BabylonLabs_io #BabyBonkCoin #Memecoin $BABY $EUL
The rent was overdue, hospital bills kept growing, and I felt like I was already letting her down. One night at 3 a.m., I held her tiny hand and made a promise: “I’ll find a way to give you a better future.”
That promise led me to crypto. When I discovered @Babylon and $BABY, I didn’t see just another token—I saw hope. It wasn’t about chasing hype or getting rich overnight. It was about believing that one opportunity could change everything.
Today, my daughter still holds my hand, but the fear that once kept me awake is gone. Sometimes, the smallest coin carries the biggest dream. 💛🖤
@BabylonLabs_io #BabyBonkCoin #Memecoin $BABY $EUL

5
·
--
Bullisch
Übersetzung ansehen
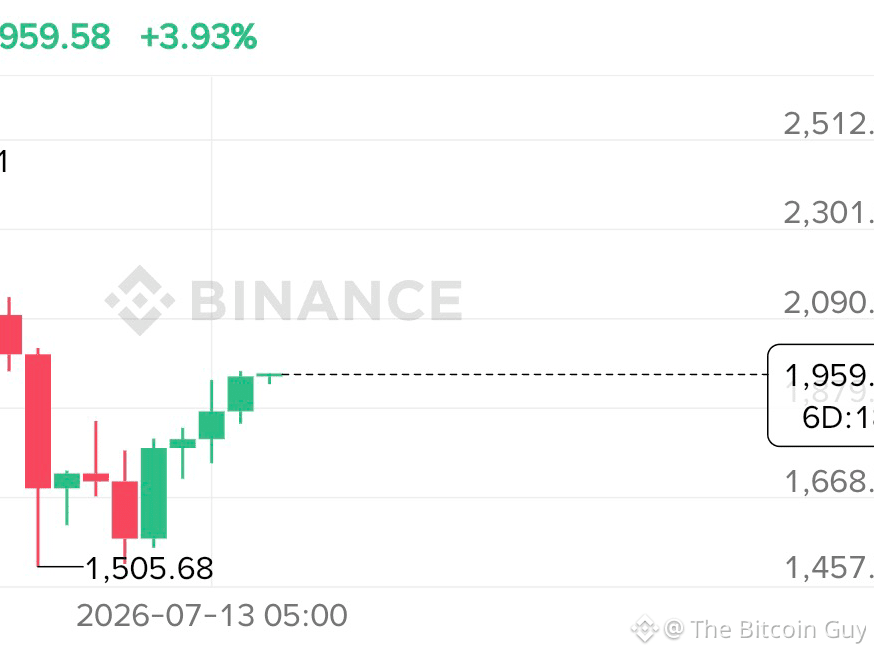
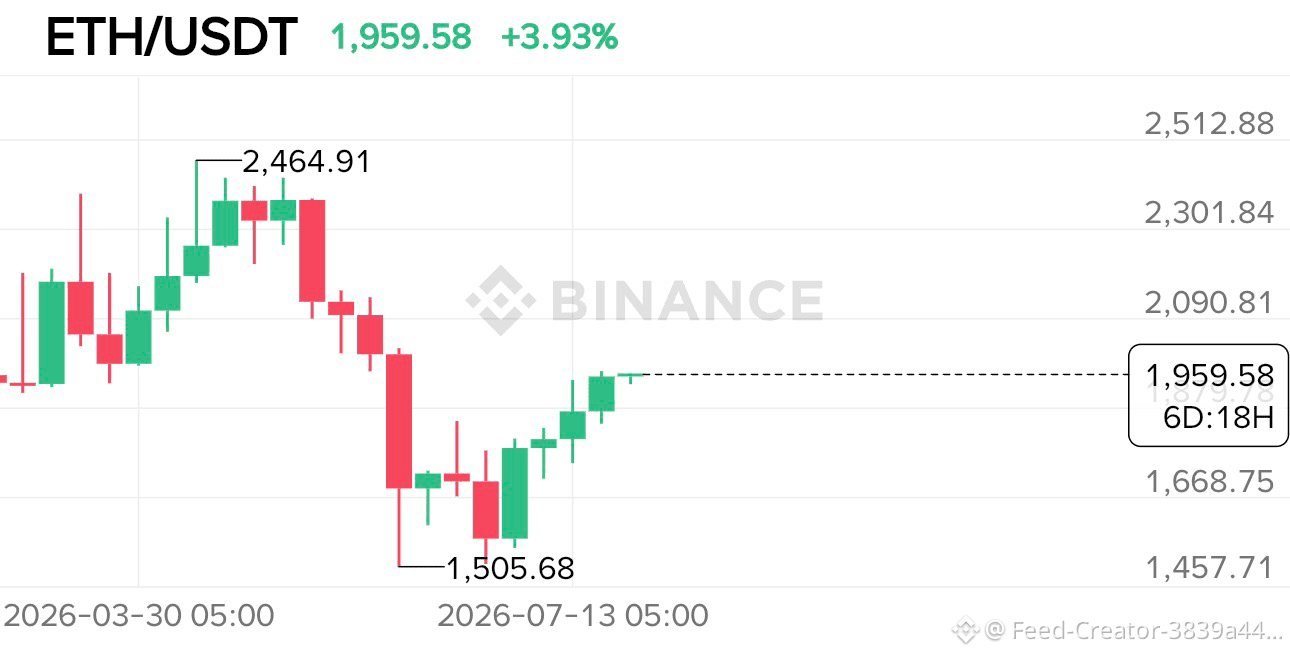
$ETH on Bullish Long Run…..Book Your Next Profit At $2100…the engulf bar pattern is already formed
$ETH on Bullish Long Run…..Book Your Next Profit At $2100…the engulf bar pattern is already formed
67
·
--
Bullisch
Übersetzung ansehen
$ETH On Long Bullish Run Start..Book Your Next Profit At 2100
{spot}(ETHUSDT)
$ETH On Long Bullish Run Start..Book Your Next Profit At 2100
81
Übersetzung ansehen
close 140 very soon
close 140 very soon

Shair Shah
·
--
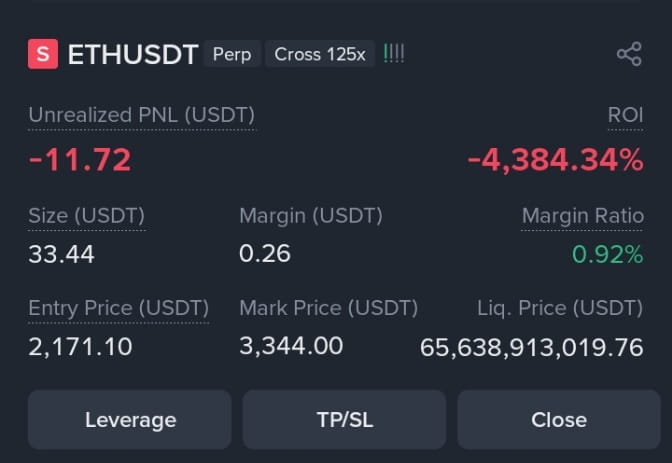
$ETH kurze Position
halten oder schließen? Geben Sie Ihre Meinung ab
halten oder schließen? Geben Sie Ihre Meinung ab
Anmelden und weiter Inhalte entdecken
Krypto-Nutzer weltweit auf Binance Square kennenlernen
⚡️ Bleib in Sachen Krypto stets am Puls.
💬 Die weltgrößte Kryptobörse vertraut darauf.
👍 Erhalte verlässliche Einblicke von verifizierten Creators.
E-Mail-Adresse/Telefonnummer
Trendthemen
HotCPIDecemberHikePriced
3 Aufrufe
59 Kommentare
CPI-Marktüberblick | US-Verbraucherpreise steigen im Oktober um 0,4 % und liegen damit über der Prognose von 0,3 %
Binance News
·8 Likes
·7.1k Aufrufe
AnthropicRejectsIPODelayValuationinQuestion
119,547 Aufrufe
1,151 Kommentare
NvidiaInvestigatesAfterHuang’sAffairApology
359,272 Aufrufe
2,634 Kommentare