
PMSAPRICE
14 Beiträge

PMSAPRICE
Melden
Nutzer blockieren
💸📈💰
9 Following
2 Follower
2 Like gegeben
Beiträge
Alle
Videos
·
--
🎯🔴 NEO/USDT – Mögliches SHORT-Setup | 1-Stunden-Analyse
📊 Marktüberblick
NEO zeigt im 1-Stunden-Zeitrahmen bärischen Druck, wobei die Kursbewegung auf eine mögliche Fortsetzung der Abwärtsbewegung hindeutet.
🎯 Handelsplan
- Richtung: SHORT
- Einstiegszone: $1.585
- Stop-Loss: $1.635
- Take-Profit: $1.470
- Risiko-Ertrags-Verhältnis: ungefähr 1:2.3
🔍 Technischer Ausblick
Der Kurs wird derzeit bei etwa $1.567 gehandelt. Ich beobachte den Widerstandsbereich bei $1.585 auf eine mögliche bärische Zurückweisung.
Ein eindeutiger bärischer Kerzenschluss oder eine Zurückweisung im Einstiegsbereich würde zusätzliche Bestätigung liefern.
🎯
🔴 NEO/USDT – Mögliches SHORT-Setup | 1-Stunden-Analyse
📊 Marktüberblick
NEO zeigt im 1-Stunden-Zeitrahmen bärischen Druck, wobei die Kursbewegung auf eine mögliche Fortsetzung der Abwärtsbewegung hindeutet.
🎯 Handelsplan
- Richtung: SHORT
- Einstiegszone: $1.585
- Stop-Loss: $1.635
- Take-Profit: $1.470
- Risiko-Ertrags-Verhältnis: ungefähr 1:2.3
🔍 Technischer Ausblick
Der Kurs wird derzeit bei etwa $1.567 gehandelt. Ich beobachte den Widerstandsbereich bei $1.585 auf eine mögliche bärische Zurückweisung.
Ein eindeutiger bärischer Kerzenschluss oder eine Zurückweisung im Einstiegsbereich würde zusätzliche Bestätigung liefern.
📊 Marktüberblick
NEO zeigt im 1-Stunden-Zeitrahmen bärischen Druck, wobei die Kursbewegung auf eine mögliche Fortsetzung der Abwärtsbewegung hindeutet.
🎯 Handelsplan
- Richtung: SHORT
- Einstiegszone: $1.585
- Stop-Loss: $1.635
- Take-Profit: $1.470
- Risiko-Ertrags-Verhältnis: ungefähr 1:2.3
🔍 Technischer Ausblick
Der Kurs wird derzeit bei etwa $1.567 gehandelt. Ich beobachte den Widerstandsbereich bei $1.585 auf eine mögliche bärische Zurückweisung.
Ein eindeutiger bärischer Kerzenschluss oder eine Zurückweisung im Einstiegsbereich würde zusätzliche Bestätigung liefern.
140
·
--
Übersetzung ansehen
📈 HOW TO IDENTIFY A MARKET REVERSAL USING CANDLESTICKS
Want to spot market reversals early? Watch these 4 important steps:
1️⃣ Find the Trend: Higher highs and higher lo ws indicate an uptrend. Lower highs and lower lows indicate a downtrend.
2️⃣ Watch Key Zones: Focus on important support, resistance, and previous swing highs/lows.
3️⃣ Wait for Candle Clues: Look for rejection wicks, engulfing candles, and strong candle closes.
4️⃣ Confirm the Break: A bullish reversal needs a break above a key swing high. A bearish reversal needs a break below a key swing low.
📈
#Binace
$BTC $ETH
📈 HOW TO IDENTIFY A MARKET REVERSAL USING CANDLESTICKS
Want to spot market reversals early? Watch these 4 important steps:
1️⃣ Find the Trend: Higher highs and higher lo ws indicate an uptrend. Lower highs and lower lows indicate a downtrend.
2️⃣ Watch Key Zones: Focus on important support, resistance, and previous swing highs/lows.
3️⃣ Wait for Candle Clues: Look for rejection wicks, engulfing candles, and strong candle closes.
4️⃣ Confirm the Break: A bullish reversal needs a break above a key swing high. A bearish reversal needs a break below a key swing low.
📈
#Binace
$BTC $ETH
Want to spot market reversals early? Watch these 4 important steps:
1️⃣ Find the Trend: Higher highs and higher lo ws indicate an uptrend. Lower highs and lower lows indicate a downtrend.
2️⃣ Watch Key Zones: Focus on important support, resistance, and previous swing highs/lows.
3️⃣ Wait for Candle Clues: Look for rejection wicks, engulfing candles, and strong candle closes.
4️⃣ Confirm the Break: A bullish reversal needs a break above a key swing high. A bearish reversal needs a break below a key swing low.
📈
#Binace
$BTC $ETH
72
·
--
Bullisch
Übersetzung ansehen
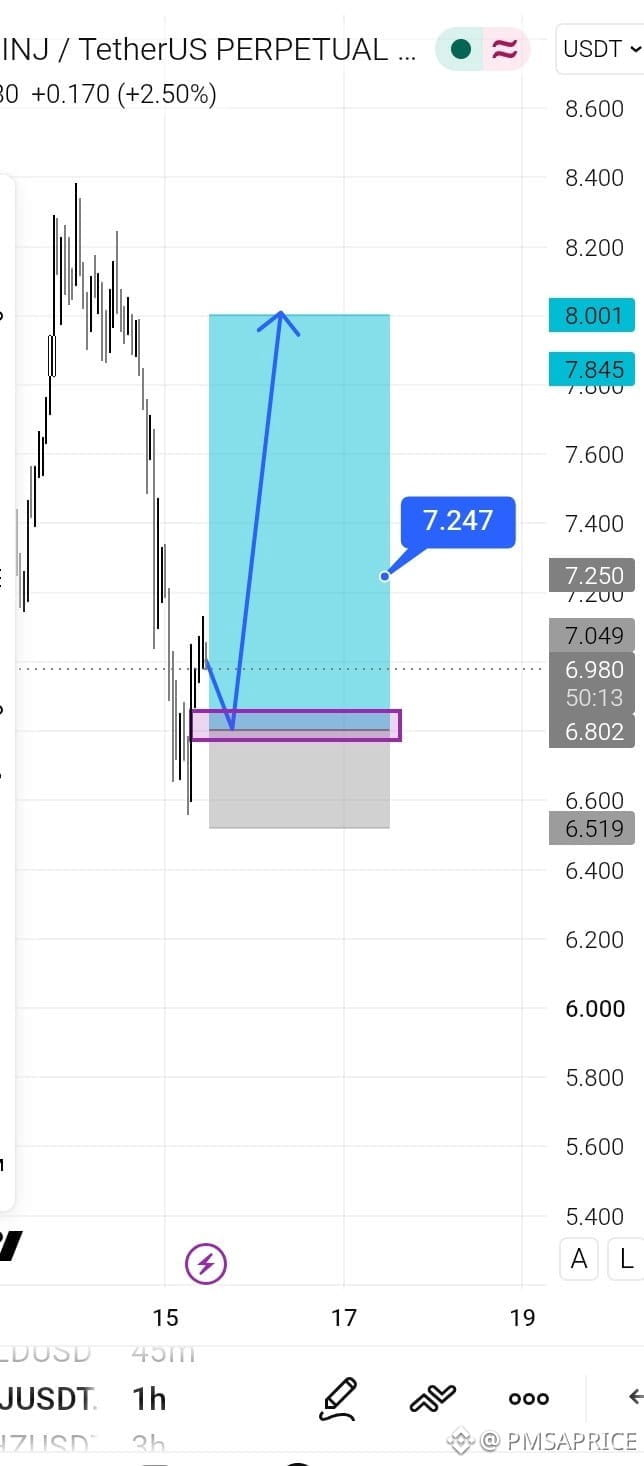
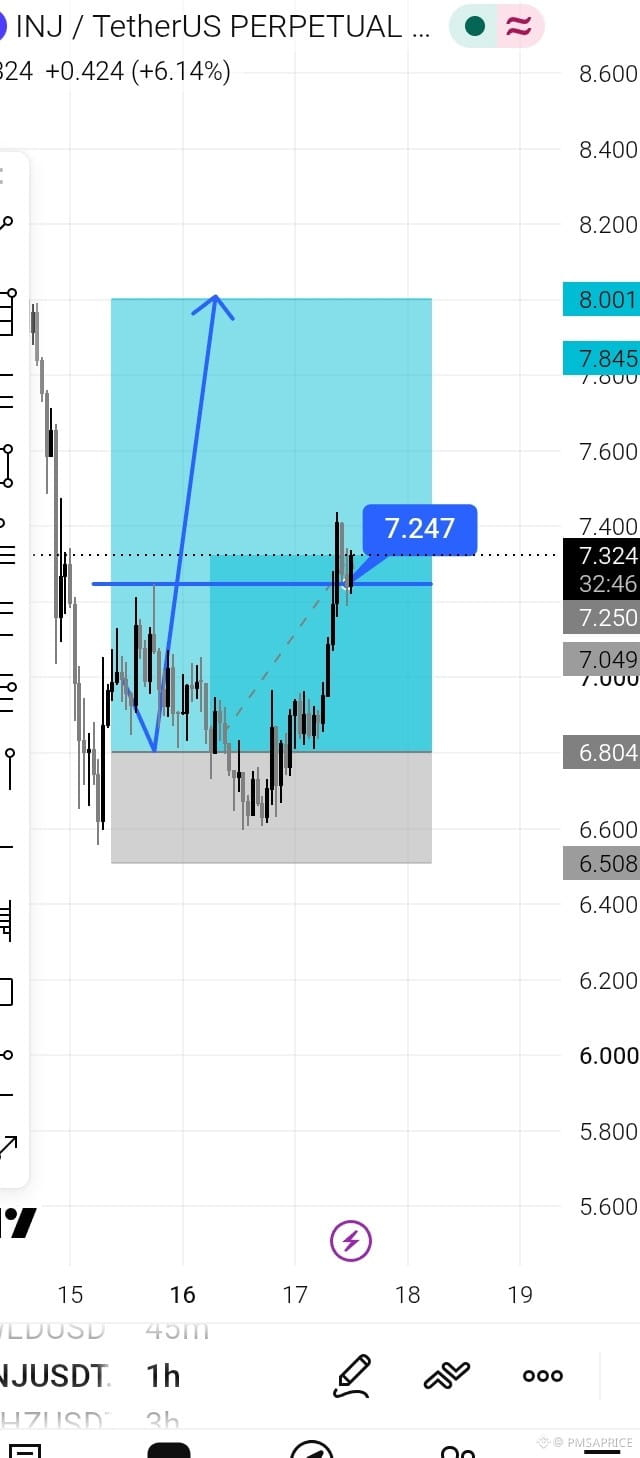
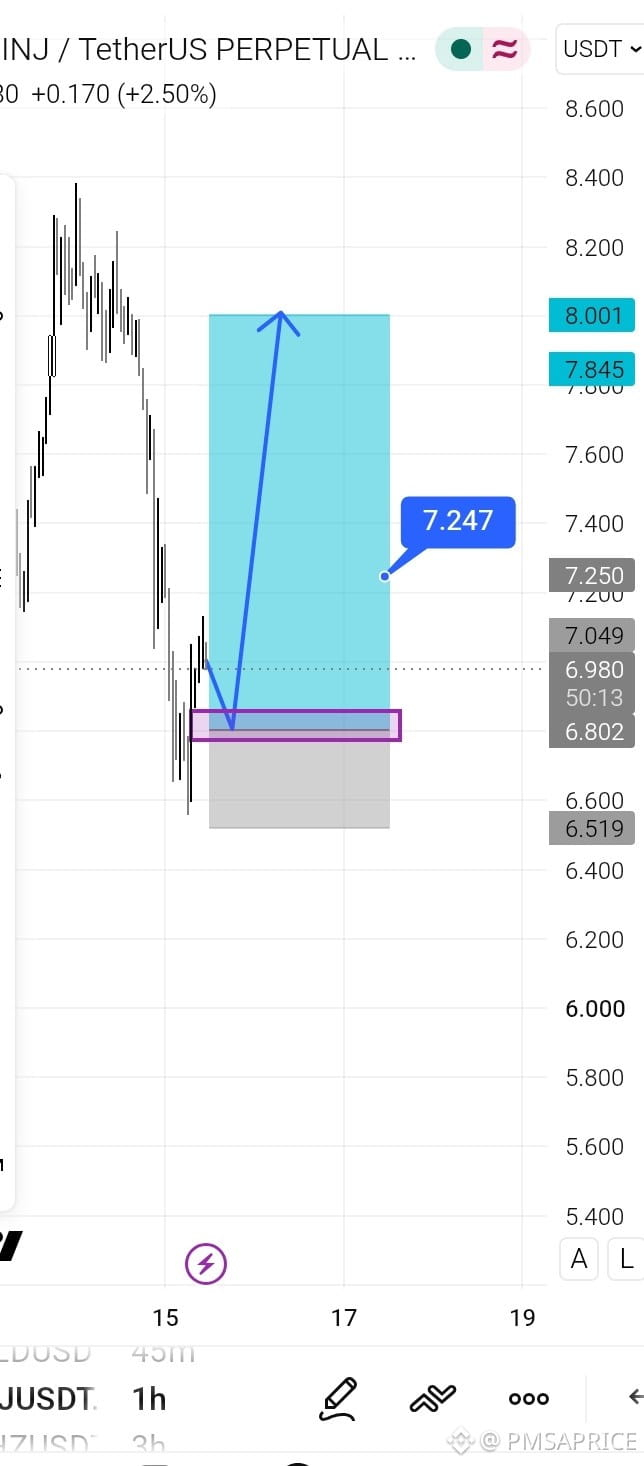
$INJ 📈✅
HTF trend is still bearish, so manage risk properly and move SL to breakeven after TP1.
#BitcoinActiveSupplyInProfitDropsBelow45% #WhatWillDriveCryptoandStocks’NextRebound?
$INJ 📈✅
HTF trend is still bearish, so manage risk properly and move SL to breakeven after TP1.
#BitcoinActiveSupplyInProfitDropsBelow45% #WhatWillDriveCryptoandStocks’NextRebound?
HTF trend is still bearish, so manage risk properly and move SL to breakeven after TP1.
#BitcoinActiveSupplyInProfitDropsBelow45% #WhatWillDriveCryptoandStocks’NextRebound?
150
·
--
Übersetzung ansehen
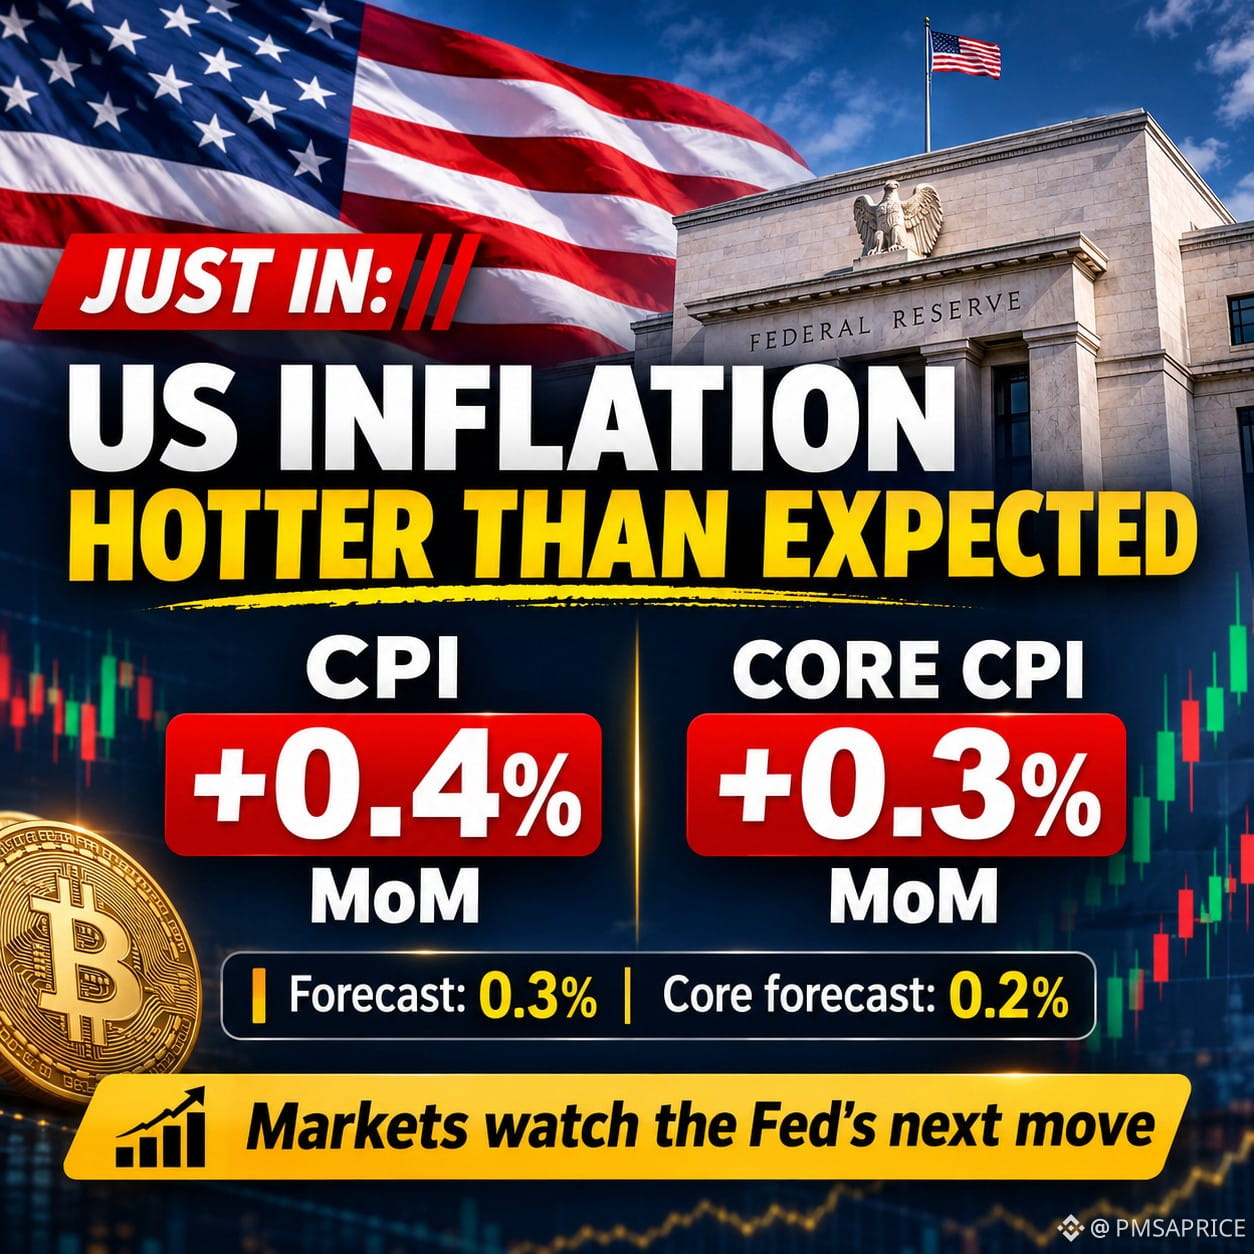
🇺🇸 JUST IN: US CPI rises 0.4% month over month in October, above the 0.3% estimate.
Core CPI rises 0.3%, above the 0.2% estimate and matching September’s pace.
#HotCPIDecemberHikePriced #AnthropicRejectsIPODelayValuationinQuestion #CanNvidiaEarningsEaseMarketConcerns?
🇺🇸 JUST IN: US CPI rises 0.4% month over month in October, above the 0.3% estimate.
Core CPI rises 0.3%, above the 0.2% estimate and matching September’s pace.
#HotCPIDecemberHikePriced #AnthropicRejectsIPODelayValuationinQuestion #CanNvidiaEarningsEaseMarketConcerns?
Core CPI rises 0.3%, above the 0.2% estimate and matching September’s pace.
#HotCPIDecemberHikePriced #AnthropicRejectsIPODelayValuationinQuestion #CanNvidiaEarningsEaseMarketConcerns?
68
·
--
Übersetzung ansehen
🚨
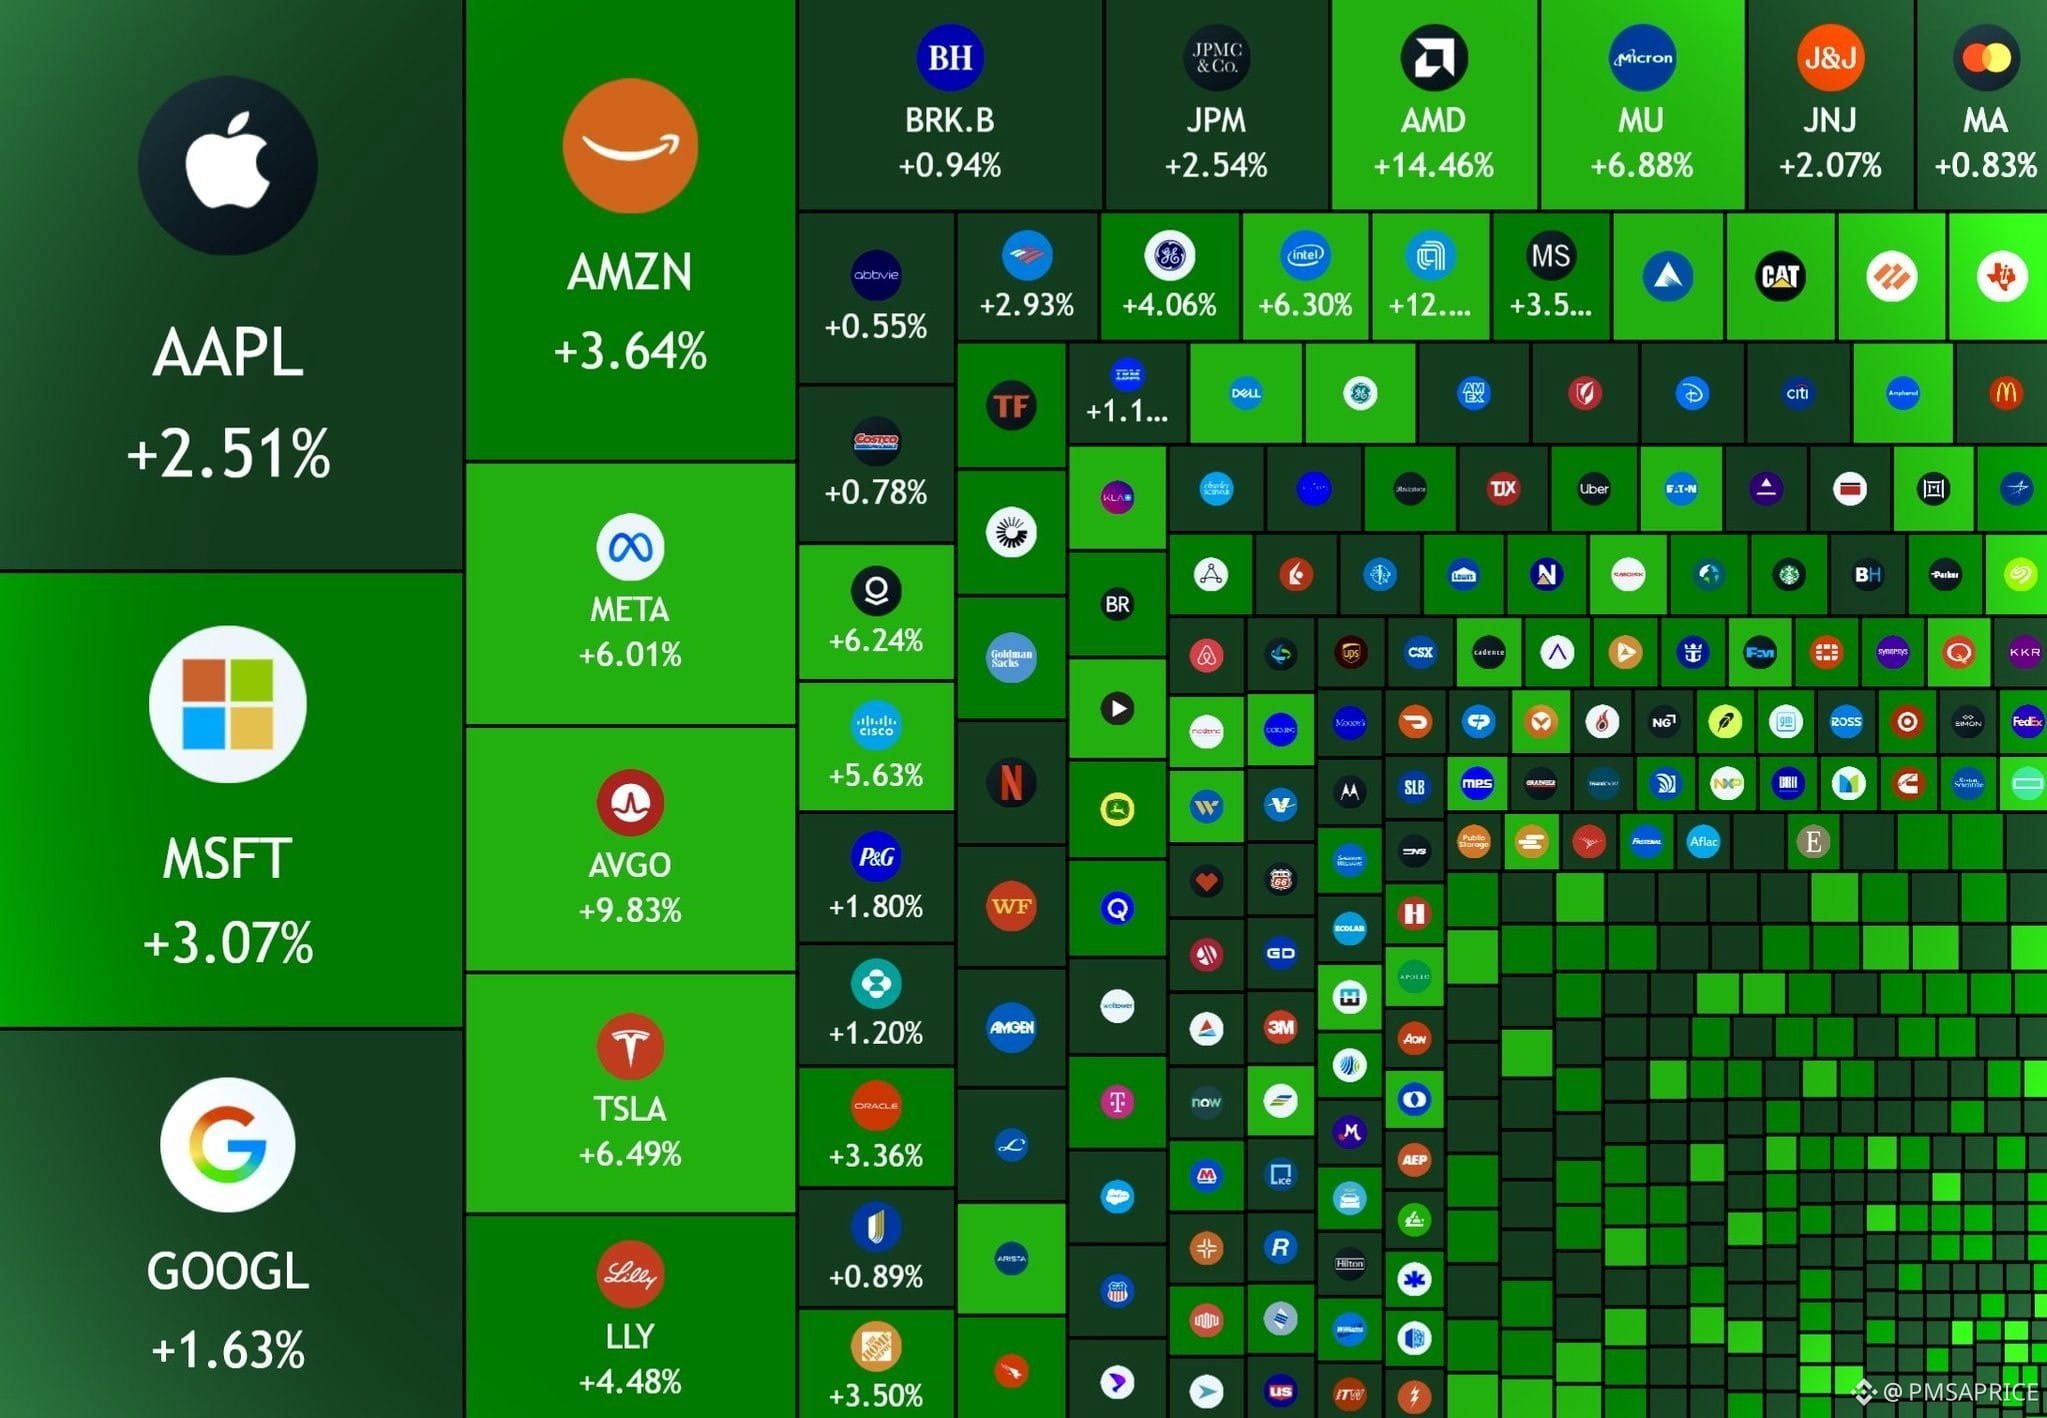
JUST IN: 🇺🇸 $2 trillion added to the US stock market today.#AnthropicRejectsIPODelayValuationinQuestion
🚨
JUST IN: 🇺🇸 $2 trillion added to the US stock market today.#AnthropicRejectsIPODelayValuationinQuestion
JUST IN: 🇺🇸 $2 trillion added to the US stock market today.#AnthropicRejectsIPODelayValuationinQuestion
81
·
--
Übersetzung ansehen
81
·
--
Bärisch
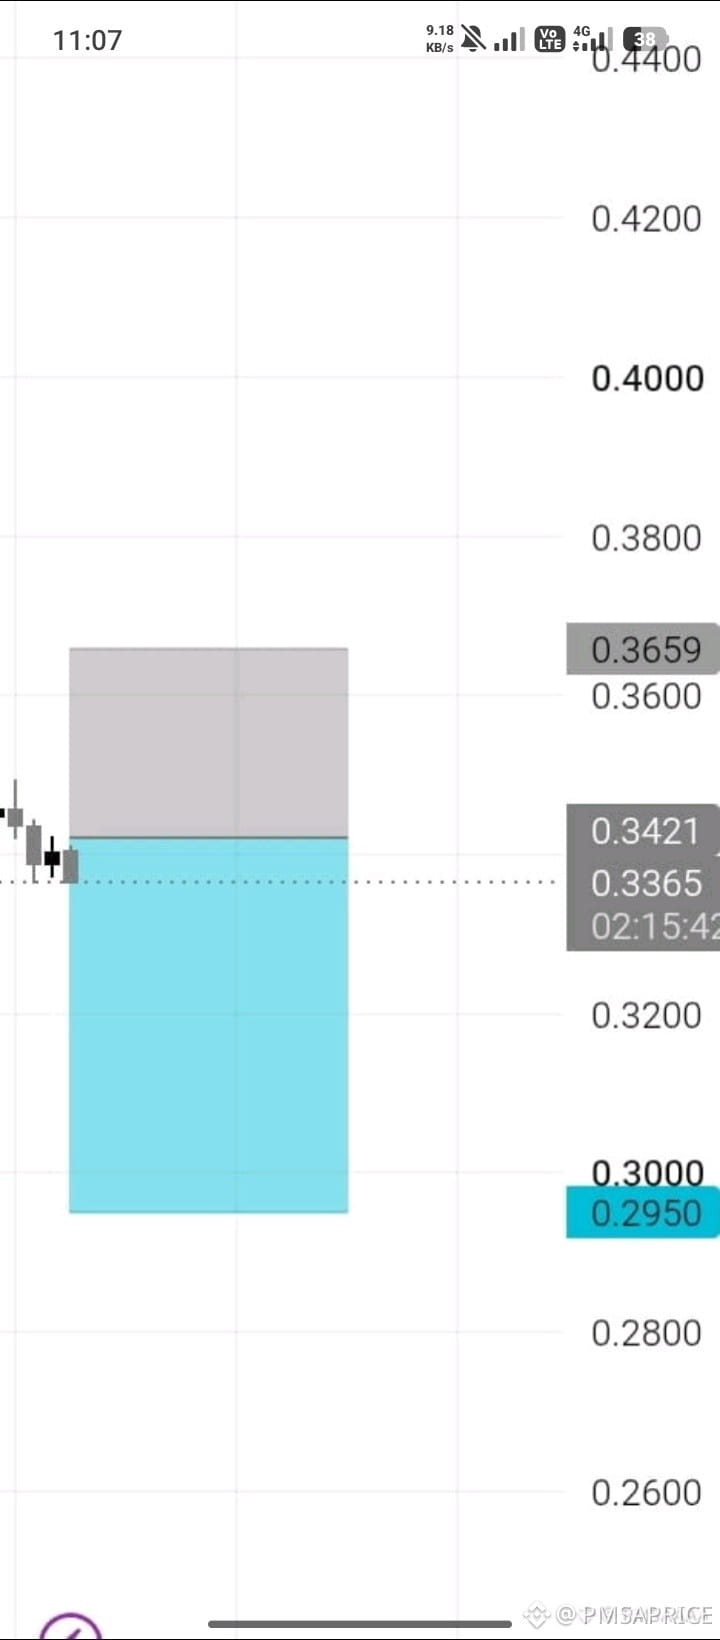
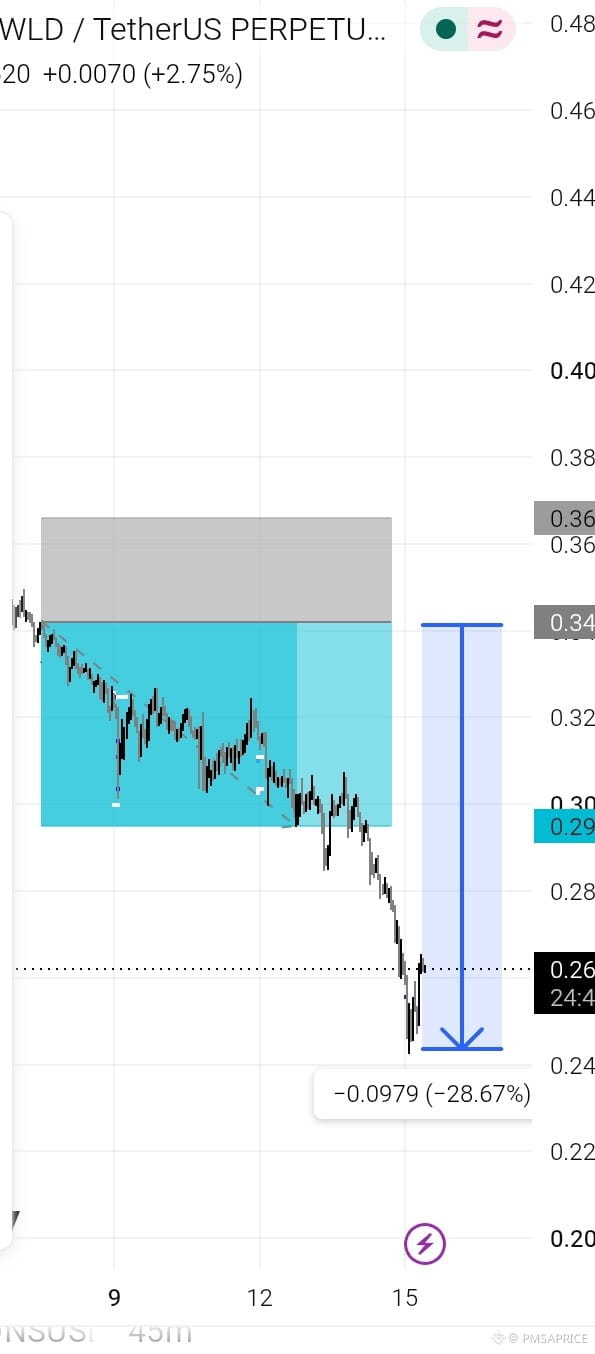
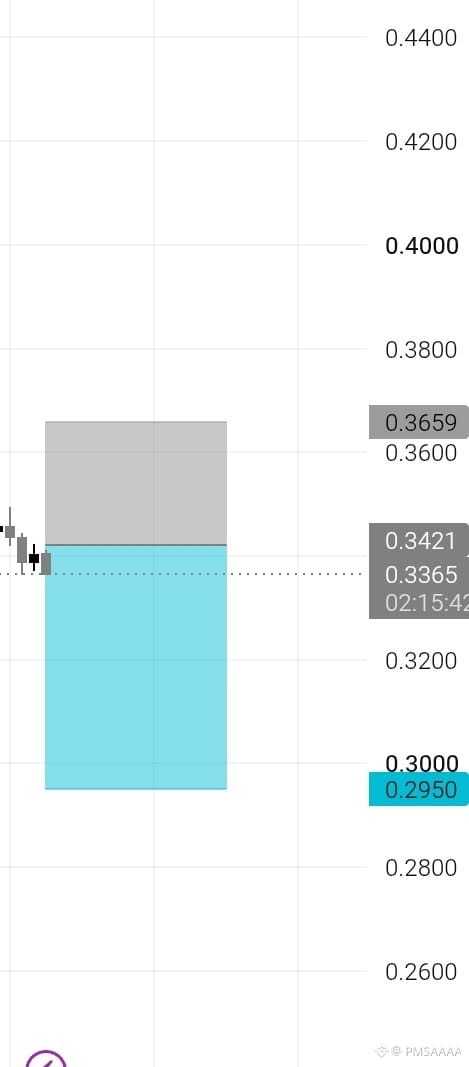
$WLD 🎯 Einstiegsstrategie:
Warte, bis der Preis in die Zone von $0.3450–$0.3520 zurückfällt.
Achte im 1-Stunden-Zeitrahmen auf eine bärische Zurückweisungskerze.
Erwäge einen SHORT-Einstieg erst nach einer bärischen Bestätigung. 📉🔥
{spot}(WLDUSDT)
$WLD 🎯 Einstiegsstrategie:
Warte, bis der Preis in die Zone von $0.3450–$0.3520 zurückfällt.
Achte im 1-Stunden-Zeitrahmen auf eine bärische Zurückweisungskerze.
Erwäge einen SHORT-Einstieg erst nach einer bärischen Bestätigung. 📉🔥
Warte, bis der Preis in die Zone von $0.3450–$0.3520 zurückfällt.
Achte im 1-Stunden-Zeitrahmen auf eine bärische Zurückweisungskerze.
Erwäge einen SHORT-Einstieg erst nach einer bärischen Bestätigung. 📉🔥
723

·
--
Artikel
Übersetzung ansehen
👀💰🪙AIN/USDT is making a huge move!
AIN/USDT has suddenly attracted strong market attention after a powerful move on the 4H chart. 📈
At the time of the chart snapshot:
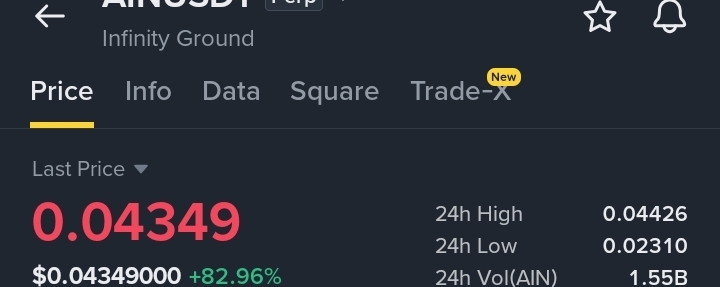
💰 Price: $0.04349
📈 24H Change: +82.96%
🔺 24H High: $0.04426
🔻 24H Low: $0.02310
📊 24H Volume: ~$53.27M USDT
One of the biggest things standing out is the massive volume spike accompanying the price move. 🚀 This suggests that market activity has increased significantly compared with the previous candles.
The 4H chart also shows price moving far above the recent consolidation area around $0.02–$0.03, creating a very strong breakout-style move.
⚠️ However, after such a rapid increase, volatility can be extremely high. Traders should watch how price behaves around the recent high and whether the market can maintain the momentum.
👀 Key levels to watch:
🔹 $0.04426 — recent high
🔹 $0.0435 — current area
🔹 $0.039 — nearby psychological/technical area
🔹 $0.029–$0.030 — previous breakout region
📌 Remember: A huge green candle doesn't automatically mean price will continue straight up. Confirmation, volume, and risk management are important.
🔥 AIN/USDT is definitely a pair worth watching right now.
$AIN
{future}(AINUSDT)
👀💰🪙
AIN/USDT is making a huge move!
AIN/USDT has suddenly attracted strong market attention after a powerful move on the 4H chart. 📈
At the time of the chart snapshot:
💰 Price: $0.04349
📈 24H Change: +82.96%
🔺 24H High: $0.04426
🔻 24H Low: $0.02310
📊 24H Volume: ~$53.27M USDT
One of the biggest things standing out is the massive volume spike accompanying the price move. 🚀 This suggests that market activity has increased significantly compared with the previous candles.
The 4H chart also shows price moving far above the recent consolidation area around $0.02–$0.03, creating a very strong breakout-style move.
⚠️ However, after such a rapid increase, volatility can be extremely high. Traders should watch how price behaves around the recent high and whether the market can maintain the momentum.
👀 Key levels to watch:
🔹 $0.04426 — recent high
🔹 $0.0435 — current area
🔹 $0.039 — nearby psychological/technical area
🔹 $0.029–$0.030 — previous breakout region
📌 Remember: A huge green candle doesn't automatically mean price will continue straight up. Confirmation, volume, and risk management are important.
🔥 AIN/USDT is definitely a pair worth watching right now.
$AIN
AIN/USDT has suddenly attracted strong market attention after a powerful move on the 4H chart. 📈
At the time of the chart snapshot:
💰 Price: $0.04349
📈 24H Change: +82.96%
🔺 24H High: $0.04426
🔻 24H Low: $0.02310
📊 24H Volume: ~$53.27M USDT
One of the biggest things standing out is the massive volume spike accompanying the price move. 🚀 This suggests that market activity has increased significantly compared with the previous candles.
The 4H chart also shows price moving far above the recent consolidation area around $0.02–$0.03, creating a very strong breakout-style move.
⚠️ However, after such a rapid increase, volatility can be extremely high. Traders should watch how price behaves around the recent high and whether the market can maintain the momentum.
👀 Key levels to watch:
🔹 $0.04426 — recent high
🔹 $0.0435 — current area
🔹 $0.039 — nearby psychological/technical area
🔹 $0.029–$0.030 — previous breakout region
📌 Remember: A huge green candle doesn't automatically mean price will continue straight up. Confirmation, volume, and risk management are important.
🔥 AIN/USDT is definitely a pair worth watching right now.
$AIN
349
·
--
Artikel
CT/USDT 4H-Analyse — Wichtige Levels im Blick 👀📊
🔥 CT/USDT zeigt eine starke Volatilität,CT/USDT 4H-Analyse — Wichtige Levels im Blick 👀📊
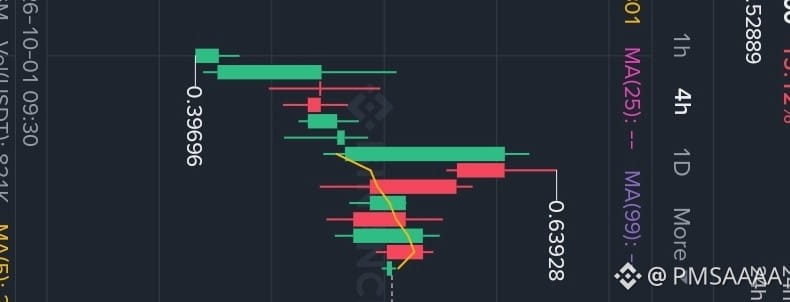
🔥 CT/USDT zeigt eine starke Volatilität: Der Kurs machte von etwa $0.3969 einen kraftvollen Move bis zu einem jüngsten Hoch nahe $0.6393.
Derzeit wird CT bei etwa $0.5288 gehandelt, nachdem es einen deutlichen Rücksetzer vom jüngsten Hoch gegeben hat. 📉
📊 4H-Chart-Struktur
Der Chart zeigt einen starken bullishen Move, gefolgt von einer Korrektur und einer Konsolidierungsphase. 🔄
📍 Aktueller Preis: ~$0.529
🟢 Unterstützung: $0.48
🟡 Widerstand: $0.55–$0.60
🔴 Wichtiger Widerstand: $0.625–$0.639
CT/USDT 4H-Analyse — Wichtige Levels im Blick 👀📊 🔥 CT/USDT zeigt eine starke Volatilität,
CT/USDT 4H-Analyse — Wichtige Levels im Blick 👀📊
🔥 CT/USDT zeigt eine starke Volatilität: Der Kurs machte von etwa $0.3969 einen kraftvollen Move bis zu einem jüngsten Hoch nahe $0.6393.
Derzeit wird CT bei etwa $0.5288 gehandelt, nachdem es einen deutlichen Rücksetzer vom jüngsten Hoch gegeben hat. 📉
📊 4H-Chart-Struktur
Der Chart zeigt einen starken bullishen Move, gefolgt von einer Korrektur und einer Konsolidierungsphase. 🔄
📍 Aktueller Preis: ~$0.529
🟢 Unterstützung: $0.48
🟡 Widerstand: $0.55–$0.60
🔴 Wichtiger Widerstand: $0.625–$0.639
🔥 CT/USDT zeigt eine starke Volatilität: Der Kurs machte von etwa $0.3969 einen kraftvollen Move bis zu einem jüngsten Hoch nahe $0.6393.
Derzeit wird CT bei etwa $0.5288 gehandelt, nachdem es einen deutlichen Rücksetzer vom jüngsten Hoch gegeben hat. 📉
📊 4H-Chart-Struktur
Der Chart zeigt einen starken bullishen Move, gefolgt von einer Korrektur und einer Konsolidierungsphase. 🔄
📍 Aktueller Preis: ~$0.529
🟢 Unterstützung: $0.48
🟡 Widerstand: $0.55–$0.60
🔴 Wichtiger Widerstand: $0.625–$0.639
1
618
Anmelden und weiter Inhalte entdecken
Krypto-Nutzer weltweit auf Binance Square kennenlernen
⚡️ Bleib in Sachen Krypto stets am Puls.
💬 Die weltgrößte Kryptobörse vertraut darauf.
👍 Erhalte verlässliche Einblicke von verifizierten Creators.
E-Mail-Adresse/Telefonnummer
Trendthemen
CanBTCReboundAfterFallingBelow60K?
0 Aufrufe
404 Kommentare
Bitcoin-News | Bitcoin fällt erstmals seit Juli unter 60.000 US-Dollar, während IBIT einen Rekordabfluss von 541 Millionen US-Dollar verzeichnet
Binance News
·33 Likes
·57.9k Aufrufe
GlobalStocksFaceLongestLosingStreakSince2023
0 Aufrufe
439 Kommentare
AnthropicPlungesTowardIPOPriceonDay2
0 Aufrufe
148 Kommentare