

tam00000000090000
17 Beiträge

tam00000000090000
Melden
Nutzer blockieren
money making people is powerful people on our world
Trade eröffnen
Gelegenheitstrader
4.4 Jahre
11 Following
3 Follower
0 Like gegeben
Beiträge
Portfolio
Alle
Zitierungen

Artikel
Übersetzung ansehen
#BITCOIN #ETH #CRYPTO MARKET #GOLD #SILVER🚨 Crypto vs. Metals: A Clear Market Split
Since the U.S.–Iran conflict began, crypto has recovered strongly while gold and silver have fallen. But the move is not simply “war = crypto bullish, metals bearish.”
📈 Bitcoin: ~+$19K from ~$67K to ~$86K
📈 Ethereum: ~+40%
📈 Total crypto market: ~+26%
📉 Gold: ~−19%
📉 Silver: ~−34%
Stocks also gained, suggesting broader risk-on sentiment. Meanwhile, changing interest-rate expectations have added pressure to non-yielding metals.
Bottom line: The war marks the timeline, but rates, liquidity, and broader risk appetite are also major drivers.
✅ Follow for more market analysis.
$BTC
{future}(BTCUSDT)
$ETH
{future}(ETHUSDT)
$GOLD.US
{stock_us}(GOLD.US)
#ETHUp70%InQ3ButLiquidityFalls #BinanceLaunchesBinanceIntelligence #EvernorthXRPTreasuryCompletesSPACMerger #FedOctoberHoldOdds82.3% #EthStakingExitQueueHits2026High
#BITCOIN #ETH #CRYPTO MARKET #GOLD #SILVER
🚨 Crypto vs. Metals: A Clear Market Split
Since the U.S.–Iran conflict began, crypto has recovered strongly while gold and silver have fallen. But the move is not simply “war = crypto bullish, metals bearish.”
📈 Bitcoin: ~+$19K from ~$67K to ~$86K
📈 Ethereum: ~+40%
📈 Total crypto market: ~+26%
📉 Gold: ~−19%
📉 Silver: ~−34%
Stocks also gained, suggesting broader risk-on sentiment. Meanwhile, changing interest-rate expectations have added pressure to non-yielding metals.
Bottom line: The war marks the timeline, but rates, liquidity, and broader risk appetite are also major drivers.
✅ Follow for more market analysis.
$BTC
$ETH
$GOLD.US
#ETHUp70%InQ3ButLiquidityFalls #BinanceLaunchesBinanceIntelligence #EvernorthXRPTreasuryCompletesSPACMerger #FedOctoberHoldOdds82.3% #EthStakingExitQueueHits2026High
Since the U.S.–Iran conflict began, crypto has recovered strongly while gold and silver have fallen. But the move is not simply “war = crypto bullish, metals bearish.”
📈 Bitcoin: ~+$19K from ~$67K to ~$86K
📈 Ethereum: ~+40%
📈 Total crypto market: ~+26%
📉 Gold: ~−19%
📉 Silver: ~−34%
Stocks also gained, suggesting broader risk-on sentiment. Meanwhile, changing interest-rate expectations have added pressure to non-yielding metals.
Bottom line: The war marks the timeline, but rates, liquidity, and broader risk appetite are also major drivers.
✅ Follow for more market analysis.
$BTC
$ETH
$GOLD.US
#ETHUp70%InQ3ButLiquidityFalls #BinanceLaunchesBinanceIntelligence #EvernorthXRPTreasuryCompletesSPACMerger #FedOctoberHoldOdds82.3% #EthStakingExitQueueHits2026High
124

Artikel
Übersetzung ansehen
#SOL🟣 Solana (SOL) — Today
SOL is trading around $120–$122 and is consolidating near recent highs. The key area is $124–$125 resistance; a confirmed breakout could improve bullish momentum, while $117–$119 is an important support area.
Key levels:
• Resistance: $124–$125
• Support: $117–$119
• Bigger upside area: ~$130–$148
Educational market commentary, not financial advice.
$SOL
{future}(SOLUSDT)
#BinanceLaunchesBinanceIntelligence #BitcoinTargets2026OpenAt$87570 #ETHUp70%InQ3ButLiquidityFalls #EvernorthXRPTreasuryCompletesSPACMerger #StriveBuys2000BTCFor$169M
#SOL
🟣 Solana (SOL) — Today
SOL is trading around $120–$122 and is consolidating near recent highs. The key area is $124–$125 resistance; a confirmed breakout could improve bullish momentum, while $117–$119 is an important support area.
Key levels:
• Resistance: $124–$125
• Support: $117–$119
• Bigger upside area: ~$130–$148
Educational market commentary, not financial advice.
$SOL
#BinanceLaunchesBinanceIntelligence #BitcoinTargets2026OpenAt$87570 #ETHUp70%InQ3ButLiquidityFalls #EvernorthXRPTreasuryCompletesSPACMerger #StriveBuys2000BTCFor$169M
SOL is trading around $120–$122 and is consolidating near recent highs. The key area is $124–$125 resistance; a confirmed breakout could improve bullish momentum, while $117–$119 is an important support area.
Key levels:
• Resistance: $124–$125
• Support: $117–$119
• Bigger upside area: ~$130–$148
Educational market commentary, not financial advice.
$SOL
#BinanceLaunchesBinanceIntelligence #BitcoinTargets2026OpenAt$87570 #ETHUp70%InQ3ButLiquidityFalls #EvernorthXRPTreasuryCompletesSPACMerger #StriveBuys2000BTCFor$169M
42

Artikel
#RTH🔵 Ethereum (ETH) — Heute
ETH wird bei etwa $2,7K gehandelt. Der Kurs konsolidiert derzeit unter dem wichtigen Widerstand bei $2,8K. Ein anhaltender Ausbruch über $2,8K könnte die bullische Struktur stärken, während $2,4K–$2,5K eine wichtige übergeordnete Unterstützungszone bleibt.
Wichtige Niveaus:
• Widerstand: $2,8K
• Unterstützung: $2,4K–$2,5K
• Größerer potenzieller Aufwärtsbereich: ca. $3K
ETH befindet sich in einer entscheidenden Zone – Bestätigung ist wichtiger als Vorhersage. 📊
Informative Marktkommentare, keine Finanzberatung.
$ETH #BinanceLaunchesBinanceIntelligence #BitcoinTargets2026OpenAt$87570 #BitcoinRejectedAt$87KThirdTime #StrategyMarketCapSurpassesRumble #StriveBuys2000BTCFor$169M
#RTH
🔵 Ethereum (ETH) — Heute
ETH wird bei etwa $2,7K gehandelt. Der Kurs konsolidiert derzeit unter dem wichtigen Widerstand bei $2,8K. Ein anhaltender Ausbruch über $2,8K könnte die bullische Struktur stärken, während $2,4K–$2,5K eine wichtige übergeordnete Unterstützungszone bleibt.
Wichtige Niveaus:
• Widerstand: $2,8K
• Unterstützung: $2,4K–$2,5K
• Größerer potenzieller Aufwärtsbereich: ca. $3K
ETH befindet sich in einer entscheidenden Zone – Bestätigung ist wichtiger als Vorhersage. 📊
Informative Marktkommentare, keine Finanzberatung.
$ETH #BinanceLaunchesBinanceIntelligence #BitcoinTargets2026OpenAt$87570 #BitcoinRejectedAt$87KThirdTime #StrategyMarketCapSurpassesRumble #StriveBuys2000BTCFor$169M
ETH wird bei etwa $2,7K gehandelt. Der Kurs konsolidiert derzeit unter dem wichtigen Widerstand bei $2,8K. Ein anhaltender Ausbruch über $2,8K könnte die bullische Struktur stärken, während $2,4K–$2,5K eine wichtige übergeordnete Unterstützungszone bleibt.
Wichtige Niveaus:
• Widerstand: $2,8K
• Unterstützung: $2,4K–$2,5K
• Größerer potenzieller Aufwärtsbereich: ca. $3K
ETH befindet sich in einer entscheidenden Zone – Bestätigung ist wichtiger als Vorhersage. 📊
Informative Marktkommentare, keine Finanzberatung.
$ETH #BinanceLaunchesBinanceIntelligence #BitcoinTargets2026OpenAt$87570 #BitcoinRejectedAt$87KThirdTime #StrategyMarketCapSurpassesRumble #StriveBuys2000BTCFor$169M
61
#Bitcoin🟠 Bitcoin (BTC) — Heute
Bitcoin wird bei etwa 85.600 $ gehandelt und liegt weiterhin unter dem wichtigen Widerstand bei 87.000 $, an dem der Kurs zuletzt mehrmals abgeprallt ist.
Wichtige Marken:
• Widerstand: 87.000 $
• Aktueller Bereich: ca. 85.600 $
• Achte auf einen klaren Ausbruch nach oben oder unten.
Die nächste bestätigte Bewegung von BTC könnte die Richtung für den gesamten Kryptomarkt vorgeben. 📊
#BinanceLaunchesBinanceIntelligence #BitcoinTargets2026OpenAt$87570 #BitcoinRejectedAt$87KThirdTime #StrategyMarketCapSurpassesRumble <t-65/>#StriveBuys2000BTCFor$169M $BTC
#Bitcoin
🟠 Bitcoin (BTC) — Heute
Bitcoin wird bei etwa 85.600 $ gehandelt und liegt weiterhin unter dem wichtigen Widerstand bei 87.000 $, an dem der Kurs zuletzt mehrmals abgeprallt ist.
Wichtige Marken:
• Widerstand: 87.000 $
• Aktueller Bereich: ca. 85.600 $
• Achte auf einen klaren Ausbruch nach oben oder unten.
Die nächste bestätigte Bewegung von BTC könnte die Richtung für den gesamten Kryptomarkt vorgeben. 📊
#BinanceLaunchesBinanceIntelligence #BitcoinTargets2026OpenAt$87570 #BitcoinRejectedAt$87KThirdTime #StrategyMarketCapSurpassesRumble <t-65/>#StriveBuys2000BTCFor$169M $BTC
Bitcoin wird bei etwa 85.600 $ gehandelt und liegt weiterhin unter dem wichtigen Widerstand bei 87.000 $, an dem der Kurs zuletzt mehrmals abgeprallt ist.
Wichtige Marken:
• Widerstand: 87.000 $
• Aktueller Bereich: ca. 85.600 $
• Achte auf einen klaren Ausbruch nach oben oder unten.
Die nächste bestätigte Bewegung von BTC könnte die Richtung für den gesamten Kryptomarkt vorgeben. 📊
#BinanceLaunchesBinanceIntelligence #BitcoinTargets2026OpenAt$87570 #BitcoinRejectedAt$87KThirdTime #StrategyMarketCapSurpassesRumble <t-65/>#StriveBuys2000BTCFor$169M $BTC
91

Artikel
Übersetzung ansehen
#ETH🔵 Ethereum (ETH) — Market Outlook
Ethereum remains a major focus in the crypto market. After recent volatility, ETH is watching for a clear breakout or breakdown from its current range.
Key focus:
• Resistance → recent swing high
• Support → recent consolidation zone
• Breakout above resistance → stronger bullish momentum
• Loss of support → increased downside pressure
For now, confirmation is more important than prediction. ETH’s next major move could also influence many altcoins. 📊
Educational market commentary, not financial advice.
#ADAGains10%Above$0.27 #ETHUp70%InQ3ButLiquidityFalls #EthStakingExitQueueHits2026High $ETH
{spot}(ETHUSDT)
#Nikkei225Jumps2.5%ToThreeMonthHigh #FedOctoberHoldOdds82.3%
#ETH
🔵 Ethereum (ETH) — Market Outlook
Ethereum remains a major focus in the crypto market. After recent volatility, ETH is watching for a clear breakout or breakdown from its current range.
Key focus:
• Resistance → recent swing high
• Support → recent consolidation zone
• Breakout above resistance → stronger bullish momentum
• Loss of support → increased downside pressure
For now, confirmation is more important than prediction. ETH’s next major move could also influence many altcoins. 📊
Educational market commentary, not financial advice.
#ADAGains10%Above$0.27 #ETHUp70%InQ3ButLiquidityFalls #EthStakingExitQueueHits2026High $ETH
#Nikkei225Jumps2.5%ToThreeMonthHigh #FedOctoberHoldOdds82.3%
Ethereum remains a major focus in the crypto market. After recent volatility, ETH is watching for a clear breakout or breakdown from its current range.
Key focus:
• Resistance → recent swing high
• Support → recent consolidation zone
• Breakout above resistance → stronger bullish momentum
• Loss of support → increased downside pressure
For now, confirmation is more important than prediction. ETH’s next major move could also influence many altcoins. 📊
Educational market commentary, not financial advice.
#ADAGains10%Above$0.27 #ETHUp70%InQ3ButLiquidityFalls #EthStakingExitQueueHits2026High $ETH
#Nikkei225Jumps2.5%ToThreeMonthHigh #FedOctoberHoldOdds82.3%
24

Artikel
Übersetzung ansehen
#Bitcoin🟠 Bitcoin (BTC) — Market Outlook
Bitcoin remains one of the market’s biggest drivers. After recent volatility, traders are watching whether BTC can regain bullish momentum and establish a stronger trend.
Key focus:
• Resistance → recent swing high
• Support → recent consolidation zone
• Breakout above resistance → could strengthen bullish sentiment
• Loss of support → could increase downside pressure
For now, confirmation matters more than prediction. BTC’s next major move will likely influence the wider crypto market. 📊
Educational market commentary, not financial advice.
#ADAGains10%Above$0.27 #ETHUp70%InQ3ButLiquidityFalls #EthStakingExitQueueHits2026High #FedOctoberHoldOdds82.3% #Nikkei225Jumps2.5%ToThreeMonthHigh
#Bitcoin
🟠 Bitcoin (BTC) — Market Outlook
Bitcoin remains one of the market’s biggest drivers. After recent volatility, traders are watching whether BTC can regain bullish momentum and establish a stronger trend.
Key focus:
• Resistance → recent swing high
• Support → recent consolidation zone
• Breakout above resistance → could strengthen bullish sentiment
• Loss of support → could increase downside pressure
For now, confirmation matters more than prediction. BTC’s next major move will likely influence the wider crypto market. 📊
Educational market commentary, not financial advice.
#ADAGains10%Above$0.27 #ETHUp70%InQ3ButLiquidityFalls #EthStakingExitQueueHits2026High #FedOctoberHoldOdds82.3% #Nikkei225Jumps2.5%ToThreeMonthHigh
Bitcoin remains one of the market’s biggest drivers. After recent volatility, traders are watching whether BTC can regain bullish momentum and establish a stronger trend.
Key focus:
• Resistance → recent swing high
• Support → recent consolidation zone
• Breakout above resistance → could strengthen bullish sentiment
• Loss of support → could increase downside pressure
For now, confirmation matters more than prediction. BTC’s next major move will likely influence the wider crypto market. 📊
Educational market commentary, not financial advice.
#ADAGains10%Above$0.27 #ETHUp70%InQ3ButLiquidityFalls #EthStakingExitQueueHits2026High #FedOctoberHoldOdds82.3% #Nikkei225Jumps2.5%ToThreeMonthHigh
64
Übersetzung ansehen
#ZEC/USDT$ZEC ZEC is around $1,315–$1,320 right now. It recently ran to roughly $1,686, then corrected sharply.
$1,800 ───────────────── 🎯 Possible upside target
↑
$1,686 ─────────────── Recent major high
│
$1,450 ──────────────── Resistance
│
$1,400 ──────────────── Recovery level
│
$1,315 ──────────────── CURRENT AREA
│
$1,280 ──────────────── Key support
│
$1,150–1,200 ───────── Deeper support
🟢 Bullish case
The first thing bulls need is a recovery above roughly $1,400–$1,450. Current technical analysis also identifies that region as the first major recovery zone.
If ZEC eventually breaks the previous ~$1,686 high, then $1,800 becomes a much more reasonable potential target to discuss.
But $1,800 is not confirmed just because price is currently near $1,300.
🔴 Bearish case
The key area I'm watching is around $1,280–$1,330.
A decisive break below ~$1,280 would weaken the current recovery structure and could expose roughly $1,150–$1,200.
📰 Fundamental catalyst
There is also a real Zcash catalyst: NU7 has now activated on Zcash's public testnet, introducing faster 25-second target block times. A mainnet rollout is being targeted for November, subject to review.
So the interesting setup is:
Support holds → recovery toward $1,400–$1,450 → attempt toward $1,686 → only then does $1,800 become a serious breakout target.
I'd avoid writing “strong pump is expected” as a fact on Binance Square. A stronger, more credible headline would be:
$ZEC: Can Buyers Defend $1,280–$1,330 and Reclaim $1,450? $1,800 Is the Bigger Bullish Target 👀
That makes it analysis rather than presenting a prediction as certainty.
#ADAGains10%Above$0.27 #ETHUp70%InQ3ButLiquidityFalls #EthStakingExitQueueHits2026High #FedOctoberHoldOdds82.3% #Nikkei225Jumps2.5%ToThreeMonthHigh
#ZEC/USDT
$ZEC ZEC is around $1,315–$1,320 right now. It recently ran to roughly $1,686, then corrected sharply.
$1,800 ───────────────── 🎯 Possible upside target
↑
$1,686 ─────────────── Recent major high
│
$1,450 ──────────────── Resistance
│
$1,400 ──────────────── Recovery level
│
$1,315 ──────────────── CURRENT AREA
│
$1,280 ──────────────── Key support
│
$1,150–1,200 ───────── Deeper support
🟢 Bullish case
The first thing bulls need is a recovery above roughly $1,400–$1,450. Current technical analysis also identifies that region as the first major recovery zone.
If ZEC eventually breaks the previous ~$1,686 high, then $1,800 becomes a much more reasonable potential target to discuss.
But $1,800 is not confirmed just because price is currently near $1,300.
🔴 Bearish case
The key area I'm watching is around $1,280–$1,330.
A decisive break below ~$1,280 would weaken the current recovery structure and could expose roughly $1,150–$1,200.
📰 Fundamental catalyst
There is also a real Zcash catalyst: NU7 has now activated on Zcash's public testnet, introducing faster 25-second target block times. A mainnet rollout is being targeted for November, subject to review.
So the interesting setup is:
Support holds → recovery toward $1,400–$1,450 → attempt toward $1,686 → only then does $1,800 become a serious breakout target.
I'd avoid writing “strong pump is expected” as a fact on Binance Square. A stronger, more credible headline would be:
$ZEC : Can Buyers Defend $1,280–$1,330 and Reclaim $1,450? $1,800 Is the Bigger Bullish Target 👀
That makes it analysis rather than presenting a prediction as certainty.
#ADAGains10%Above$0.27 #ETHUp70%InQ3ButLiquidityFalls #EthStakingExitQueueHits2026High #FedOctoberHoldOdds82.3% #Nikkei225Jumps2.5%ToThreeMonthHigh
$1,800 ───────────────── 🎯 Possible upside target
↑
$1,686 ─────────────── Recent major high
│
$1,450 ──────────────── Resistance
│
$1,400 ──────────────── Recovery level
│
$1,315 ──────────────── CURRENT AREA
│
$1,280 ──────────────── Key support
│
$1,150–1,200 ───────── Deeper support
🟢 Bullish case
The first thing bulls need is a recovery above roughly $1,400–$1,450. Current technical analysis also identifies that region as the first major recovery zone.
If ZEC eventually breaks the previous ~$1,686 high, then $1,800 becomes a much more reasonable potential target to discuss.
But $1,800 is not confirmed just because price is currently near $1,300.
🔴 Bearish case
The key area I'm watching is around $1,280–$1,330.
A decisive break below ~$1,280 would weaken the current recovery structure and could expose roughly $1,150–$1,200.
📰 Fundamental catalyst
There is also a real Zcash catalyst: NU7 has now activated on Zcash's public testnet, introducing faster 25-second target block times. A mainnet rollout is being targeted for November, subject to review.
So the interesting setup is:
Support holds → recovery toward $1,400–$1,450 → attempt toward $1,686 → only then does $1,800 become a serious breakout target.
I'd avoid writing “strong pump is expected” as a fact on Binance Square. A stronger, more credible headline would be:
$ZEC : Can Buyers Defend $1,280–$1,330 and Reclaim $1,450? $1,800 Is the Bigger Bullish Target 👀
That makes it analysis rather than presenting a prediction as certainty.
#ADAGains10%Above$0.27 #ETHUp70%InQ3ButLiquidityFalls #EthStakingExitQueueHits2026High #FedOctoberHoldOdds82.3% #Nikkei225Jumps2.5%ToThreeMonthHigh
216
Artikel
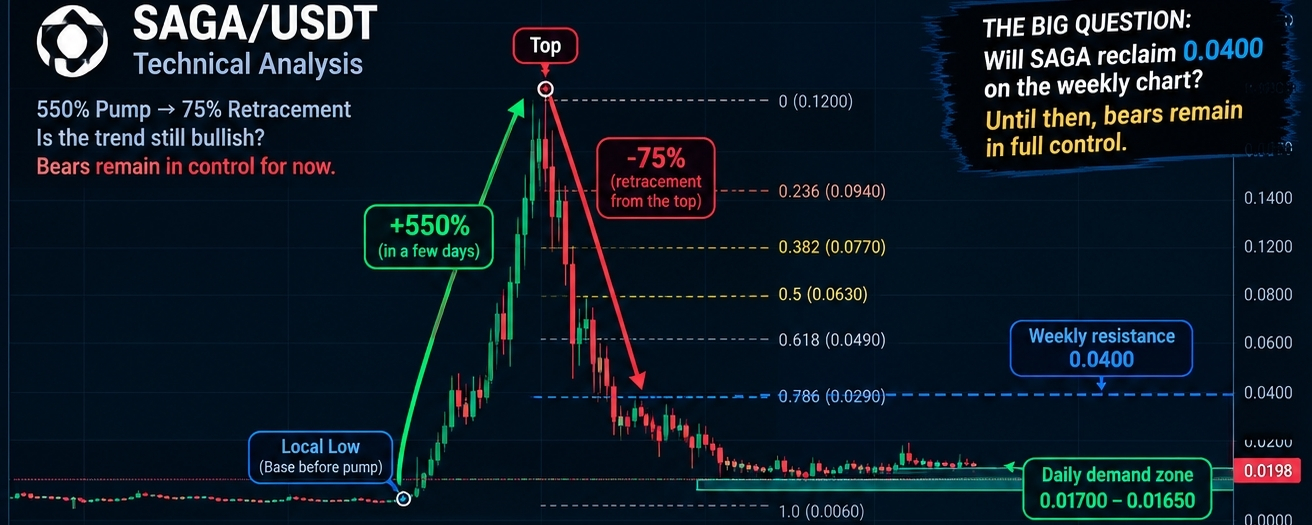
Ich würde daraus einen fundierten Artikel zur technischen Analyse machen, die bearishe These beibehalten, aber pdn vermeiden🚨 SAGA/USDT: 550 % Kursanstieg, 75 % Rücklauf – ist der Trend weiterhin bearish?
SAGA hat kürzlich eine extreme Bewegung erlebt und von seinem lokalen Tief aus rund 550 % zugelegt, bevor der Kurs vom Hoch aus etwa 75 % zurückfiel.
Nach einer Bewegung dieser Größenordnung lautet die wichtigste Frage nicht: „Kann SAGA erneut stark steigen?“
Die bessere Frage lautet:
> Hat sich die übergeordnete Marktstruktur tatsächlich verändert, oder war dies lediglich eine kräftige Erholungsrallye, auf die eine Distribution folgte?
Auf Grundlage der hier beschriebenen Struktur bleibt das bearishe Szenario maßgeblich, bis SAGA das Gegenteil beweist.
Ich würde daraus einen fundierten Artikel zur technischen Analyse machen, die bearishe These beibehalten, aber pdn vermeiden
🚨 SAGA/USDT: 550 % Kursanstieg, 75 % Rücklauf – ist der Trend weiterhin bearish?
SAGA hat kürzlich eine extreme Bewegung erlebt und von seinem lokalen Tief aus rund 550 % zugelegt, bevor der Kurs vom Hoch aus etwa 75 % zurückfiel.
Nach einer Bewegung dieser Größenordnung lautet die wichtigste Frage nicht: „Kann SAGA erneut stark steigen?“
Die bessere Frage lautet:
> Hat sich die übergeordnete Marktstruktur tatsächlich verändert, oder war dies lediglich eine kräftige Erholungsrallye, auf die eine Distribution folgte?
Auf Grundlage der hier beschriebenen Struktur bleibt das bearishe Szenario maßgeblich, bis SAGA das Gegenteil beweist.
SAGA hat kürzlich eine extreme Bewegung erlebt und von seinem lokalen Tief aus rund 550 % zugelegt, bevor der Kurs vom Hoch aus etwa 75 % zurückfiel.
Nach einer Bewegung dieser Größenordnung lautet die wichtigste Frage nicht: „Kann SAGA erneut stark steigen?“
Die bessere Frage lautet:
> Hat sich die übergeordnete Marktstruktur tatsächlich verändert, oder war dies lediglich eine kräftige Erholungsrallye, auf die eine Distribution folgte?
Auf Grundlage der hier beschriebenen Struktur bleibt das bearishe Szenario maßgeblich, bis SAGA das Gegenteil beweist.
299
Übersetzung ansehen
traderprovn
·
--
Komm schon!!!!
56

Artikel
Übersetzung ansehen
I checked the October 5, 2026 SEC filing and Strategy's own announcement, so you can make the Binanc🚨 BREAKING: STRATEGY ADDS ANOTHER 334 BTC — Saylor's Bitcoin Bet Keeps Growing
Michael Saylor's Strategy is continuing to build one of the world's largest corporate Bitcoin treasuries.
According to Strategy's latest SEC filing, the company acquired 334 BTC for approximately $28.7 million between October 1 and October 4, 2026.
The average purchase price was approximately $85,838.80 per BTC.
And this wasn't just another small corporate purchase.
After the acquisition, Strategy's total Bitcoin holdings reached an incredible:
🟠 848,000 BTC
That's a new record for the company.
Strategy's total acquisition cost is now approximately $63.97 billion, including fees and expenses, with an average acquisition price of approximately $75,440.70 per Bitcoin.
At a BTC price around the mid-$80,000s, those holdings are worth roughly $73 billion.
That means Strategy's Bitcoin treasury alone represents more than 4% of Bitcoin's 21 million maximum supply.
💰 Where did the $28.7M come from?
This is an important detail that is easy to miss.
Strategy didn't simply take $28.7 million from operating cash.
The company disclosed that:
$15.7M came from net proceeds from sales of MSTR common stock
$13.0M came from its USD Cash balance
Together, that funded the $28.7M Bitcoin purchase.
This is important because Strategy's Bitcoin strategy is closely connected to its ability to raise capital through its securities.
📊 But here's the interesting part...
The 334 BTC purchase was actually much smaller than Strategy's previous purchases.
The company bought:
1,665 BTC during the previous reported buying period, spending approximately $142.7 million.
Before that, Strategy had also made another substantial Bitcoin acquisition.
So although Strategy continues accumulating BTC, the latest purchase represents a significant slowdown in the size of its weekly Bitcoin purchases.
That distinction matters.
The headline is:
Strategy is still buying Bitcoin.
But the more precise interpretation is:
Strategy is still accumulating, while the latest purchase was considerably smaller than the previous week's acquisition.
🏦 Strategy also bought back its own preferred stock
Here's another major detail from the same filing.
During the relevant period, Strategy repurchased approximately $176.3 million of its STRC preferred stock.
That's more than six times the $28.7 million it spent on Bitcoin during the latest period.
So the company's capital allocation wasn't exclusively focused on Bitcoin.
It was simultaneously:
🟠 Adding BTC
🏦 Repurchasing preferred stock
💵 Maintaining USD reserves
📈 Using capital markets to support its treasury strategy
That makes the latest filing more interesting than simply saying:
"Saylor bought Bitcoin again."
📈 Strategy's Bitcoin position is now enormous
Strategy's 848,000 BTC position gives it extraordinary exposure to Bitcoin's price.
If BTC rises, the value of Strategy's Bitcoin treasury can increase dramatically.
But the opposite is also true.
If Bitcoin falls substantially, the value of the company's digital-asset holdings can decline rapidly.
That makes Strategy effectively one of the most significant corporate Bitcoin proxies in the public markets.
And the company's own Q3 estimate demonstrates how sensitive its results are to Bitcoin.
Strategy estimates a $20.91 billion gain on digital assets for Q3 2026. It also estimated approximately $1.88 billion of associated deferred tax expense.
Importantly, those figures are estimates prepared by management, and Strategy's independent auditor had not audited or reviewed them at the time of the filing.
🧮 What does 848,000 BTC actually mean?
Bitcoin's maximum supply is designed to be:
21,000,000 BTC
Strategy now holds:
848,000 BTC
That's approximately:
4.04% of the maximum supply
That's an extraordinary concentration for a single public company.
And Strategy isn't behaving like a company that bought Bitcoin once and stopped.
The company has repeatedly returned to the market to increase its holdings.
That is why the market continues to watch Michael Saylor and Strategy closely.
🟢 Why Bitcoin bulls care
For Bitcoin bulls, Strategy's continued accumulation can be interpreted as another example of institutional/corporate demand.
The argument is simple:
Corporate treasury adoption → additional Bitcoin demand → fewer coins available to other buyers → potentially stronger long-term scarcity narrative.
But there is an important caveat:
Strategy's purchases alone do NOT guarantee that Bitcoin's price will rise.
Bitcoin remains driven by many factors, including:
Global liquidity
Interest rates
ETF flows
Institutional demand
Macro conditions
Regulation
Investor sentiment
Leverage and derivatives positioning
So Strategy's purchases are one important variable, not the entire Bitcoin market.
🔴 The risk investors shouldn't ignore
There is another side to the Strategy model.
The company uses capital markets to help finance its Bitcoin strategy.
That can amplify upside when Bitcoin performs strongly, but it can also increase financial pressure when Bitcoin falls.
And Strategy has significant obligations connected with its preferred securities and debt.
The latest filing shows that as of October 4, Strategy had approximately:
$4.88B USD Reserve
and
$833.4M USD Cash.
The company also used $142.5 million from its USD Reserve during the period for preferred-stock dividends and interest on outstanding indebtedness.
So this isn't simply a story about:
"Saylor buys BTC → BTC goes up."
It's a much more complicated corporate-finance strategy.
👀 What I'm watching next
The biggest question isn't whether Strategy will ever buy Bitcoin again.
The company has clearly demonstrated a strong commitment to its Bitcoin treasury strategy.
Instead, I'm watching:
1️⃣ Purchase size
Will future purchases return to the hundreds of millions of dollars?
2️⃣ Funding source
Will Strategy continue using MSTR share issuance and cash to acquire BTC?
3️⃣ BTC price
How does Bitcoin perform relative to Strategy's approximately $75,441 average acquisition price?
4️⃣ Corporate financing
Can Strategy continue supporting its preferred-stock dividends and debt obligations while maintaining Bitcoin accumulation?
5️⃣ MSTR vs BTC
Does Strategy's stock continue behaving as a leveraged Bitcoin proxy, or does the valuation relationship change?
🔥 THE BIG PICTURE
The latest purchase is only 334 BTC.
But the bigger story is the size of the treasury:
848,000 BTC.
Strategy has spent approximately $63.97 billion acquiring that Bitcoin, at an average price of approximately $75,440.70 per BTC.
The company now controls an amount equivalent to more than 4% of Bitcoin's eventual maximum supply.
And despite the latest purchase being much smaller than the previous week's acquisition, the overall strategy remains clear:
Strategy continues to build its Bitcoin treasury.
Michael Saylor's Bitcoin bet isn't getting smaller.
It's getting bigger.
The real question for the market is no longer:
"Will Strategy buy Bitcoin?"
It's:
"How large can Strategy's Bitcoin treasury become — and what happens to BTC and MSTR if this accumulation strategy continues?"
Not financial advice. This article is for informational and educational purposes only. Crypto assets and Bitcoin-related equities can be highly volatile. Do your own research.
#Bitcoin #BTC #MichaelSaylor #Strategy #MSTR #Crypto #BitcoinTreasury #Saylor #BinanceSquare #BTCNews #CryptoNews
Sources
Strategy's October 5, 2026 SEC filing — the primary source for the 334 BTC purchase, 848,000 BTC holdings, cost basis and funding.
Strategy's official announcement of its Q3 results and BTC acquisition.
The Block's independent reporting on the acquisition and treasury size.
For your headline, I'd use:
🚨 BREAKING: STRATEGY ADDS 334 BTC — Saylor's 848,000 BTC BET KEEPS GROWING 🟠
#ADAGains10%Above$0.27 #ETHUp70%InQ3ButLiquidityFalls #EthStakingExitQueueHits2026High #FedOctoberHoldOdds82.3%
I checked the October 5, 2026 SEC filing and Strategy's own announcement, so you can make the Binanc
🚨 BREAKING: STRATEGY ADDS ANOTHER 334 BTC — Saylor's Bitcoin Bet Keeps Growing
Michael Saylor's Strategy is continuing to build one of the world's largest corporate Bitcoin treasuries.
According to Strategy's latest SEC filing, the company acquired 334 BTC for approximately $28.7 million between October 1 and October 4, 2026.
The average purchase price was approximately $85,838.80 per BTC.
And this wasn't just another small corporate purchase.
After the acquisition, Strategy's total Bitcoin holdings reached an incredible:
🟠 848,000 BTC
That's a new record for the company.
Strategy's total acquisition cost is now approximately $63.97 billion, including fees and expenses, with an average acquisition price of approximately $75,440.70 per Bitcoin.
At a BTC price around the mid-$80,000s, those holdings are worth roughly $73 billion.
That means Strategy's Bitcoin treasury alone represents more than 4% of Bitcoin's 21 million maximum supply.
💰 Where did the $28.7M come from?
This is an important detail that is easy to miss.
Strategy didn't simply take $28.7 million from operating cash.
The company disclosed that:
$15.7M came from net proceeds from sales of MSTR common stock
$13.0M came from its USD Cash balance
Together, that funded the $28.7M Bitcoin purchase.
This is important because Strategy's Bitcoin strategy is closely connected to its ability to raise capital through its securities.
📊 But here's the interesting part...
The 334 BTC purchase was actually much smaller than Strategy's previous purchases.
The company bought:
1,665 BTC during the previous reported buying period, spending approximately $142.7 million.
Before that, Strategy had also made another substantial Bitcoin acquisition.
So although Strategy continues accumulating BTC, the latest purchase represents a significant slowdown in the size of its weekly Bitcoin purchases.
That distinction matters.
The headline is:
Strategy is still buying Bitcoin.
But the more precise interpretation is:
Strategy is still accumulating, while the latest purchase was considerably smaller than the previous week's acquisition.
🏦 Strategy also bought back its own preferred stock
Here's another major detail from the same filing.
During the relevant period, Strategy repurchased approximately $176.3 million of its STRC preferred stock.
That's more than six times the $28.7 million it spent on Bitcoin during the latest period.
So the company's capital allocation wasn't exclusively focused on Bitcoin.
It was simultaneously:
🟠 Adding BTC
🏦 Repurchasing preferred stock
💵 Maintaining USD reserves
📈 Using capital markets to support its treasury strategy
That makes the latest filing more interesting than simply saying:
"Saylor bought Bitcoin again."
📈 Strategy's Bitcoin position is now enormous
Strategy's 848,000 BTC position gives it extraordinary exposure to Bitcoin's price.
If BTC rises, the value of Strategy's Bitcoin treasury can increase dramatically.
But the opposite is also true.
If Bitcoin falls substantially, the value of the company's digital-asset holdings can decline rapidly.
That makes Strategy effectively one of the most significant corporate Bitcoin proxies in the public markets.
And the company's own Q3 estimate demonstrates how sensitive its results are to Bitcoin.
Strategy estimates a $20.91 billion gain on digital assets for Q3 2026. It also estimated approximately $1.88 billion of associated deferred tax expense.
Importantly, those figures are estimates prepared by management, and Strategy's independent auditor had not audited or reviewed them at the time of the filing.
🧮 What does 848,000 BTC actually mean?
Bitcoin's maximum supply is designed to be:
21,000,000 BTC
Strategy now holds:
848,000 BTC
That's approximately:
4.04% of the maximum supply
That's an extraordinary concentration for a single public company.
And Strategy isn't behaving like a company that bought Bitcoin once and stopped.
The company has repeatedly returned to the market to increase its holdings.
That is why the market continues to watch Michael Saylor and Strategy closely.
🟢 Why Bitcoin bulls care
For Bitcoin bulls, Strategy's continued accumulation can be interpreted as another example of institutional/corporate demand.
The argument is simple:
Corporate treasury adoption → additional Bitcoin demand → fewer coins available to other buyers → potentially stronger long-term scarcity narrative.
But there is an important caveat:
Strategy's purchases alone do NOT guarantee that Bitcoin's price will rise.
Bitcoin remains driven by many factors, including:
Global liquidity
Interest rates
ETF flows
Institutional demand
Macro conditions
Regulation
Investor sentiment
Leverage and derivatives positioning
So Strategy's purchases are one important variable, not the entire Bitcoin market.
🔴 The risk investors shouldn't ignore
There is another side to the Strategy model.
The company uses capital markets to help finance its Bitcoin strategy.
That can amplify upside when Bitcoin performs strongly, but it can also increase financial pressure when Bitcoin falls.
And Strategy has significant obligations connected with its preferred securities and debt.
The latest filing shows that as of October 4, Strategy had approximately:
$4.88B USD Reserve
and
$833.4M USD Cash.
The company also used $142.5 million from its USD Reserve during the period for preferred-stock dividends and interest on outstanding indebtedness.
So this isn't simply a story about:
"Saylor buys BTC → BTC goes up."
It's a much more complicated corporate-finance strategy.
👀 What I'm watching next
The biggest question isn't whether Strategy will ever buy Bitcoin again.
The company has clearly demonstrated a strong commitment to its Bitcoin treasury strategy.
Instead, I'm watching:
1️⃣ Purchase size
Will future purchases return to the hundreds of millions of dollars?
2️⃣ Funding source
Will Strategy continue using MSTR share issuance and cash to acquire BTC?
3️⃣ BTC price
How does Bitcoin perform relative to Strategy's approximately $75,441 average acquisition price?
4️⃣ Corporate financing
Can Strategy continue supporting its preferred-stock dividends and debt obligations while maintaining Bitcoin accumulation?
5️⃣ MSTR vs BTC
Does Strategy's stock continue behaving as a leveraged Bitcoin proxy, or does the valuation relationship change?
🔥 THE BIG PICTURE
The latest purchase is only 334 BTC.
But the bigger story is the size of the treasury:
848,000 BTC.
Strategy has spent approximately $63.97 billion acquiring that Bitcoin, at an average price of approximately $75,440.70 per BTC.
The company now controls an amount equivalent to more than 4% of Bitcoin's eventual maximum supply.
And despite the latest purchase being much smaller than the previous week's acquisition, the overall strategy remains clear:
Strategy continues to build its Bitcoin treasury.
Michael Saylor's Bitcoin bet isn't getting smaller.
It's getting bigger.
The real question for the market is no longer:
"Will Strategy buy Bitcoin?"
It's:
"How large can Strategy's Bitcoin treasury become — and what happens to BTC and MSTR if this accumulation strategy continues?"
Not financial advice. This article is for informational and educational purposes only. Crypto assets and Bitcoin-related equities can be highly volatile. Do your own research.
#Bitcoin #BTC #MichaelSaylor #Strategy #MSTR #Crypto #BitcoinTreasury #Saylor #BinanceSquare #BTCNews #CryptoNews
Sources
Strategy's October 5, 2026 SEC filing — the primary source for the 334 BTC purchase, 848,000 BTC holdings, cost basis and funding.
Strategy's official announcement of its Q3 results and BTC acquisition.
The Block's independent reporting on the acquisition and treasury size.
For your headline, I'd use:
🚨 BREAKING: STRATEGY ADDS 334 BTC — Saylor's 848,000 BTC BET KEEPS GROWING 🟠
#ADAGains10%Above$0.27 #ETHUp70%InQ3ButLiquidityFalls #EthStakingExitQueueHits2026High #FedOctoberHoldOdds82.3%
Michael Saylor's Strategy is continuing to build one of the world's largest corporate Bitcoin treasuries.
According to Strategy's latest SEC filing, the company acquired 334 BTC for approximately $28.7 million between October 1 and October 4, 2026.
The average purchase price was approximately $85,838.80 per BTC.
And this wasn't just another small corporate purchase.
After the acquisition, Strategy's total Bitcoin holdings reached an incredible:
🟠 848,000 BTC
That's a new record for the company.
Strategy's total acquisition cost is now approximately $63.97 billion, including fees and expenses, with an average acquisition price of approximately $75,440.70 per Bitcoin.
At a BTC price around the mid-$80,000s, those holdings are worth roughly $73 billion.
That means Strategy's Bitcoin treasury alone represents more than 4% of Bitcoin's 21 million maximum supply.
💰 Where did the $28.7M come from?
This is an important detail that is easy to miss.
Strategy didn't simply take $28.7 million from operating cash.
The company disclosed that:
$15.7M came from net proceeds from sales of MSTR common stock
$13.0M came from its USD Cash balance
Together, that funded the $28.7M Bitcoin purchase.
This is important because Strategy's Bitcoin strategy is closely connected to its ability to raise capital through its securities.
📊 But here's the interesting part...
The 334 BTC purchase was actually much smaller than Strategy's previous purchases.
The company bought:
1,665 BTC during the previous reported buying period, spending approximately $142.7 million.
Before that, Strategy had also made another substantial Bitcoin acquisition.
So although Strategy continues accumulating BTC, the latest purchase represents a significant slowdown in the size of its weekly Bitcoin purchases.
That distinction matters.
The headline is:
Strategy is still buying Bitcoin.
But the more precise interpretation is:
Strategy is still accumulating, while the latest purchase was considerably smaller than the previous week's acquisition.
🏦 Strategy also bought back its own preferred stock
Here's another major detail from the same filing.
During the relevant period, Strategy repurchased approximately $176.3 million of its STRC preferred stock.
That's more than six times the $28.7 million it spent on Bitcoin during the latest period.
So the company's capital allocation wasn't exclusively focused on Bitcoin.
It was simultaneously:
🟠 Adding BTC
🏦 Repurchasing preferred stock
💵 Maintaining USD reserves
📈 Using capital markets to support its treasury strategy
That makes the latest filing more interesting than simply saying:
"Saylor bought Bitcoin again."
📈 Strategy's Bitcoin position is now enormous
Strategy's 848,000 BTC position gives it extraordinary exposure to Bitcoin's price.
If BTC rises, the value of Strategy's Bitcoin treasury can increase dramatically.
But the opposite is also true.
If Bitcoin falls substantially, the value of the company's digital-asset holdings can decline rapidly.
That makes Strategy effectively one of the most significant corporate Bitcoin proxies in the public markets.
And the company's own Q3 estimate demonstrates how sensitive its results are to Bitcoin.
Strategy estimates a $20.91 billion gain on digital assets for Q3 2026. It also estimated approximately $1.88 billion of associated deferred tax expense.
Importantly, those figures are estimates prepared by management, and Strategy's independent auditor had not audited or reviewed them at the time of the filing.
🧮 What does 848,000 BTC actually mean?
Bitcoin's maximum supply is designed to be:
21,000,000 BTC
Strategy now holds:
848,000 BTC
That's approximately:
4.04% of the maximum supply
That's an extraordinary concentration for a single public company.
And Strategy isn't behaving like a company that bought Bitcoin once and stopped.
The company has repeatedly returned to the market to increase its holdings.
That is why the market continues to watch Michael Saylor and Strategy closely.
🟢 Why Bitcoin bulls care
For Bitcoin bulls, Strategy's continued accumulation can be interpreted as another example of institutional/corporate demand.
The argument is simple:
Corporate treasury adoption → additional Bitcoin demand → fewer coins available to other buyers → potentially stronger long-term scarcity narrative.
But there is an important caveat:
Strategy's purchases alone do NOT guarantee that Bitcoin's price will rise.
Bitcoin remains driven by many factors, including:
Global liquidity
Interest rates
ETF flows
Institutional demand
Macro conditions
Regulation
Investor sentiment
Leverage and derivatives positioning
So Strategy's purchases are one important variable, not the entire Bitcoin market.
🔴 The risk investors shouldn't ignore
There is another side to the Strategy model.
The company uses capital markets to help finance its Bitcoin strategy.
That can amplify upside when Bitcoin performs strongly, but it can also increase financial pressure when Bitcoin falls.
And Strategy has significant obligations connected with its preferred securities and debt.
The latest filing shows that as of October 4, Strategy had approximately:
$4.88B USD Reserve
and
$833.4M USD Cash.
The company also used $142.5 million from its USD Reserve during the period for preferred-stock dividends and interest on outstanding indebtedness.
So this isn't simply a story about:
"Saylor buys BTC → BTC goes up."
It's a much more complicated corporate-finance strategy.
👀 What I'm watching next
The biggest question isn't whether Strategy will ever buy Bitcoin again.
The company has clearly demonstrated a strong commitment to its Bitcoin treasury strategy.
Instead, I'm watching:
1️⃣ Purchase size
Will future purchases return to the hundreds of millions of dollars?
2️⃣ Funding source
Will Strategy continue using MSTR share issuance and cash to acquire BTC?
3️⃣ BTC price
How does Bitcoin perform relative to Strategy's approximately $75,441 average acquisition price?
4️⃣ Corporate financing
Can Strategy continue supporting its preferred-stock dividends and debt obligations while maintaining Bitcoin accumulation?
5️⃣ MSTR vs BTC
Does Strategy's stock continue behaving as a leveraged Bitcoin proxy, or does the valuation relationship change?
🔥 THE BIG PICTURE
The latest purchase is only 334 BTC.
But the bigger story is the size of the treasury:
848,000 BTC.
Strategy has spent approximately $63.97 billion acquiring that Bitcoin, at an average price of approximately $75,440.70 per BTC.
The company now controls an amount equivalent to more than 4% of Bitcoin's eventual maximum supply.
And despite the latest purchase being much smaller than the previous week's acquisition, the overall strategy remains clear:
Strategy continues to build its Bitcoin treasury.
Michael Saylor's Bitcoin bet isn't getting smaller.
It's getting bigger.
The real question for the market is no longer:
"Will Strategy buy Bitcoin?"
It's:
"How large can Strategy's Bitcoin treasury become — and what happens to BTC and MSTR if this accumulation strategy continues?"
Not financial advice. This article is for informational and educational purposes only. Crypto assets and Bitcoin-related equities can be highly volatile. Do your own research.
#Bitcoin #BTC #MichaelSaylor #Strategy #MSTR #Crypto #BitcoinTreasury #Saylor #BinanceSquare #BTCNews #CryptoNews
Sources
Strategy's October 5, 2026 SEC filing — the primary source for the 334 BTC purchase, 848,000 BTC holdings, cost basis and funding.
Strategy's official announcement of its Q3 results and BTC acquisition.
The Block's independent reporting on the acquisition and treasury size.
For your headline, I'd use:
🚨 BREAKING: STRATEGY ADDS 334 BTC — Saylor's 848,000 BTC BET KEEPS GROWING 🟠
#ADAGains10%Above$0.27 #ETHUp70%InQ3ButLiquidityFalls #EthStakingExitQueueHits2026High #FedOctoberHoldOdds82.3%
80
Artikel
Übersetzung ansehen
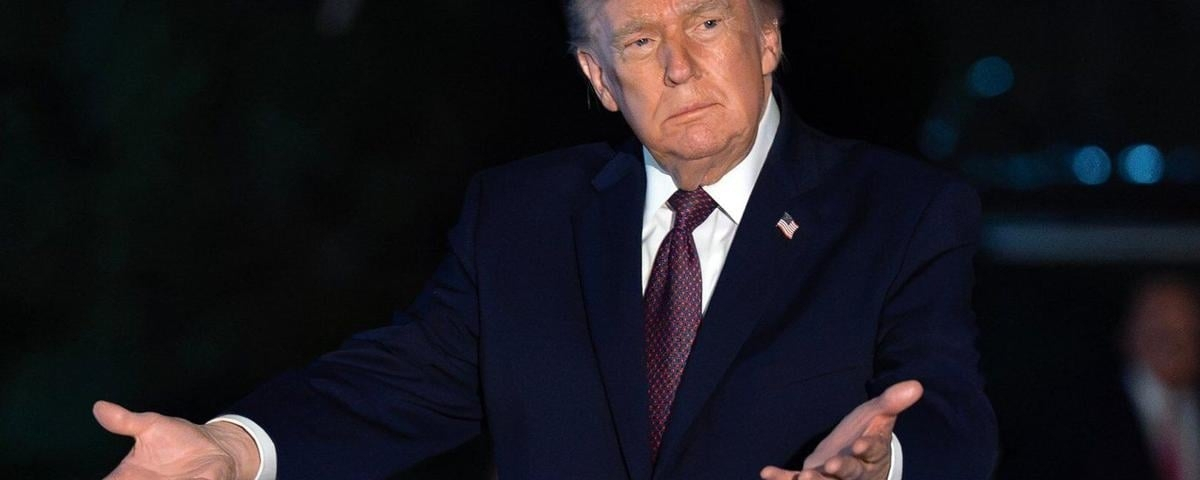
I checked the latest reporting, and the story is real, but the post you quoted mixes confirmed factPresident Trump originally announced a $5,000 “Trump Dividend” for every adult U.S. citizen if Republicans retain both the House and Senate in the November 2026 midterms. The White House itself describes it that way.
He subsequently repeated the promise. There was also a brief wording change on October 2 where Trump referred to “every U.S. Citizen,” which could literally include children, but his subsequent October 3 statement again specified adult citizens. So for economic calculations, using roughly 240–245 million adults is the more defensible interpretation right now.
💰 The $1.2 trillion calculation
The math in your post is basically right:
240 million × $5,000 = $1.2 trillion
Using 245 million:
245 million × $5,000 = $1.225 trillion
So saying “around $1.2 trillion” is reasonable. Reuters and FactCheck.org also use approximately $240–245 million adults and arrive at roughly $1.2 trillion.
🚨 But here's the BIG problem: funding
This is where the post needs more caution.
Trump has pointed toward tariff revenue as the source. But current tariff revenue is nowhere near $1.2 trillion.
FactCheck.org reports that 2025 net tariff revenue was about $264 billion, while net revenue after refunds was only about $64 billion through July 2026. It also cites budget experts saying current tariff revenue would not be enough to fund the proposed payments.
Reuters similarly reported that CBO estimates the government is running a very large deficit and that tariff revenue is far below the $1.2 trillion required.
So:
$1.2T required ≠ $1.2T currently available from tariffs.
The difference would have to come from some combination of additional revenue, spending changes, borrowing, or another mechanism.
🏛️ Congress is another major hurdle
Trump cannot simply order $1.2 trillion of new federal spending by himself.
Congress controls federal spending, so legislation would be required. Republicans currently have narrow control, and the proposal could face opposition even within the Republican Party.
Therefore, even if Republicans win both chambers, that doesn't automatically mean Americans receive $5,000.
📈 What could it mean for markets?
This is where your crypto angle becomes interesting — but it should be presented as a scenario, not a prediction.
If a $1.2T program actually happened, there could be a substantial increase in household purchasing power.
A simplified chain would be:
$5,000 payments → higher disposable income → higher consumer spending → stronger demand → possible inflation pressure
If the government financed a large portion through borrowing:
More borrowing → more Treasury issuance → potential upward pressure on yields → tighter financial conditions
Reuters notes that economists expect a borrowing-funded version could put pressure on Treasury markets and potentially push yields higher.
🪙 What about Bitcoin and crypto?
This is the part I would phrase carefully.
It could become a crypto catalyst, but there is no guarantee that $1.2T would flow into Bitcoin.
There are several competing effects:
Potentially bullish for crypto
More household liquidity
Increased risk appetite
Retail participation could increase
Expectations of more nominal spending/liquidity could support speculative assets
Potentially bearish
Higher inflation expectations
Higher Treasury yields
Higher interest rates
Stronger dollar / tighter financial conditions
So the market reaction could actually be mixed rather than automatically bullish.
During the COVID stimulus period, direct payments were associated with increased consumer demand and increased retail-market activity, but they also contributed to inflationary pressure.
🔥 My overall assessment
I'd rate the information like this:
ClaimMy assessmentTrump proposed $5,000✅ ConfirmedHe repeated the proposal✅ ConfirmedAdult citizens are the intended group✅ Strongly supportedCost ≈ $1.2T✅ ReasonableTariffs alone can easily fund it❌ Not supportedCongress would need to act✅ YesIt would definitely cause a crypto pump❌ NoIt could become a major macro catalyst🟡 Yes, if actually implemented
The key sentence I'd use:
The biggest market catalyst isn't Trump's promise itself — it's whether Congress actually authorizes roughly $1.2 trillion in payments and how those payments are financed.
That distinction is important because a political promise can move expectations, but actual fiscal spending changes the economy.
If you're posting this on Binance Square, I'd change the headline from “BREAKING: TRUMP JUST DOUBLED DOWN…” to something more credible like:
🇺🇸 TRUMP'S $5,000 DIVIDEND: WHY $1.2T COULD BECOME A MAJOR MACRO CATALYST FOR CRYPTO
That will make the article look much more like serious macro analysis rather than an unverified pump post.
#BNBSurpasses$790 #ZamaRises15.99%ToIntradayHigh$0.09 #BitcoinSpotETFsDraw$6.34BInflowsInQ3 #EthereumValidatorExitQueueJumps392% #IMFApprovesElSalvador$138MWithBitcoinWaiver
I checked the latest reporting, and the story is real, but the post you quoted mixes confirmed fact
President Trump originally announced a $5,000 “Trump Dividend” for every adult U.S. citizen if Republicans retain both the House and Senate in the November 2026 midterms. The White House itself describes it that way.
He subsequently repeated the promise. There was also a brief wording change on October 2 where Trump referred to “every U.S. Citizen,” which could literally include children, but his subsequent October 3 statement again specified adult citizens. So for economic calculations, using roughly 240–245 million adults is the more defensible interpretation right now.
💰 The $1.2 trillion calculation
The math in your post is basically right:
240 million × $5,000 = $1.2 trillion
Using 245 million:
245 million × $5,000 = $1.225 trillion
So saying “around $1.2 trillion” is reasonable. Reuters and FactCheck.org also use approximately $240–245 million adults and arrive at roughly $1.2 trillion.
🚨 But here's the BIG problem: funding
This is where the post needs more caution.
Trump has pointed toward tariff revenue as the source. But current tariff revenue is nowhere near $1.2 trillion.
FactCheck.org reports that 2025 net tariff revenue was about $264 billion, while net revenue after refunds was only about $64 billion through July 2026. It also cites budget experts saying current tariff revenue would not be enough to fund the proposed payments.
Reuters similarly reported that CBO estimates the government is running a very large deficit and that tariff revenue is far below the $1.2 trillion required.
So:
$1.2T required ≠ $1.2T currently available from tariffs.
The difference would have to come from some combination of additional revenue, spending changes, borrowing, or another mechanism.
🏛️ Congress is another major hurdle
Trump cannot simply order $1.2 trillion of new federal spending by himself.
Congress controls federal spending, so legislation would be required. Republicans currently have narrow control, and the proposal could face opposition even within the Republican Party.
Therefore, even if Republicans win both chambers, that doesn't automatically mean Americans receive $5,000.
📈 What could it mean for markets?
This is where your crypto angle becomes interesting — but it should be presented as a scenario, not a prediction.
If a $1.2T program actually happened, there could be a substantial increase in household purchasing power.
A simplified chain would be:
$5,000 payments → higher disposable income → higher consumer spending → stronger demand → possible inflation pressure
If the government financed a large portion through borrowing:
More borrowing → more Treasury issuance → potential upward pressure on yields → tighter financial conditions
Reuters notes that economists expect a borrowing-funded version could put pressure on Treasury markets and potentially push yields higher.
🪙 What about Bitcoin and crypto?
This is the part I would phrase carefully.
It could become a crypto catalyst, but there is no guarantee that $1.2T would flow into Bitcoin.
There are several competing effects:
Potentially bullish for crypto
More household liquidity
Increased risk appetite
Retail participation could increase
Expectations of more nominal spending/liquidity could support speculative assets
Potentially bearish
Higher inflation expectations
Higher Treasury yields
Higher interest rates
Stronger dollar / tighter financial conditions
So the market reaction could actually be mixed rather than automatically bullish.
During the COVID stimulus period, direct payments were associated with increased consumer demand and increased retail-market activity, but they also contributed to inflationary pressure.
🔥 My overall assessment
I'd rate the information like this:
ClaimMy assessmentTrump proposed $5,000✅ ConfirmedHe repeated the proposal✅ ConfirmedAdult citizens are the intended group✅ Strongly supportedCost ≈ $1.2T✅ ReasonableTariffs alone can easily fund it❌ Not supportedCongress would need to act✅ YesIt would definitely cause a crypto pump❌ NoIt could become a major macro catalyst🟡 Yes, if actually implemented
The key sentence I'd use:
The biggest market catalyst isn't Trump's promise itself — it's whether Congress actually authorizes roughly $1.2 trillion in payments and how those payments are financed.
That distinction is important because a political promise can move expectations, but actual fiscal spending changes the economy.
If you're posting this on Binance Square, I'd change the headline from “BREAKING: TRUMP JUST DOUBLED DOWN…” to something more credible like:
🇺🇸 TRUMP'S $5,000 DIVIDEND: WHY $1.2T COULD BECOME A MAJOR MACRO CATALYST FOR CRYPTO
That will make the article look much more like serious macro analysis rather than an unverified pump post.
#BNBSurpasses$790 #ZamaRises15.99%ToIntradayHigh$0.09 #BitcoinSpotETFsDraw$6.34BInflowsInQ3 #EthereumValidatorExitQueueJumps392% #IMFApprovesElSalvador$138MWithBitcoinWaiver
He subsequently repeated the promise. There was also a brief wording change on October 2 where Trump referred to “every U.S. Citizen,” which could literally include children, but his subsequent October 3 statement again specified adult citizens. So for economic calculations, using roughly 240–245 million adults is the more defensible interpretation right now.
💰 The $1.2 trillion calculation
The math in your post is basically right:
240 million × $5,000 = $1.2 trillion
Using 245 million:
245 million × $5,000 = $1.225 trillion
So saying “around $1.2 trillion” is reasonable. Reuters and FactCheck.org also use approximately $240–245 million adults and arrive at roughly $1.2 trillion.
🚨 But here's the BIG problem: funding
This is where the post needs more caution.
Trump has pointed toward tariff revenue as the source. But current tariff revenue is nowhere near $1.2 trillion.
FactCheck.org reports that 2025 net tariff revenue was about $264 billion, while net revenue after refunds was only about $64 billion through July 2026. It also cites budget experts saying current tariff revenue would not be enough to fund the proposed payments.
Reuters similarly reported that CBO estimates the government is running a very large deficit and that tariff revenue is far below the $1.2 trillion required.
So:
$1.2T required ≠ $1.2T currently available from tariffs.
The difference would have to come from some combination of additional revenue, spending changes, borrowing, or another mechanism.
🏛️ Congress is another major hurdle
Trump cannot simply order $1.2 trillion of new federal spending by himself.
Congress controls federal spending, so legislation would be required. Republicans currently have narrow control, and the proposal could face opposition even within the Republican Party.
Therefore, even if Republicans win both chambers, that doesn't automatically mean Americans receive $5,000.
📈 What could it mean for markets?
This is where your crypto angle becomes interesting — but it should be presented as a scenario, not a prediction.
If a $1.2T program actually happened, there could be a substantial increase in household purchasing power.
A simplified chain would be:
$5,000 payments → higher disposable income → higher consumer spending → stronger demand → possible inflation pressure
If the government financed a large portion through borrowing:
More borrowing → more Treasury issuance → potential upward pressure on yields → tighter financial conditions
Reuters notes that economists expect a borrowing-funded version could put pressure on Treasury markets and potentially push yields higher.
🪙 What about Bitcoin and crypto?
This is the part I would phrase carefully.
It could become a crypto catalyst, but there is no guarantee that $1.2T would flow into Bitcoin.
There are several competing effects:
Potentially bullish for crypto
More household liquidity
Increased risk appetite
Retail participation could increase
Expectations of more nominal spending/liquidity could support speculative assets
Potentially bearish
Higher inflation expectations
Higher Treasury yields
Higher interest rates
Stronger dollar / tighter financial conditions
So the market reaction could actually be mixed rather than automatically bullish.
During the COVID stimulus period, direct payments were associated with increased consumer demand and increased retail-market activity, but they also contributed to inflationary pressure.
🔥 My overall assessment
I'd rate the information like this:
ClaimMy assessmentTrump proposed $5,000✅ ConfirmedHe repeated the proposal✅ ConfirmedAdult citizens are the intended group✅ Strongly supportedCost ≈ $1.2T✅ ReasonableTariffs alone can easily fund it❌ Not supportedCongress would need to act✅ YesIt would definitely cause a crypto pump❌ NoIt could become a major macro catalyst🟡 Yes, if actually implemented
The key sentence I'd use:
The biggest market catalyst isn't Trump's promise itself — it's whether Congress actually authorizes roughly $1.2 trillion in payments and how those payments are financed.
That distinction is important because a political promise can move expectations, but actual fiscal spending changes the economy.
If you're posting this on Binance Square, I'd change the headline from “BREAKING: TRUMP JUST DOUBLED DOWN…” to something more credible like:
🇺🇸 TRUMP'S $5,000 DIVIDEND: WHY $1.2T COULD BECOME A MAJOR MACRO CATALYST FOR CRYPTO
That will make the article look much more like serious macro analysis rather than an unverified pump post.
#BNBSurpasses$790 #ZamaRises15.99%ToIntradayHigh$0.09 #BitcoinSpotETFsDraw$6.34BInflowsInQ3 #EthereumValidatorExitQueueJumps392% #IMFApprovesElSalvador$138MWithBitcoinWaiver
67
Artikel
Übersetzung ansehen
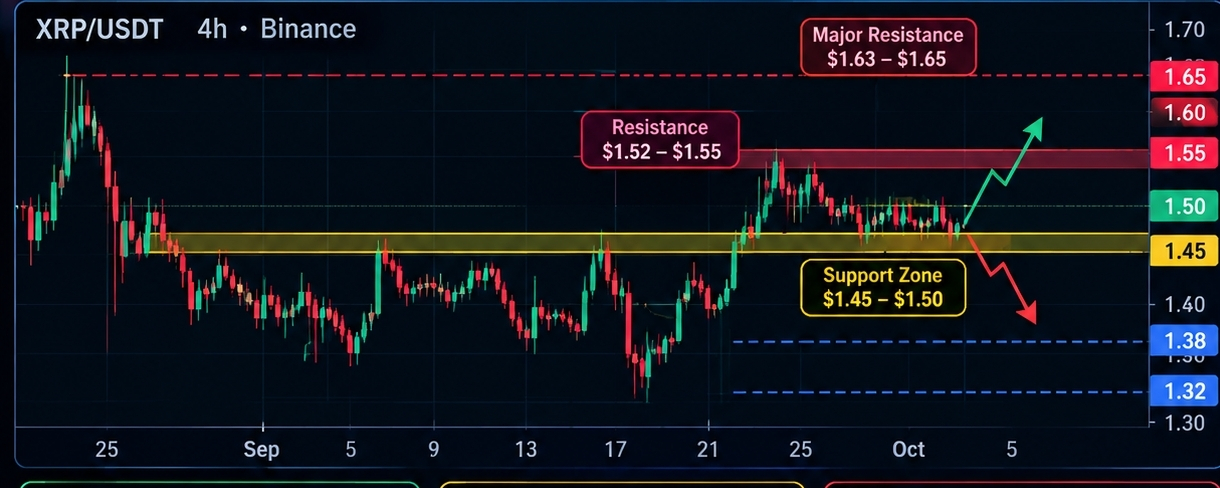
📊 XRP/USDT 4H: Key Level That Could Decide the Next MoveXRP is currently trading around the $1.50 area, and the 4H chart is showing an interesting battle between buyers and sellers.
The most important level I’m watching is $1.45–$1.50.
This zone has acted as an important pivot, and buyers have recently defended the lower part of the range. Current market analysis also places XRP's immediate resistance around $1.52–$1.55.
🟢 Bullish Scenario
If XRP continues holding the $1.45–$1.50 support zone, the next thing I want to see is a clean 4H breakout above $1.52–$1.55.
A confirmed breakout could bring the previous highs back into focus:
$1.55 → $1.60 → $1.63–$1.65
The ~$1.63–$1.65 region is particularly important because it is close to the recent swing high.
However, I would want to see volume and a 4H candle close above resistance rather than assuming that simply touching $1.55 means a breakout.
🔴 Bearish Scenario
The level I don't want to see lost is $1.45.
If XRP gets a decisive 4H close below this area and sellers continue to dominate, the next zones I'd watch are approximately:
$1.38 → $1.32
Those levels correspond roughly with the 50-day and 100-day EMA areas reported in current analysis.
A move below $1.45 would therefore weaken the current bullish structure.
🟡 My Neutral Scenario
There is another possibility:
XRP could simply continue ranging between approximately $1.45 and $1.55.
In that case, there is no reason to assume that a major breakout is happening yet.
The market may need more volume before choosing a direction.
Interestingly, current Binance XRP open-interest data suggests positioning remains considerably lower than it was around the same period last year, meaning the derivatives market is currently more cautious.
🔎 What I'm Watching
Support: $1.45–$1.50
Resistance: $1.52–$1.55
Major resistance: $1.63–$1.65
Lower support: ~$1.38
Deeper support: ~$1.32
The technical picture is therefore not a confirmed breakout yet.
For me, the important question isn't:
“Will XRP pump?”
It's:
“Will XRP break $1.52–$1.55 with enough strength to turn resistance into support?”
If yes, the structure becomes considerably more interesting.
If $1.45 fails, the bullish thesis becomes weaker.
📌 Conclusion
XRP is currently at a decision zone.
🟢 Above $1.55 with confirmation → bullish structure strengthens
🟡 $1.45–$1.55 → consolidation/range
🔴 Below $1.45 → downside risk increases
This is technical analysis, not financial advice. Markets can invalidate technical setups quickly, so confirmation matters more than prediction.
What level are you watching for XRP — $1.45 support or $1.55 breakout? 👀
#XRP #XRPUSDT #Crypto #BinanceSquare #TechnicalAnalysis #Trading #CryptoAnalysis
#BNBSurpasses$790 #ZamaRises15.99%ToIntradayHigh$0.09 #BitcoinSpotETFsDraw$6.34BInflowsInQ3 #EthereumValidatorExitQueueJumps392% #IMFApprovesElSalvador$138MWithBitcoinWaiver
📊 XRP/USDT 4H: Key Level That Could Decide the Next Move
XRP is currently trading around the $1.50 area, and the 4H chart is showing an interesting battle between buyers and sellers.
The most important level I’m watching is $1.45–$1.50.
This zone has acted as an important pivot, and buyers have recently defended the lower part of the range. Current market analysis also places XRP's immediate resistance around $1.52–$1.55.
🟢 Bullish Scenario
If XRP continues holding the $1.45–$1.50 support zone, the next thing I want to see is a clean 4H breakout above $1.52–$1.55.
A confirmed breakout could bring the previous highs back into focus:
$1.55 → $1.60 → $1.63–$1.65
The ~$1.63–$1.65 region is particularly important because it is close to the recent swing high.
However, I would want to see volume and a 4H candle close above resistance rather than assuming that simply touching $1.55 means a breakout.
🔴 Bearish Scenario
The level I don't want to see lost is $1.45.
If XRP gets a decisive 4H close below this area and sellers continue to dominate, the next zones I'd watch are approximately:
$1.38 → $1.32
Those levels correspond roughly with the 50-day and 100-day EMA areas reported in current analysis.
A move below $1.45 would therefore weaken the current bullish structure.
🟡 My Neutral Scenario
There is another possibility:
XRP could simply continue ranging between approximately $1.45 and $1.55.
In that case, there is no reason to assume that a major breakout is happening yet.
The market may need more volume before choosing a direction.
Interestingly, current Binance XRP open-interest data suggests positioning remains considerably lower than it was around the same period last year, meaning the derivatives market is currently more cautious.
🔎 What I'm Watching
Support: $1.45–$1.50
Resistance: $1.52–$1.55
Major resistance: $1.63–$1.65
Lower support: ~$1.38
Deeper support: ~$1.32
The technical picture is therefore not a confirmed breakout yet.
For me, the important question isn't:
“Will XRP pump?”
It's:
“Will XRP break $1.52–$1.55 with enough strength to turn resistance into support?”
If yes, the structure becomes considerably more interesting.
If $1.45 fails, the bullish thesis becomes weaker.
📌 Conclusion
XRP is currently at a decision zone.
🟢 Above $1.55 with confirmation → bullish structure strengthens
🟡 $1.45–$1.55 → consolidation/range
🔴 Below $1.45 → downside risk increases
This is technical analysis, not financial advice. Markets can invalidate technical setups quickly, so confirmation matters more than prediction.
What level are you watching for XRP — $1.45 support or $1.55 breakout? 👀
#XRP #XRPUSDT #Crypto #BinanceSquare #TechnicalAnalysis #Trading #CryptoAnalysis
#BNBSurpasses$790 #ZamaRises15.99%ToIntradayHigh$0.09 #BitcoinSpotETFsDraw$6.34BInflowsInQ3 #EthereumValidatorExitQueueJumps392% #IMFApprovesElSalvador$138MWithBitcoinWaiver
The most important level I’m watching is $1.45–$1.50.
This zone has acted as an important pivot, and buyers have recently defended the lower part of the range. Current market analysis also places XRP's immediate resistance around $1.52–$1.55.
🟢 Bullish Scenario
If XRP continues holding the $1.45–$1.50 support zone, the next thing I want to see is a clean 4H breakout above $1.52–$1.55.
A confirmed breakout could bring the previous highs back into focus:
$1.55 → $1.60 → $1.63–$1.65
The ~$1.63–$1.65 region is particularly important because it is close to the recent swing high.
However, I would want to see volume and a 4H candle close above resistance rather than assuming that simply touching $1.55 means a breakout.
🔴 Bearish Scenario
The level I don't want to see lost is $1.45.
If XRP gets a decisive 4H close below this area and sellers continue to dominate, the next zones I'd watch are approximately:
$1.38 → $1.32
Those levels correspond roughly with the 50-day and 100-day EMA areas reported in current analysis.
A move below $1.45 would therefore weaken the current bullish structure.
🟡 My Neutral Scenario
There is another possibility:
XRP could simply continue ranging between approximately $1.45 and $1.55.
In that case, there is no reason to assume that a major breakout is happening yet.
The market may need more volume before choosing a direction.
Interestingly, current Binance XRP open-interest data suggests positioning remains considerably lower than it was around the same period last year, meaning the derivatives market is currently more cautious.
🔎 What I'm Watching
Support: $1.45–$1.50
Resistance: $1.52–$1.55
Major resistance: $1.63–$1.65
Lower support: ~$1.38
Deeper support: ~$1.32
The technical picture is therefore not a confirmed breakout yet.
For me, the important question isn't:
“Will XRP pump?”
It's:
“Will XRP break $1.52–$1.55 with enough strength to turn resistance into support?”
If yes, the structure becomes considerably more interesting.
If $1.45 fails, the bullish thesis becomes weaker.
📌 Conclusion
XRP is currently at a decision zone.
🟢 Above $1.55 with confirmation → bullish structure strengthens
🟡 $1.45–$1.55 → consolidation/range
🔴 Below $1.45 → downside risk increases
This is technical analysis, not financial advice. Markets can invalidate technical setups quickly, so confirmation matters more than prediction.
What level are you watching for XRP — $1.45 support or $1.55 breakout? 👀
#XRP #XRPUSDT #Crypto #BinanceSquare #TechnicalAnalysis #Trading #CryptoAnalysis
#BNBSurpasses$790 #ZamaRises15.99%ToIntradayHigh$0.09 #BitcoinSpotETFsDraw$6.34BInflowsInQ3 #EthereumValidatorExitQueueJumps392% #IMFApprovesElSalvador$138MWithBitcoinWaiver
156
Artikel
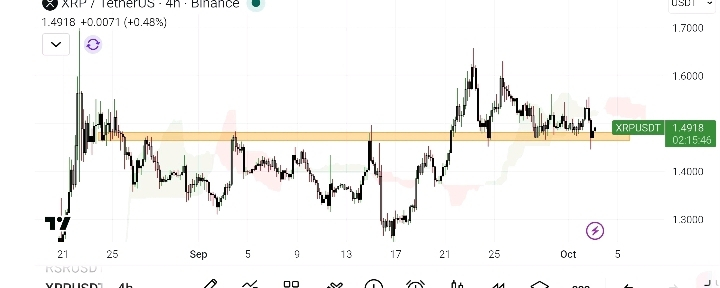
Wenn man sich den von dir hochgeladenen 4-Stunden-XRP-Chart ansieht, würde ich das Setup als neutral bis leicht bullisch bezeichnenDas Wichtige ist, dass XRP genau im markierten Bereich $1.46–$1.50 sitzt, der schon mehrfach als Pivot fungiert hat.
Mein Chart-Reading
~$1.65
│ ← letzter Swing-High
│ ╲
│ ╲
$1.55–1.60 ────┤ ╲___
│ ╲
$1.50 ─────────┼───────────● ← AKTUELLE ZONE
│ ╱
$1.46 ─────────┼────────╱ ← wichtige Unterstützung/ Pivot
Wenn man sich den von dir hochgeladenen 4-Stunden-XRP-Chart ansieht, würde ich das Setup als neutral bis leicht bullisch bezeichnen
Das Wichtige ist, dass XRP genau im markierten Bereich $1.46–$1.50 sitzt, der schon mehrfach als Pivot fungiert hat.
Mein Chart-Reading
~$1.65
│ ← letzter Swing-High
│ ╲
│ ╲
$1.55–1.60 ────┤ ╲___
│ ╲
$1.50 ─────────┼───────────● ← AKTUELLE ZONE
│ ╱
$1.46 ─────────┼────────╱ ← wichtige Unterstützung/ Pivot
Mein Chart-Reading
~$1.65
│ ← letzter Swing-High
│ ╲
│ ╲
$1.55–1.60 ────┤ ╲___
│ ╲
$1.50 ─────────┼───────────● ← AKTUELLE ZONE
│ ╱
$1.46 ─────────┼────────╱ ← wichtige Unterstützung/ Pivot
153

Artikel
Übersetzung ansehen
The core idea is significant, but I’d separate the factual claim from the interpretationI checked the recent information. Musk reportedly said on October 3 that roughly 90% of SpaceX’s 2026 revenue will be commercial, with government revenue below 5% in Q4. I couldn't find that exact statement in a primary SpaceX filing, so I'd treat the quote as Musk's forecast, not audited historical data.
What I think it means
1. SpaceX is becoming much more than a rocket company.
The numbers support that direction. In Q2 2026:
SpaceX revenue: $7.8B, up about 92% YoY.
Connectivity/Starlink: $4.29B, up 66%.
Starlink subscribers: 12 million, roughly double the prior year.
Enterprise + government connectivity revenue: $1.81B, up 108%.
Space segment: $962M.
So your statement that Starlink is changing SpaceX's business mix is reasonable.
2. But I wouldn't call SpaceX only a connectivity company
The more accurate picture is:
SpaceX = Connectivity + AI + Space/launch
SPACEX
│
┌──────────────┼──────────────┐
↓ ↓ ↓
STARLINK AI SPACE
Connectivity Compute Rockets
│ │ │
Consumers AI infrastructure Launches
Enterprise xAI/Grok Starship
Mobile Data centers NASA
Government Defense
SpaceX's own filings describe these three major segments: Space, Connectivity and AI.
3. The really interesting part is Starlink's scale
At the end of Q2, Starlink had 12 million subscribers. Meanwhile, SpaceX says it expects next-generation V3 satellites to dramatically increase network capacity.
That creates an interesting business model:
More satellites → more capacity → more customers → more recurring subscriptions → more revenue → more money to deploy satellites.
That's much more like a global telecom/network platform than a traditional launch company.
One important warning
Don't interpret "90% commercial" as 90% Starlink.
Commercial revenue can include multiple businesses, while SpaceX is simultaneously growing AI and other activities. Also, government business isn't necessarily disappearing: SpaceX announced more than $6B of U.S. government Starshield contracts in Q2.
So I'd summarize it this way:
SpaceX is evolving from a rocket company into a diversified technology platform whose economic center of gravity is increasingly recurring connectivity and AI revenue.
And honestly, that is a much more important story than simply "SpaceX launches rockets."
#BNBSurpasses$790 #ZamaRises15.99%ToIntradayHigh$0.09 #BitcoinSpotETFsDraw$6.34BInflowsInQ3 #EthereumValidatorExitQueueJumps392% #IMFApprovesElSalvador$138MWithBitcoinWaiver
The core idea is significant, but I’d separate the factual claim from the interpretation
I checked the recent information. Musk reportedly said on October 3 that roughly 90% of SpaceX’s 2026 revenue will be commercial, with government revenue below 5% in Q4. I couldn't find that exact statement in a primary SpaceX filing, so I'd treat the quote as Musk's forecast, not audited historical data.
What I think it means
1. SpaceX is becoming much more than a rocket company.
The numbers support that direction. In Q2 2026:
SpaceX revenue: $7.8B, up about 92% YoY.
Connectivity/Starlink: $4.29B, up 66%.
Starlink subscribers: 12 million, roughly double the prior year.
Enterprise + government connectivity revenue: $1.81B, up 108%.
Space segment: $962M.
So your statement that Starlink is changing SpaceX's business mix is reasonable.
2. But I wouldn't call SpaceX only a connectivity company
The more accurate picture is:
SpaceX = Connectivity + AI + Space/launch
SPACEX
│
┌──────────────┼──────────────┐
↓ ↓ ↓
STARLINK AI SPACE
Connectivity Compute Rockets
│ │ │
Consumers AI infrastructure Launches
Enterprise xAI/Grok Starship
Mobile Data centers NASA
Government Defense
SpaceX's own filings describe these three major segments: Space, Connectivity and AI.
3. The really interesting part is Starlink's scale
At the end of Q2, Starlink had 12 million subscribers. Meanwhile, SpaceX says it expects next-generation V3 satellites to dramatically increase network capacity.
That creates an interesting business model:
More satellites → more capacity → more customers → more recurring subscriptions → more revenue → more money to deploy satellites.
That's much more like a global telecom/network platform than a traditional launch company.
One important warning
Don't interpret "90% commercial" as 90% Starlink.
Commercial revenue can include multiple businesses, while SpaceX is simultaneously growing AI and other activities. Also, government business isn't necessarily disappearing: SpaceX announced more than $6B of U.S. government Starshield contracts in Q2.
So I'd summarize it this way:
SpaceX is evolving from a rocket company into a diversified technology platform whose economic center of gravity is increasingly recurring connectivity and AI revenue.
And honestly, that is a much more important story than simply "SpaceX launches rockets."
#BNBSurpasses$790 #ZamaRises15.99%ToIntradayHigh$0.09 #BitcoinSpotETFsDraw$6.34BInflowsInQ3 #EthereumValidatorExitQueueJumps392% #IMFApprovesElSalvador$138MWithBitcoinWaiver
What I think it means
1. SpaceX is becoming much more than a rocket company.
The numbers support that direction. In Q2 2026:
SpaceX revenue: $7.8B, up about 92% YoY.
Connectivity/Starlink: $4.29B, up 66%.
Starlink subscribers: 12 million, roughly double the prior year.
Enterprise + government connectivity revenue: $1.81B, up 108%.
Space segment: $962M.
So your statement that Starlink is changing SpaceX's business mix is reasonable.
2. But I wouldn't call SpaceX only a connectivity company
The more accurate picture is:
SpaceX = Connectivity + AI + Space/launch
SPACEX
│
┌──────────────┼──────────────┐
↓ ↓ ↓
STARLINK AI SPACE
Connectivity Compute Rockets
│ │ │
Consumers AI infrastructure Launches
Enterprise xAI/Grok Starship
Mobile Data centers NASA
Government Defense
SpaceX's own filings describe these three major segments: Space, Connectivity and AI.
3. The really interesting part is Starlink's scale
At the end of Q2, Starlink had 12 million subscribers. Meanwhile, SpaceX says it expects next-generation V3 satellites to dramatically increase network capacity.
That creates an interesting business model:
More satellites → more capacity → more customers → more recurring subscriptions → more revenue → more money to deploy satellites.
That's much more like a global telecom/network platform than a traditional launch company.
One important warning
Don't interpret "90% commercial" as 90% Starlink.
Commercial revenue can include multiple businesses, while SpaceX is simultaneously growing AI and other activities. Also, government business isn't necessarily disappearing: SpaceX announced more than $6B of U.S. government Starshield contracts in Q2.
So I'd summarize it this way:
SpaceX is evolving from a rocket company into a diversified technology platform whose economic center of gravity is increasingly recurring connectivity and AI revenue.
And honestly, that is a much more important story than simply "SpaceX launches rockets."
#BNBSurpasses$790 #ZamaRises15.99%ToIntradayHigh$0.09 #BitcoinSpotETFsDraw$6.34BInflowsInQ3 #EthereumValidatorExitQueueJumps392% #IMFApprovesElSalvador$138MWithBitcoinWaiver
159
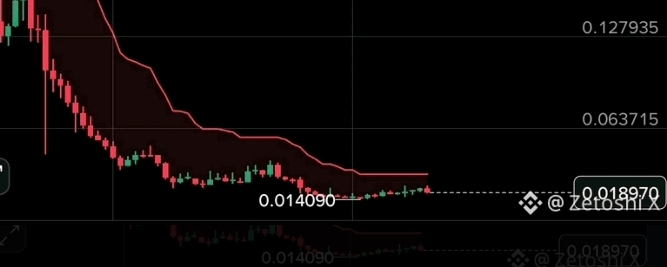
Artikel
Übersetzung ansehen
Worked for 9sI looked closely at the screenshot. Here’s what I see:
What the chart is showing
The token shown is around 0.018–0.019 on the right side.
Earlier, it was much higher and then experienced a large, sustained decline.
The price is now moving mostly sideways near the lows.
The red line appears to be a trend/indicator line that is still above the current price.
The screenshot labels a previous low around 0.014090.
The post claims that “whales are buying” and expects a 200–1000% rise while risking 20%.
My biggest concern 🚨
The chart does not prove that whales are accumulating. A sideways price near a major low can mean accumulation, but it can also simply mean that selling has slowed down.
And a claim like “200–1000%” is extremely speculative. Crypto assets can be exceptionally volatile, and regulators specifically warn that investors can lose substantial amounts in crypto.
Also, the statement “I lose only 20%” can be misleading. If leverage or a derivative position is involved, the actual risk depends on the position size, leverage, liquidation rules, and stop execution—not simply the percentage written in a post. Leverage can magnify losses very quickly.
My reading of the setup
Previous high
│
│ ╲
│ ╲
│ ╲
│ ╲
│ ╲
│ ╲
│ ╲
│ ╲____
│ ╲___ ← 0.014090 previous low
│ ╲___╱╲╱╲╱╲╱ ← current sideways area
│
└───────────────────────────────
↑
possible base
Important: a possible base is not confirmation of a reversal.
If you want to evaluate this screenshot seriously, the useful things to check would be volume, market-cap/liquidity, token supply/unlocks, recent news, and actual on-chain buying data rather than relying on the influencer's “whales are buying” statement.
I would not treat this screenshot alone as evidence that the token is about to rise 200–1000%.
Worked for 9s
I looked closely at the screenshot. Here’s what I see:
What the chart is showing
The token shown is around 0.018–0.019 on the right side.
Earlier, it was much higher and then experienced a large, sustained decline.
The price is now moving mostly sideways near the lows.
The red line appears to be a trend/indicator line that is still above the current price.
The screenshot labels a previous low around 0.014090.
The post claims that “whales are buying” and expects a 200–1000% rise while risking 20%.
My biggest concern 🚨
The chart does not prove that whales are accumulating. A sideways price near a major low can mean accumulation, but it can also simply mean that selling has slowed down.
And a claim like “200–1000%” is extremely speculative. Crypto assets can be exceptionally volatile, and regulators specifically warn that investors can lose substantial amounts in crypto.
Also, the statement “I lose only 20%” can be misleading. If leverage or a derivative position is involved, the actual risk depends on the position size, leverage, liquidation rules, and stop execution—not simply the percentage written in a post. Leverage can magnify losses very quickly.
My reading of the setup
Previous high
│
│ ╲
│ ╲
│ ╲
│ ╲
│ ╲
│ ╲
│ ╲
│ ╲____
│ ╲___ ← 0.014090 previous low
│ ╲___╱╲╱╲╱╲╱ ← current sideways area
│
└───────────────────────────────
↑
possible base
Important: a possible base is not confirmation of a reversal.
If you want to evaluate this screenshot seriously, the useful things to check would be volume, market-cap/liquidity, token supply/unlocks, recent news, and actual on-chain buying data rather than relying on the influencer's “whales are buying” statement.
I would not treat this screenshot alone as evidence that the token is about to rise 200–1000%.
What the chart is showing
The token shown is around 0.018–0.019 on the right side.
Earlier, it was much higher and then experienced a large, sustained decline.
The price is now moving mostly sideways near the lows.
The red line appears to be a trend/indicator line that is still above the current price.
The screenshot labels a previous low around 0.014090.
The post claims that “whales are buying” and expects a 200–1000% rise while risking 20%.
My biggest concern 🚨
The chart does not prove that whales are accumulating. A sideways price near a major low can mean accumulation, but it can also simply mean that selling has slowed down.
And a claim like “200–1000%” is extremely speculative. Crypto assets can be exceptionally volatile, and regulators specifically warn that investors can lose substantial amounts in crypto.
Also, the statement “I lose only 20%” can be misleading. If leverage or a derivative position is involved, the actual risk depends on the position size, leverage, liquidation rules, and stop execution—not simply the percentage written in a post. Leverage can magnify losses very quickly.
My reading of the setup
Previous high
│
│ ╲
│ ╲
│ ╲
│ ╲
│ ╲
│ ╲
│ ╲
│ ╲____
│ ╲___ ← 0.014090 previous low
│ ╲___╱╲╱╲╱╲╱ ← current sideways area
│
└───────────────────────────────
↑
possible base
Important: a possible base is not confirmation of a reversal.
If you want to evaluate this screenshot seriously, the useful things to check would be volume, market-cap/liquidity, token supply/unlocks, recent news, and actual on-chain buying data rather than relying on the influencer's “whales are buying” statement.
I would not treat this screenshot alone as evidence that the token is about to rise 200–1000%.
61
·
--
Bullisch
Übersetzung ansehen
69
Anmelden und weiter Inhalte entdecken
Krypto-Nutzer weltweit auf Binance Square kennenlernen
⚡️ Bleib in Sachen Krypto stets am Puls.
💬 Die weltgrößte Kryptobörse vertraut darauf.
👍 Erhalte verlässliche Einblicke von verifizierten Creators.
E-Mail-Adresse/Telefonnummer
Trendthemen
BinanceLaunchesBinanceIntelligence
534,035 Aufrufe
3,478 Kommentare
🧠 Traden wie ein erfahrener Investmentfonds? Jetzt übernimmt die KI das kostenlos für dich! 🤖📈
Wilsontrader97
·1 Likes
·2k Aufrufe
BitcoinTargets2026OpenAt$87570
4,407 Aufrufe
103 Kommentare
BitcoinRejectedAt$87KThirdTime
3,590 Aufrufe
80 Kommentare