

CHAUDHRYAYAZ
48 Beiträge

CHAUDHRYAYAZ
Melden
Nutzer blockieren
2 Following
5 Follower
4 Like gegeben
Beiträge
·
--
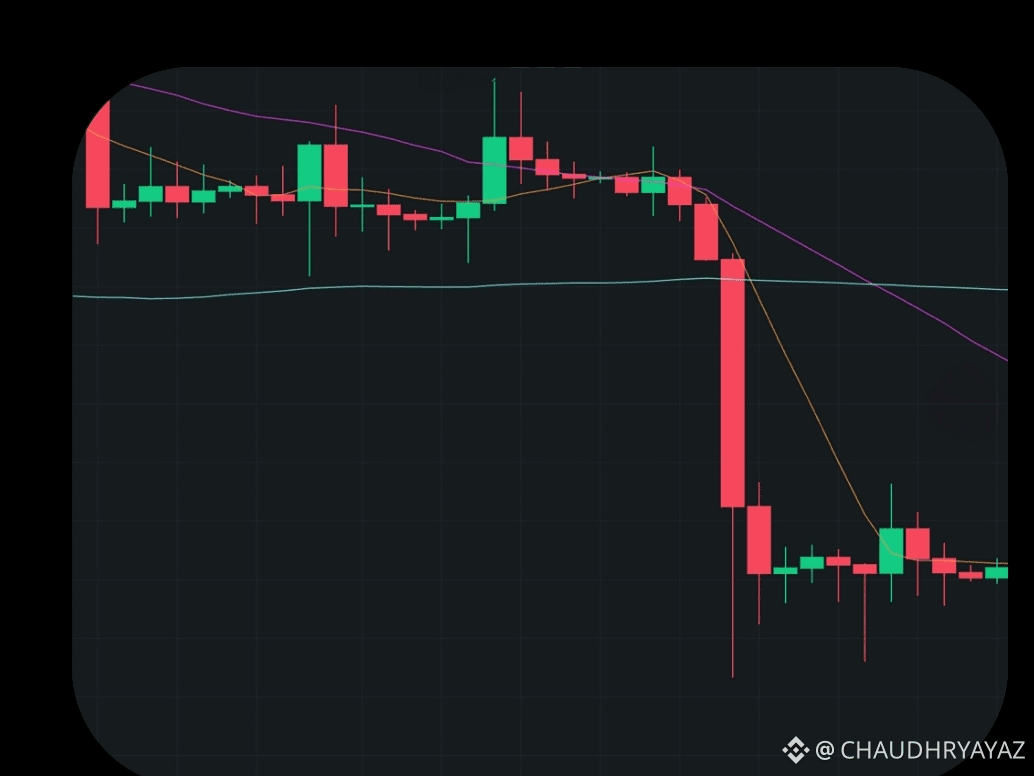
$ADA Cardano (ADA) testet derzeit eine wichtige Unterstützungszone im Bereich von 0,20 bis 0,23 US-Dollar, nachdem der breitere Kryptomarkt kurzfristigem Abwärtsdruck ausgesetzt war.#ThailandSupremeCourtRulesBitcoinIsProperty #CanMicrosoftDeliverOnAI
{spot}(ADAUSDT)
$ADA Cardano (ADA) testet derzeit eine wichtige Unterstützungszone im Bereich von 0,20 bis 0,23 US-Dollar, nachdem der breitere Kryptomarkt kurzfristigem Abwärtsdruck ausgesetzt war.#ThailandSupremeCourtRulesBitcoinIsProperty #CanMicrosoftDeliverOnAI
1
2
182
·
--
Übersetzung ansehen
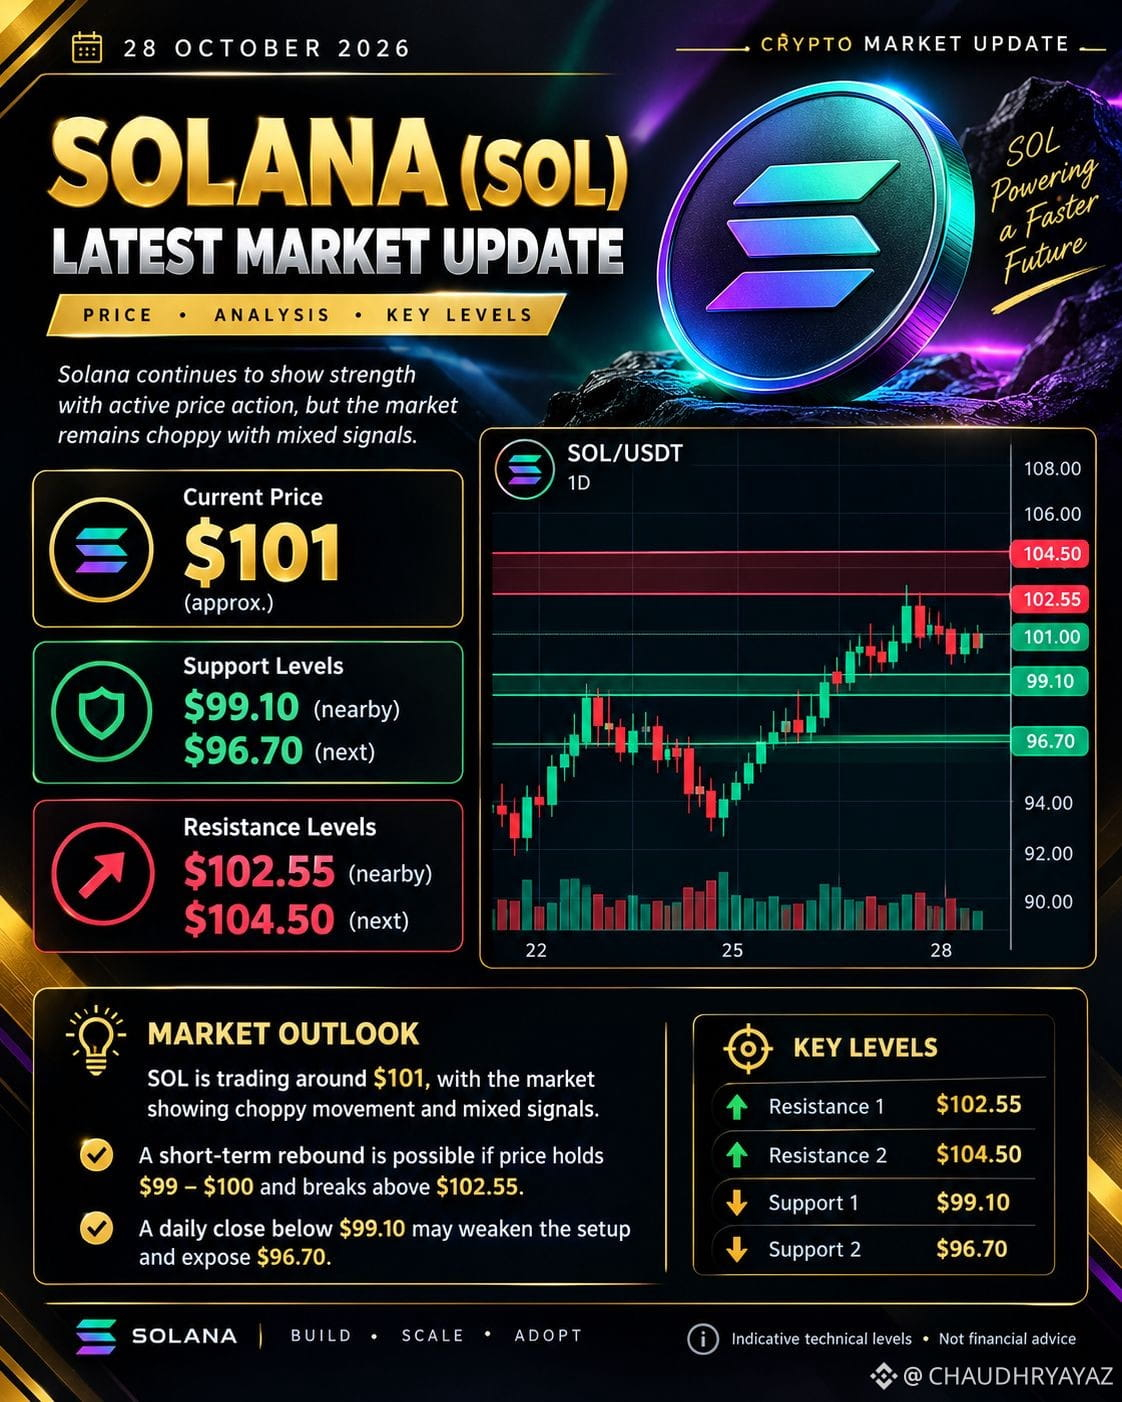
$SOL SOL is trading around $101, with mixed signals and short-term volatility. Buyers need to break resistance to confirm a stronger recovery.
Resistance 1: $102.55
Resistance 2: $104.50
Support 1: $99.10
Support 2: $96.70
Bullish scenario: A breakout above $102.55 could open the way toward $104.50.
Bearish scenario: A break below $99.10 could expose $96.70.
Strategy: Wait for breakout confirmation and use proper stop-loss protection. Levels are indicative.#RobinhoodFalls8.4%AfterItsResults #CanMicrosoftDeliverOnAI
{spot}(SOLUSDT)
$SOL SOL is trading around $101, with mixed signals and short-term volatility. Buyers need to break resistance to confirm a stronger recovery.
Resistance 1: $102.55
Resistance 2: $104.50
Support 1: $99.10
Support 2: $96.70
Bullish scenario: A breakout above $102.55 could open the way toward $104.50.
Bearish scenario: A break below $99.10 could expose $96.70.
Strategy: Wait for breakout confirmation and use proper stop-loss protection. Levels are indicative.#RobinhoodFalls8.4%AfterItsResults #CanMicrosoftDeliverOnAI
58
·
--
Übersetzung ansehen
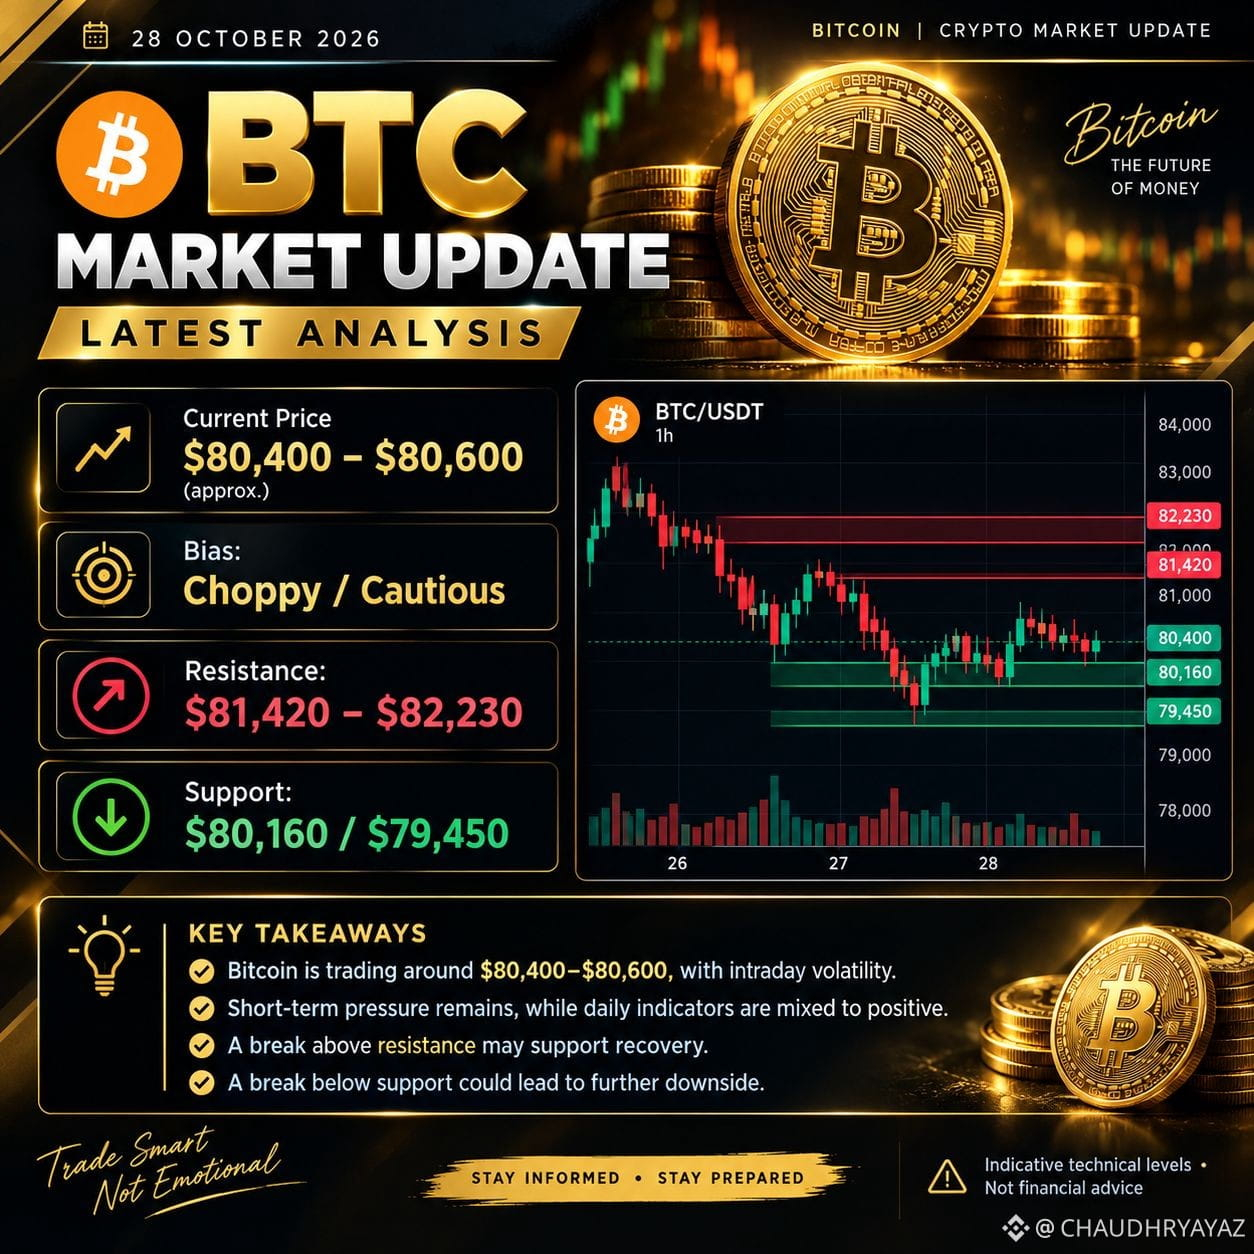
$BTC BTC Latest Analysis — 28 October 2026
Premium Look • Bitcoin Market Update
BTC is trading around $80,400–$80,600, with volatility elevated ahead of the Federal Reserve decision.
Resistance: $81,420 – $82,230
Support: $80,160
Next support: $79,450
Bullish scenario: A breakout above $82,230 could support further recovery.
Bearish scenario: A breakdown below $80,160 could push BTC toward $79,450.
Strategy: Wait for breakout confirmation and manage risk carefully. These are indicative technical levels, not guaranteed targets.#EarningsSeason #CanMicrosoftDeliverOnAI
{spot}(BTCUSDT)
$BTC BTC Latest Analysis — 28 October 2026
Premium Look • Bitcoin Market Update
BTC is trading around $80,400–$80,600, with volatility elevated ahead of the Federal Reserve decision.
Resistance: $81,420 – $82,230
Support: $80,160
Next support: $79,450
Bullish scenario: A breakout above $82,230 could support further recovery.
Bearish scenario: A breakdown below $80,160 could push BTC toward $79,450.
Strategy: Wait for breakout confirmation and manage risk carefully. These are indicative technical levels, not guaranteed targets.#EarningsSeason #CanMicrosoftDeliverOnAI
67
·
--
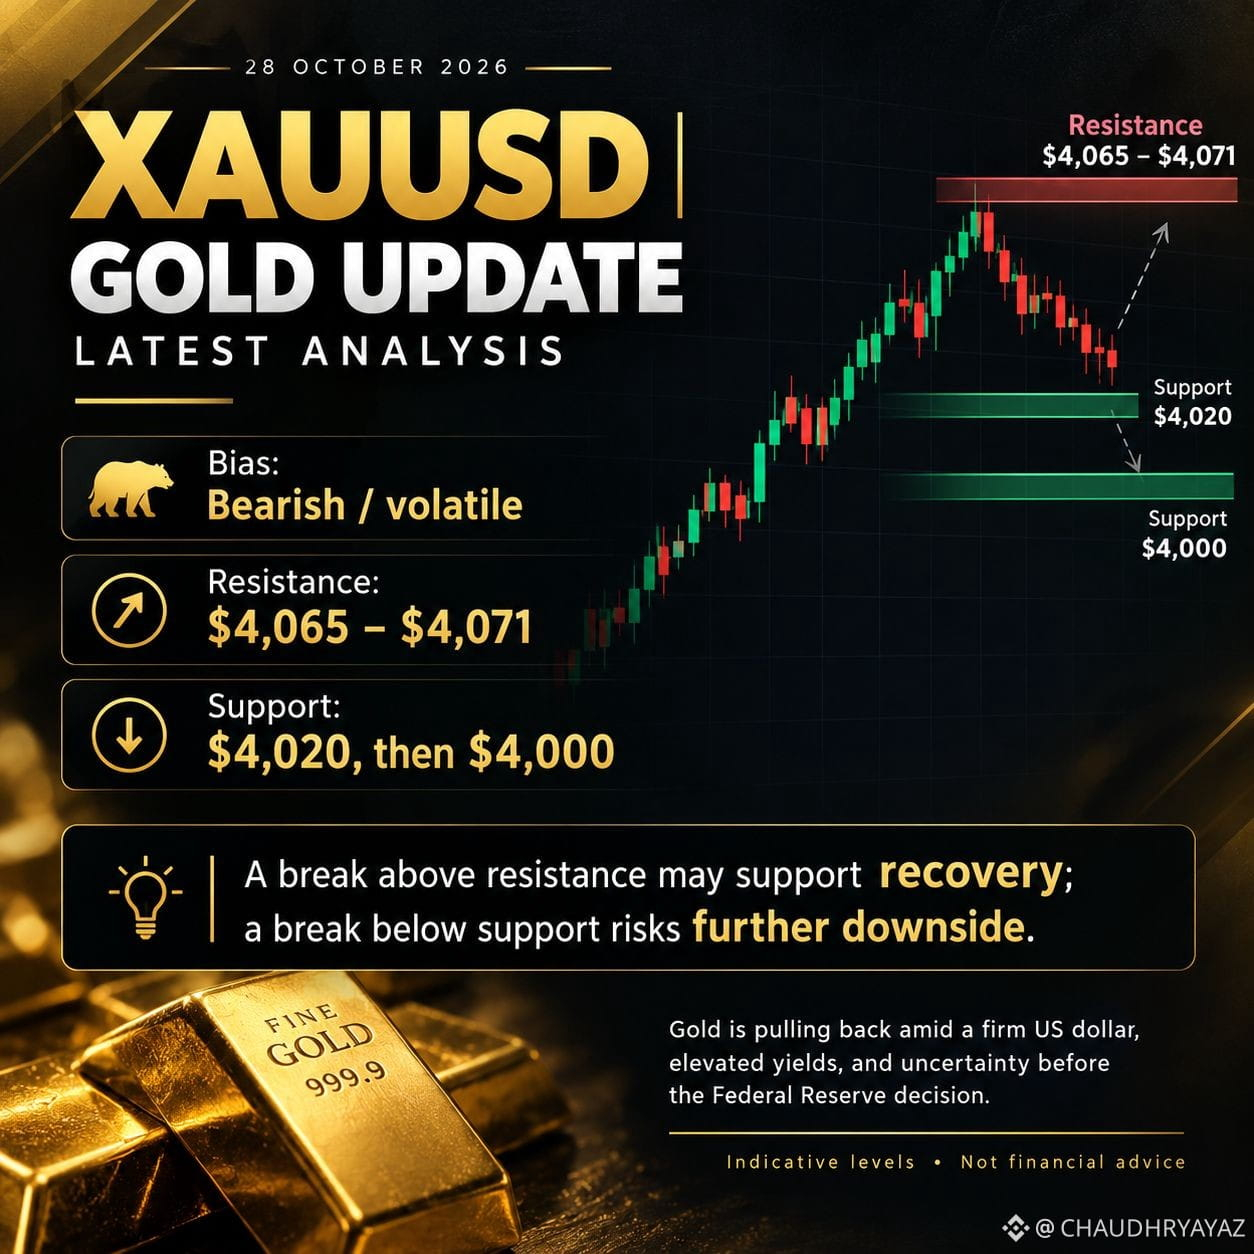
$XAUT XAUUSD Neueste Analyse — 28. Oktober 2026
Premium-Ausblick • Goldmarkt-Update
Der Goldpreis steht vor der Entscheidung der US-Notenbank unter Verkaufsdruck. Kassagold wurde zuletzt nahe 4.030 $ je Unze gehandelt.
Wichtige Kursmarken
Widerstand: 4.065–4.071 $
Unterstützung: 4.020 $
Nächste Unterstützung: 4.000 $
Bullisches Szenario: Ein bestätigter Ausbruch über den Widerstand könnte eine Erholung begünstigen.
Bärisches Szenario: Ein Fall unter 4.020 $ könnte den Weg bis 4.000 $ freimachen. Technische Kursmarken zur Veranschaulichung, kein aktuelles Handelssignal. Prüfen Sie vor dem Handel den aktuellen Kurs bei Ihrem Broker.#KOSPISurges6.63%BackAbove6000 #CanGoogleDefindItsCore
{spot}(XAUTUSDT)
$XAUT XAUUSD Neueste Analyse — 28. Oktober 2026
Premium-Ausblick • Goldmarkt-Update
Der Goldpreis steht vor der Entscheidung der US-Notenbank unter Verkaufsdruck. Kassagold wurde zuletzt nahe 4.030 $ je Unze gehandelt.
Wichtige Kursmarken
Widerstand: 4.065–4.071 $
Unterstützung: 4.020 $
Nächste Unterstützung: 4.000 $
Bullisches Szenario: Ein bestätigter Ausbruch über den Widerstand könnte eine Erholung begünstigen.
Bärisches Szenario: Ein Fall unter 4.020 $ könnte den Weg bis 4.000 $ freimachen. Technische Kursmarken zur Veranschaulichung, kein aktuelles Handelssignal. Prüfen Sie vor dem Handel den aktuellen Kurs bei Ihrem Broker.#KOSPISurges6.63%BackAbove6000 #CanGoogleDefindItsCore
422
·
--
$ETH Aktueller Preis: ~$2,550 – $2,680
Markttendenz: Vorsichtig bullisch ⚖️
Wichtiger Zeithorizont: Test des Widerstands bei etwa $2,750
📊 Technische Lage & wichtige Kursmarken
Ethereum konsolidiert in einer engen Spanne, während die Aktivität auf Layer 2 zunimmt und die strukturelle Gas-Dynamik stabil bleibt.
🔴 Primärer Widerstand: $2,750 – $2,820 — Ein starker Ausbruch auf Tagesbasis über diese Hürde ebnet den Weg zum psychologisch wichtigen Widerstand bei $3,000.
🟢 Zentrale Unterstützungszone: $2,450 – $2,500 — Käufer verteidigen weiterhin diesen wichtigen Bereich am gleitenden Durchschnitt; ein Verlust dieser Zone birgt das Risiko eines erneuten Tests bei $2,320.
🔥 Fundamentale Impulse
Layer-2-Skalierung & Netzwerkaktivität: Das hohe Transaktionsvolumen bei Arbitrum, Optimism und Base stärkt weiterhin die langfristige Netzwerknachfrage.
Staking-Renditen & Angebotsdynamik: Die anhaltende Beteiligung am Staking hält das liquide Umlaufangebot begrenzt.
🎯 Handelsplan: Auf eine Bestätigung des Ausbruchs bei hohem Volumen über $2,820 achten, um Long-Positionen auf Fortsetzung zu erwägen, und unterhalb von $2,450 ein striktes Risikomanagement beibehalten.#Ethereum #ETH #CryptoAnalysis #Trading #Altcoins #defi #ThailandLaunchesWORPTStablecoinToQRPaymentApp #SouthKoreaConsidersEducationTaxOnCryptoExchanges
{spot}(ETHUSDT)
$ETH Aktueller Preis: ~$2,550 – $2,680
Markttendenz: Vorsichtig bullisch ⚖️
Wichtiger Zeithorizont: Test des Widerstands bei etwa $2,750
📊 Technische Lage & wichtige Kursmarken
Ethereum konsolidiert in einer engen Spanne, während die Aktivität auf Layer 2 zunimmt und die strukturelle Gas-Dynamik stabil bleibt.
🔴 Primärer Widerstand: $2,750 – $2,820 — Ein starker Ausbruch auf Tagesbasis über diese Hürde ebnet den Weg zum psychologisch wichtigen Widerstand bei $3,000.
🟢 Zentrale Unterstützungszone: $2,450 – $2,500 — Käufer verteidigen weiterhin diesen wichtigen Bereich am gleitenden Durchschnitt; ein Verlust dieser Zone birgt das Risiko eines erneuten Tests bei $2,320.
🔥 Fundamentale Impulse
Layer-2-Skalierung & Netzwerkaktivität: Das hohe Transaktionsvolumen bei Arbitrum, Optimism und Base stärkt weiterhin die langfristige Netzwerknachfrage.
Staking-Renditen & Angebotsdynamik: Die anhaltende Beteiligung am Staking hält das liquide Umlaufangebot begrenzt.
🎯 Handelsplan: Auf eine Bestätigung des Ausbruchs bei hohem Volumen über $2,820 achten, um Long-Positionen auf Fortsetzung zu erwägen, und unterhalb von $2,450 ein striktes Risikomanagement beibehalten.#Ethereum #ETH #CryptoAnalysis #Trading #Altcoins #defi #ThailandLaunchesWORPTStablecoinToQRPaymentApp #SouthKoreaConsidersEducationTaxOnCryptoExchanges

95
·
--
Übersetzung ansehen
$SOL Current Price: ~$185 – $192
Market Bias: Bullish Continuation 🚀
Key Horizon: Testing Major Resistance Zone
📊 Technical Setup & Key Levels
Solana continues to exhibit relative strength across the layer-1 landscape, driven by high throughput and strong on-chain DeFi volume.
🔴 Primary Resistance: $200 – $210 — A decisive breakout above $210 targets the previous cycle highs toward $240.
🟢 Core Support Zone: $175 – $180 — Bulls are holding this crucial retest level; loss of this zone opens a slide toward $160.
🔥 Fundamental Catalysts
DeFi & DEX Volume: Solana's decentralized exchange volume continues to capture significant market share due to lightning-fast settlement speeds.
Institutional Interest: Growing ecosystem adoption and institutional treasury interest are cementing SOL's position as a premier smart-contract asset.
🎯 Trade Plan: Look for high-volume consolidation above $185 or a clean breakout confirmation past $210 for continuation setups, while monitoring risk below $175.
#Solana #SOL #CryptoAnalysis #Trading #Altcoins #DeFi: #ThailandLaunchesWORPTStablecoinToQRPaymentApp #OCCUrgesCommunityBanksToEnterStablecoinPayments
{spot}(SOLUSDT)
$SOL Current Price: ~$185 – $192
Market Bias: Bullish Continuation 🚀
Key Horizon: Testing Major Resistance Zone
📊 Technical Setup & Key Levels
Solana continues to exhibit relative strength across the layer-1 landscape, driven by high throughput and strong on-chain DeFi volume.
🔴 Primary Resistance: $200 – $210 — A decisive breakout above $210 targets the previous cycle highs toward $240.
🟢 Core Support Zone: $175 – $180 — Bulls are holding this crucial retest level; loss of this zone opens a slide toward $160.
🔥 Fundamental Catalysts
DeFi & DEX Volume: Solana's decentralized exchange volume continues to capture significant market share due to lightning-fast settlement speeds.
Institutional Interest: Growing ecosystem adoption and institutional treasury interest are cementing SOL's position as a premier smart-contract asset.
🎯 Trade Plan: Look for high-volume consolidation above $185 or a clean breakout confirmation past $210 for continuation setups, while monitoring risk below $175.
#Solana #SOL #CryptoAnalysis #Trading #Altcoins #DeFi: #ThailandLaunchesWORPTStablecoinToQRPaymentApp #OCCUrgesCommunityBanksToEnterStablecoinPayments

68
·
--
$XRP Aktueller Preis: ~$1.29 – $1.31
Markttendenz: Neutral–vorsichtig bullisch ⚖️
Wichtiger Zeithorizont: Entscheidend ist, ob die Unterstützung bei $1.25 hält
📊 Technische Lage & wichtige Kursmarken
XRP testet wichtige strukturelle Kursmarken, während sich der breitere Kryptomarkt mit makroökonomischer Unsicherheit und der jüngsten Volatilität von Bitcoin im Bereich um $80K auseinandersetzt.
🔴 Hauptwiderstand: $1.34 – $1.37 — Ein überzeugender Tagesschluss über $1.37 eröffnet Spielraum für Liquidität in Richtung $1.43–$1.50.
🟢 Zentrale Unterstützungszone: $1.25 – $1.28 — Die Bullen verteidigen diese Untergrenze aktiv; ein Bruch würde Abwärtsrisiken bis $1.20 eröffnen.
🔥 Fundamentale Impulsgeber
Expansion im Banken- und institutionellen Bereich: Ripples jüngste regulatorische Schritte und Entwicklungen bei der OCC stärken weiterhin die strukturelle Stimmung institutioneller Anleger.
Nutzen des XRP Ledgers: Die zunehmende Akzeptanz von Cross-Chain-Liquidität und der Abwicklungsinfrastruktur stabilisiert die langfristigen Orderbücher.
Makrostimmung: Die Richtung des Gesamtmarkts hängt stark von der Konsolidierung von Bitcoin und der Entwicklung der institutionellen ETF-Zuflüsse ab.
🎯 Handelsplan: Vor aggressiven Long-Positionen auf eine Bestätigung des Ausbruchs über $1.37 bei hohem Volumen warten und das Risiko unter $1.25 konsequent begrenzen.
#XRP #Ripple #Kryptoanalyse #Trading #Altcoins #TechnicalAnalysis #OCCUrgesCommunityBanksToEnterStablecoinPayments #ThailandLaunchesWORPTStablecoinToQRPaymentApp
{spot}(XRPUSDT)
$XRP Aktueller Preis: ~$1.29 – $1.31
Markttendenz: Neutral–vorsichtig bullisch ⚖️
Wichtiger Zeithorizont: Entscheidend ist, ob die Unterstützung bei $1.25 hält
📊 Technische Lage & wichtige Kursmarken
XRP testet wichtige strukturelle Kursmarken, während sich der breitere Kryptomarkt mit makroökonomischer Unsicherheit und der jüngsten Volatilität von Bitcoin im Bereich um $80K auseinandersetzt.
🔴 Hauptwiderstand: $1.34 – $1.37 — Ein überzeugender Tagesschluss über $1.37 eröffnet Spielraum für Liquidität in Richtung $1.43–$1.50.
🟢 Zentrale Unterstützungszone: $1.25 – $1.28 — Die Bullen verteidigen diese Untergrenze aktiv; ein Bruch würde Abwärtsrisiken bis $1.20 eröffnen.
🔥 Fundamentale Impulsgeber
Expansion im Banken- und institutionellen Bereich: Ripples jüngste regulatorische Schritte und Entwicklungen bei der OCC stärken weiterhin die strukturelle Stimmung institutioneller Anleger.
Nutzen des XRP Ledgers: Die zunehmende Akzeptanz von Cross-Chain-Liquidität und der Abwicklungsinfrastruktur stabilisiert die langfristigen Orderbücher.
Makrostimmung: Die Richtung des Gesamtmarkts hängt stark von der Konsolidierung von Bitcoin und der Entwicklung der institutionellen ETF-Zuflüsse ab.
🎯 Handelsplan: Vor aggressiven Long-Positionen auf eine Bestätigung des Ausbruchs über $1.37 bei hohem Volumen warten und das Risiko unter $1.25 konsequent begrenzen.
#XRP #Ripple #Kryptoanalyse #Trading #Altcoins #TechnicalAnalysis #OCCUrgesCommunityBanksToEnterStablecoinPayments #ThailandLaunchesWORPTStablecoinToQRPaymentApp

90
·
--
Übersetzung ansehen
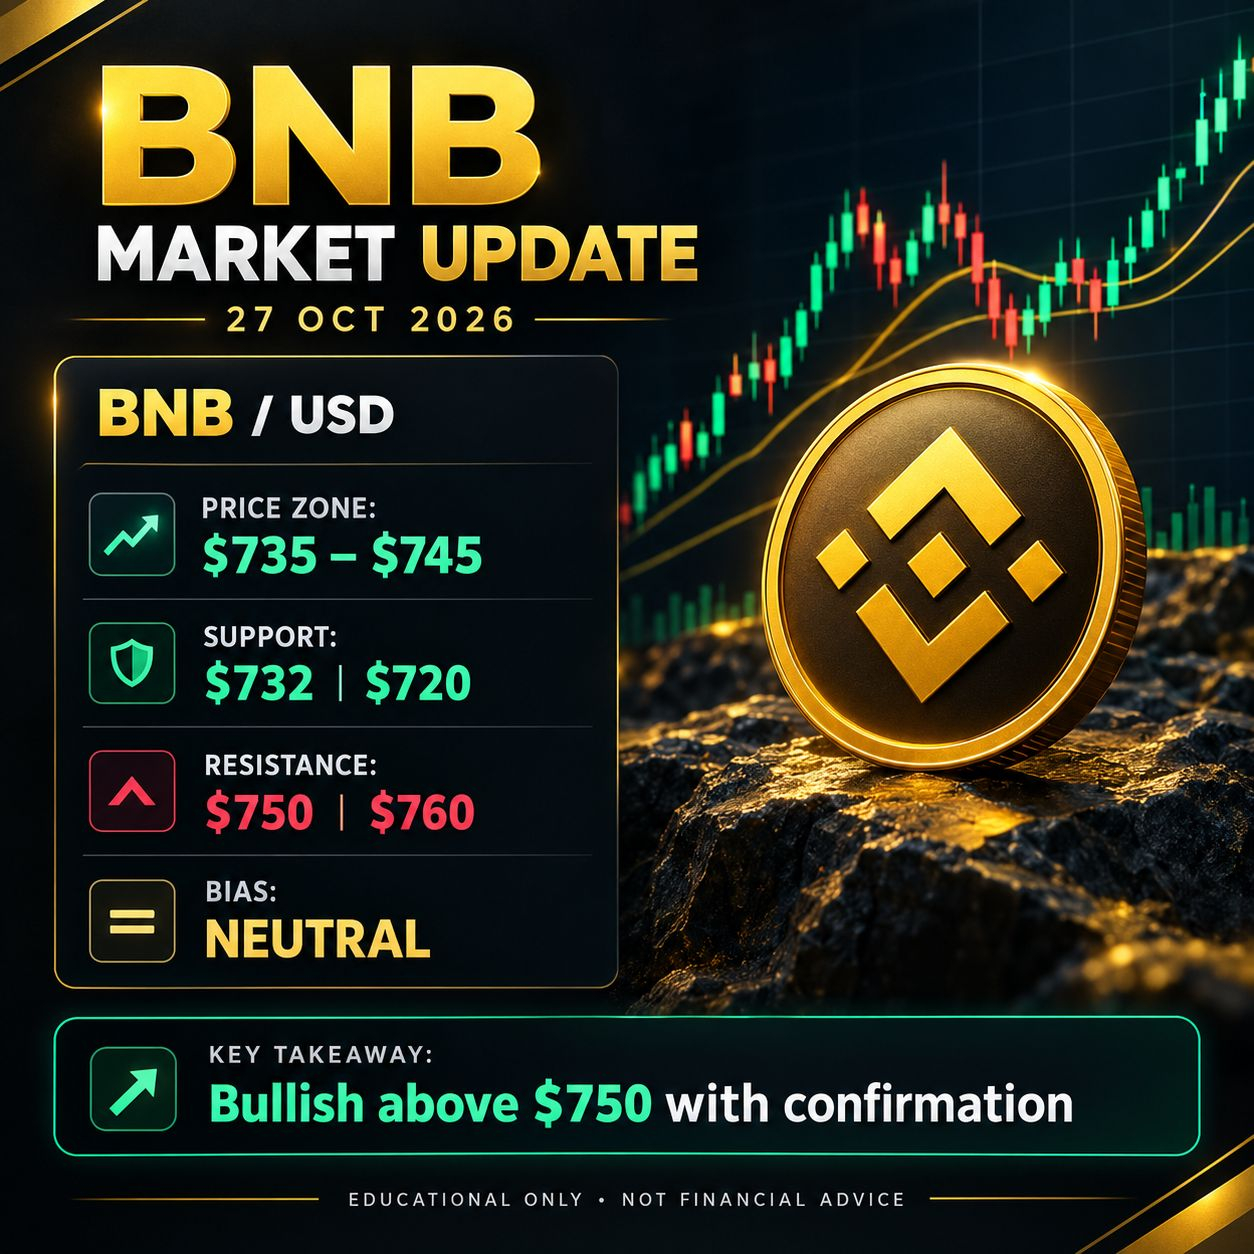
$BNB Current outlook: Neutral — watching for breakout.
BNB is consolidating around the $735–$745 zone. Buyers need a confirmed breakout above $750 to strengthen bullish momentum.
🟢 Support: $732 / $720
🔴 Resistance: $750 / $760
🚀 Bullish target: $780–$800 if momentum confirms
⚠️ Bearish signal: Breakdown below $720
Trading strategy: Wait for a confirmed breakout or breakdown before entering. Manage risk carefully.
Educational analysis only — not financial advice. Prices can change quickly.#SouthKoreaConsidersEducationTaxOnCryptoExchanges #ThailandLaunchesWORPTStablecoinToQRPaymentApp
{spot}(BNBUSDT)
$BNB Current outlook: Neutral — watching for breakout.
BNB is consolidating around the $735–$745 zone. Buyers need a confirmed breakout above $750 to strengthen bullish momentum.
🟢 Support: $732 / $720
🔴 Resistance: $750 / $760
🚀 Bullish target: $780–$800 if momentum confirms
⚠️ Bearish signal: Breakdown below $720
Trading strategy: Wait for a confirmed breakout or breakdown before entering. Manage risk carefully.
Educational analysis only — not financial advice. Prices can change quickly.#SouthKoreaConsidersEducationTaxOnCryptoExchanges #ThailandLaunchesWORPTStablecoinToQRPaymentApp
59
·
--
Übersetzung ansehen
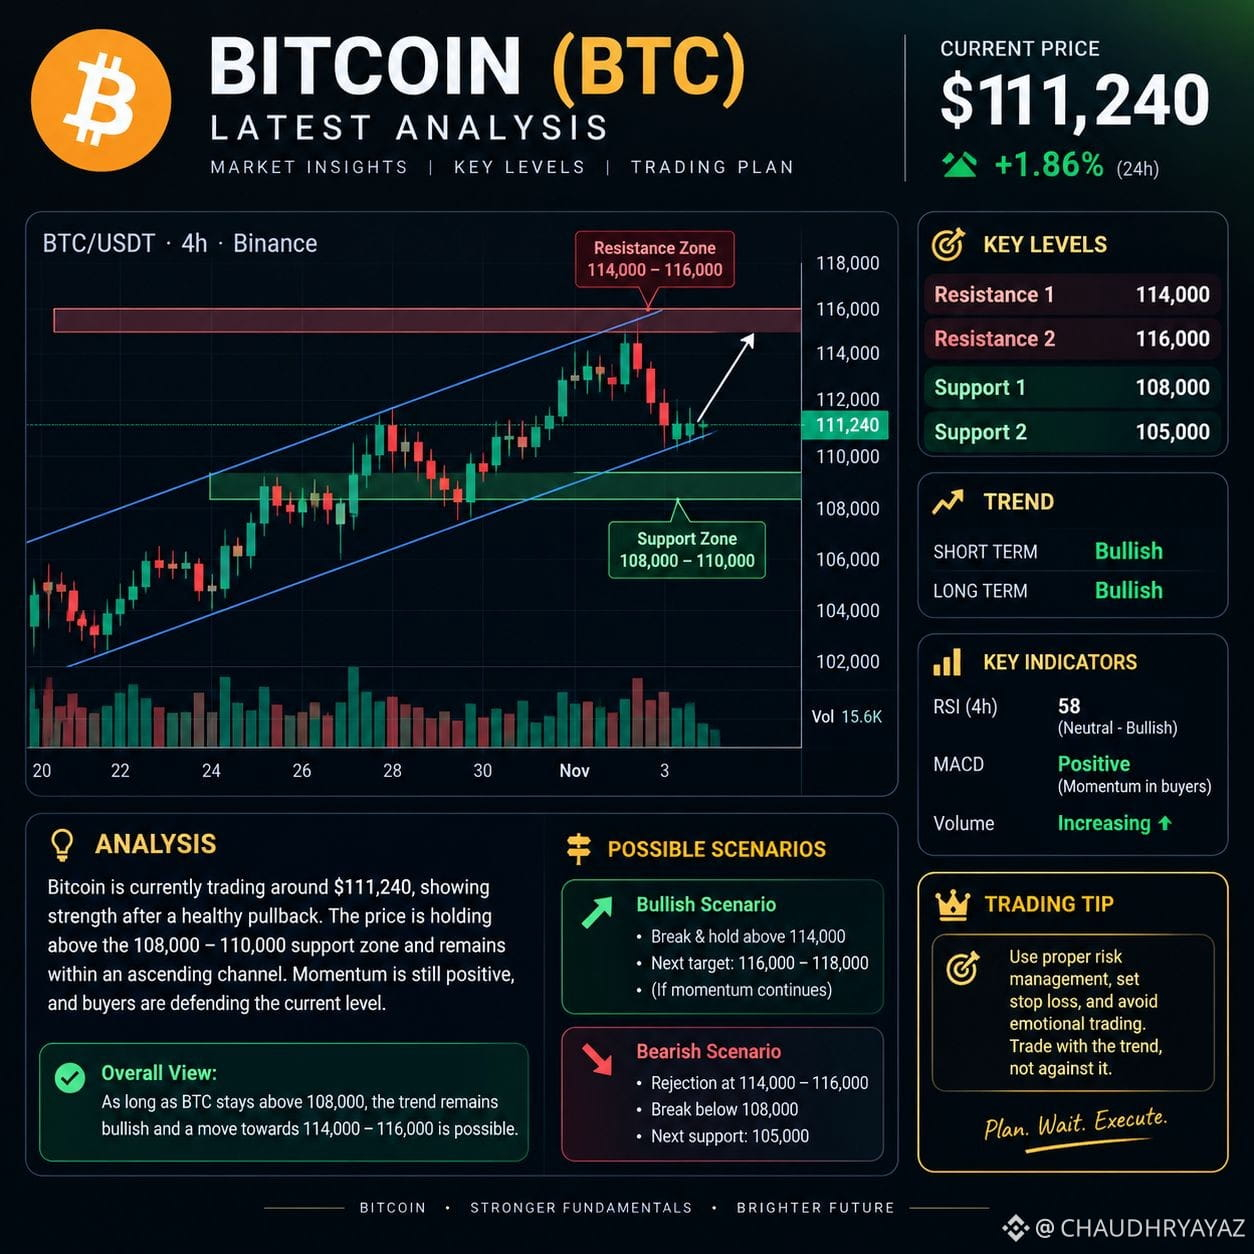
$BTC BTC’s short-term direction depends on whether buyers can defend support and push price through resistance. Watch for a confirmed breakout or breakdown before entering a trade. The key levels in the graphic below are illustrative, not verified live prices.
Latest market reports show BTC near $79,000–$80,000, with short-term pressure ahead of the US Federal Reserve decision. Resistance is around $80,800–$82,000, while support sits near $78,000–$79,200. A break above resistance could support recovery; losing support may extend the decline.
Trading view: Neutral to bearish until BTC reclaims $80,800–$82,000. Use a stop-loss and wait for confirmation.#SouthKoreaConsidersEducationTaxOnCryptoExchanges #CanMicrosoftDeliverOnAI
{spot}(BTCUSDT)
$BTC BTC’s short-term direction depends on whether buyers can defend support and push price through resistance. Watch for a confirmed breakout or breakdown before entering a trade. The key levels in the graphic below are illustrative, not verified live prices.
Latest market reports show BTC near $79,000–$80,000, with short-term pressure ahead of the US Federal Reserve decision. Resistance is around $80,800–$82,000, while support sits near $78,000–$79,200. A break above resistance could support recovery; losing support may extend the decline.
Trading view: Neutral to bearish until BTC reclaims $80,800–$82,000. Use a stop-loss and wait for confirmation.#SouthKoreaConsidersEducationTaxOnCryptoExchanges #CanMicrosoftDeliverOnAI
66
·
--
Übersetzung ansehen
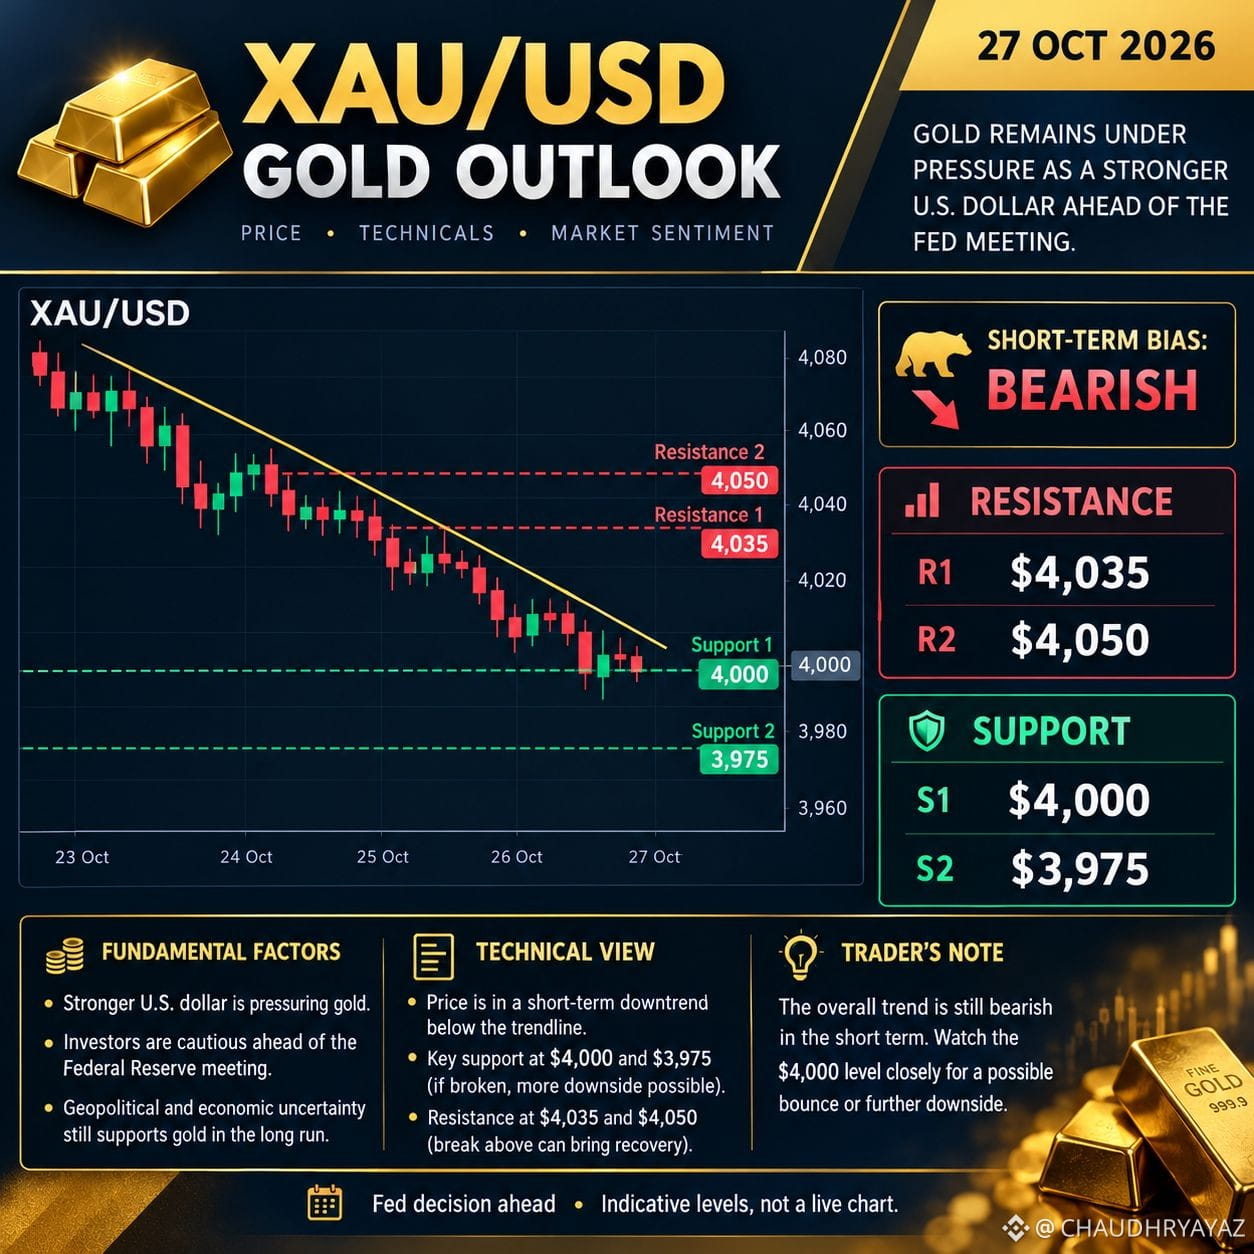
$XAUT XAU/USD — Latest Gold Analysis
27 October 2026 | Short-term outlook
Bearish 📉
Gold is trading around the $4,000/oz area, under pressure from a stronger US dollar ahead of the Federal Reserve decision.
Indicative market snapshot; prices change quickly.
Support: $4,000, $3,975
Resistance: $4,035, $4,050
Bearish scenario: A clear break below $4,000 may lead to further downside.
Bullish scenario: A sustained move above $4,035 could support a recovery. #ThailandLaunchesWORPTStablecoinToQRPaymentApp #BitmineAdds10452ETH
{spot}(XAUTUSDT)
$XAUT XAU/USD — Latest Gold Analysis
27 October 2026 | Short-term outlook
Bearish 📉
Gold is trading around the $4,000/oz area, under pressure from a stronger US dollar ahead of the Federal Reserve decision.
Indicative market snapshot; prices change quickly.
Support: $4,000, $3,975
Resistance: $4,035, $4,050
Bearish scenario: A clear break below $4,000 may lead to further downside.
Bullish scenario: A sustained move above $4,035 could support a recovery. #ThailandLaunchesWORPTStablecoinToQRPaymentApp #BitmineAdds10452ETH
238
·
--
Übersetzung ansehen
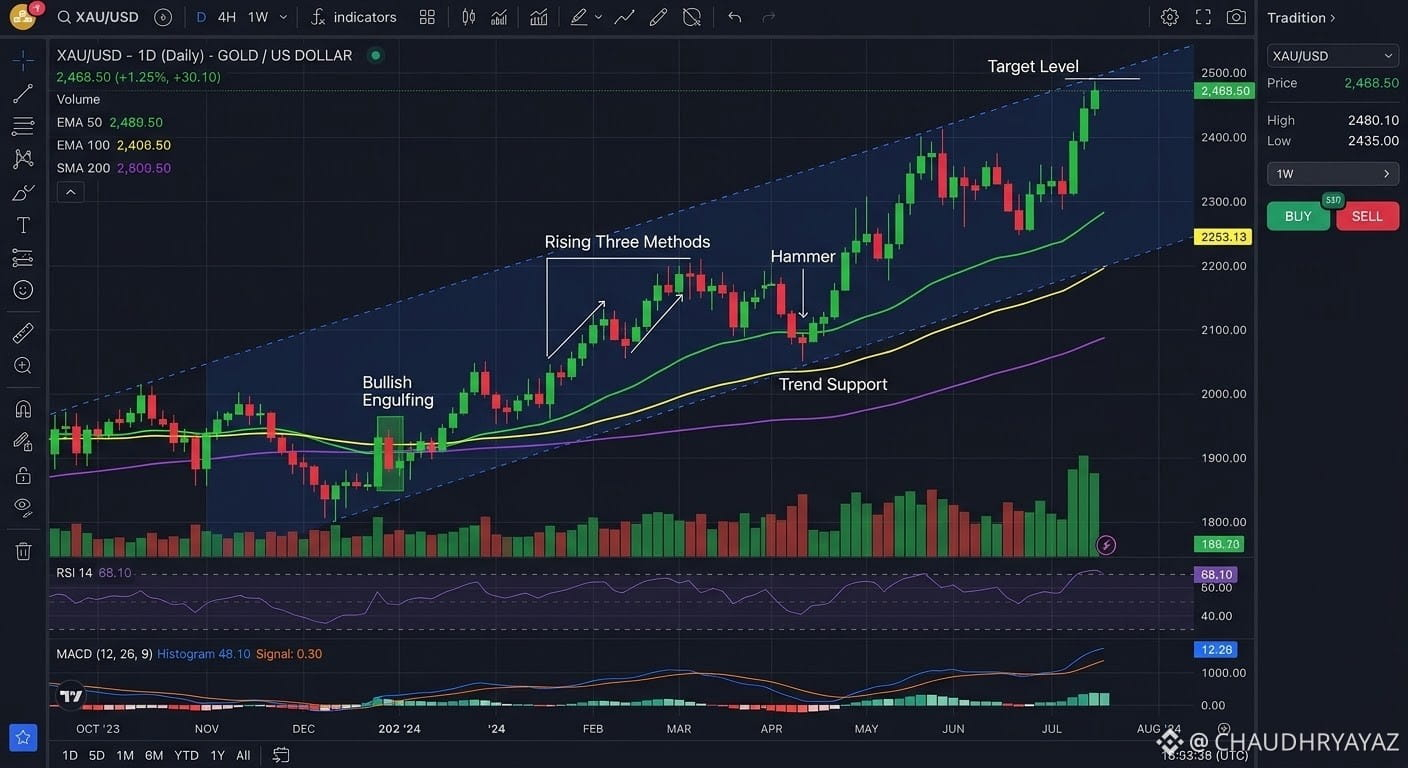
$XAUT XAU/USD Market Analysis: Gold Consolidates Near Key Support
Gold (XAU/USD) is navigating a crucial consolidation phase, holding near the $4,000–$4,015 psychological boundary as traders weigh macroeconomic factors and upcoming Federal Reserve policy expectations.
#FranklinTempletonFilesForTwoDividendToBitcoinETFs #AnthropicTTMRevenueGrewAbout1200%
{spot}(XAUTUSDT)
$XAUT XAU/USD Market Analysis: Gold Consolidates Near Key Support
Gold (XAU/USD) is navigating a crucial consolidation phase, holding near the $4,000–$4,015 psychological boundary as traders weigh macroeconomic factors and upcoming Federal Reserve policy expectations.
#FranklinTempletonFilesForTwoDividendToBitcoinETFs #AnthropicTTMRevenueGrewAbout1200%
Gold (XAU/USD) is navigating a crucial consolidation phase, holding near the $4,000–$4,015 psychological boundary as traders weigh macroeconomic factors and upcoming Federal Reserve policy expectations.
#FranklinTempletonFilesForTwoDividendToBitcoinETFs #AnthropicTTMRevenueGrewAbout1200%
213
·
--
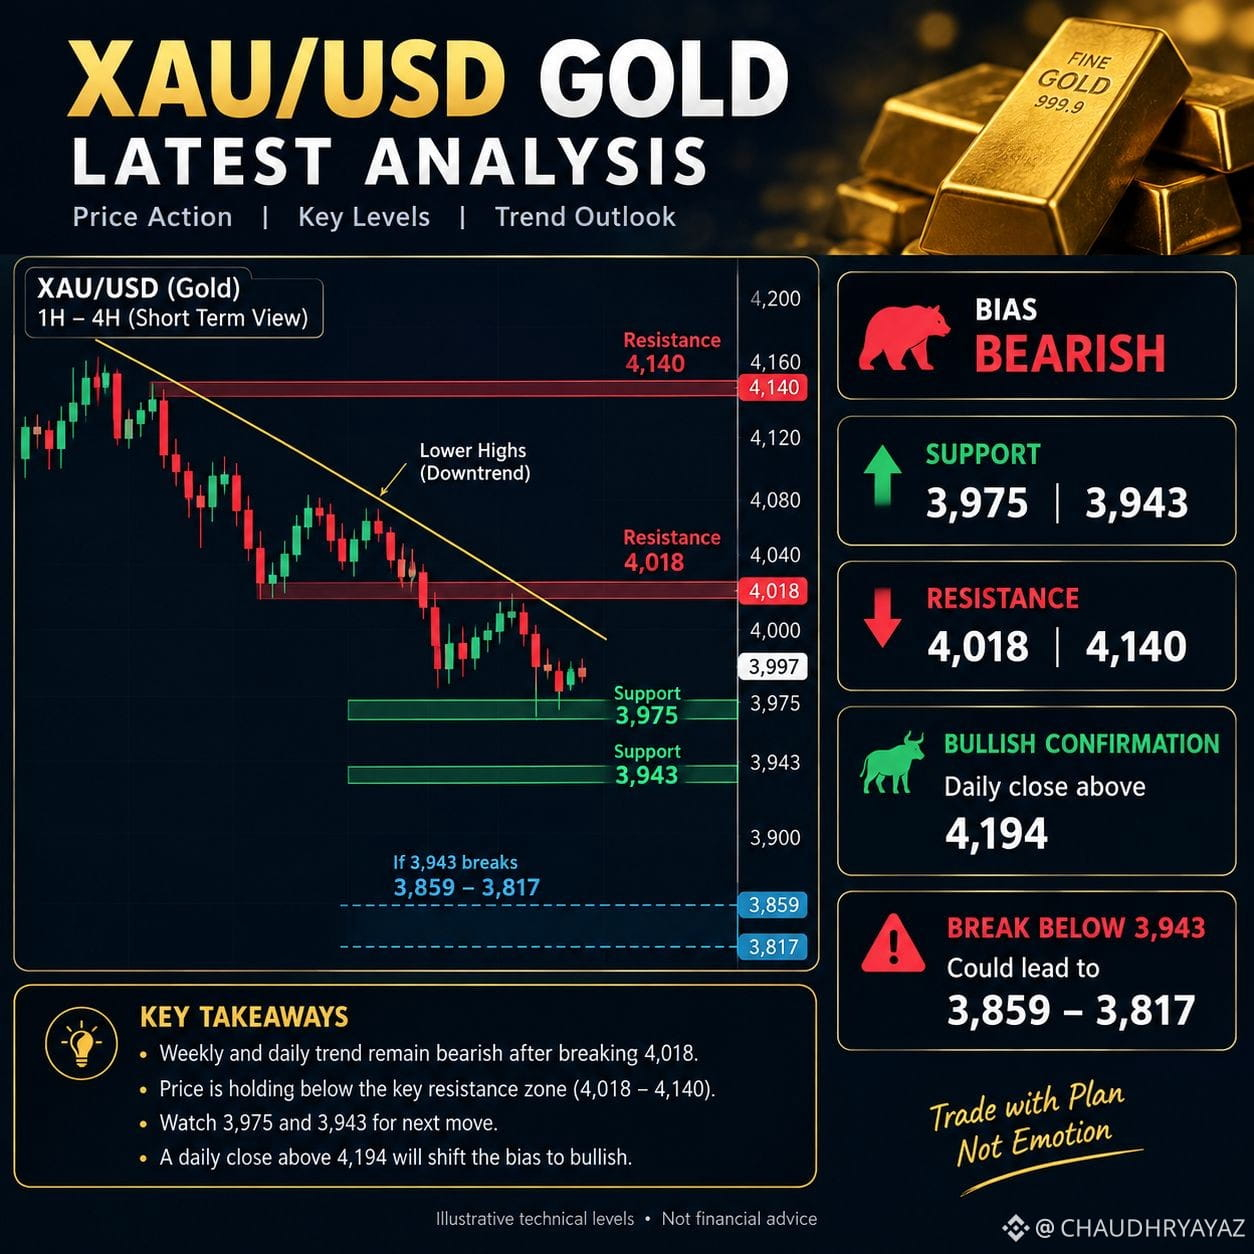
$XAU Unterstützung 2: 3.943 $
Untere Ziele: 3.859–3.817 $
Handelsausblick
Verkaufsszenario: Ein bestätigter Durchbruch unter 3.943 $ könnte den Weg in Richtung 3.859–3.817 $ ebnen.
Kaufszenario: Eine Erholung über 4.018 $ könnte auf eine kurzfristige Gegenbewegung hindeuten. Ein Tagesschlusskurs über 4.194 $ wäre eine stärkere bullische Bestätigung.
Tendenz: Bärisch, bis der Kurs eine überzeugende Erholung zeigt.
Meine Einschätzung: Vermeiden Sie es, nach einem starken Kursrückgang einem Trade hinterherzujagen. Warten Sie auf eine Bestätigung durch die Kursentwicklung und verwenden Sie einen Stop-Loss. Dies sind technische Niveaus, keine garantierten Kursziele.#ElectrumFixesHighRiskExploitInVersionsBefore4.8.3 #USQ3GDPAndSeptemberPCEDueNextWeek
{future}(XAUTUSDT)
$XAU Unterstützung 2: 3.943 $
Untere Ziele: 3.859–3.817 $
Handelsausblick
Verkaufsszenario: Ein bestätigter Durchbruch unter 3.943 $ könnte den Weg in Richtung 3.859–3.817 $ ebnen.
Kaufszenario: Eine Erholung über 4.018 $ könnte auf eine kurzfristige Gegenbewegung hindeuten. Ein Tagesschlusskurs über 4.194 $ wäre eine stärkere bullische Bestätigung.
Tendenz: Bärisch, bis der Kurs eine überzeugende Erholung zeigt.
Meine Einschätzung: Vermeiden Sie es, nach einem starken Kursrückgang einem Trade hinterherzujagen. Warten Sie auf eine Bestätigung durch die Kursentwicklung und verwenden Sie einen Stop-Loss. Dies sind technische Niveaus, keine garantierten Kursziele.#ElectrumFixesHighRiskExploitInVersionsBefore4.8.3 #USQ3GDPAndSeptemberPCEDueNextWeek
381
·
--
Übersetzung ansehen
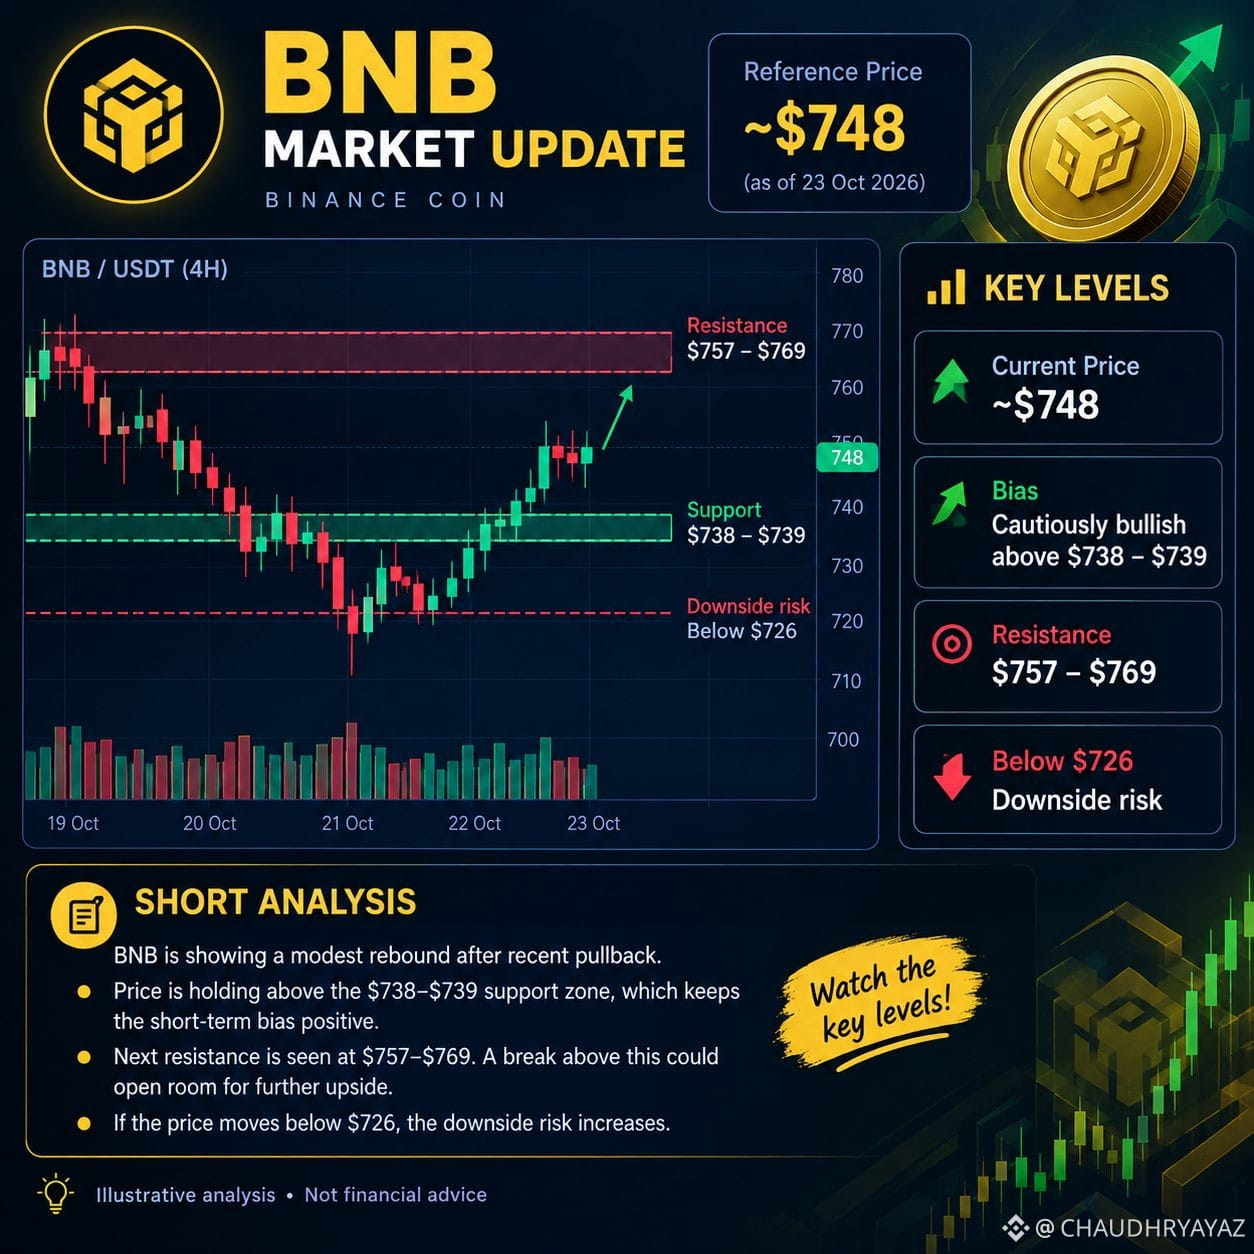
$BNB BNB is showing a possible bullish rebound, with price near $748 in the latest reference data.
Reference price: ~$748
Support: $738–$739
Resistance: $757–$769
Bullish target: A confirmed breakout above $757 could open the way toward higher levels.
Bearish risk: A drop below $726 could signal further weakness.
Market bias: Cautiously bullish above support. Wait for confirmation before entering a trade.
Note: These are reference levels, not a verified live Binance quote. This is not financial advice.#OCCRemovesStablecoinSevenDayRedemptionExtension #MarketsPriceJust10%ChanceOfFedHikeNextWeek
{spot}(BNBUSDT)
$BNB BNB is showing a possible bullish rebound, with price near $748 in the latest reference data.
Reference price: ~$748
Support: $738–$739
Resistance: $757–$769
Bullish target: A confirmed breakout above $757 could open the way toward higher levels.
Bearish risk: A drop below $726 could signal further weakness.
Market bias: Cautiously bullish above support. Wait for confirmation before entering a trade.
Note: These are reference levels, not a verified live Binance quote. This is not financial advice.#OCCRemovesStablecoinSevenDayRedemptionExtension #MarketsPriceJust10%ChanceOfFedHikeNextWeek
28
·
--
Übersetzung ansehen
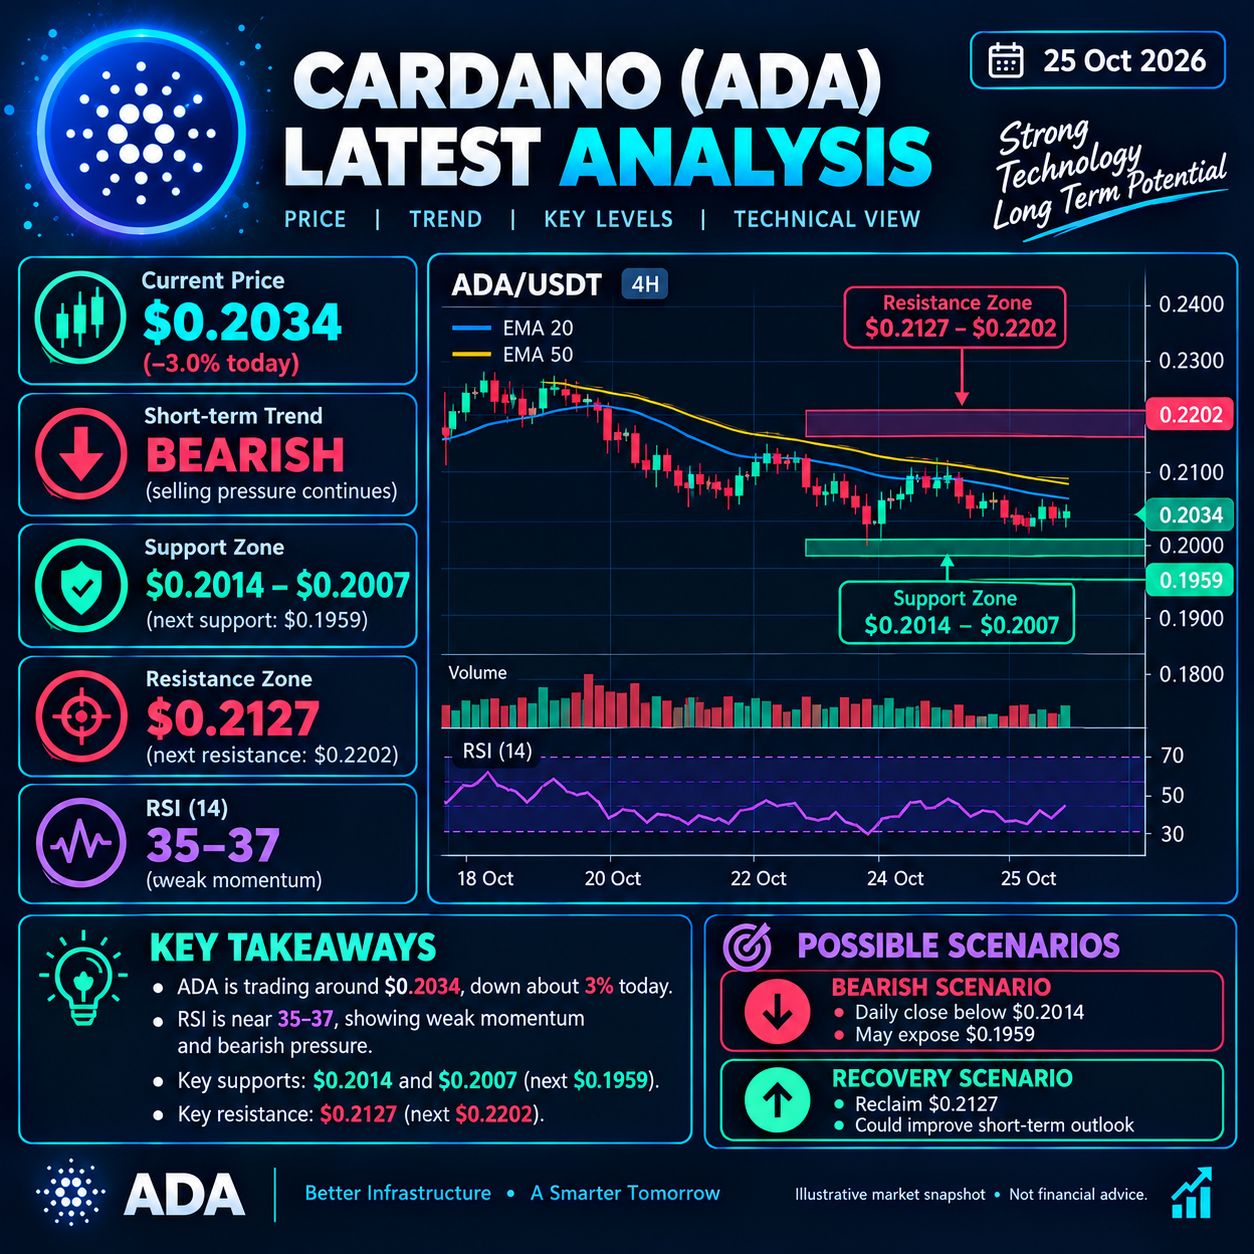
$ADA Reference price $0.2034
24-hour change −3.0%
Short-term trend
Support
$0.2014–$0.2007
Next: $0.1959
Resistance
$0.2127
Next: $0.2202
Market outlook: ADA is under selling pressure, with RSI near 35 indicating weak momentum.
🟢 Bullish: Reclaim $0.2127 to improve the short-term outlook.
🔴 Bearish: A break below $0.2007 could expose $0.1959.
⚠️ Strategy: Wait for confirmation before entering a trade.
Price is an indicative market snapshot, not a guaranteed live quote. Educational purposes only; not financial advice.#OCCRemovesStablecoinSevenDayRedemptionExtension #DowDrops653Points
{spot}(ADAUSDT)
$ADA Reference price $0.2034
24-hour change −3.0%
Short-term trend
Support
$0.2014–$0.2007
Next: $0.1959
Resistance
$0.2127
Next: $0.2202
Market outlook: ADA is under selling pressure, with RSI near 35 indicating weak momentum.
🟢 Bullish: Reclaim $0.2127 to improve the short-term outlook.
🔴 Bearish: A break below $0.2007 could expose $0.1959.
⚠️ Strategy: Wait for confirmation before entering a trade.
Price is an indicative market snapshot, not a guaranteed live quote. Educational purposes only; not financial advice.#OCCRemovesStablecoinSevenDayRedemptionExtension #DowDrops653Points
85
·
--
Übersetzung ansehen
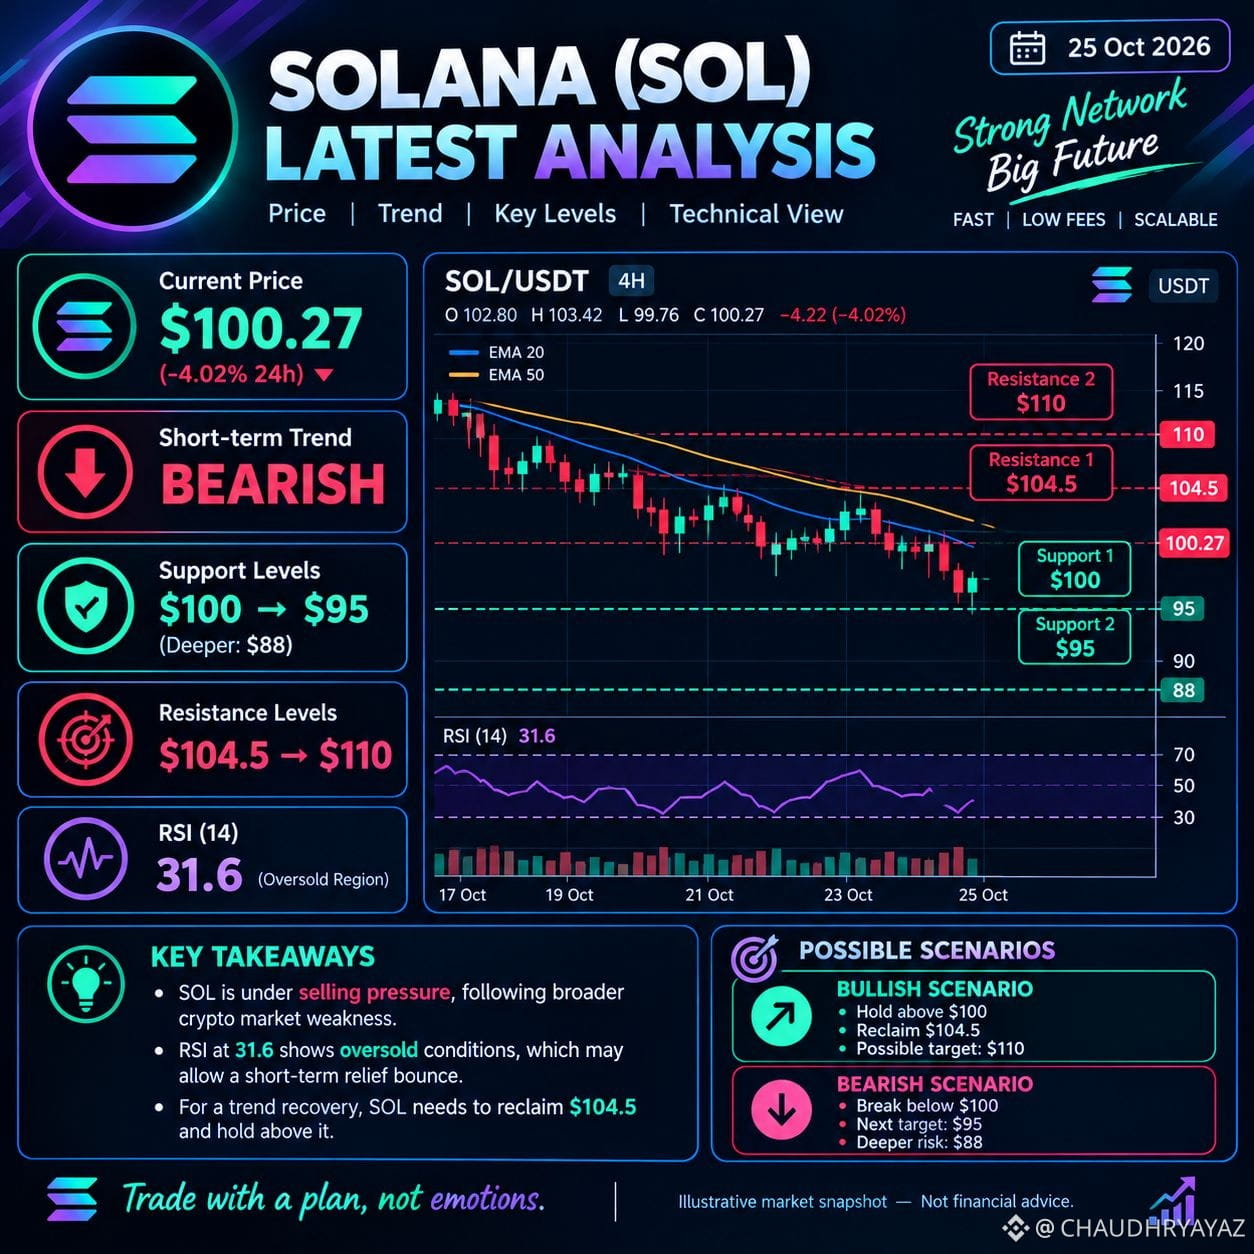
$SOL 24-hour change −4.02%
Short-term trend
Support
$100 / $95
Resistance
$104.50 / $110
Market outlook: SOL is under selling pressure. RSI is around 32, indicating potentially oversold conditions, but the trend remains weak.
🟢 Bullish: Hold $100 and reclaim $104.50; $110 is the next level to watch.
🔴 Bearish: Break below $100 could expose $95, with $88 as a deeper downside level.
⚠️ Strategy: Wait for confirmation and avoid high leverage.
Price is a recent reference, not a guaranteed live quote. Educational purposes only; not financial advice.#DowDrops653Points #PepeJumps14%ToLeadAltcoinRebound
{spot}(SOLUSDT)
$SOL 24-hour change −4.02%
Short-term trend
Support
$100 / $95
Resistance
$104.50 / $110
Market outlook: SOL is under selling pressure. RSI is around 32, indicating potentially oversold conditions, but the trend remains weak.
🟢 Bullish: Hold $100 and reclaim $104.50; $110 is the next level to watch.
🔴 Bearish: Break below $100 could expose $95, with $88 as a deeper downside level.
⚠️ Strategy: Wait for confirmation and avoid high leverage.
Price is a recent reference, not a guaranteed live quote. Educational purposes only; not financial advice.#DowDrops653Points #PepeJumps14%ToLeadAltcoinRebound
133
·
--
Übersetzung ansehen
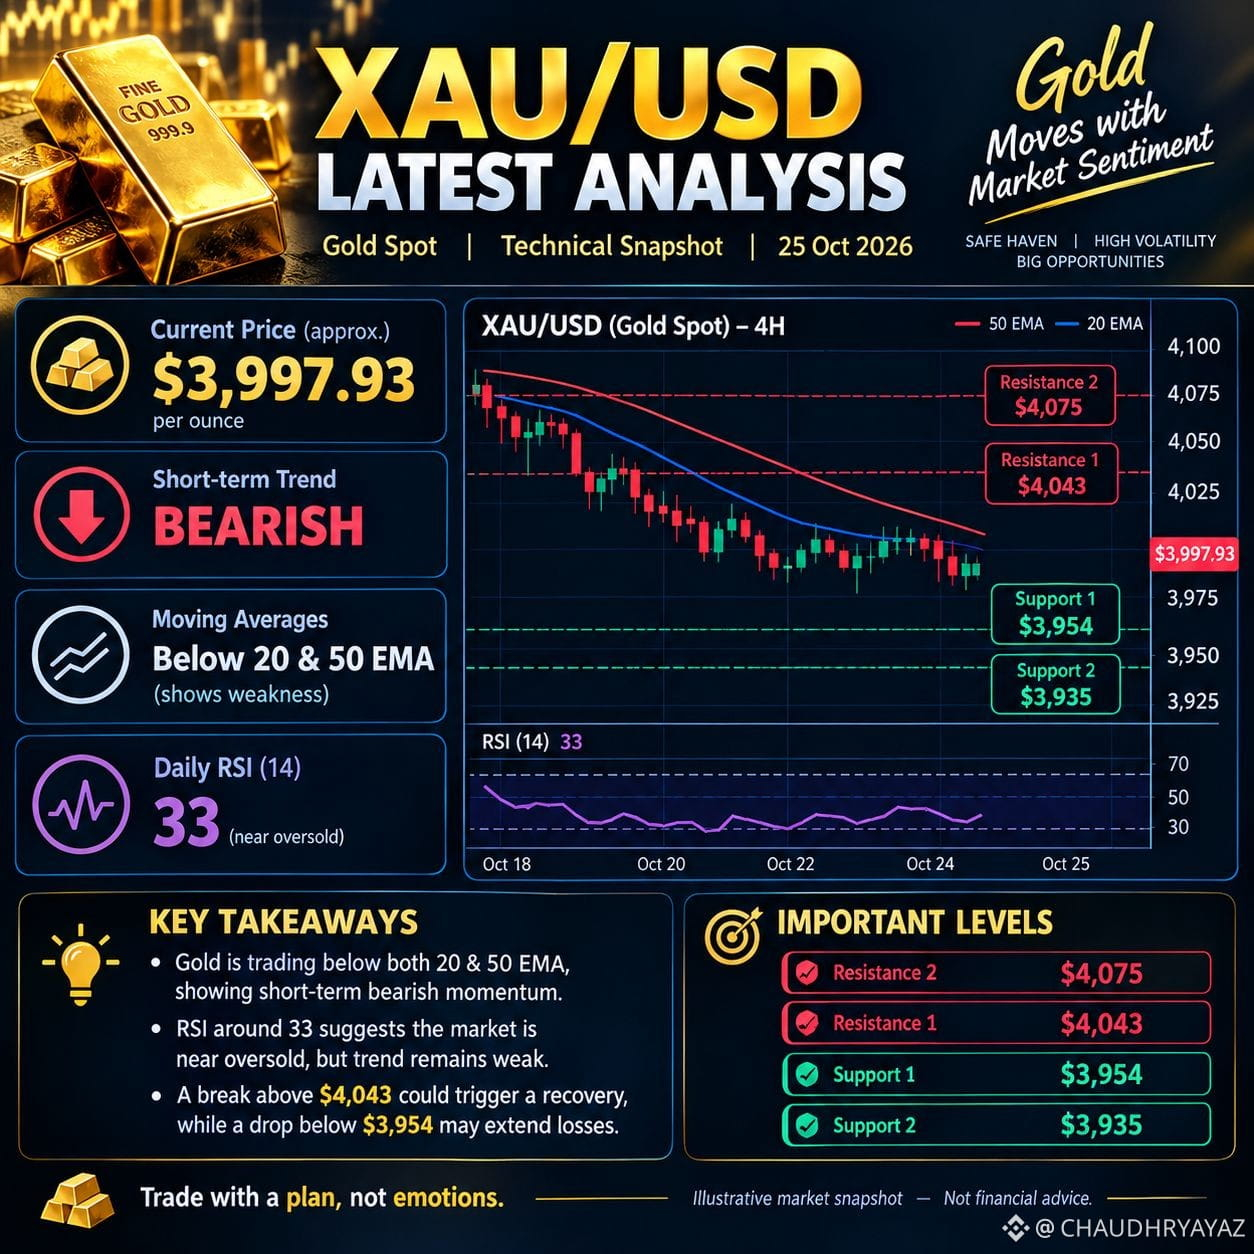
$XAUT
Approx. price $3,997.93
Short-term trend
Support
$3,954
Next: $3,935
Resistance
$4,043
Next: $4,075
Market outlook: Gold is showing bearish momentum and trading below key moving averages. RSI is near 33, suggesting weak momentum and potentially oversold conditions.
Bullish scenario: A break above $4,043 may support a recovery.
Bearish scenario: A break below $3,954 may open the way toward $3,935.
Trading tip: Wait for confirmation before entering a trade.
Price is an indicative market snapshot, not a guaranteed live quote. Educational purposes only; not financial advice.#IRSPlansLowerTaxDisclosurePenaltiesForCryptoCases #MarketsPriceJust10%ChanceOfFedHikeNextWeek
{spot}(XAUTUSDT)
$XAUT
Approx. price $3,997.93
Short-term trend
Support
$3,954
Next: $3,935
Resistance
$4,043
Next: $4,075
Market outlook: Gold is showing bearish momentum and trading below key moving averages. RSI is near 33, suggesting weak momentum and potentially oversold conditions.
Bullish scenario: A break above $4,043 may support a recovery.
Bearish scenario: A break below $3,954 may open the way toward $3,935.
Trading tip: Wait for confirmation before entering a trade.
Price is an indicative market snapshot, not a guaranteed live quote. Educational purposes only; not financial advice.#IRSPlansLowerTaxDisclosurePenaltiesForCryptoCases #MarketsPriceJust10%ChanceOfFedHikeNextWeek
308
·
--
Übersetzung ansehen
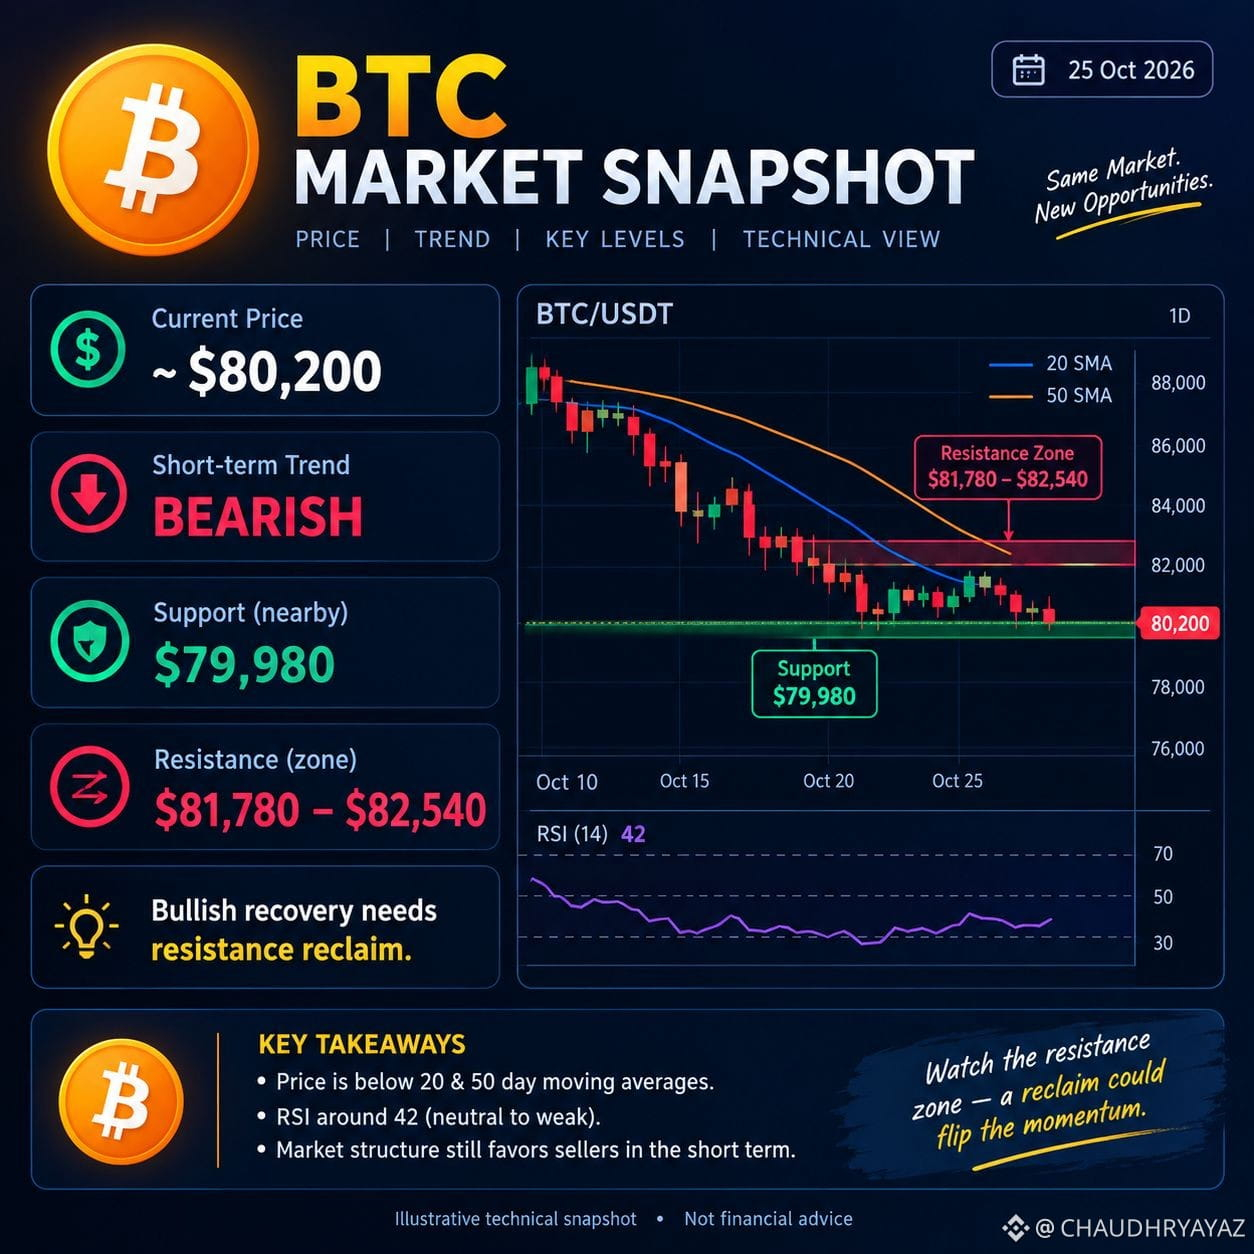
$BTC Current price $80,200
Market trend
Support
$79,980
Resistance zone
$81,780–$82,540
Technical outlook: BTC is showing short-term weakness, with momentum indicators favoring sellers. A break below $79,980 could bring further downside, while a recovery above $82,540 may strengthen bullish momentum.
Bullish scenario: BTC reclaims $82,540 with strong volume.
Bearish scenario: BTC breaks below $79,980.
Strategy: Wait for breakout confirmation; avoid risky leverage.
Note: Price levels are approximate and can change quickly. This is educational analysis, not financial advice.#OCCRemovesStablecoinSevenDayRedemptionExtension #USConsumerSentimentHoldsAtSecondLowestOnRecord
{spot}(BTCUSDT)
$BTC Current price $80,200
Market trend
Support
$79,980
Resistance zone
$81,780–$82,540
Technical outlook: BTC is showing short-term weakness, with momentum indicators favoring sellers. A break below $79,980 could bring further downside, while a recovery above $82,540 may strengthen bullish momentum.
Bullish scenario: BTC reclaims $82,540 with strong volume.
Bearish scenario: BTC breaks below $79,980.
Strategy: Wait for breakout confirmation; avoid risky leverage.
Note: Price levels are approximate and can change quickly. This is educational analysis, not financial advice.#OCCRemovesStablecoinSevenDayRedemptionExtension #USConsumerSentimentHoldsAtSecondLowestOnRecord
94
·
--
Bullisch
Übersetzung ansehen
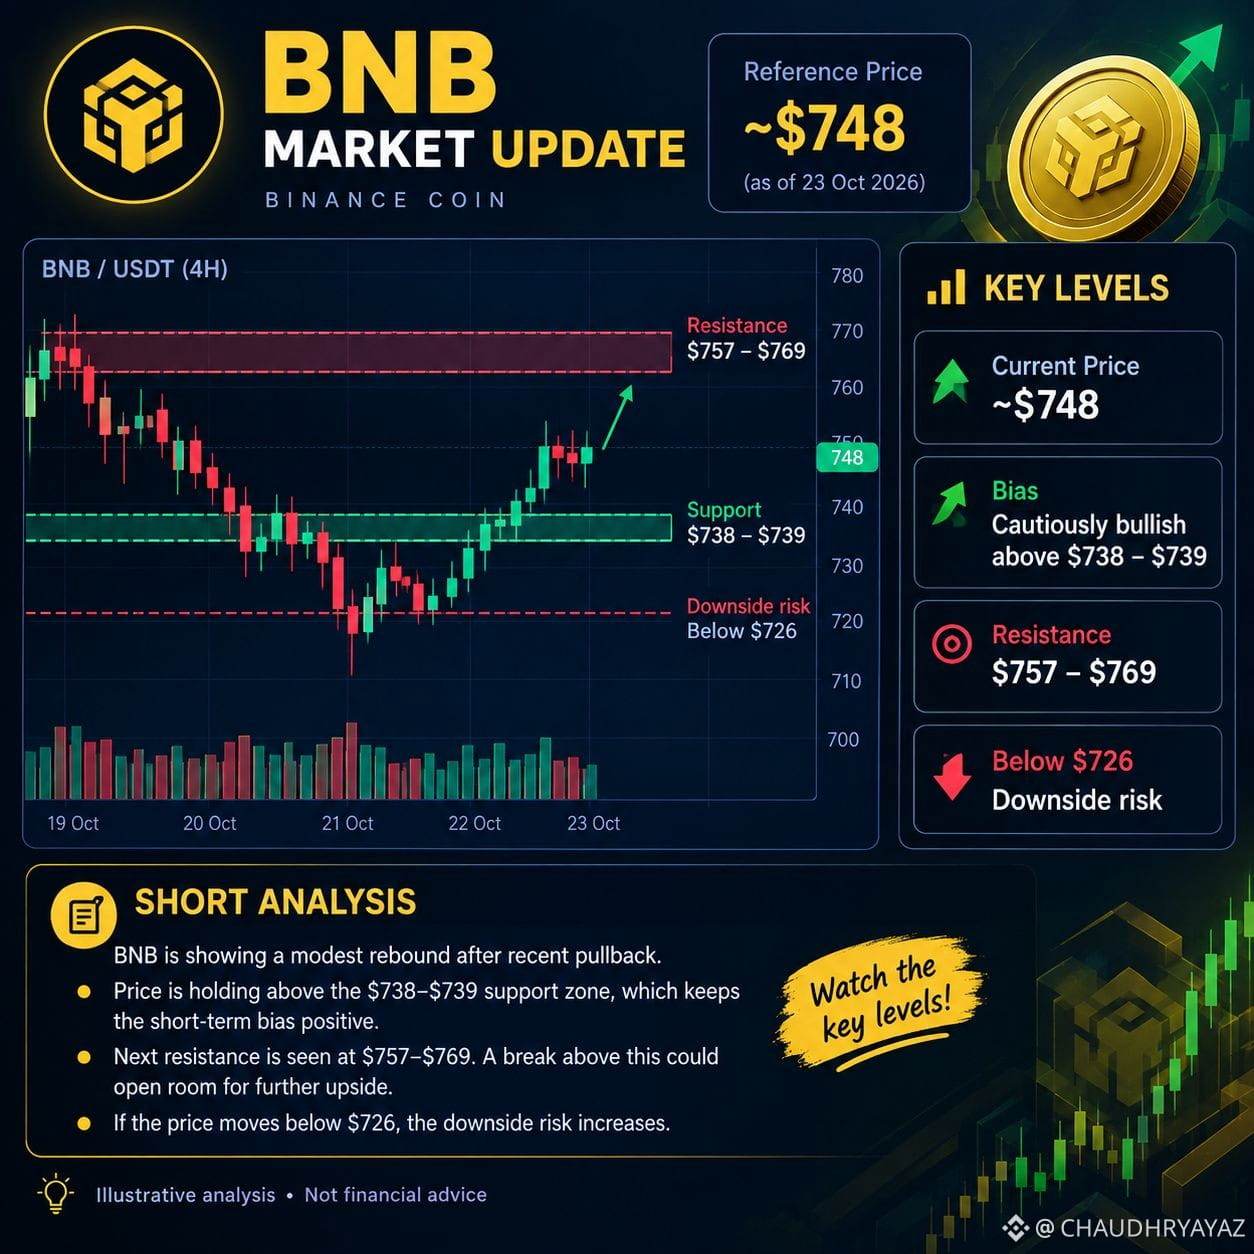
$BNB BNB Latest Market Analysis
Updated reference: October 24, 2026 · Binance Coin (BNB/USDT)
BNB is showing a possible bullish rebound, with price near $748 in the latest reference data.
Reference price: ~$748
Support: $738–$739
Resistance: $757–$769
Bullish target: A confirmed breakout above $757 could open the way toward higher levels.
Bearish risk: A drop below $726 could signal further weakness.
Market bias: Cautiously bullish above support. Wait for confirmation before entering a trade.
Note: These are reference levels, not a verified live Binance quote. This is not financial advice.#EthereumHoodiTestnetGlamsterdamHardForkDelayed #SwedishCentralBankUrgesEKronaReview
{spot}(BNBUSDT)
$BNB BNB Latest Market Analysis
Updated reference: October 24, 2026 · Binance Coin (BNB/USDT)
BNB is showing a possible bullish rebound, with price near $748 in the latest reference data.
Reference price: ~$748
Support: $738–$739
Resistance: $757–$769
Bullish target: A confirmed breakout above $757 could open the way toward higher levels.
Bearish risk: A drop below $726 could signal further weakness.
Market bias: Cautiously bullish above support. Wait for confirmation before entering a trade.
Note: These are reference levels, not a verified live Binance quote. This is not financial advice.#EthereumHoodiTestnetGlamsterdamHardForkDelayed #SwedishCentralBankUrgesEKronaReview
3
·
--
Übersetzung ansehen
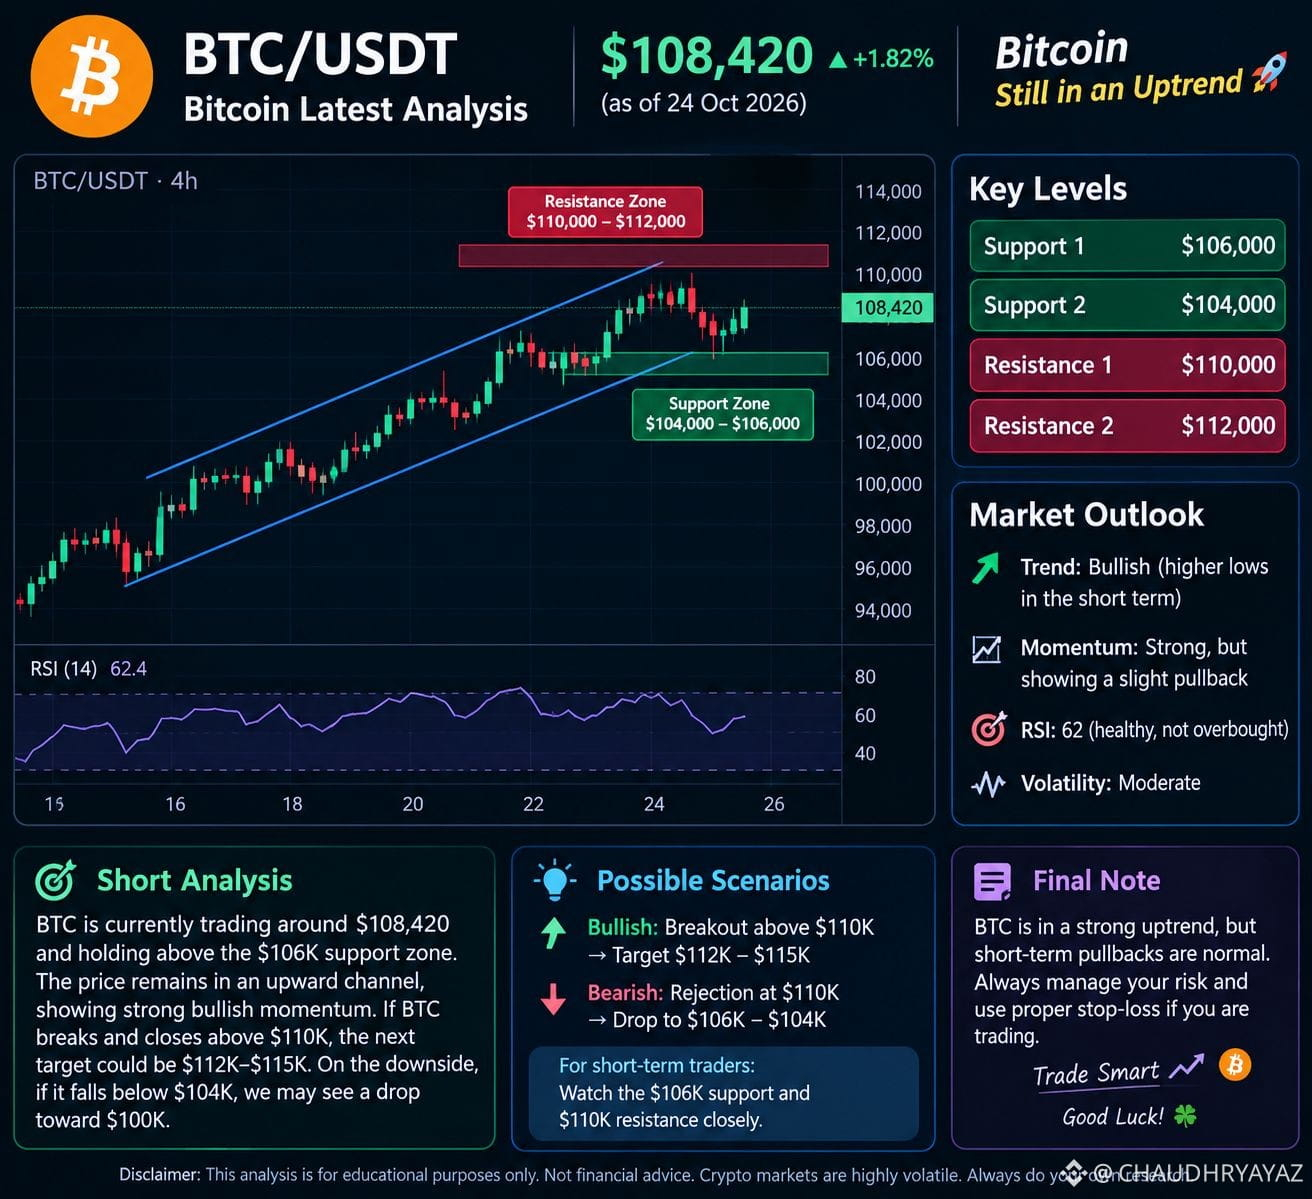
$BTC Key levels to watch
Support
$80,000–$81,000
Resistance
$83,000–$84,000
Bullish scenario: A confirmed breakout above $84,000 may open the way toward $86,000.
Bearish scenario: A break below $80,000 could bring further downside pressure.
📈 Trading view
Bias: Wait for confirmation.
Entry: Avoid chasing the price; watch support and breakout confirmation.
Risk management: Always set a stop-loss. These are potential scenarios, not guaranteed targets.
Educational analysis only, not financial advice. Crypto trading involves significant risk.#EthereumHoodiTestnetGlamsterdamHardForkDelayed #BinancePick
{spot}(BTCUSDT)
$BTC Key levels to watch
Support
$80,000–$81,000
Resistance
$83,000–$84,000
Bullish scenario: A confirmed breakout above $84,000 may open the way toward $86,000.
Bearish scenario: A break below $80,000 could bring further downside pressure.
📈 Trading view
Bias: Wait for confirmation.
Entry: Avoid chasing the price; watch support and breakout confirmation.
Risk management: Always set a stop-loss. These are potential scenarios, not guaranteed targets.
Educational analysis only, not financial advice. Crypto trading involves significant risk.#EthereumHoodiTestnetGlamsterdamHardForkDelayed #BinancePick
1
153
·
--
Übersetzung ansehen
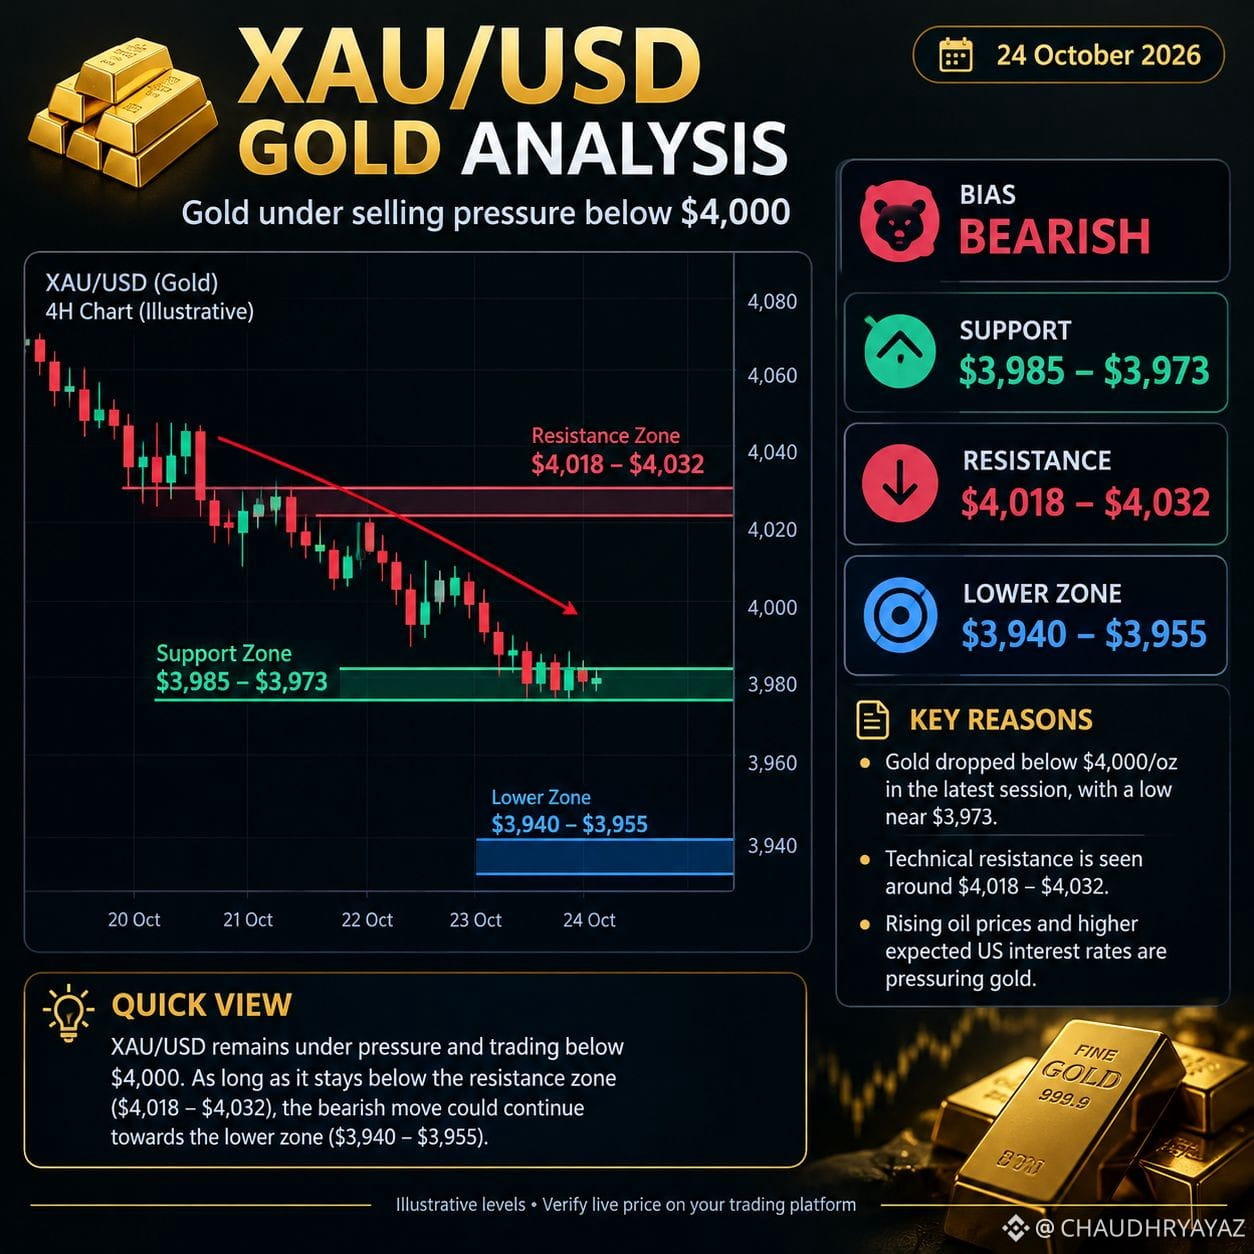
$XAU 24 October 2026 · Short-term outlook
Gold has faced heavy selling pressure, falling below the key $4,000/oz level on 23 October. Rising oil prices and expectations of higher US interest rates are weighing on gold.
Support: $3,985–$3,973
Resistance: $4,018–$4,032
Next downside area: $3,940–$3,955
Bias: Bearish while price stays below resistance.#EthereumHoodiTestnetGlamsterdamHardForkDelayed #BitcoinHashrateHitsSevenMonthHigh
{future}(XAUUSDT)
$XAU 24 October 2026 · Short-term outlook
Gold has faced heavy selling pressure, falling below the key $4,000/oz level on 23 October. Rising oil prices and expectations of higher US interest rates are weighing on gold.
Support: $3,985–$3,973
Resistance: $4,018–$4,032
Next downside area: $3,940–$3,955
Bias: Bearish while price stays below resistance.#EthereumHoodiTestnetGlamsterdamHardForkDelayed #BitcoinHashrateHitsSevenMonthHigh
137
Anmelden und weiter Inhalte entdecken
Krypto-Nutzer weltweit auf Binance Square kennenlernen
⚡️ Bleib in Sachen Krypto stets am Puls.
💬 Die weltgrößte Kryptobörse vertraut darauf.
👍 Erhalte verlässliche Einblicke von verifizierten Creators.
E-Mail-Adresse/Telefonnummer
Trendthemen
CanMicrosoftDeliverOnAI
459,332 Aufrufe
3,361 Kommentare
Berichtssaison, Session 3: Übertreffen Google und Microsoft die Gewinnerwartungen?
Binance Square Official
·148 Likes
·81.3k Aufrufe
CanGoogleDefindItsCore
284,170 Aufrufe
2,373 Kommentare
EarningsSeason
6M Aufrufe
29,486 Kommentare