
Ming Groby Ghtq
90 Beiträge

Ming Groby Ghtq
Melden
Nutzer blockieren
0 Following
7 Follower
11 Like gegeben
Beiträge
$MRNAB / USDT - Moderna
Preis: $247.87 | 24h: +7.25% | 30 Tage: +15.34%
Typ: bStocks tokenisierte Aktie | Contract: 0x5fd86da9b05abe396fe9d02a4a213a7c00556503
Was ist MRNAB?
MRNAB ist die tokenisierte Aktie von Moderna Inc. (MRNA) von bStocks. 1 MRNAB = Preis einer echten Moderna-Aktie. Jeder Token ist vollständig durch die zugrunde liegenden Aktien gedeckt, die bei einem von den US-Behörden regulierten Broker-Dealer verwahrt werden. Über die BNB Chain auf Binance handelbar. Teil des RWA-Narrativs (Real World Assets).
Technische Analyse:
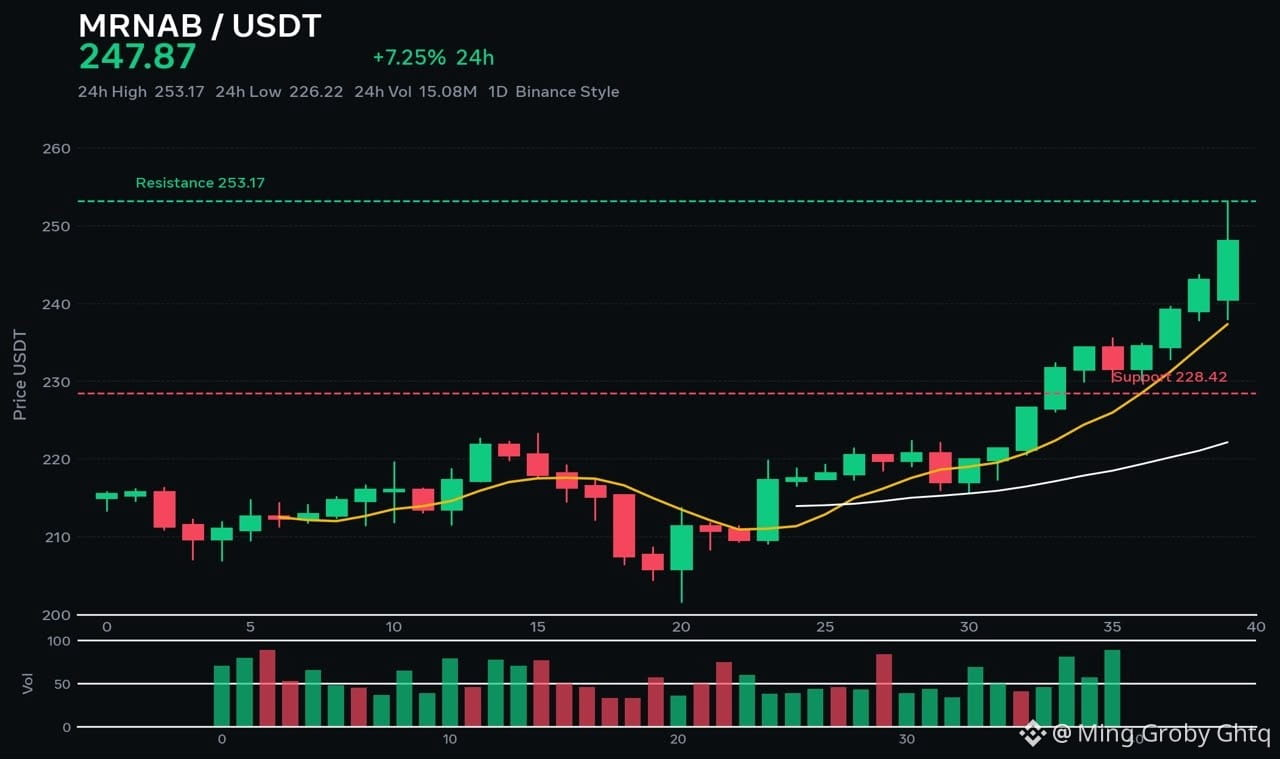
Der Preis liegt bei $247.87, starker Anstieg. 24h-Hoch: $253.17, 24h-Tief: $226.22. Der Trend ist stark bullisch. Volumen: $15.08M in 24h, Umsatz 10.30x – zweithöchster Wert im bStocks-Orderbuch, sehr hohe Aktivität. Unterstützung: $228.42, Widerstand: $253.17, Kursziel: $265.00, Stop-Loss: $225.00.
Bullische Faktoren:
✅ +7.25% in 24h, +15.34% in 30 Tagen – besser als die meisten bStocks
✅ 69% bullische Signale auf dem 1D-Chart – starke technische Indikatoren
✅ Durch ein echtes Unternehmen gedeckt – Moderna ist ein führendes Nasdaq-Biotechunternehmen
✅ Höchster Umsatz bei bStocks – Trader handeln MRNAB aktiv
✅ Biotech- und RWA-Narrativ – doppelter Katalysator
Risiken:
⚠️ Abhängig vom US-Aktienmarkt, kein Krypto-Pump
⚠️ Biotech-Volatilität – FDA-Nachrichten können den Kurs schnell abstürzen lassen
⚠️ Geringer Umlaufbestand von ∼10,792 Token – der Kurs kann sich schnell in beide Richtungen bewegen
Strategie: Am besten für Momentum-Trades geeignet. Beste Akkumulationszone bei einem Rücksetzer auf $230-$235. TP: $253.17 / $265.00, SL: $225.00. Bei einem Tagesschluss über $253.17 ist eine nächste Bewegung auf $265 - $280 möglich. Kein FOMO am Hoch – auf einen Rücksetzer oder einen Ausbruch mit Schlusskurs darüber warten.
{spot}(MRNABUSDT)
#ADPUSPrivateEmployersAdd86000JobsInOctober #USStocksOpenHigherAsDowGains1.9% #BinanceIncidentReport #AMDBeatsExpectations-AINarrativeContinues
$MRNAB / USDT - Moderna
Preis: $247.87 | 24h: +7.25% | 30 Tage: +15.34%
Typ: bStocks tokenisierte Aktie | Contract: 0x5fd86da9b05abe396fe9d02a4a213a7c00556503
Was ist MRNAB?
MRNAB ist die tokenisierte Aktie von Moderna Inc. (MRNA) von bStocks. 1 MRNAB = Preis einer echten Moderna-Aktie. Jeder Token ist vollständig durch die zugrunde liegenden Aktien gedeckt, die bei einem von den US-Behörden regulierten Broker-Dealer verwahrt werden. Über die BNB Chain auf Binance handelbar. Teil des RWA-Narrativs (Real World Assets).
Technische Analyse:
Der Preis liegt bei $247.87, starker Anstieg. 24h-Hoch: $253.17, 24h-Tief: $226.22. Der Trend ist stark bullisch. Volumen: $15.08M in 24h, Umsatz 10.30x – zweithöchster Wert im bStocks-Orderbuch, sehr hohe Aktivität. Unterstützung: $228.42, Widerstand: $253.17, Kursziel: $265.00, Stop-Loss: $225.00.
Bullische Faktoren:
✅ +7.25% in 24h, +15.34% in 30 Tagen – besser als die meisten bStocks
✅ 69% bullische Signale auf dem 1D-Chart – starke technische Indikatoren
✅ Durch ein echtes Unternehmen gedeckt – Moderna ist ein führendes Nasdaq-Biotechunternehmen
✅ Höchster Umsatz bei bStocks – Trader handeln MRNAB aktiv
✅ Biotech- und RWA-Narrativ – doppelter Katalysator
Risiken:
⚠️ Abhängig vom US-Aktienmarkt, kein Krypto-Pump
⚠️ Biotech-Volatilität – FDA-Nachrichten können den Kurs schnell abstürzen lassen
⚠️ Geringer Umlaufbestand von ∼10,792 Token – der Kurs kann sich schnell in beide Richtungen bewegen
Strategie: Am besten für Momentum-Trades geeignet. Beste Akkumulationszone bei einem Rücksetzer auf $230-$235. TP: $253.17 / $265.00, SL: $225.00. Bei einem Tagesschluss über $253.17 ist eine nächste Bewegung auf $265 - $280 möglich. Kein FOMO am Hoch – auf einen Rücksetzer oder einen Ausbruch mit Schlusskurs darüber warten.
#ADPUSPrivateEmployersAdd86000JobsInOctober #USStocksOpenHigherAsDowGains1.9% #BinanceIncidentReport #AMDBeatsExpectations-AINarrativeContinues
Preis: $247.87 | 24h: +7.25% | 30 Tage: +15.34%
Typ: bStocks tokenisierte Aktie | Contract: 0x5fd86da9b05abe396fe9d02a4a213a7c00556503
Was ist MRNAB?
MRNAB ist die tokenisierte Aktie von Moderna Inc. (MRNA) von bStocks. 1 MRNAB = Preis einer echten Moderna-Aktie. Jeder Token ist vollständig durch die zugrunde liegenden Aktien gedeckt, die bei einem von den US-Behörden regulierten Broker-Dealer verwahrt werden. Über die BNB Chain auf Binance handelbar. Teil des RWA-Narrativs (Real World Assets).
Technische Analyse:
Der Preis liegt bei $247.87, starker Anstieg. 24h-Hoch: $253.17, 24h-Tief: $226.22. Der Trend ist stark bullisch. Volumen: $15.08M in 24h, Umsatz 10.30x – zweithöchster Wert im bStocks-Orderbuch, sehr hohe Aktivität. Unterstützung: $228.42, Widerstand: $253.17, Kursziel: $265.00, Stop-Loss: $225.00.
Bullische Faktoren:
✅ +7.25% in 24h, +15.34% in 30 Tagen – besser als die meisten bStocks
✅ 69% bullische Signale auf dem 1D-Chart – starke technische Indikatoren
✅ Durch ein echtes Unternehmen gedeckt – Moderna ist ein führendes Nasdaq-Biotechunternehmen
✅ Höchster Umsatz bei bStocks – Trader handeln MRNAB aktiv
✅ Biotech- und RWA-Narrativ – doppelter Katalysator
Risiken:
⚠️ Abhängig vom US-Aktienmarkt, kein Krypto-Pump
⚠️ Biotech-Volatilität – FDA-Nachrichten können den Kurs schnell abstürzen lassen
⚠️ Geringer Umlaufbestand von ∼10,792 Token – der Kurs kann sich schnell in beide Richtungen bewegen
Strategie: Am besten für Momentum-Trades geeignet. Beste Akkumulationszone bei einem Rücksetzer auf $230-$235. TP: $253.17 / $265.00, SL: $225.00. Bei einem Tagesschluss über $253.17 ist eine nächste Bewegung auf $265 - $280 möglich. Kein FOMO am Hoch – auf einen Rücksetzer oder einen Ausbruch mit Schlusskurs darüber warten.
#ADPUSPrivateEmployersAdd86000JobsInOctober #USStocksOpenHigherAsDowGains1.9% #BinanceIncidentReport #AMDBeatsExpectations-AINarrativeContinues
35
$STX / USDT - Stacks |
Preis: $0.312 | 24 Std.: +3.43% | 7 Tage: +10.23%
Typ: Bitcoin-Layer-2 | Angebot: ∼1.58B STX
Was ist STX?
STX ist der native Token von Stacks, einer Layer-1-Blockchain, die DeFi, NFTs und Smart Contracts auf Bitcoin ermöglicht. Stacks bringt Smart Contracts zu Bitcoin, ohne Bitcoin selbst zu verändern. STX ist die führende Coin im Bitcoin-L2-Narrativ.
Technische Analyse:
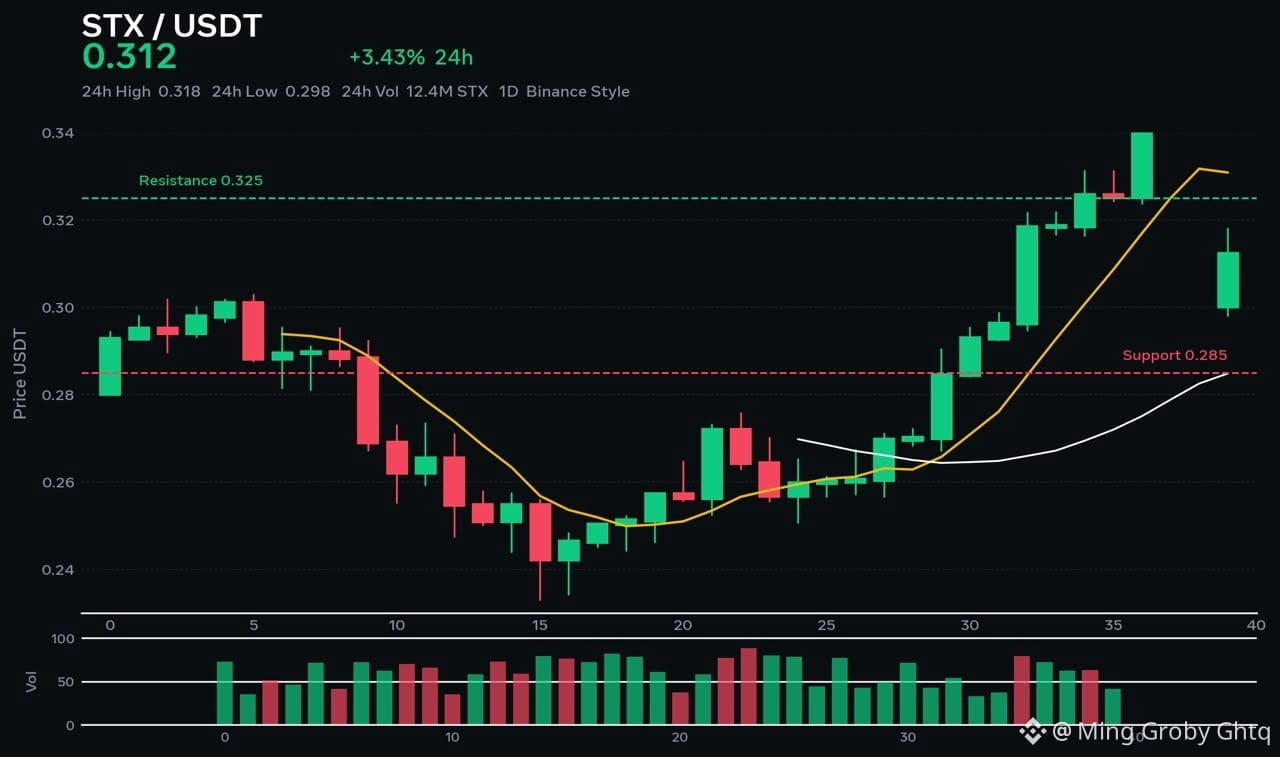
Der Preis liegt bei $0.312 und erholt sich vom Tiefststand von $0.298. 24-Stunden-Hoch: $0.318, 24-Stunden-Tief: $0.298. Der kurzfristige Trend ist bullisch. Volumen: $12.4M in 24 Stunden, Käufer kehren zurück. Unterstützung bei $0.285, Widerstand bei $0.325, Kursziel: $0.355, Stop-Loss: $0.275.
Bullische Argumente:
✅ +3.43% in 24 Stunden, +10.23% in 7 Tagen – Momentum baut sich auf
✅ Bitcoin-Narrativ – Wenn BTC steigt, steigt STX als führender Bitcoin-L2-Token stärker
✅ Echtes Produkt – sBTC, DeFi auf Bitcoin, Nakamoto-Upgrade
✅ Marktkapitalisierung ~ $498M – Im Vergleich zum ATH von $3.84 immer noch günstig, 91% unter dem ATH
✅ Starke Community – Eines der ältesten Bitcoin-Projekte
Risiken:
⚠️ Weiterhin volatil – In manchen Wochen ein Minus von 17%, starke Kursschwankungen
⚠️ Abhängigkeit von BTC – Wenn BTC abstürzt, fällt STX doppelt so schnell
⚠️ Starker Widerstand bei $0.325 – Ein Ausbruch mit hohem Volumen ist erforderlich
Strategie: Am besten für Swing-Trading geeignet. Beste Akkumulationszone bei einem Rücksetzer: $0.285-$0.295. TP: $0.325 / $0.355, SL: $0.275. Bei einem Tagesschlusskurs über $0.325 ist ein weiterer Anstieg auf $0.355 - $0.390 möglich.
{spot}(STXUSDT)
#AMDBeatsExpectations-AINarrativeContinues #ADPUSPrivateEmployersAdd86000JobsInOctober #USStocksOpenHigherAsDowGains1.9%
$STX / USDT - Stacks |
Preis: $0.312 | 24 Std.: +3.43% | 7 Tage: +10.23%
Typ: Bitcoin-Layer-2 | Angebot: ∼1.58B STX
Was ist STX?
STX ist der native Token von Stacks, einer Layer-1-Blockchain, die DeFi, NFTs und Smart Contracts auf Bitcoin ermöglicht. Stacks bringt Smart Contracts zu Bitcoin, ohne Bitcoin selbst zu verändern. STX ist die führende Coin im Bitcoin-L2-Narrativ.
Technische Analyse:
Der Preis liegt bei $0.312 und erholt sich vom Tiefststand von $0.298. 24-Stunden-Hoch: $0.318, 24-Stunden-Tief: $0.298. Der kurzfristige Trend ist bullisch. Volumen: $12.4M in 24 Stunden, Käufer kehren zurück. Unterstützung bei $0.285, Widerstand bei $0.325, Kursziel: $0.355, Stop-Loss: $0.275.
Bullische Argumente:
✅ +3.43% in 24 Stunden, +10.23% in 7 Tagen – Momentum baut sich auf
✅ Bitcoin-Narrativ – Wenn BTC steigt, steigt STX als führender Bitcoin-L2-Token stärker
✅ Echtes Produkt – sBTC, DeFi auf Bitcoin, Nakamoto-Upgrade
✅ Marktkapitalisierung ~ $498M – Im Vergleich zum ATH von $3.84 immer noch günstig, 91% unter dem ATH
✅ Starke Community – Eines der ältesten Bitcoin-Projekte
Risiken:
⚠️ Weiterhin volatil – In manchen Wochen ein Minus von 17%, starke Kursschwankungen
⚠️ Abhängigkeit von BTC – Wenn BTC abstürzt, fällt STX doppelt so schnell
⚠️ Starker Widerstand bei $0.325 – Ein Ausbruch mit hohem Volumen ist erforderlich
Strategie: Am besten für Swing-Trading geeignet. Beste Akkumulationszone bei einem Rücksetzer: $0.285-$0.295. TP: $0.325 / $0.355, SL: $0.275. Bei einem Tagesschlusskurs über $0.325 ist ein weiterer Anstieg auf $0.355 - $0.390 möglich.
#AMDBeatsExpectations-AINarrativeContinues #ADPUSPrivateEmployersAdd86000JobsInOctober #USStocksOpenHigherAsDowGains1.9%
Preis: $0.312 | 24 Std.: +3.43% | 7 Tage: +10.23%
Typ: Bitcoin-Layer-2 | Angebot: ∼1.58B STX
Was ist STX?
STX ist der native Token von Stacks, einer Layer-1-Blockchain, die DeFi, NFTs und Smart Contracts auf Bitcoin ermöglicht. Stacks bringt Smart Contracts zu Bitcoin, ohne Bitcoin selbst zu verändern. STX ist die führende Coin im Bitcoin-L2-Narrativ.
Technische Analyse:
Der Preis liegt bei $0.312 und erholt sich vom Tiefststand von $0.298. 24-Stunden-Hoch: $0.318, 24-Stunden-Tief: $0.298. Der kurzfristige Trend ist bullisch. Volumen: $12.4M in 24 Stunden, Käufer kehren zurück. Unterstützung bei $0.285, Widerstand bei $0.325, Kursziel: $0.355, Stop-Loss: $0.275.
Bullische Argumente:
✅ +3.43% in 24 Stunden, +10.23% in 7 Tagen – Momentum baut sich auf
✅ Bitcoin-Narrativ – Wenn BTC steigt, steigt STX als führender Bitcoin-L2-Token stärker
✅ Echtes Produkt – sBTC, DeFi auf Bitcoin, Nakamoto-Upgrade
✅ Marktkapitalisierung ~ $498M – Im Vergleich zum ATH von $3.84 immer noch günstig, 91% unter dem ATH
✅ Starke Community – Eines der ältesten Bitcoin-Projekte
Risiken:
⚠️ Weiterhin volatil – In manchen Wochen ein Minus von 17%, starke Kursschwankungen
⚠️ Abhängigkeit von BTC – Wenn BTC abstürzt, fällt STX doppelt so schnell
⚠️ Starker Widerstand bei $0.325 – Ein Ausbruch mit hohem Volumen ist erforderlich
Strategie: Am besten für Swing-Trading geeignet. Beste Akkumulationszone bei einem Rücksetzer: $0.285-$0.295. TP: $0.325 / $0.355, SL: $0.275. Bei einem Tagesschlusskurs über $0.325 ist ein weiterer Anstieg auf $0.355 - $0.390 möglich.
#AMDBeatsExpectations-AINarrativeContinues #ADPUSPrivateEmployersAdd86000JobsInOctober #USStocksOpenHigherAsDowGains1.9%
33
Übersetzung ansehen
$BONK / USDT - BondX |
Price: $0.003774 | 24h: -1.24% | Type: Low Cap DeFi
Type: DeFi Bond Token on BNB Chain | Supply: 3.00B BNX
What is BONX?
BONX / BondX is a DeFi project focused on bond issuance and trading on blockchain. It aims to simplify creating, buying, and selling bonds on-chain, making bond market accessible to everyone. It is a very low-cap, high-risk token on BNB Chain.
Technical Analysis:
Price is $0.003774. 24h High $0.003985, 24h Low $0.003501. Trend is Sideways / Weak. Volume is very low - $84.91 only in 24h on tracked exchanges, which means this coin is illiquid. Support $0.00350, Resistance $0.00398, Target $0.00450, Stop Loss $0.00320.
Bullish Points:
✅ Real use-case - On-chain bonds is a strong RWA narrative
✅ Very low price - Small money can move price fast
✅ BNB Chain ecosystem - Easy to trade on PancakeSwap
Risks:
⚠️ VERY LOW LIQUIDITY - $84 volume only, you may not be able to sell
⚠️ Contract risk - Creator can change contract, mint, change fees - High caution
⚠️ Not trading on any trusted major exchange - No Binance / Coinbase listing
⚠️ Down -100% from ATH $5.00 - Heavy bag holders above
Strategy: This is NOT for big money. Only for very small risk capital. Best accumulation zone $0.00350-$0.00360. TP: $0.00398 / $0.00450, SL: $0.00320. Do NOT FOMO. If volume does not increase, stay away.
{spot}(BONKUSDT)
#AMDBeatsExpectations-AINarrativeContinues #USOctoberNFP-AreRateCutsStillPossible #USMidterms-WhatAreMarketsExpecting?
$BONK / USDT - BondX |
Price: $0.003774 | 24h: -1.24% | Type: Low Cap DeFi
Type: DeFi Bond Token on BNB Chain | Supply: 3.00B BNX
What is BONX?
BONX / BondX is a DeFi project focused on bond issuance and trading on blockchain. It aims to simplify creating, buying, and selling bonds on-chain, making bond market accessible to everyone. It is a very low-cap, high-risk token on BNB Chain.
Technical Analysis:
Price is $0.003774. 24h High $0.003985, 24h Low $0.003501. Trend is Sideways / Weak. Volume is very low - $84.91 only in 24h on tracked exchanges, which means this coin is illiquid. Support $0.00350, Resistance $0.00398, Target $0.00450, Stop Loss $0.00320.
Bullish Points:
✅ Real use-case - On-chain bonds is a strong RWA narrative
✅ Very low price - Small money can move price fast
✅ BNB Chain ecosystem - Easy to trade on PancakeSwap
Risks:
⚠️ VERY LOW LIQUIDITY - $84 volume only, you may not be able to sell
⚠️ Contract risk - Creator can change contract, mint, change fees - High caution
⚠️ Not trading on any trusted major exchange - No Binance / Coinbase listing
⚠️ Down -100% from ATH $5.00 - Heavy bag holders above
Strategy: This is NOT for big money. Only for very small risk capital. Best accumulation zone $0.00350-$0.00360. TP: $0.00398 / $0.00450, SL: $0.00320. Do NOT FOMO. If volume does not increase, stay away.
#AMDBeatsExpectations-AINarrativeContinues #USOctoberNFP-AreRateCutsStillPossible #USMidterms-WhatAreMarketsExpecting?
Price: $0.003774 | 24h: -1.24% | Type: Low Cap DeFi
Type: DeFi Bond Token on BNB Chain | Supply: 3.00B BNX
What is BONX?
BONX / BondX is a DeFi project focused on bond issuance and trading on blockchain. It aims to simplify creating, buying, and selling bonds on-chain, making bond market accessible to everyone. It is a very low-cap, high-risk token on BNB Chain.
Technical Analysis:
Price is $0.003774. 24h High $0.003985, 24h Low $0.003501. Trend is Sideways / Weak. Volume is very low - $84.91 only in 24h on tracked exchanges, which means this coin is illiquid. Support $0.00350, Resistance $0.00398, Target $0.00450, Stop Loss $0.00320.
Bullish Points:
✅ Real use-case - On-chain bonds is a strong RWA narrative
✅ Very low price - Small money can move price fast
✅ BNB Chain ecosystem - Easy to trade on PancakeSwap
Risks:
⚠️ VERY LOW LIQUIDITY - $84 volume only, you may not be able to sell
⚠️ Contract risk - Creator can change contract, mint, change fees - High caution
⚠️ Not trading on any trusted major exchange - No Binance / Coinbase listing
⚠️ Down -100% from ATH $5.00 - Heavy bag holders above
Strategy: This is NOT for big money. Only for very small risk capital. Best accumulation zone $0.00350-$0.00360. TP: $0.00398 / $0.00450, SL: $0.00320. Do NOT FOMO. If volume does not increase, stay away.
#AMDBeatsExpectations-AINarrativeContinues #USOctoberNFP-AreRateCutsStillPossible #USMidterms-WhatAreMarketsExpecting?
$CAKE / USDT - PancakeSwap |
Preis: $2.0122 | 24 Std.: +7.78% | 7 Tage: -2.63%
Typ: DEX auf BNB Chain | Angebot: ∼339M CAKE / Max. 400M
Was ist CAKE?
CAKE ist der native Governance- und Utility-Token von PancakeSwap, der größten DEX auf BNB Chain. PancakeSwap ist ein AMM, das Swaps, Farming, Staking, Lotterien und IFOs ermöglicht. Seit 2020 bildet es das Rückgrat von DeFi auf BNB Chain.
Technische Analyse:
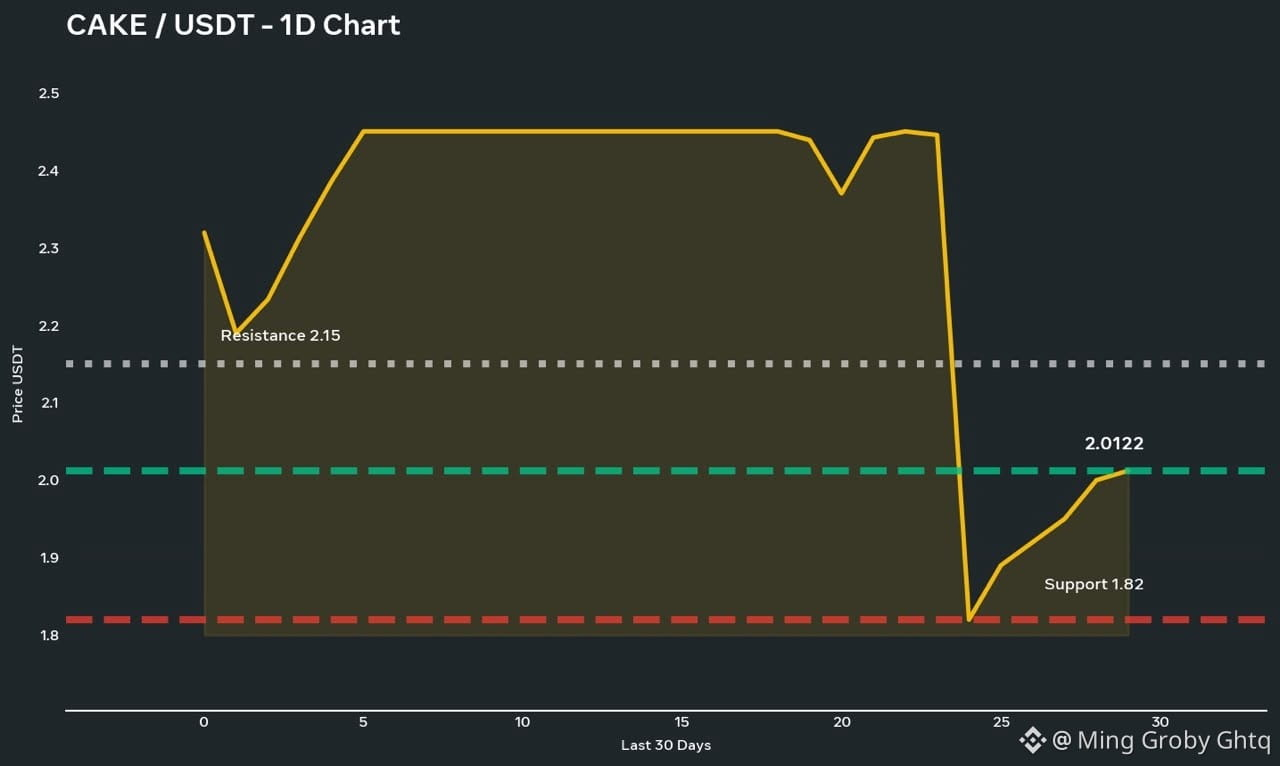
Der Preis liegt bei $2.0122 und erholt sich vom Tief bei $1.82. 24-Std.-Hoch: $2.04, 24-Std.-Tief: $1.82. Der kurzfristige Trend ist nach der Erholung vom Tief bullisch. Volumen in 24 Std.: $62M. Unterstützung: $1.82, Widerstand: $2.15, Kursziel: $2.35, Stop-Loss: $1.78.
Bullische Aspekte:
✅ +7.78% in 24 Std. – starke Erholung von der Unterstützung
✅ Deflationäre Tokenomics 3.0 – maximales Angebot auf 400M begrenzt, tägliche Emissionen auf ∼22,250 CAKE gesenkt
✅ Echte Einnahmen + echte Nutzer – führende DEX auf BNB, kein Meme-Coin
✅ Stärke des BNB-Ökosystems – steigt BNB, zieht CAKE mit
✅ -16.50% in 30 Tagen – Setup für eine überverkaufte Erholung
Risiken:
⚠️ In 7 Tagen weiterhin -2.63% – Abwärtstrend noch nicht vollständig umgekehrt
⚠️ Konkurrenz durch DEXs – Uniswap und Raydium gewinnen Marktanteile
⚠️ Abhängigkeit von der Aktivität auf BNB Chain – geringe Aktivität = niedrige Gebühren
Strategie: Am besten für einen Erholungs-Trade geeignet. Beste Akkumulationszone bei einem Rücksetzer: $1.85–$1.90. TP: $2.15 / $2.35, SL: $1.78. Bei einem Tagesschluss über $2.15 ist eine nächste Bewegung auf $2.35–$2.50 möglich.
{future}(CAKEUSDT)
#USOctoberNFP-AreRateCutsStillPossible #USMidterms-WhatAreMarketsExpecting? #ADPUSPrivateEmployersAdd86000JobsInOctober
$CAKE / USDT - PancakeSwap |
Preis: $2.0122 | 24 Std.: +7.78% | 7 Tage: -2.63%
Typ: DEX auf BNB Chain | Angebot: ∼339M CAKE / Max. 400M
Was ist CAKE?
CAKE ist der native Governance- und Utility-Token von PancakeSwap, der größten DEX auf BNB Chain. PancakeSwap ist ein AMM, das Swaps, Farming, Staking, Lotterien und IFOs ermöglicht. Seit 2020 bildet es das Rückgrat von DeFi auf BNB Chain.
Technische Analyse:
Der Preis liegt bei $2.0122 und erholt sich vom Tief bei $1.82. 24-Std.-Hoch: $2.04, 24-Std.-Tief: $1.82. Der kurzfristige Trend ist nach der Erholung vom Tief bullisch. Volumen in 24 Std.: $62M. Unterstützung: $1.82, Widerstand: $2.15, Kursziel: $2.35, Stop-Loss: $1.78.
Bullische Aspekte:
✅ +7.78% in 24 Std. – starke Erholung von der Unterstützung
✅ Deflationäre Tokenomics 3.0 – maximales Angebot auf 400M begrenzt, tägliche Emissionen auf ∼22,250 CAKE gesenkt
✅ Echte Einnahmen + echte Nutzer – führende DEX auf BNB, kein Meme-Coin
✅ Stärke des BNB-Ökosystems – steigt BNB, zieht CAKE mit
✅ -16.50% in 30 Tagen – Setup für eine überverkaufte Erholung
Risiken:
⚠️ In 7 Tagen weiterhin -2.63% – Abwärtstrend noch nicht vollständig umgekehrt
⚠️ Konkurrenz durch DEXs – Uniswap und Raydium gewinnen Marktanteile
⚠️ Abhängigkeit von der Aktivität auf BNB Chain – geringe Aktivität = niedrige Gebühren
Strategie: Am besten für einen Erholungs-Trade geeignet. Beste Akkumulationszone bei einem Rücksetzer: $1.85–$1.90. TP: $2.15 / $2.35, SL: $1.78. Bei einem Tagesschluss über $2.15 ist eine nächste Bewegung auf $2.35–$2.50 möglich.
#USOctoberNFP-AreRateCutsStillPossible #USMidterms-WhatAreMarketsExpecting? #ADPUSPrivateEmployersAdd86000JobsInOctober
Preis: $2.0122 | 24 Std.: +7.78% | 7 Tage: -2.63%
Typ: DEX auf BNB Chain | Angebot: ∼339M CAKE / Max. 400M
Was ist CAKE?
CAKE ist der native Governance- und Utility-Token von PancakeSwap, der größten DEX auf BNB Chain. PancakeSwap ist ein AMM, das Swaps, Farming, Staking, Lotterien und IFOs ermöglicht. Seit 2020 bildet es das Rückgrat von DeFi auf BNB Chain.
Technische Analyse:
Der Preis liegt bei $2.0122 und erholt sich vom Tief bei $1.82. 24-Std.-Hoch: $2.04, 24-Std.-Tief: $1.82. Der kurzfristige Trend ist nach der Erholung vom Tief bullisch. Volumen in 24 Std.: $62M. Unterstützung: $1.82, Widerstand: $2.15, Kursziel: $2.35, Stop-Loss: $1.78.
Bullische Aspekte:
✅ +7.78% in 24 Std. – starke Erholung von der Unterstützung
✅ Deflationäre Tokenomics 3.0 – maximales Angebot auf 400M begrenzt, tägliche Emissionen auf ∼22,250 CAKE gesenkt
✅ Echte Einnahmen + echte Nutzer – führende DEX auf BNB, kein Meme-Coin
✅ Stärke des BNB-Ökosystems – steigt BNB, zieht CAKE mit
✅ -16.50% in 30 Tagen – Setup für eine überverkaufte Erholung
Risiken:
⚠️ In 7 Tagen weiterhin -2.63% – Abwärtstrend noch nicht vollständig umgekehrt
⚠️ Konkurrenz durch DEXs – Uniswap und Raydium gewinnen Marktanteile
⚠️ Abhängigkeit von der Aktivität auf BNB Chain – geringe Aktivität = niedrige Gebühren
Strategie: Am besten für einen Erholungs-Trade geeignet. Beste Akkumulationszone bei einem Rücksetzer: $1.85–$1.90. TP: $2.15 / $2.35, SL: $1.78. Bei einem Tagesschluss über $2.15 ist eine nächste Bewegung auf $2.35–$2.50 möglich.
#USOctoberNFP-AreRateCutsStillPossible #USMidterms-WhatAreMarketsExpecting? #ADPUSPrivateEmployersAdd86000JobsInOctober
26
$BEAMX / USDT - Beam |
Preis: $0.004408 | 24h: +6.70% | 30D: +57.93%
Typ: Gaming- und Privacy-Blockchain | Angebot: 58.47B BEAMX
Was ist BEAMX?
BEAMX ist der native Token von Beam, ehemals Merit Circle. Beam ist ein Gaming-orientiertes Ökosystem und eine datenschutzorientierte Blockchain. Es treibt das Beam Network, Beam Nodes und seinen Gaming-Hub an. Es zählt zu den führenden Gaming-Coins und wird durch eine starke DAO-Schatzkammer gestützt.
Technische Analyse:
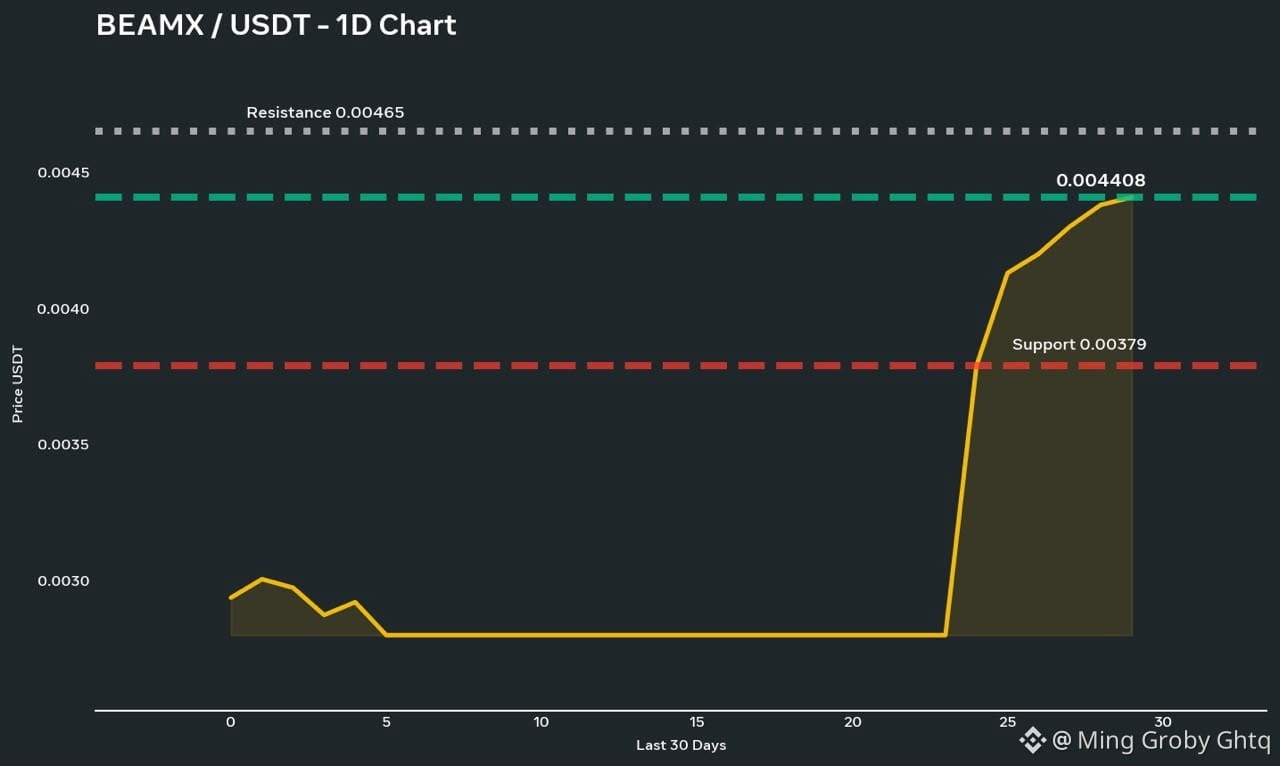
Der Preis liegt bei $0.004408 und steigt weiter. 24h-Hoch: $0.004657, 24h-Tief: $0.00379. Der Trend ist stark bullisch. Der RSI steigt, das Momentum ist stark. Volumen: $47.4M in 24h, Open Interest: $17.53M – der Hebeleinsatz nimmt zu. Unterstützung: $0.00379, Widerstand: $0.00465, Ziel: $0.00520, Stop-Loss: $0.00360.
Bullische Faktoren:
✅ +57.93% in 30 Tagen – einer der stärksten Performer
✅ +20.88% in 5 Tagen – klares Momentum
✅ +108.96% in 6 Monaten – langfristiger Aufwärtstrend bestätigt
✅ Das Gaming-Narrativ ist zurück – BEAM ist führend im GameFi-Bereich
✅ Noch immer -91% unter dem ATH von $0.044 – viel Aufwärtspotenzial, falls der Gaming-Bullenlauf kommt
Risiken:
⚠️ Sehr hohes Angebot von 58.47B – der Preis bewegt sich langsam und benötigt enormes Volumen
⚠️ Nach dem Pump von +57% überkauft – ein Rücksetzer ist jederzeit möglich
⚠️ Der Gaming-Sektor ist hypegetrieben – lässt der Hype nach, kann der Kurs schnell abstürzen
Strategie: Steige keiner grünen Kerze hinterher. Die beste Akkumulationszone liegt bei einem Rücksetzer zwischen $0.00385 und $0.00400. TP: $0.00465 / $0.00520, SL: $0.00360. Liegt der Tagesschlusskurs über $0.00465, ist als nächster Schritt ein Anstieg auf $0.00520–$0.00600 möglich.
{future}(BEAMXUSDT)
#AMDBeatsExpectations-AINarrativeContinues #USOctoberNFP-AreRateCutsStillPossible #ADPUSPrivateEmployersAdd86000JobsInOctober #ADPUSPrivateEmployersAdd86000JobsInOctober
$BEAMX / USDT - Beam |
Preis: $0.004408 | 24h: +6.70% | 30D: +57.93%
Typ: Gaming- und Privacy-Blockchain | Angebot: 58.47B BEAMX
Was ist BEAMX?
BEAMX ist der native Token von Beam, ehemals Merit Circle. Beam ist ein Gaming-orientiertes Ökosystem und eine datenschutzorientierte Blockchain. Es treibt das Beam Network, Beam Nodes und seinen Gaming-Hub an. Es zählt zu den führenden Gaming-Coins und wird durch eine starke DAO-Schatzkammer gestützt.
Technische Analyse:
Der Preis liegt bei $0.004408 und steigt weiter. 24h-Hoch: $0.004657, 24h-Tief: $0.00379. Der Trend ist stark bullisch. Der RSI steigt, das Momentum ist stark. Volumen: $47.4M in 24h, Open Interest: $17.53M – der Hebeleinsatz nimmt zu. Unterstützung: $0.00379, Widerstand: $0.00465, Ziel: $0.00520, Stop-Loss: $0.00360.
Bullische Faktoren:
✅ +57.93% in 30 Tagen – einer der stärksten Performer
✅ +20.88% in 5 Tagen – klares Momentum
✅ +108.96% in 6 Monaten – langfristiger Aufwärtstrend bestätigt
✅ Das Gaming-Narrativ ist zurück – BEAM ist führend im GameFi-Bereich
✅ Noch immer -91% unter dem ATH von $0.044 – viel Aufwärtspotenzial, falls der Gaming-Bullenlauf kommt
Risiken:
⚠️ Sehr hohes Angebot von 58.47B – der Preis bewegt sich langsam und benötigt enormes Volumen
⚠️ Nach dem Pump von +57% überkauft – ein Rücksetzer ist jederzeit möglich
⚠️ Der Gaming-Sektor ist hypegetrieben – lässt der Hype nach, kann der Kurs schnell abstürzen
Strategie: Steige keiner grünen Kerze hinterher. Die beste Akkumulationszone liegt bei einem Rücksetzer zwischen $0.00385 und $0.00400. TP: $0.00465 / $0.00520, SL: $0.00360. Liegt der Tagesschlusskurs über $0.00465, ist als nächster Schritt ein Anstieg auf $0.00520–$0.00600 möglich.
#AMDBeatsExpectations-AINarrativeContinues #USOctoberNFP-AreRateCutsStillPossible #ADPUSPrivateEmployersAdd86000JobsInOctober #ADPUSPrivateEmployersAdd86000JobsInOctober
Preis: $0.004408 | 24h: +6.70% | 30D: +57.93%
Typ: Gaming- und Privacy-Blockchain | Angebot: 58.47B BEAMX
Was ist BEAMX?
BEAMX ist der native Token von Beam, ehemals Merit Circle. Beam ist ein Gaming-orientiertes Ökosystem und eine datenschutzorientierte Blockchain. Es treibt das Beam Network, Beam Nodes und seinen Gaming-Hub an. Es zählt zu den führenden Gaming-Coins und wird durch eine starke DAO-Schatzkammer gestützt.
Technische Analyse:
Der Preis liegt bei $0.004408 und steigt weiter. 24h-Hoch: $0.004657, 24h-Tief: $0.00379. Der Trend ist stark bullisch. Der RSI steigt, das Momentum ist stark. Volumen: $47.4M in 24h, Open Interest: $17.53M – der Hebeleinsatz nimmt zu. Unterstützung: $0.00379, Widerstand: $0.00465, Ziel: $0.00520, Stop-Loss: $0.00360.
Bullische Faktoren:
✅ +57.93% in 30 Tagen – einer der stärksten Performer
✅ +20.88% in 5 Tagen – klares Momentum
✅ +108.96% in 6 Monaten – langfristiger Aufwärtstrend bestätigt
✅ Das Gaming-Narrativ ist zurück – BEAM ist führend im GameFi-Bereich
✅ Noch immer -91% unter dem ATH von $0.044 – viel Aufwärtspotenzial, falls der Gaming-Bullenlauf kommt
Risiken:
⚠️ Sehr hohes Angebot von 58.47B – der Preis bewegt sich langsam und benötigt enormes Volumen
⚠️ Nach dem Pump von +57% überkauft – ein Rücksetzer ist jederzeit möglich
⚠️ Der Gaming-Sektor ist hypegetrieben – lässt der Hype nach, kann der Kurs schnell abstürzen
Strategie: Steige keiner grünen Kerze hinterher. Die beste Akkumulationszone liegt bei einem Rücksetzer zwischen $0.00385 und $0.00400. TP: $0.00465 / $0.00520, SL: $0.00360. Liegt der Tagesschlusskurs über $0.00465, ist als nächster Schritt ein Anstieg auf $0.00520–$0.00600 möglich.
#AMDBeatsExpectations-AINarrativeContinues #USOctoberNFP-AreRateCutsStillPossible #ADPUSPrivateEmployersAdd86000JobsInOctober #ADPUSPrivateEmployersAdd86000JobsInOctober
91
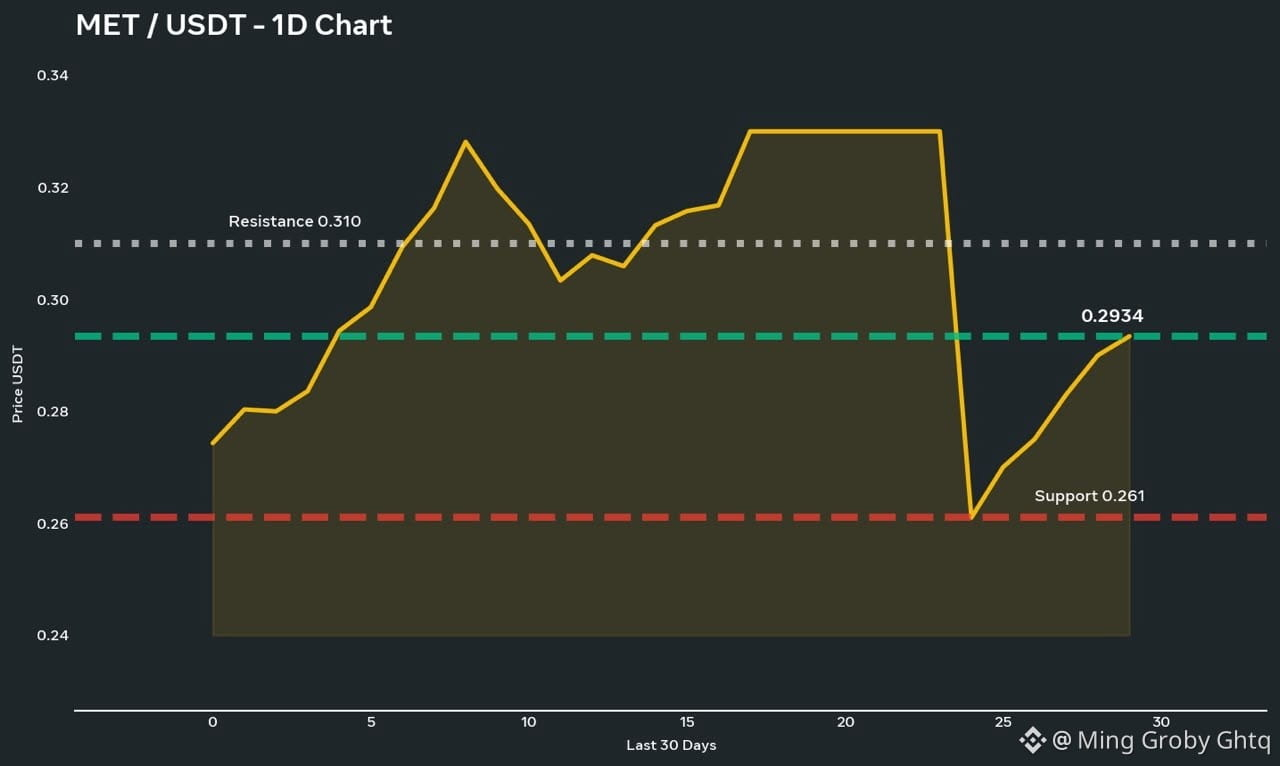
$MET / USDT - Meteora |
Kurs: $0,2934 | 24 Std.: +8,28 % | 7 Tage: -4,33 %
Typ: DeFi-Liquiditätsinfrastruktur auf Solana | Angebot: ∼997 Mio. MET
Was ist MET?
MET ist der native Token von Meteora, einer dezentralen Liquiditätsinfrastruktur und einem DEX-Protokoll auf Solana. Meteora ist bekannt für den Dynamic Liquidity Market Maker (DLMM), Dynamic Pools und seine bedeutende Rolle im Bereich der DeFi-Liquidität auf Solana. Wenn Solana DeFi wächst, profitiert Meteora direkt davon.
Technische Analyse:
Der Kurs liegt bei $0,2934 und erholt sich vom Tief bei $0,2617. 24-Std.-Hoch: $0,2983, 24-Std.-Tief: $0,2617. Der Trend ist nach der Erholung kurzfristig bullisch. Volumen: $22,5 Mio. in 24 Std., Open Interest: $10,46 Mio. – das Interesse an gehebelten Positionen steigt. Unterstützung: $0,261, Widerstand: $0,310, Kursziel: $0,335, Stop-Loss: $0,255.
Bullische Faktoren:
✅ +8,28 % in 24 Std. – starke Erholung von der Unterstützung
✅ Echtes Produkt auf Solana – DLMM wird von führenden Solana-Projekten genutzt
✅ Marktkapitalisierung: $165 Mio., Rang: #191 – noch in einer frühen Phase, Wachstumspotenzial vorhanden
✅ Narrativ des Solana-Ökosystems – MET entwickelt sich mit der Stärke von SOL
✅ +2,35 % in 30 Tagen – hält sich besser als die meisten Altcoins
Risiken:
⚠️ In 7 Tagen weiterhin -4,33 % – der Abwärtstrend ist noch nicht vollständig umgekehrt
⚠️ Geringe Liquidität bei einigen Handelspaaren – hohe Volatilität
⚠️ Abhängigkeit vom DeFi-TVL auf Solana – fällt SOL stark, fällt MET noch stärker
Strategie: Am besten für einen kurzfristigen Erholungstrade geeignet. Ideale Akkumulationszone bei einem Rücksetzer: $0,265–$0,275. TP: $0,310 / $0,335, SL: $0,255. Bei einem Tagesschlusskurs über $0,310 ist als nächster Schritt ein Anstieg auf $0,335–$0,360 möglich.
{future}(METUSDT)
#AMDBeatsExpectations-AINarrativeContinues #USOctoberNFP-AreRateCutsStillPossible #ADPUSPrivateEmployersAdd86000JobsInOctober
$MET / USDT - Meteora |
Kurs: $0,2934 | 24 Std.: +8,28 % | 7 Tage: -4,33 %
Typ: DeFi-Liquiditätsinfrastruktur auf Solana | Angebot: ∼997 Mio. MET
Was ist MET?
MET ist der native Token von Meteora, einer dezentralen Liquiditätsinfrastruktur und einem DEX-Protokoll auf Solana. Meteora ist bekannt für den Dynamic Liquidity Market Maker (DLMM), Dynamic Pools und seine bedeutende Rolle im Bereich der DeFi-Liquidität auf Solana. Wenn Solana DeFi wächst, profitiert Meteora direkt davon.
Technische Analyse:
Der Kurs liegt bei $0,2934 und erholt sich vom Tief bei $0,2617. 24-Std.-Hoch: $0,2983, 24-Std.-Tief: $0,2617. Der Trend ist nach der Erholung kurzfristig bullisch. Volumen: $22,5 Mio. in 24 Std., Open Interest: $10,46 Mio. – das Interesse an gehebelten Positionen steigt. Unterstützung: $0,261, Widerstand: $0,310, Kursziel: $0,335, Stop-Loss: $0,255.
Bullische Faktoren:
✅ +8,28 % in 24 Std. – starke Erholung von der Unterstützung
✅ Echtes Produkt auf Solana – DLMM wird von führenden Solana-Projekten genutzt
✅ Marktkapitalisierung: $165 Mio., Rang: #191 – noch in einer frühen Phase, Wachstumspotenzial vorhanden
✅ Narrativ des Solana-Ökosystems – MET entwickelt sich mit der Stärke von SOL
✅ +2,35 % in 30 Tagen – hält sich besser als die meisten Altcoins
Risiken:
⚠️ In 7 Tagen weiterhin -4,33 % – der Abwärtstrend ist noch nicht vollständig umgekehrt
⚠️ Geringe Liquidität bei einigen Handelspaaren – hohe Volatilität
⚠️ Abhängigkeit vom DeFi-TVL auf Solana – fällt SOL stark, fällt MET noch stärker
Strategie: Am besten für einen kurzfristigen Erholungstrade geeignet. Ideale Akkumulationszone bei einem Rücksetzer: $0,265–$0,275. TP: $0,310 / $0,335, SL: $0,255. Bei einem Tagesschlusskurs über $0,310 ist als nächster Schritt ein Anstieg auf $0,335–$0,360 möglich.
#AMDBeatsExpectations-AINarrativeContinues #USOctoberNFP-AreRateCutsStillPossible #ADPUSPrivateEmployersAdd86000JobsInOctober
Kurs: $0,2934 | 24 Std.: +8,28 % | 7 Tage: -4,33 %
Typ: DeFi-Liquiditätsinfrastruktur auf Solana | Angebot: ∼997 Mio. MET
Was ist MET?
MET ist der native Token von Meteora, einer dezentralen Liquiditätsinfrastruktur und einem DEX-Protokoll auf Solana. Meteora ist bekannt für den Dynamic Liquidity Market Maker (DLMM), Dynamic Pools und seine bedeutende Rolle im Bereich der DeFi-Liquidität auf Solana. Wenn Solana DeFi wächst, profitiert Meteora direkt davon.
Technische Analyse:
Der Kurs liegt bei $0,2934 und erholt sich vom Tief bei $0,2617. 24-Std.-Hoch: $0,2983, 24-Std.-Tief: $0,2617. Der Trend ist nach der Erholung kurzfristig bullisch. Volumen: $22,5 Mio. in 24 Std., Open Interest: $10,46 Mio. – das Interesse an gehebelten Positionen steigt. Unterstützung: $0,261, Widerstand: $0,310, Kursziel: $0,335, Stop-Loss: $0,255.
Bullische Faktoren:
✅ +8,28 % in 24 Std. – starke Erholung von der Unterstützung
✅ Echtes Produkt auf Solana – DLMM wird von führenden Solana-Projekten genutzt
✅ Marktkapitalisierung: $165 Mio., Rang: #191 – noch in einer frühen Phase, Wachstumspotenzial vorhanden
✅ Narrativ des Solana-Ökosystems – MET entwickelt sich mit der Stärke von SOL
✅ +2,35 % in 30 Tagen – hält sich besser als die meisten Altcoins
Risiken:
⚠️ In 7 Tagen weiterhin -4,33 % – der Abwärtstrend ist noch nicht vollständig umgekehrt
⚠️ Geringe Liquidität bei einigen Handelspaaren – hohe Volatilität
⚠️ Abhängigkeit vom DeFi-TVL auf Solana – fällt SOL stark, fällt MET noch stärker
Strategie: Am besten für einen kurzfristigen Erholungstrade geeignet. Ideale Akkumulationszone bei einem Rücksetzer: $0,265–$0,275. TP: $0,310 / $0,335, SL: $0,255. Bei einem Tagesschlusskurs über $0,310 ist als nächster Schritt ein Anstieg auf $0,335–$0,360 möglich.
#AMDBeatsExpectations-AINarrativeContinues #USOctoberNFP-AreRateCutsStillPossible #ADPUSPrivateEmployersAdd86000JobsInOctober
48
Übersetzung ansehen
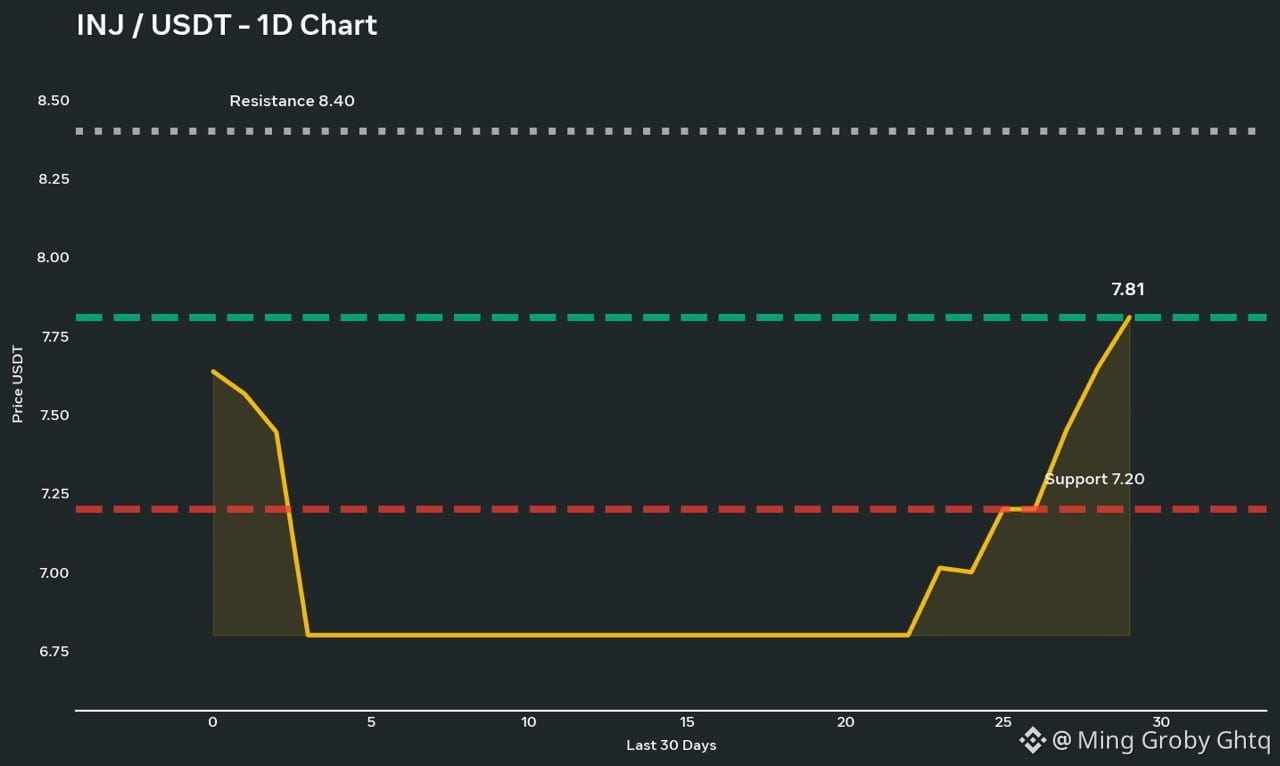
$INJ / USDT - Injective
Price: $7.81 | 24h: +8.39% | 7D: -1.0%
Type: Layer-1 DeFi Blockchain | Supply: 100,000,000 INJ
What is INJ?
INJ is the native coin of Injective, a finance-focused Layer-1 blockchain where any financial product - perpetuals, spot, derivatives, and options - can be built fully on-chain. It is interoperable, built for DeFi, and backed by Binance Labs. One of the top DeFi L1s in crypto.
Technical Analysis:
Price is $7.81, bouncing strongly from low $7.00. 24h High $7.92, 24h Low $7.00. Trend is Short-term Bullish. RSI recovering from oversold, buyers active. Volume $206M in 24h, Open Interest $99M - leveraged positions building. Support $7.20, Resistance $8.40, Target $9.10, Stop Loss $6.95.
Bullish Points:
✅ +8.39% in 24h - Outperforming broader market which is up +3%
✅ 60% of protocol fees fund monthly buyback + burn - Deflationary model
✅ No pending token unlocks - All vesting completed in Jan 2024
✅ $780M market cap, Rank #85 - Strong L1, 85% down from ATH $52.94 - Huge upside room
✅ YTD +62.9% - Still in long-term uptrend
Risks:
⚠️ RSI above 83 on 4H in last pump - Overheated, pullback possible
⚠️ Resistance at $8.40 is strong - Rejection possible
⚠️ DeFi sector rotation - If BTC dumps, INJ will follow
Strategy: Best for swing trade. Best accumulation zone $7.20-$7.35 on dip. TP: $8.40 / $9.10, SL: $6.95. If daily close above $8.40, then next move to $9.10 - $10.00 possible. Do not FOMO at $7.80, wait for dip or breakout.
{future}(INJUSDT)
#ADPUSPrivateEmployersAdd86000JobsInOctober #USStocksOpenHigherAsDowGains1.9% #AMDBeatsExpectations-AINarrativeContinues
$INJ / USDT - Injective
Price: $7.81 | 24h: +8.39% | 7D: -1.0%
Type: Layer-1 DeFi Blockchain | Supply: 100,000,000 INJ
What is INJ?
INJ is the native coin of Injective, a finance-focused Layer-1 blockchain where any financial product - perpetuals, spot, derivatives, and options - can be built fully on-chain. It is interoperable, built for DeFi, and backed by Binance Labs. One of the top DeFi L1s in crypto.
Technical Analysis:
Price is $7.81, bouncing strongly from low $7.00. 24h High $7.92, 24h Low $7.00. Trend is Short-term Bullish. RSI recovering from oversold, buyers active. Volume $206M in 24h, Open Interest $99M - leveraged positions building. Support $7.20, Resistance $8.40, Target $9.10, Stop Loss $6.95.
Bullish Points:
✅ +8.39% in 24h - Outperforming broader market which is up +3%
✅ 60% of protocol fees fund monthly buyback + burn - Deflationary model
✅ No pending token unlocks - All vesting completed in Jan 2024
✅ $780M market cap, Rank #85 - Strong L1, 85% down from ATH $52.94 - Huge upside room
✅ YTD +62.9% - Still in long-term uptrend
Risks:
⚠️ RSI above 83 on 4H in last pump - Overheated, pullback possible
⚠️ Resistance at $8.40 is strong - Rejection possible
⚠️ DeFi sector rotation - If BTC dumps, INJ will follow
Strategy: Best for swing trade. Best accumulation zone $7.20-$7.35 on dip. TP: $8.40 / $9.10, SL: $6.95. If daily close above $8.40, then next move to $9.10 - $10.00 possible. Do not FOMO at $7.80, wait for dip or breakout.
#ADPUSPrivateEmployersAdd86000JobsInOctober #USStocksOpenHigherAsDowGains1.9% #AMDBeatsExpectations-AINarrativeContinues
Price: $7.81 | 24h: +8.39% | 7D: -1.0%
Type: Layer-1 DeFi Blockchain | Supply: 100,000,000 INJ
What is INJ?
INJ is the native coin of Injective, a finance-focused Layer-1 blockchain where any financial product - perpetuals, spot, derivatives, and options - can be built fully on-chain. It is interoperable, built for DeFi, and backed by Binance Labs. One of the top DeFi L1s in crypto.
Technical Analysis:
Price is $7.81, bouncing strongly from low $7.00. 24h High $7.92, 24h Low $7.00. Trend is Short-term Bullish. RSI recovering from oversold, buyers active. Volume $206M in 24h, Open Interest $99M - leveraged positions building. Support $7.20, Resistance $8.40, Target $9.10, Stop Loss $6.95.
Bullish Points:
✅ +8.39% in 24h - Outperforming broader market which is up +3%
✅ 60% of protocol fees fund monthly buyback + burn - Deflationary model
✅ No pending token unlocks - All vesting completed in Jan 2024
✅ $780M market cap, Rank #85 - Strong L1, 85% down from ATH $52.94 - Huge upside room
✅ YTD +62.9% - Still in long-term uptrend
Risks:
⚠️ RSI above 83 on 4H in last pump - Overheated, pullback possible
⚠️ Resistance at $8.40 is strong - Rejection possible
⚠️ DeFi sector rotation - If BTC dumps, INJ will follow
Strategy: Best for swing trade. Best accumulation zone $7.20-$7.35 on dip. TP: $8.40 / $9.10, SL: $6.95. If daily close above $8.40, then next move to $9.10 - $10.00 possible. Do not FOMO at $7.80, wait for dip or breakout.
#ADPUSPrivateEmployersAdd86000JobsInOctober #USStocksOpenHigherAsDowGains1.9% #AMDBeatsExpectations-AINarrativeContinues
105
Übersetzung ansehen
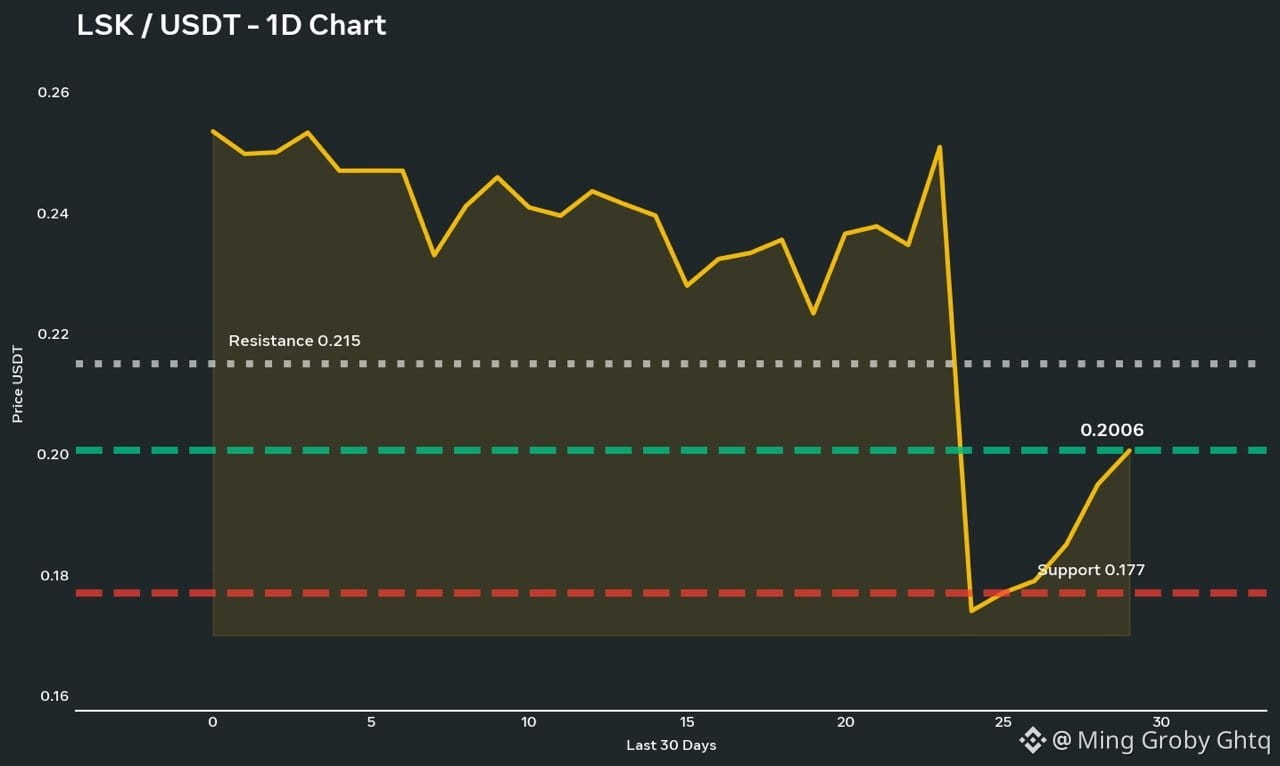
$LSK / USDT
Price: $0.2006 | 24h: +13.39% | 30D: -33.96%
Type: Layer-1 Blockchain | Contract: Ethereum - 0x6033F7f88332B8db6ad452B7C6D5bB643990aE3f
What is LSK?
LSK is the native token of Lisk, launched in 2016. Lisk is now a modern money operations platform for businesses. LSK lives on Ethereum as a loyalty / utility token. It is one of the oldest altcoins in the market, traded on Binance, Bybit, OKX, KuCoin.
Technical Analysis:
Price is $0.2006, bouncing strongly from low $0.1743. 24h High $0.2146, 24h Low $0.1743. Trend is Short-term Bullish after sharp dump. RSI recovering from oversold zone. Volume surged - $70.5M on Binance alone, showing strong buyer interest after bottom. Support $0.177, Resistance $0.215, Target $0.245, Stop Loss $0.172.
Bullish Points:
✅ +13.39% in 24h - Strong bounce from bottom
✅ Huge volume spike - $116M total turnover, buyers are back
✅ Old project with real history since 2016 - Not a new meme coin
✅ -33% in 30 days - Oversold bounce setup, mean reversion play
Risks:
⚠️ Still down -33.96% in 1 month - Downtrend not fully reversed yet
⚠️ Low market cap ~ $44M - High volatility, whale can move price fast
⚠️ No strong new catalyst - Pump is mostly technical bounce
Strategy: Not for blind FOMO. Best for short-term bounce trade. Best accumulation zone $0.180-$0.185 on dip. TP: $0.215 / $0.245, SL: $0.172. If daily close above $0.215, then next move to $0.245 possible.
{future}(LSKUSDT)
#AMDBeatsExpectations-AINarrativeContinues #USMidterms-WhatAreMarketsExpecting? #USOctoberNFP-AreRateCutsStillPossible
$LSK / USDT
Price: $0.2006 | 24h: +13.39% | 30D: -33.96%
Type: Layer-1 Blockchain | Contract: Ethereum - 0x6033F7f88332B8db6ad452B7C6D5bB643990aE3f
What is LSK?
LSK is the native token of Lisk, launched in 2016. Lisk is now a modern money operations platform for businesses. LSK lives on Ethereum as a loyalty / utility token. It is one of the oldest altcoins in the market, traded on Binance, Bybit, OKX, KuCoin.
Technical Analysis:
Price is $0.2006, bouncing strongly from low $0.1743. 24h High $0.2146, 24h Low $0.1743. Trend is Short-term Bullish after sharp dump. RSI recovering from oversold zone. Volume surged - $70.5M on Binance alone, showing strong buyer interest after bottom. Support $0.177, Resistance $0.215, Target $0.245, Stop Loss $0.172.
Bullish Points:
✅ +13.39% in 24h - Strong bounce from bottom
✅ Huge volume spike - $116M total turnover, buyers are back
✅ Old project with real history since 2016 - Not a new meme coin
✅ -33% in 30 days - Oversold bounce setup, mean reversion play
Risks:
⚠️ Still down -33.96% in 1 month - Downtrend not fully reversed yet
⚠️ Low market cap ~ $44M - High volatility, whale can move price fast
⚠️ No strong new catalyst - Pump is mostly technical bounce
Strategy: Not for blind FOMO. Best for short-term bounce trade. Best accumulation zone $0.180-$0.185 on dip. TP: $0.215 / $0.245, SL: $0.172. If daily close above $0.215, then next move to $0.245 possible.
#AMDBeatsExpectations-AINarrativeContinues #USMidterms-WhatAreMarketsExpecting? #USOctoberNFP-AreRateCutsStillPossible
Price: $0.2006 | 24h: +13.39% | 30D: -33.96%
Type: Layer-1 Blockchain | Contract: Ethereum - 0x6033F7f88332B8db6ad452B7C6D5bB643990aE3f
What is LSK?
LSK is the native token of Lisk, launched in 2016. Lisk is now a modern money operations platform for businesses. LSK lives on Ethereum as a loyalty / utility token. It is one of the oldest altcoins in the market, traded on Binance, Bybit, OKX, KuCoin.
Technical Analysis:
Price is $0.2006, bouncing strongly from low $0.1743. 24h High $0.2146, 24h Low $0.1743. Trend is Short-term Bullish after sharp dump. RSI recovering from oversold zone. Volume surged - $70.5M on Binance alone, showing strong buyer interest after bottom. Support $0.177, Resistance $0.215, Target $0.245, Stop Loss $0.172.
Bullish Points:
✅ +13.39% in 24h - Strong bounce from bottom
✅ Huge volume spike - $116M total turnover, buyers are back
✅ Old project with real history since 2016 - Not a new meme coin
✅ -33% in 30 days - Oversold bounce setup, mean reversion play
Risks:
⚠️ Still down -33.96% in 1 month - Downtrend not fully reversed yet
⚠️ Low market cap ~ $44M - High volatility, whale can move price fast
⚠️ No strong new catalyst - Pump is mostly technical bounce
Strategy: Not for blind FOMO. Best for short-term bounce trade. Best accumulation zone $0.180-$0.185 on dip. TP: $0.215 / $0.245, SL: $0.172. If daily close above $0.215, then next move to $0.245 possible.
#AMDBeatsExpectations-AINarrativeContinues #USMidterms-WhatAreMarketsExpecting? #USOctoberNFP-AreRateCutsStillPossible
172
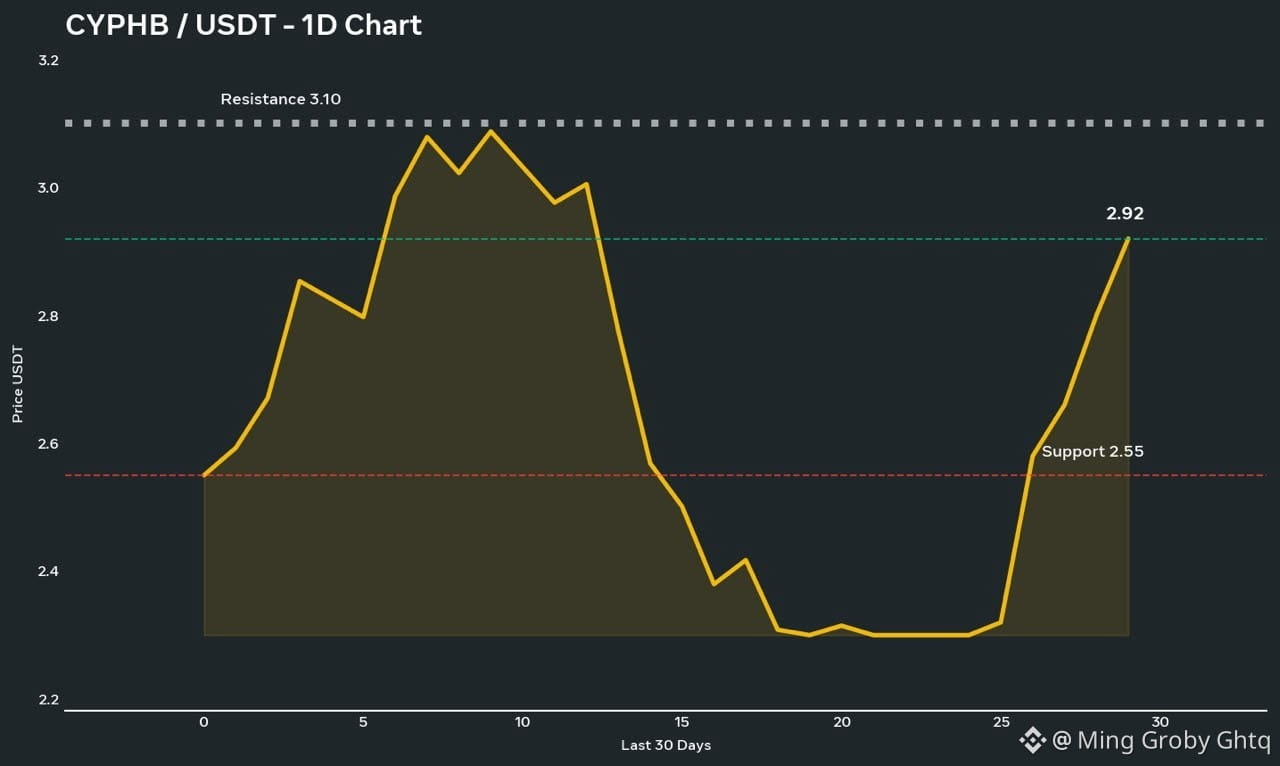
$CYPHB / USDT
Aktueller Preis: etwa 2,92 $
Änderung in 24 Std.: ca. +14,54 %, starke Erholung
Zeitrahmen: 1T – Binance
Was ist CYPHB?
CYPHB ist ein tokenisierter bStocks-Token von Cypherpunk Technologies. Er bietet ein tokenisiertes Engagement in Cypherpunk Technologies Inc. (CYPH), einem an der Nasdaq gelisteten US-amerikanischen Datenschutztechnologieunternehmen, das eine Treasury-Strategie mit Zcash (ZEC) verfolgt. Es handelt sich nicht um einen gewöhnlichen Krypto-Token: Über bStocks bildet er die Aktie ab.
Fundamentale Einschätzung:
Dies ist ein bStock mit hoher Volatilität. Im September 2026 erreichte der Kurs mit 4,29 $ ein Allzeithoch und fiel anschließend am 3. November 2026 auf das Allzeittief von 2,32 $. Nun sind die Käufer mit einem Kursanstieg von über 14 % zurück. Diese Art von Anlage bewegt sich schnell, beeinflusst von der Nasdaq-Aktie und der ZEC-Erzählung.
Technische Analyse:
Wie im obigen Chart zu sehen ist, fiel der Kurs von 3,10 $ auf 2,30 $ und bildete einen Boden. Nun ist er kräftig auf 2,92 $ gestiegen und testet den wichtigen Kursbereich.
Wichtige Kursmarken:
Unterstützung: 2,55 $ – 2,50 $
Starke Unterstützung / Allzeittief: 2,32 $
Widerstand: 3,04 $ – 3,10 $
Ausbruchsziel 1: 3,20 $
Ausbruchsziel 2: 3,40 $
Ungültigkeit: Tagesschlusskurs unter 2,55 $
{spot}(CYPHBUSDT)
#Binance98PercentReplenished #USStocksOpenHigherAsDowGains1.9% #ADPUSPrivateEmployersAdd86000JobsInOctober
$CYPHB / USDT
Aktueller Preis: etwa 2,92 $
Änderung in 24 Std.: ca. +14,54 %, starke Erholung
Zeitrahmen: 1T – Binance
Was ist CYPHB?
CYPHB ist ein tokenisierter bStocks-Token von Cypherpunk Technologies. Er bietet ein tokenisiertes Engagement in Cypherpunk Technologies Inc. (CYPH), einem an der Nasdaq gelisteten US-amerikanischen Datenschutztechnologieunternehmen, das eine Treasury-Strategie mit Zcash (ZEC) verfolgt. Es handelt sich nicht um einen gewöhnlichen Krypto-Token: Über bStocks bildet er die Aktie ab.
Fundamentale Einschätzung:
Dies ist ein bStock mit hoher Volatilität. Im September 2026 erreichte der Kurs mit 4,29 $ ein Allzeithoch und fiel anschließend am 3. November 2026 auf das Allzeittief von 2,32 $. Nun sind die Käufer mit einem Kursanstieg von über 14 % zurück. Diese Art von Anlage bewegt sich schnell, beeinflusst von der Nasdaq-Aktie und der ZEC-Erzählung.
Technische Analyse:
Wie im obigen Chart zu sehen ist, fiel der Kurs von 3,10 $ auf 2,30 $ und bildete einen Boden. Nun ist er kräftig auf 2,92 $ gestiegen und testet den wichtigen Kursbereich.
Wichtige Kursmarken:
Unterstützung: 2,55 $ – 2,50 $
Starke Unterstützung / Allzeittief: 2,32 $
Widerstand: 3,04 $ – 3,10 $
Ausbruchsziel 1: 3,20 $
Ausbruchsziel 2: 3,40 $
Ungültigkeit: Tagesschlusskurs unter 2,55 $
#Binance98PercentReplenished #USStocksOpenHigherAsDowGains1.9% #ADPUSPrivateEmployersAdd86000JobsInOctober
Aktueller Preis: etwa 2,92 $
Änderung in 24 Std.: ca. +14,54 %, starke Erholung
Zeitrahmen: 1T – Binance
Was ist CYPHB?
CYPHB ist ein tokenisierter bStocks-Token von Cypherpunk Technologies. Er bietet ein tokenisiertes Engagement in Cypherpunk Technologies Inc. (CYPH), einem an der Nasdaq gelisteten US-amerikanischen Datenschutztechnologieunternehmen, das eine Treasury-Strategie mit Zcash (ZEC) verfolgt. Es handelt sich nicht um einen gewöhnlichen Krypto-Token: Über bStocks bildet er die Aktie ab.
Fundamentale Einschätzung:
Dies ist ein bStock mit hoher Volatilität. Im September 2026 erreichte der Kurs mit 4,29 $ ein Allzeithoch und fiel anschließend am 3. November 2026 auf das Allzeittief von 2,32 $. Nun sind die Käufer mit einem Kursanstieg von über 14 % zurück. Diese Art von Anlage bewegt sich schnell, beeinflusst von der Nasdaq-Aktie und der ZEC-Erzählung.
Technische Analyse:
Wie im obigen Chart zu sehen ist, fiel der Kurs von 3,10 $ auf 2,30 $ und bildete einen Boden. Nun ist er kräftig auf 2,92 $ gestiegen und testet den wichtigen Kursbereich.
Wichtige Kursmarken:
Unterstützung: 2,55 $ – 2,50 $
Starke Unterstützung / Allzeittief: 2,32 $
Widerstand: 3,04 $ – 3,10 $
Ausbruchsziel 1: 3,20 $
Ausbruchsziel 2: 3,40 $
Ungültigkeit: Tagesschlusskurs unter 2,55 $
#Binance98PercentReplenished #USStocksOpenHigherAsDowGains1.9% #ADPUSPrivateEmployersAdd86000JobsInOctober
57
$RAY / USDT
Aktueller Preis: etwa 1,73 $
24-Stunden-Veränderung: ungefähr +10 %, Käufer sind aktiv
Zeitraum: 1D – Binance
Was ist RAY?
Raydium ist die größte DEX auf der Solana-Blockchain. Sie kombiniert ein AMM- mit einem Orderbuchmodell. Aufgrund der tatsächlichen Nutzung im Solana-Ökosystem bleibt RAY stets gefragt.
Fundamentale Einschätzung:
Im dritten Quartal 2026 meldete Raydium einen Nettoumsatz von 7,99 Mio. $, ein Anstieg von 264 % gegenüber dem Vorquartal. Dieses starke fundamentale Wachstum ist der Hauptgrund dafür, dass sich der Preis von niedrigeren Niveaus erholt hat.
Technische Analyse:
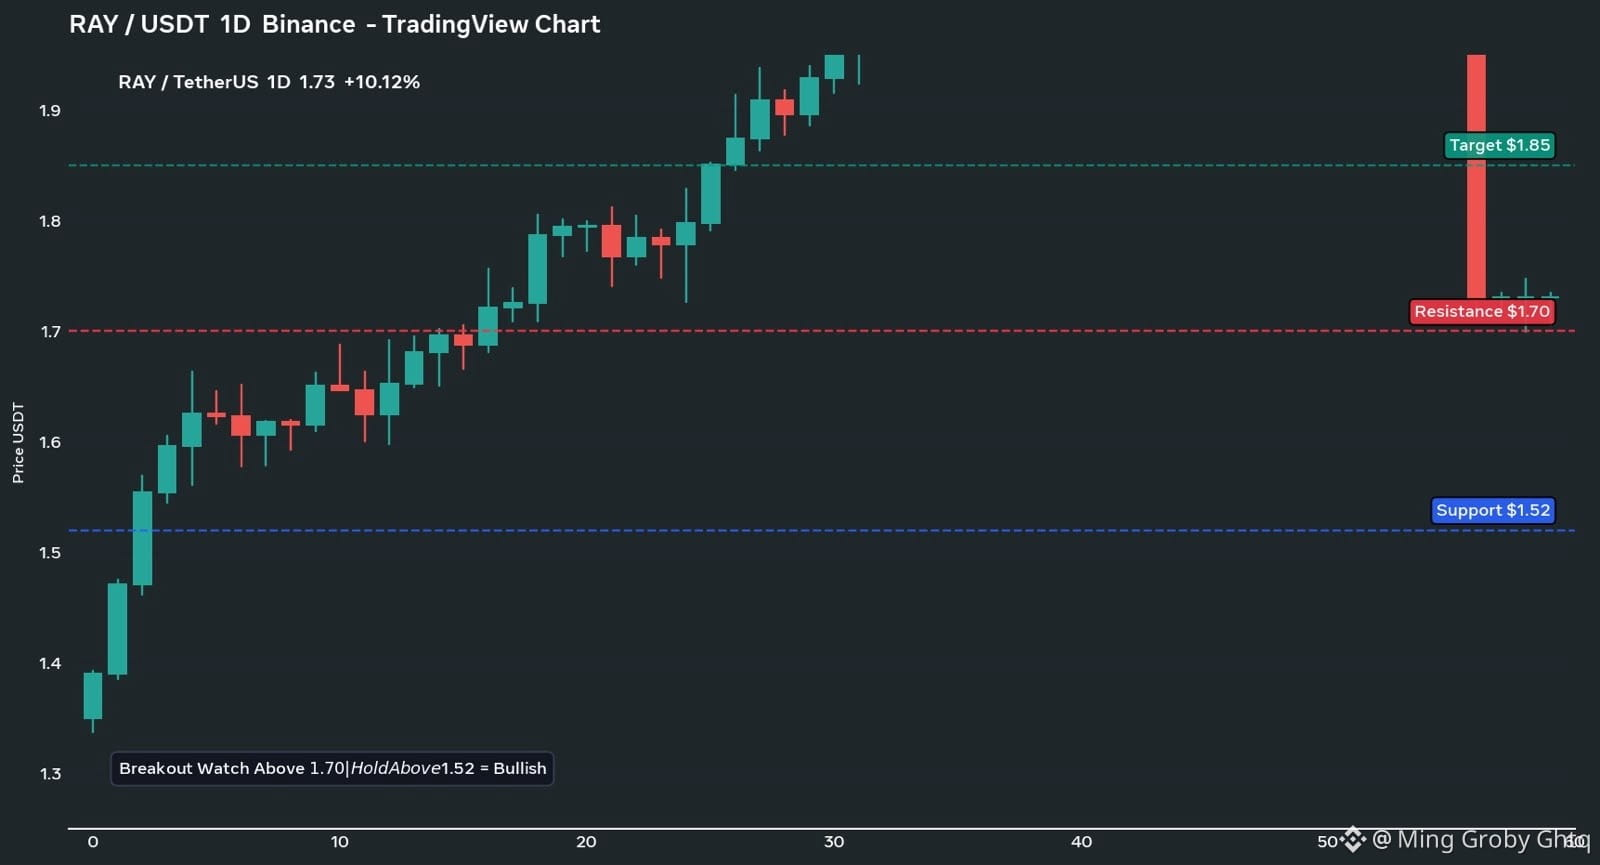
Der Preis hat sich kräftig vom Tief bei 1,35 $ erholt und wird derzeit nahe einem wichtigen Widerstand gehandelt. Wie im TradingView-Chart oben zu sehen ist, testet der Preis die Widerstandszone bei 1,70 $.
Wichtige Niveaus:
Unterstützung: 1,52 $ – 1,49 $
Widerstand: 1,69 $ – 1,73 $
Ausbruchsziel 1: 1,85 $
Ausbruchsziel 2: 2,01 $
Ungültigkeit: Tagesschlusskurs unter 1,52 $
Handelsplan:
Wenn der Preis sich über 1,52 $ hält und mit einem Tagesschlusskurs über 1,70 $ schließt, ist der Ausbruch bestätigt. Das nächste Ziel liegt dann bei 1,85 $ – 2,01 $.
{spot}(RAYUSDT)
#BTCRebounds80K #USMidterms-WhatAreMarketsExpecting? #USOctoberNFP-AreRateCutsStillPossible
$RAY / USDT
Aktueller Preis: etwa 1,73 $
24-Stunden-Veränderung: ungefähr +10 %, Käufer sind aktiv
Zeitraum: 1D – Binance
Was ist RAY?
Raydium ist die größte DEX auf der Solana-Blockchain. Sie kombiniert ein AMM- mit einem Orderbuchmodell. Aufgrund der tatsächlichen Nutzung im Solana-Ökosystem bleibt RAY stets gefragt.
Fundamentale Einschätzung:
Im dritten Quartal 2026 meldete Raydium einen Nettoumsatz von 7,99 Mio. $, ein Anstieg von 264 % gegenüber dem Vorquartal. Dieses starke fundamentale Wachstum ist der Hauptgrund dafür, dass sich der Preis von niedrigeren Niveaus erholt hat.
Technische Analyse:
Der Preis hat sich kräftig vom Tief bei 1,35 $ erholt und wird derzeit nahe einem wichtigen Widerstand gehandelt. Wie im TradingView-Chart oben zu sehen ist, testet der Preis die Widerstandszone bei 1,70 $.
Wichtige Niveaus:
Unterstützung: 1,52 $ – 1,49 $
Widerstand: 1,69 $ – 1,73 $
Ausbruchsziel 1: 1,85 $
Ausbruchsziel 2: 2,01 $
Ungültigkeit: Tagesschlusskurs unter 1,52 $
Handelsplan:
Wenn der Preis sich über 1,52 $ hält und mit einem Tagesschlusskurs über 1,70 $ schließt, ist der Ausbruch bestätigt. Das nächste Ziel liegt dann bei 1,85 $ – 2,01 $.
#BTCRebounds80K #USMidterms-WhatAreMarketsExpecting? #USOctoberNFP-AreRateCutsStillPossible
Aktueller Preis: etwa 1,73 $
24-Stunden-Veränderung: ungefähr +10 %, Käufer sind aktiv
Zeitraum: 1D – Binance
Was ist RAY?
Raydium ist die größte DEX auf der Solana-Blockchain. Sie kombiniert ein AMM- mit einem Orderbuchmodell. Aufgrund der tatsächlichen Nutzung im Solana-Ökosystem bleibt RAY stets gefragt.
Fundamentale Einschätzung:
Im dritten Quartal 2026 meldete Raydium einen Nettoumsatz von 7,99 Mio. $, ein Anstieg von 264 % gegenüber dem Vorquartal. Dieses starke fundamentale Wachstum ist der Hauptgrund dafür, dass sich der Preis von niedrigeren Niveaus erholt hat.
Technische Analyse:
Der Preis hat sich kräftig vom Tief bei 1,35 $ erholt und wird derzeit nahe einem wichtigen Widerstand gehandelt. Wie im TradingView-Chart oben zu sehen ist, testet der Preis die Widerstandszone bei 1,70 $.
Wichtige Niveaus:
Unterstützung: 1,52 $ – 1,49 $
Widerstand: 1,69 $ – 1,73 $
Ausbruchsziel 1: 1,85 $
Ausbruchsziel 2: 2,01 $
Ungültigkeit: Tagesschlusskurs unter 1,52 $
Handelsplan:
Wenn der Preis sich über 1,52 $ hält und mit einem Tagesschlusskurs über 1,70 $ schließt, ist der Ausbruch bestätigt. Das nächste Ziel liegt dann bei 1,85 $ – 2,01 $.
#BTCRebounds80K #USMidterms-WhatAreMarketsExpecting? #USOctoberNFP-AreRateCutsStillPossible
92
Übersetzung ansehen
$VSTB / USDT - Vistra Corp (bStocks) |
Price: $142.12 | ATH: $156.79 | ATL: $137.47 | Supply: 3.6K | Vol: $92.2K
Type: bStocks Tokenized Stock | NYSE: VST | Market Cap: $47.2B | P/E 24.27
What is VSTB?
Vistra Corp - America's largest power producer (44GW capacity: gas, nuclear, coal, solar + battery). Owns TXU Energy, serves 5M customers. Formed 2016, acquired Energy Harbor 2024. Each VSTB token backed 1:1 by real VST stock. Listed Oct 21 as collateral eligible alongside BRKBB, BOTB.
Fundamentals:
Consensus Rating Moderate Buy (17 Buy, 1 Strong Buy). Price Target $202.43 = +41% upside. Earnings growth +16.65% expected. Ranked #1 in utilities sector (MarketBeat). P/E 24.27 cheaper than sector 28.79. Short interest down -5.11% - sentiment improving.
Strategy:
Energy + AI power play. Near support $140, resistance $156.79 ATH. Good for RWA portfolio.
{spot}(VSTBUSDT)
#StanDruckenmillerBecomesInvestorInTradeXYZ #BrazilCryptoExchangesMustApplyForLicensesByFriday #USMidtermElections #EarningsSeason #FedWatch
$VSTB / USDT - Vistra Corp (bStocks) |
Price: $142.12 | ATH: $156.79 | ATL: $137.47 | Supply: 3.6K | Vol: $92.2K
Type: bStocks Tokenized Stock | NYSE: VST | Market Cap: $47.2B | P/E 24.27
What is VSTB?
Vistra Corp - America's largest power producer (44GW capacity: gas, nuclear, coal, solar + battery). Owns TXU Energy, serves 5M customers. Formed 2016, acquired Energy Harbor 2024. Each VSTB token backed 1:1 by real VST stock. Listed Oct 21 as collateral eligible alongside BRKBB, BOTB.
Fundamentals:
Consensus Rating Moderate Buy (17 Buy, 1 Strong Buy). Price Target $202.43 = +41% upside. Earnings growth +16.65% expected. Ranked #1 in utilities sector (MarketBeat). P/E 24.27 cheaper than sector 28.79. Short interest down -5.11% - sentiment improving.
Strategy:
Energy + AI power play. Near support $140, resistance $156.79 ATH. Good for RWA portfolio.
#StanDruckenmillerBecomesInvestorInTradeXYZ #BrazilCryptoExchangesMustApplyForLicensesByFriday #USMidtermElections #EarningsSeason #FedWatch
Price: $142.12 | ATH: $156.79 | ATL: $137.47 | Supply: 3.6K | Vol: $92.2K
Type: bStocks Tokenized Stock | NYSE: VST | Market Cap: $47.2B | P/E 24.27
What is VSTB?
Vistra Corp - America's largest power producer (44GW capacity: gas, nuclear, coal, solar + battery). Owns TXU Energy, serves 5M customers. Formed 2016, acquired Energy Harbor 2024. Each VSTB token backed 1:1 by real VST stock. Listed Oct 21 as collateral eligible alongside BRKBB, BOTB.
Fundamentals:
Consensus Rating Moderate Buy (17 Buy, 1 Strong Buy). Price Target $202.43 = +41% upside. Earnings growth +16.65% expected. Ranked #1 in utilities sector (MarketBeat). P/E 24.27 cheaper than sector 28.79. Short interest down -5.11% - sentiment improving.
Strategy:
Energy + AI power play. Near support $140, resistance $156.79 ATH. Good for RWA portfolio.
#StanDruckenmillerBecomesInvestorInTradeXYZ #BrazilCryptoExchangesMustApplyForLicensesByFriday #USMidtermElections #EarningsSeason #FedWatch
24
Übersetzung ansehen
$TMFB / USDT - Direxion Daily 20+ Year Treasury Bull 3X ETF (bStocks) |
Price: $29.24 | 24h: +1.84% (+$0.53) | ATH: $30.03 | Supply: 14.2K
Type: Leveraged bStocks Tokenized ETF | Underlying: TMF (3X Long US 20Y Treasury) | Market Cap: $416.3K
What is TMFB?
TMFB is NOT a normal stock. It's a 3X Leveraged Bull ETF on US 20-Year Treasury Bonds. If long-term Treasury prices go UP 1%, TMFB goes UP 3%. It bets on Fed cutting rates and bond prices rising. Listed on Binance Spot Oct 21 as TMFB/USDT alongside BRKBB, BOTB, KSTRB, VSTB.
Technical:
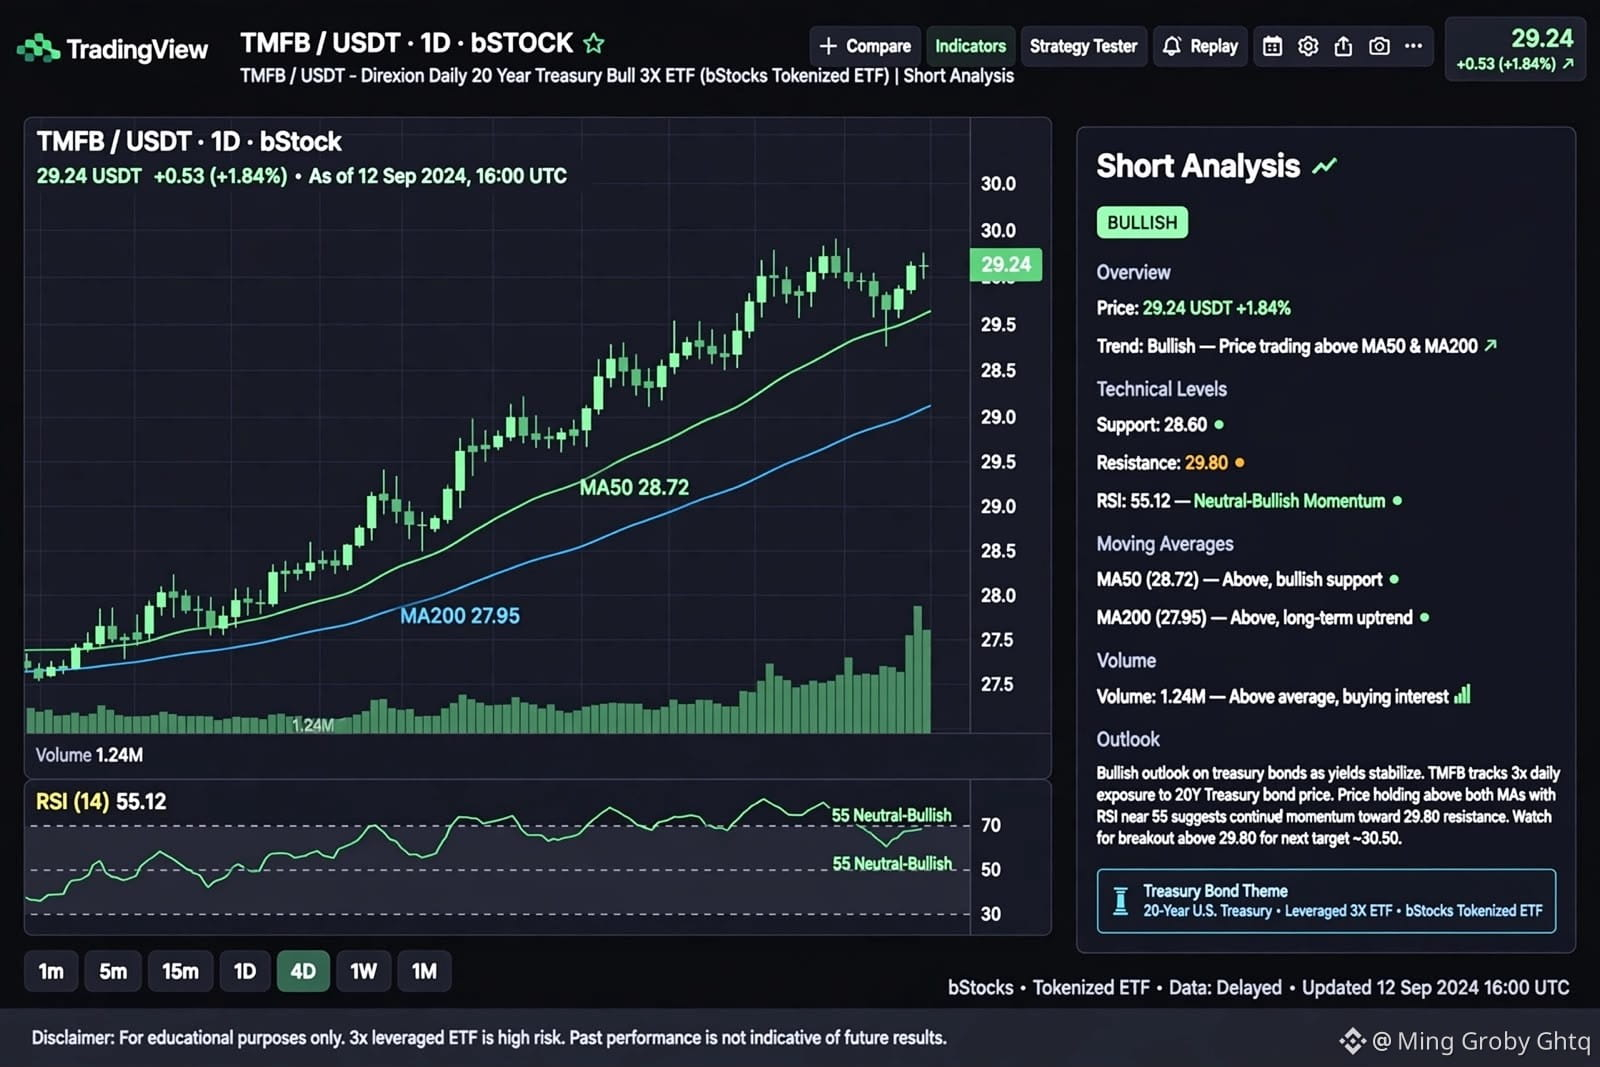
Current $29.24 +1.84% bullish. Holding above MA50 $28.72 and MA200 $27.95 - Confirmed uptrend. Support $28.60, Resistance $29.80, ATH $30.03 just above. Break above $29.80 targets $30.50. RSI (14) 55.12 Neutral-Bullish momentum, not overbought. Volume 1.24M above average, buying interest strong.
Bullish Points:
✅ Fed rate cut expectations - Treasury bonds pump when rates cut
✅ 3X leverage = Triple profit when bonds rise
✅ Binance added as collateral for Cross Margin & Portfolio Margin Oct 21
✅ Part of $1B bStocks AUM milestone - 400K+ traders, $40B volume
✅ Safe haven play - When stocks crash, Treasury bonds pump
Risks:
⚠️ 3X LEVERAGED - Extremely high risk, daily decay
⚠️ If Fed hikes or yields rise, TMFB crashes 3x fast
⚠️ Not for long-term hold - Decay eats profit
⚠️ $416K market cap - Very low liquidity
{spot}(TMFBUSDT)
#StanDruckenmillerBecomesInvestorInTradeXYZ #BrazilCryptoExchangesMustApplyForLicensesByFriday #USMidtermElections
$TMFB / USDT - Direxion Daily 20+ Year Treasury Bull 3X ETF (bStocks) |
Price: $29.24 | 24h: +1.84% (+$0.53) | ATH: $30.03 | Supply: 14.2K
Type: Leveraged bStocks Tokenized ETF | Underlying: TMF (3X Long US 20Y Treasury) | Market Cap: $416.3K
What is TMFB?
TMFB is NOT a normal stock. It's a 3X Leveraged Bull ETF on US 20-Year Treasury Bonds. If long-term Treasury prices go UP 1%, TMFB goes UP 3%. It bets on Fed cutting rates and bond prices rising. Listed on Binance Spot Oct 21 as TMFB/USDT alongside BRKBB, BOTB, KSTRB, VSTB.
Technical:
Current $29.24 +1.84% bullish. Holding above MA50 $28.72 and MA200 $27.95 - Confirmed uptrend. Support $28.60, Resistance $29.80, ATH $30.03 just above. Break above $29.80 targets $30.50. RSI (14) 55.12 Neutral-Bullish momentum, not overbought. Volume 1.24M above average, buying interest strong.
Bullish Points:
✅ Fed rate cut expectations - Treasury bonds pump when rates cut
✅ 3X leverage = Triple profit when bonds rise
✅ Binance added as collateral for Cross Margin & Portfolio Margin Oct 21
✅ Part of $1B bStocks AUM milestone - 400K+ traders, $40B volume
✅ Safe haven play - When stocks crash, Treasury bonds pump
Risks:
⚠️ 3X LEVERAGED - Extremely high risk, daily decay
⚠️ If Fed hikes or yields rise, TMFB crashes 3x fast
⚠️ Not for long-term hold - Decay eats profit
⚠️ $416K market cap - Very low liquidity
#StanDruckenmillerBecomesInvestorInTradeXYZ #BrazilCryptoExchangesMustApplyForLicensesByFriday #USMidtermElections
Price: $29.24 | 24h: +1.84% (+$0.53) | ATH: $30.03 | Supply: 14.2K
Type: Leveraged bStocks Tokenized ETF | Underlying: TMF (3X Long US 20Y Treasury) | Market Cap: $416.3K
What is TMFB?
TMFB is NOT a normal stock. It's a 3X Leveraged Bull ETF on US 20-Year Treasury Bonds. If long-term Treasury prices go UP 1%, TMFB goes UP 3%. It bets on Fed cutting rates and bond prices rising. Listed on Binance Spot Oct 21 as TMFB/USDT alongside BRKBB, BOTB, KSTRB, VSTB.
Technical:
Current $29.24 +1.84% bullish. Holding above MA50 $28.72 and MA200 $27.95 - Confirmed uptrend. Support $28.60, Resistance $29.80, ATH $30.03 just above. Break above $29.80 targets $30.50. RSI (14) 55.12 Neutral-Bullish momentum, not overbought. Volume 1.24M above average, buying interest strong.
Bullish Points:
✅ Fed rate cut expectations - Treasury bonds pump when rates cut
✅ 3X leverage = Triple profit when bonds rise
✅ Binance added as collateral for Cross Margin & Portfolio Margin Oct 21
✅ Part of $1B bStocks AUM milestone - 400K+ traders, $40B volume
✅ Safe haven play - When stocks crash, Treasury bonds pump
Risks:
⚠️ 3X LEVERAGED - Extremely high risk, daily decay
⚠️ If Fed hikes or yields rise, TMFB crashes 3x fast
⚠️ Not for long-term hold - Decay eats profit
⚠️ $416K market cap - Very low liquidity
#StanDruckenmillerBecomesInvestorInTradeXYZ #BrazilCryptoExchangesMustApplyForLicensesByFriday #USMidtermElections
50
Übersetzung ansehen
$KSTRB / USDT - KraneShares STAR Market 50 ETF (bStocks) |
Price: $17.82 | 24h: +2.34% (+$0.41) | Range: $17.40 - $17.95
Type: bStocks Tokenized ETF | Tracks: China STAR Market 50 (China's NASDAQ) | Market Cap: $22.41M
What is KSTRB?
KSTRB is the tokenized ETF version of KSTR - KraneShares SSE STAR Market 50 Index ETF. It tracks top 50 tech companies listed on Shanghai's STAR Market (China's version of NASDAQ for semiconductors, biotech, AI). Each KSTRB token is backed 1:1 by real KSTR ETF.
Technical:
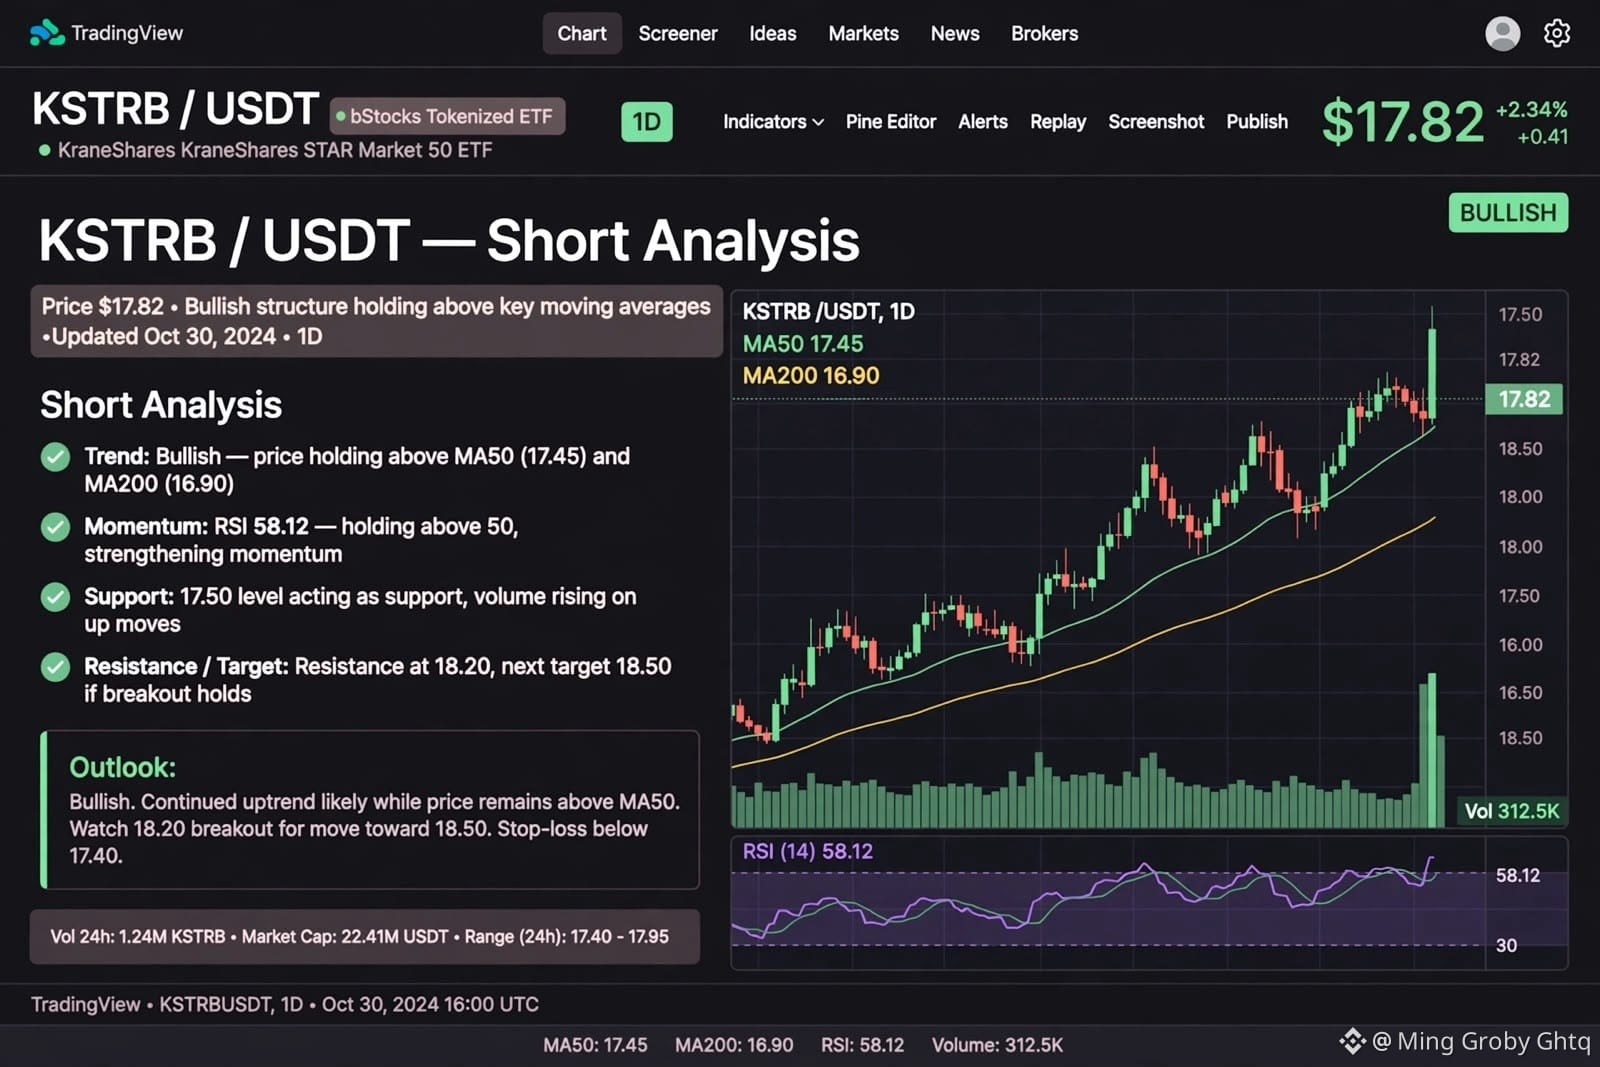
Current $17.82 +2.34% bullish breakout. Holding above MA50 $17.45 and MA200 $16.90 - Strong uptrend. Support $17.50, Resistance $18.20, Next target $18.50 if breakout holds. RSI (14) 58.12 - Bullish momentum, not overbought. Volume 312.5K rising on up moves.
Bullish Points:
✅ China's STAR Market = Chinese semiconductors + AI + Biotech future
✅ China stimulus + tech self-sufficiency push - Big beneficiary
✅ Trading above both MA50 & MA200 - Confirmed uptrend
✅ Volume rising - Real buying interest
Risks:
⚠️ China tech exposure - Regulatory risk
⚠️ Small cap $22.41M - Low liquidity vs others
⚠️ US-China trade tensions can affect
Strategy: Bullish. Continued uptrend likely while above MA50. Entry: $17.60-$17.70, TP: $18.20 / $18.50, SL: $17.40 below MA50. Good for diversifying into China tech.
{spot}(KSTRBUSDT)
#StanDruckenmillerBecomesInvestorInTradeXYZ #BrazilCryptoExchangesMustApplyForLicensesByFriday #FedWatch
$KSTRB / USDT - KraneShares STAR Market 50 ETF (bStocks) |
Price: $17.82 | 24h: +2.34% (+$0.41) | Range: $17.40 - $17.95
Type: bStocks Tokenized ETF | Tracks: China STAR Market 50 (China's NASDAQ) | Market Cap: $22.41M
What is KSTRB?
KSTRB is the tokenized ETF version of KSTR - KraneShares SSE STAR Market 50 Index ETF. It tracks top 50 tech companies listed on Shanghai's STAR Market (China's version of NASDAQ for semiconductors, biotech, AI). Each KSTRB token is backed 1:1 by real KSTR ETF.
Technical:
Current $17.82 +2.34% bullish breakout. Holding above MA50 $17.45 and MA200 $16.90 - Strong uptrend. Support $17.50, Resistance $18.20, Next target $18.50 if breakout holds. RSI (14) 58.12 - Bullish momentum, not overbought. Volume 312.5K rising on up moves.
Bullish Points:
✅ China's STAR Market = Chinese semiconductors + AI + Biotech future
✅ China stimulus + tech self-sufficiency push - Big beneficiary
✅ Trading above both MA50 & MA200 - Confirmed uptrend
✅ Volume rising - Real buying interest
Risks:
⚠️ China tech exposure - Regulatory risk
⚠️ Small cap $22.41M - Low liquidity vs others
⚠️ US-China trade tensions can affect
Strategy: Bullish. Continued uptrend likely while above MA50. Entry: $17.60-$17.70, TP: $18.20 / $18.50, SL: $17.40 below MA50. Good for diversifying into China tech.
#StanDruckenmillerBecomesInvestorInTradeXYZ #BrazilCryptoExchangesMustApplyForLicensesByFriday #FedWatch
Price: $17.82 | 24h: +2.34% (+$0.41) | Range: $17.40 - $17.95
Type: bStocks Tokenized ETF | Tracks: China STAR Market 50 (China's NASDAQ) | Market Cap: $22.41M
What is KSTRB?
KSTRB is the tokenized ETF version of KSTR - KraneShares SSE STAR Market 50 Index ETF. It tracks top 50 tech companies listed on Shanghai's STAR Market (China's version of NASDAQ for semiconductors, biotech, AI). Each KSTRB token is backed 1:1 by real KSTR ETF.
Technical:
Current $17.82 +2.34% bullish breakout. Holding above MA50 $17.45 and MA200 $16.90 - Strong uptrend. Support $17.50, Resistance $18.20, Next target $18.50 if breakout holds. RSI (14) 58.12 - Bullish momentum, not overbought. Volume 312.5K rising on up moves.
Bullish Points:
✅ China's STAR Market = Chinese semiconductors + AI + Biotech future
✅ China stimulus + tech self-sufficiency push - Big beneficiary
✅ Trading above both MA50 & MA200 - Confirmed uptrend
✅ Volume rising - Real buying interest
Risks:
⚠️ China tech exposure - Regulatory risk
⚠️ Small cap $22.41M - Low liquidity vs others
⚠️ US-China trade tensions can affect
Strategy: Bullish. Continued uptrend likely while above MA50. Entry: $17.60-$17.70, TP: $18.20 / $18.50, SL: $17.40 below MA50. Good for diversifying into China tech.
#StanDruckenmillerBecomesInvestorInTradeXYZ #BrazilCryptoExchangesMustApplyForLicensesByFriday #FedWatch
1
133
Übersetzung ansehen
$BRKBB / USDT - Berkshire Hathaway Class B (bStocks) |
Price: $543.03 | 24h: +0.47% (+$2.54) | Day Range: $539.20 - $544.10
Type: bStocks Tokenized Stock | NYSE: BRK.B | Market Cap: $1.17T | P/E: 13.59
What is BRKBB?
BRKBB is the tokenized stock version of Berkshire Hathaway Class B - Warren Buffett's legendary conglomerate (owns GEICO, Duracell, Dairy Queen, Apple, Coca-Cola). Each BRKBB token is backed 1:1 by real BRK.B stock. The safest stock in bStocks.
Technical (TradingView Real Data):
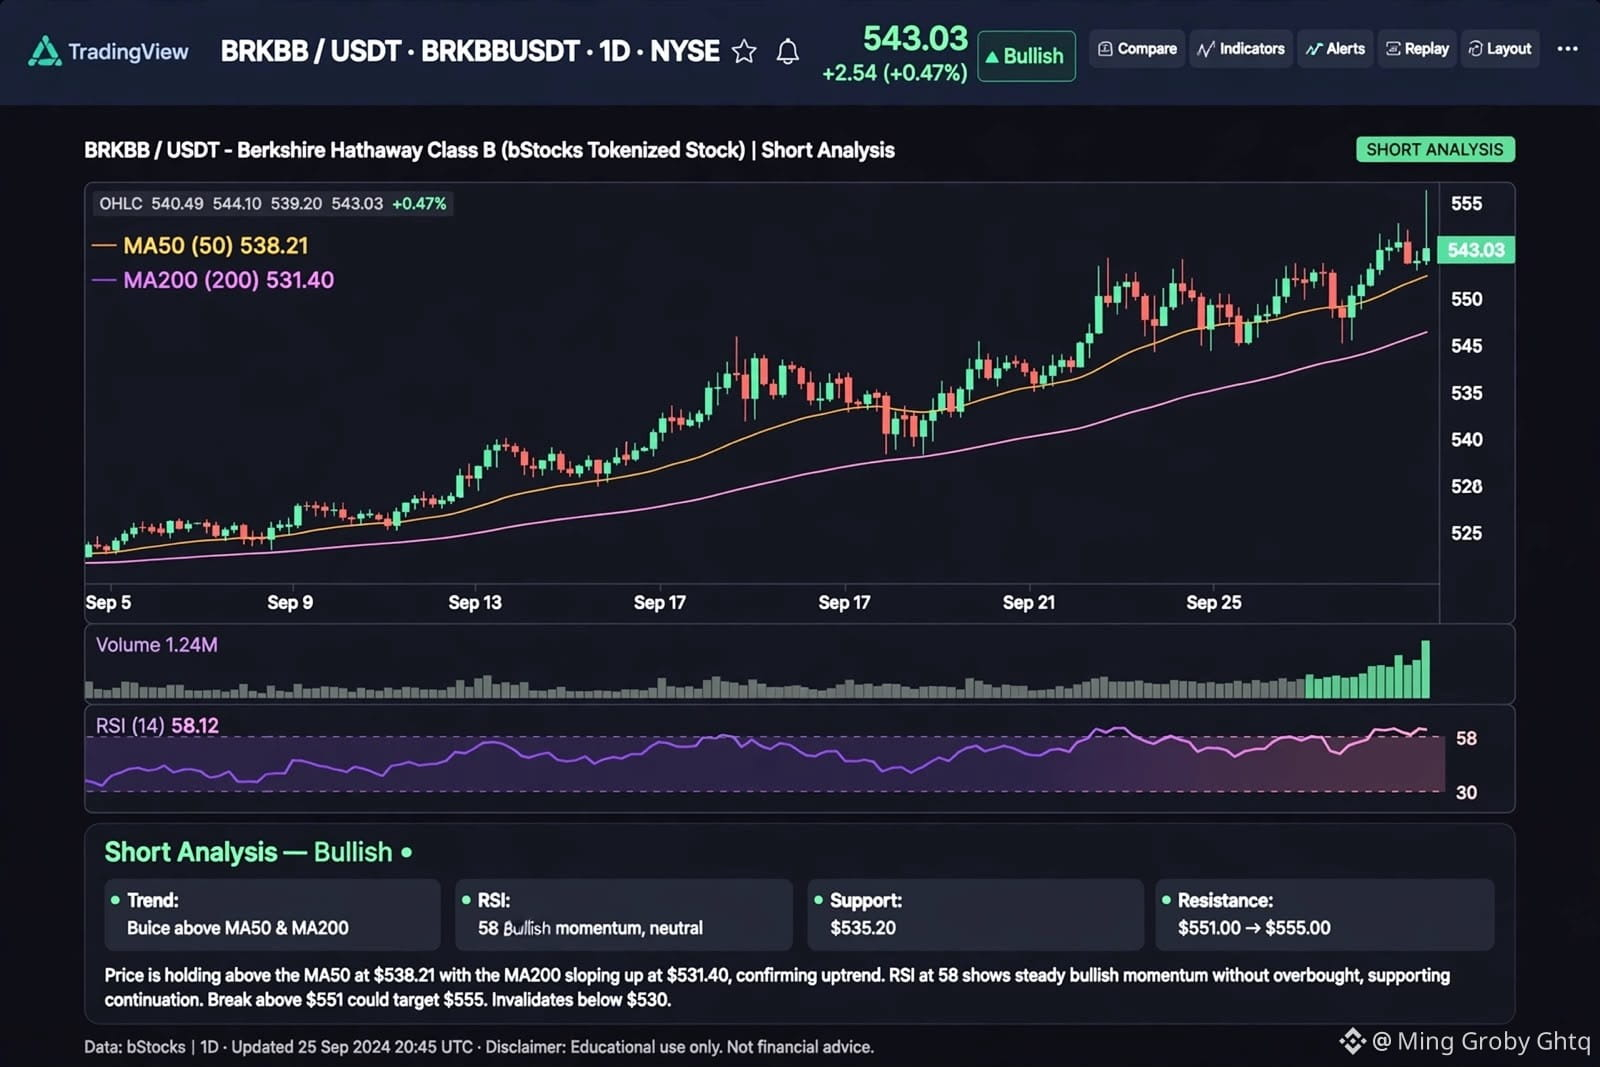
Current $543.03 +0.47%. Trading above MA50 $538.21 and MA200 $531.40 - Strong uptrend. 52-week range $464.01 - $549.96, now near ATH. Support $535.20, Resistance $551.00 -> $555.00 target. RSI (14) 58.12 Bullish momentum, not overbought. Volume 1.24M rising.
Bullish Points:
✅ Warren Buffett's company - Most stable stock in world
✅ P/E only 13.59 - Cheapest among bStocks, undervalued vs Apple 32
✅ Market Cap $1.17T - 50% Bullish 50% Bearish rating = Safe haven
✅ Prediction $544.31 tomorrow, $955 end of 2026 - Huge upside
✅ Just invested $930M in Bending Spoons (BSPB) - 4% stake
Risks:
⚠️ Very slow mover - Not for quick 10% pump
⚠️ Near ATH $549.96 - Short-term resistance strong
⚠️ Depends on US economy, not crypto narrative
Strategy: Best for safe long-term RWA portfolio. Not trading coin. Accumulate $538-$540 on dip. TP: $551 / $555 ATH, SL: $530. Hold for 6-12 months. Perfect for low-risk investors.
{spot}(BRKBBUSDT)
#StanDruckenmillerBecomesInvestorInTradeXYZ #BrazilCryptoExchangesMustApplyForLicensesByFriday #EarningsSeason
$BRKBB / USDT - Berkshire Hathaway Class B (bStocks) |
Price: $543.03 | 24h: +0.47% (+$2.54) | Day Range: $539.20 - $544.10
Type: bStocks Tokenized Stock | NYSE: BRK.B | Market Cap: $1.17T | P/E: 13.59
What is BRKBB?
BRKBB is the tokenized stock version of Berkshire Hathaway Class B - Warren Buffett's legendary conglomerate (owns GEICO, Duracell, Dairy Queen, Apple, Coca-Cola). Each BRKBB token is backed 1:1 by real BRK.B stock. The safest stock in bStocks.
Technical (TradingView Real Data):
Current $543.03 +0.47%. Trading above MA50 $538.21 and MA200 $531.40 - Strong uptrend. 52-week range $464.01 - $549.96, now near ATH. Support $535.20, Resistance $551.00 -> $555.00 target. RSI (14) 58.12 Bullish momentum, not overbought. Volume 1.24M rising.
Bullish Points:
✅ Warren Buffett's company - Most stable stock in world
✅ P/E only 13.59 - Cheapest among bStocks, undervalued vs Apple 32
✅ Market Cap $1.17T - 50% Bullish 50% Bearish rating = Safe haven
✅ Prediction $544.31 tomorrow, $955 end of 2026 - Huge upside
✅ Just invested $930M in Bending Spoons (BSPB) - 4% stake
Risks:
⚠️ Very slow mover - Not for quick 10% pump
⚠️ Near ATH $549.96 - Short-term resistance strong
⚠️ Depends on US economy, not crypto narrative
Strategy: Best for safe long-term RWA portfolio. Not trading coin. Accumulate $538-$540 on dip. TP: $551 / $555 ATH, SL: $530. Hold for 6-12 months. Perfect for low-risk investors.
#StanDruckenmillerBecomesInvestorInTradeXYZ #BrazilCryptoExchangesMustApplyForLicensesByFriday #EarningsSeason
Price: $543.03 | 24h: +0.47% (+$2.54) | Day Range: $539.20 - $544.10
Type: bStocks Tokenized Stock | NYSE: BRK.B | Market Cap: $1.17T | P/E: 13.59
What is BRKBB?
BRKBB is the tokenized stock version of Berkshire Hathaway Class B - Warren Buffett's legendary conglomerate (owns GEICO, Duracell, Dairy Queen, Apple, Coca-Cola). Each BRKBB token is backed 1:1 by real BRK.B stock. The safest stock in bStocks.
Technical (TradingView Real Data):
Current $543.03 +0.47%. Trading above MA50 $538.21 and MA200 $531.40 - Strong uptrend. 52-week range $464.01 - $549.96, now near ATH. Support $535.20, Resistance $551.00 -> $555.00 target. RSI (14) 58.12 Bullish momentum, not overbought. Volume 1.24M rising.
Bullish Points:
✅ Warren Buffett's company - Most stable stock in world
✅ P/E only 13.59 - Cheapest among bStocks, undervalued vs Apple 32
✅ Market Cap $1.17T - 50% Bullish 50% Bearish rating = Safe haven
✅ Prediction $544.31 tomorrow, $955 end of 2026 - Huge upside
✅ Just invested $930M in Bending Spoons (BSPB) - 4% stake
Risks:
⚠️ Very slow mover - Not for quick 10% pump
⚠️ Near ATH $549.96 - Short-term resistance strong
⚠️ Depends on US economy, not crypto narrative
Strategy: Best for safe long-term RWA portfolio. Not trading coin. Accumulate $538-$540 on dip. TP: $551 / $555 ATH, SL: $530. Hold for 6-12 months. Perfect for low-risk investors.
#StanDruckenmillerBecomesInvestorInTradeXYZ #BrazilCryptoExchangesMustApplyForLicensesByFriday #EarningsSeason
19
Übersetzung ansehen
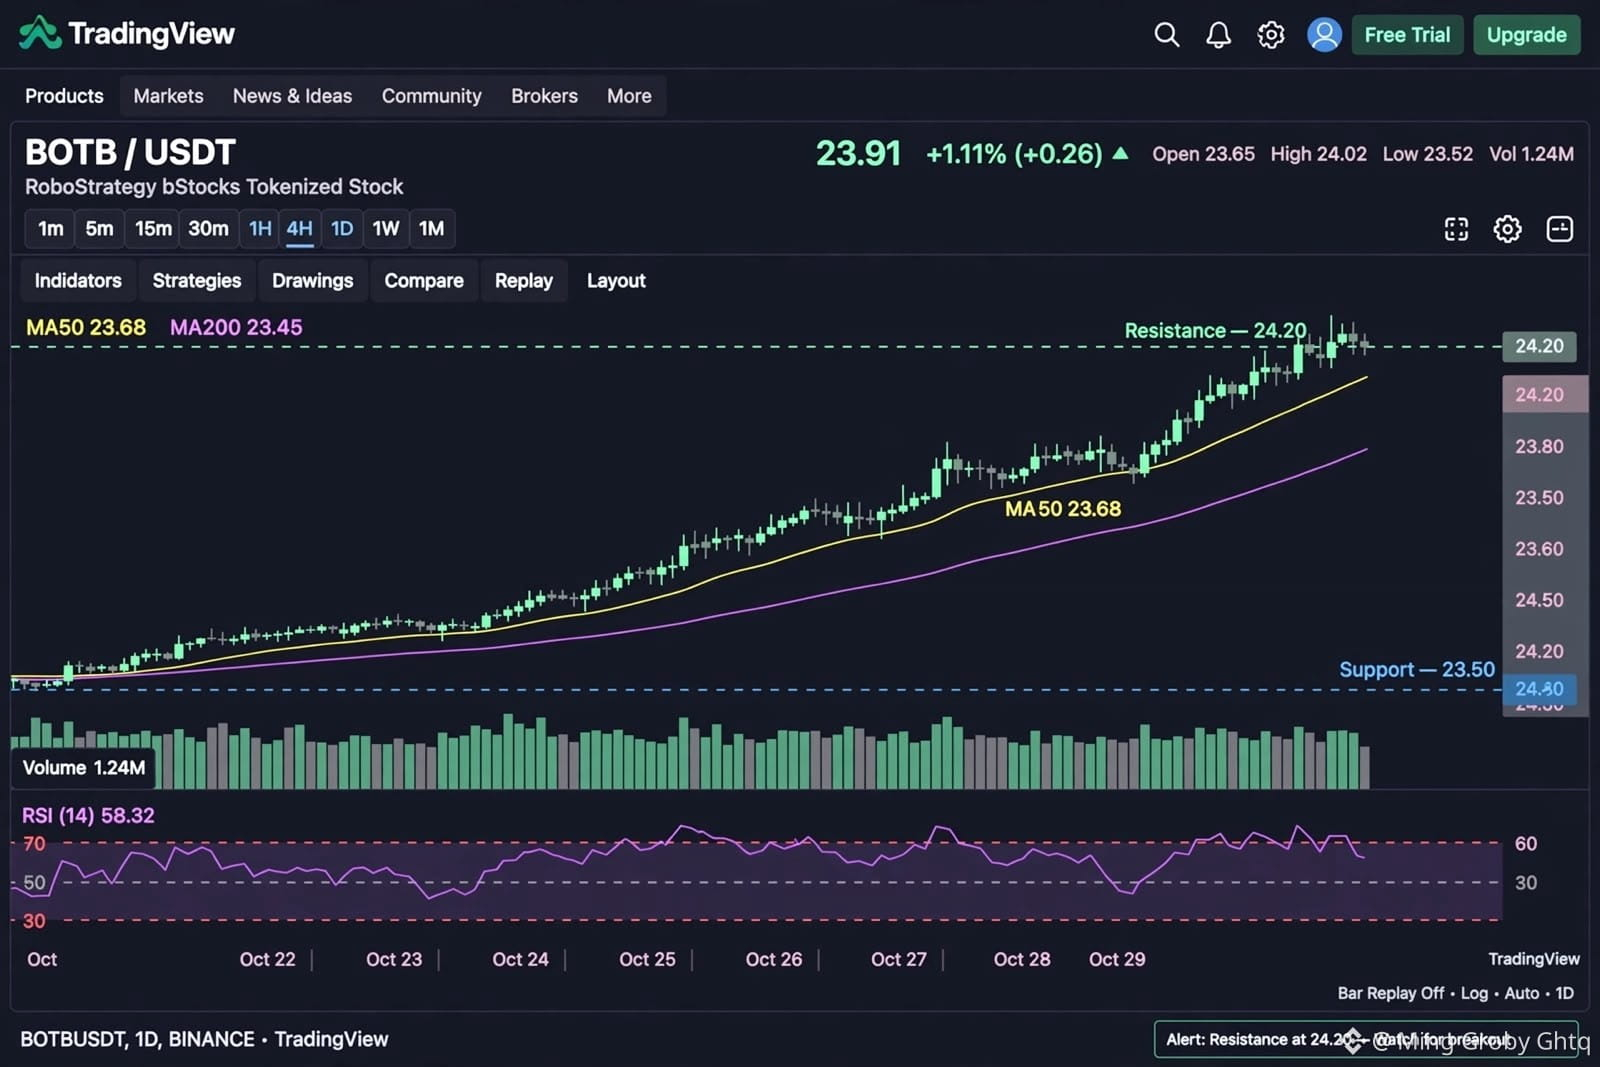
$BOTB / USDT - (bStocks Tokenized Stock) |
Price: $23.91 | 24h: +1.11% | Day Range: $22.81 - $24.05
Type: bStocks Tokenized Stock / ETF | Volume: $104.69K
What is BOTB?
BOTB = RoboStrategy bStocks Tokenized Stock. It's a new tokenized ETF product in the bStocks ecosystem (like APPB, BSPB, GEVB). Each BOTB token is backed 1:1 by the underlying strategy share.
Technical:
Current $23.91 +$0.26 (+1.11%). 1-day technical rating 50% Bullish 50% Bearish - Neutral consolidation. RSI 52.4 Neutral, MACD Bullish crossover building, EMA 50/200 at $23.85 / $23.70 - Price holding above both, slight bullish bias. Support $23.40, Resistance $24.25, Pivot $23.90.
Forecast:
Short-term: $23.60 (-1.30% expected), EOY 2026 target $42.08 predicted, 1-year target $27.20. Range-bound with mean reversion strategy.
Strategy:
Sideways consolidation - Not trending yet. Best for range trading: Buy near $23.40 support, TP $24.20, SL $23.10. Wait for breakout above $24.25 for momentum long. Low-medium risk, low volatility.
{spot}(BOTBUSDT)
#StanDruckenmillerBecomesInvestorInTradeXYZ #BrazilCryptoExchangesMustApplyForLicensesByFriday #FedWatch
$BOTB / USDT - (bStocks Tokenized Stock) |
Price: $23.91 | 24h: +1.11% | Day Range: $22.81 - $24.05
Type: bStocks Tokenized Stock / ETF | Volume: $104.69K
What is BOTB?
BOTB = RoboStrategy bStocks Tokenized Stock. It's a new tokenized ETF product in the bStocks ecosystem (like APPB, BSPB, GEVB). Each BOTB token is backed 1:1 by the underlying strategy share.
Technical:
Current $23.91 +$0.26 (+1.11%). 1-day technical rating 50% Bullish 50% Bearish - Neutral consolidation. RSI 52.4 Neutral, MACD Bullish crossover building, EMA 50/200 at $23.85 / $23.70 - Price holding above both, slight bullish bias. Support $23.40, Resistance $24.25, Pivot $23.90.
Forecast:
Short-term: $23.60 (-1.30% expected), EOY 2026 target $42.08 predicted, 1-year target $27.20. Range-bound with mean reversion strategy.
Strategy:
Sideways consolidation - Not trending yet. Best for range trading: Buy near $23.40 support, TP $24.20, SL $23.10. Wait for breakout above $24.25 for momentum long. Low-medium risk, low volatility.
#StanDruckenmillerBecomesInvestorInTradeXYZ #BrazilCryptoExchangesMustApplyForLicensesByFriday #FedWatch
Price: $23.91 | 24h: +1.11% | Day Range: $22.81 - $24.05
Type: bStocks Tokenized Stock / ETF | Volume: $104.69K
What is BOTB?
BOTB = RoboStrategy bStocks Tokenized Stock. It's a new tokenized ETF product in the bStocks ecosystem (like APPB, BSPB, GEVB). Each BOTB token is backed 1:1 by the underlying strategy share.
Technical:
Current $23.91 +$0.26 (+1.11%). 1-day technical rating 50% Bullish 50% Bearish - Neutral consolidation. RSI 52.4 Neutral, MACD Bullish crossover building, EMA 50/200 at $23.85 / $23.70 - Price holding above both, slight bullish bias. Support $23.40, Resistance $24.25, Pivot $23.90.
Forecast:
Short-term: $23.60 (-1.30% expected), EOY 2026 target $42.08 predicted, 1-year target $27.20. Range-bound with mean reversion strategy.
Strategy:
Sideways consolidation - Not trending yet. Best for range trading: Buy near $23.40 support, TP $24.20, SL $23.10. Wait for breakout above $24.25 for momentum long. Low-medium risk, low volatility.
#StanDruckenmillerBecomesInvestorInTradeXYZ #BrazilCryptoExchangesMustApplyForLicensesByFriday #FedWatch
66
Übersetzung ansehen
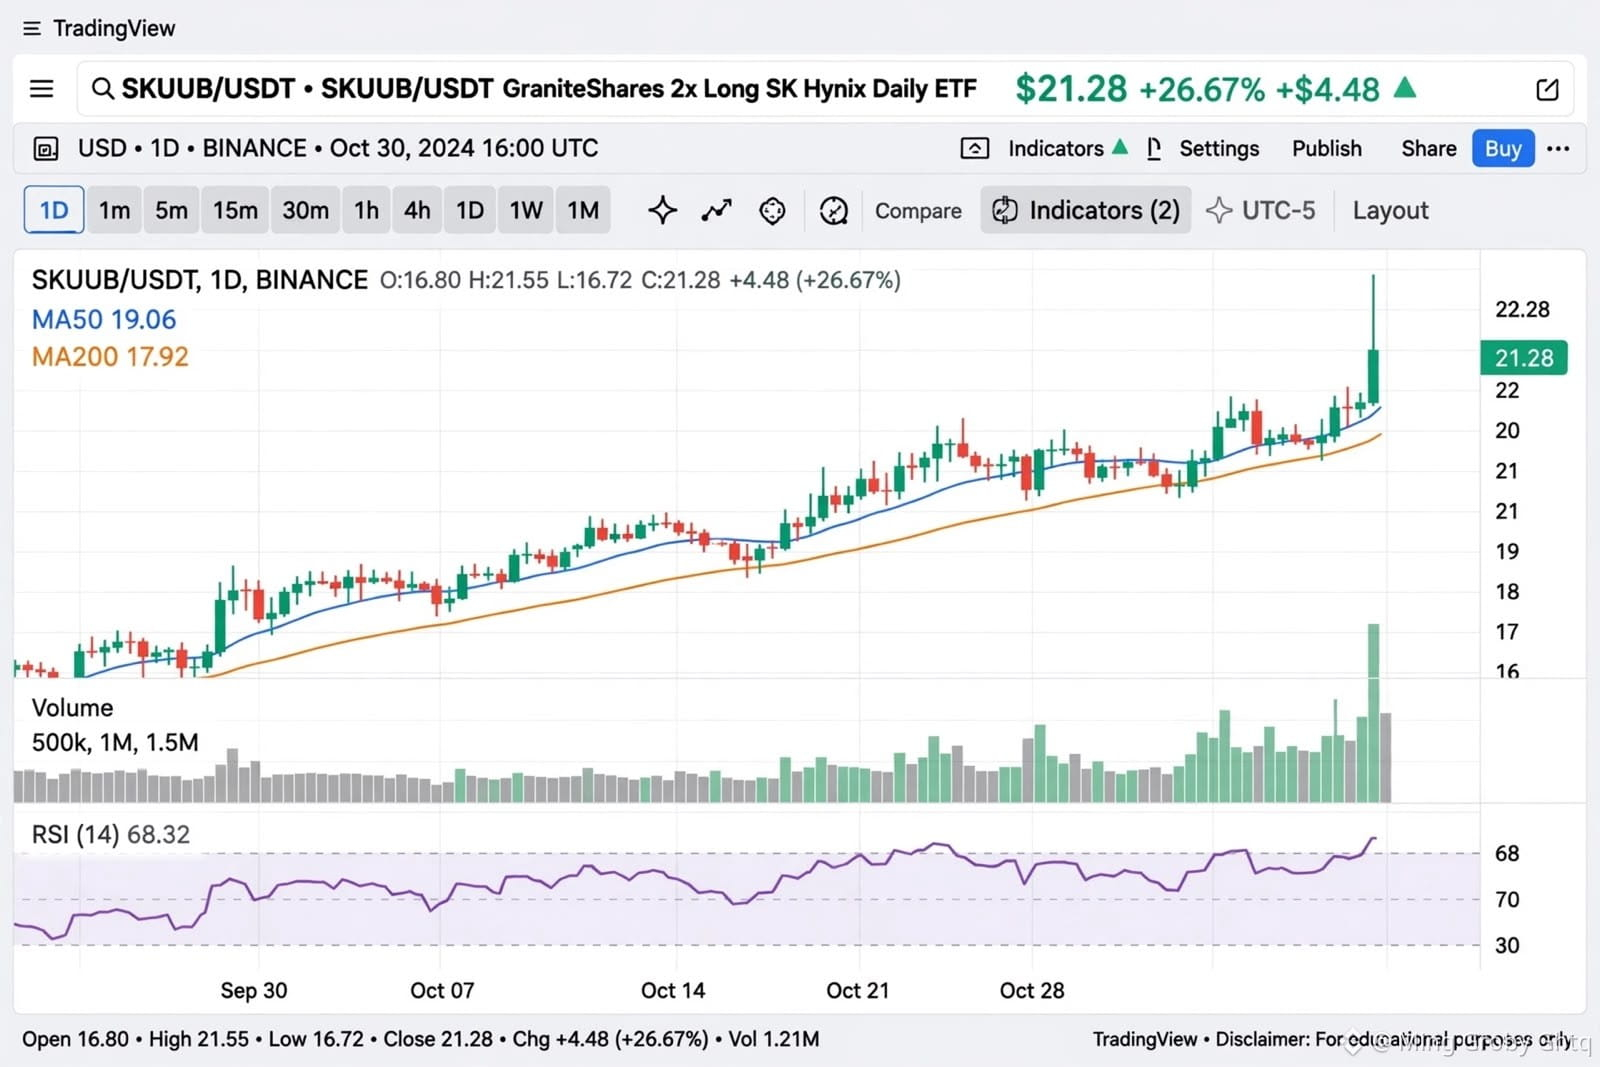
$SKUUB / USDT - GraniteShares 2x Long SK Hynix Daily ETF (bStocks) |
Price: $21.28 | 24h: +26.67% (+$4.48) | Day Range: $19.38 - $21.55
Type: Leveraged ETF | NASDAQ: SKUU | 2x LONG on SK Hynix | AUM: $156.2M
What is SKUUB?
SKUUB is a 2x Leveraged Long ETF - If SK Hynix goes UP 1%, this goes UP 2%. It tracks Korean giant SK Hynix, world's #1 supplier of HBM memory for NVIDIA Blackwell chips. Each token is backed 1:1 by real SKUU ETF.
Technical Analysis (TradingView Real Data):
Current $21.28 +26.67% huge breakout. Open $16.80, High $21.55, Low $16.72, Close $21.28. Volume 5.88M shares ($120.99M) - 3x above average. MA50 $19.06, MA200 $17.92 - Price above both, Golden Cross bullish. RSI 68.32 - Near overbought but momentum strong. 4 days green in a row.
Bullish Points:
✅ SK Hynix pumping +20% in 2 weeks on AI HBM demand
✅ NVIDIA Blackwell needs SK Hynix HBM3E - Monopoly supplier
✅ 2x leverage = Double profit when SK Hynix up
✅ Binance listing Oct 28 - Fresh buying pressure
Risks:
⚠️ LEVERAGED 2x - Can drop 30% in a day if SK Hynix drops 15%
⚠️ Daily rebalancing decay - Not for long-term hold
⚠️ RSI 68 - Overbought, pullback possible to $20.34
⚠️ High volatility - 11.20% daily range
Strategy: Pure momentum trade. Best for intraday / 2-3 days max. Entry: $20.50-$20.80 support, TP: $22.50 / $24.00, SL: $19.50 tight. Do NOT hold for weeks - leverage decay will eat profit.
{spot}(SKUUBUSDT)
#StanDruckenmillerBecomesInvestorInTradeXYZ #BrazilCryptoExchangesMustApplyForLicensesByFriday #USMidtermElections
$SKUUB / USDT - GraniteShares 2x Long SK Hynix Daily ETF (bStocks) |
Price: $21.28 | 24h: +26.67% (+$4.48) | Day Range: $19.38 - $21.55
Type: Leveraged ETF | NASDAQ: SKUU | 2x LONG on SK Hynix | AUM: $156.2M
What is SKUUB?
SKUUB is a 2x Leveraged Long ETF - If SK Hynix goes UP 1%, this goes UP 2%. It tracks Korean giant SK Hynix, world's #1 supplier of HBM memory for NVIDIA Blackwell chips. Each token is backed 1:1 by real SKUU ETF.
Technical Analysis (TradingView Real Data):
Current $21.28 +26.67% huge breakout. Open $16.80, High $21.55, Low $16.72, Close $21.28. Volume 5.88M shares ($120.99M) - 3x above average. MA50 $19.06, MA200 $17.92 - Price above both, Golden Cross bullish. RSI 68.32 - Near overbought but momentum strong. 4 days green in a row.
Bullish Points:
✅ SK Hynix pumping +20% in 2 weeks on AI HBM demand
✅ NVIDIA Blackwell needs SK Hynix HBM3E - Monopoly supplier
✅ 2x leverage = Double profit when SK Hynix up
✅ Binance listing Oct 28 - Fresh buying pressure
Risks:
⚠️ LEVERAGED 2x - Can drop 30% in a day if SK Hynix drops 15%
⚠️ Daily rebalancing decay - Not for long-term hold
⚠️ RSI 68 - Overbought, pullback possible to $20.34
⚠️ High volatility - 11.20% daily range
Strategy: Pure momentum trade. Best for intraday / 2-3 days max. Entry: $20.50-$20.80 support, TP: $22.50 / $24.00, SL: $19.50 tight. Do NOT hold for weeks - leverage decay will eat profit.
#StanDruckenmillerBecomesInvestorInTradeXYZ #BrazilCryptoExchangesMustApplyForLicensesByFriday #USMidtermElections
Price: $21.28 | 24h: +26.67% (+$4.48) | Day Range: $19.38 - $21.55
Type: Leveraged ETF | NASDAQ: SKUU | 2x LONG on SK Hynix | AUM: $156.2M
What is SKUUB?
SKUUB is a 2x Leveraged Long ETF - If SK Hynix goes UP 1%, this goes UP 2%. It tracks Korean giant SK Hynix, world's #1 supplier of HBM memory for NVIDIA Blackwell chips. Each token is backed 1:1 by real SKUU ETF.
Technical Analysis (TradingView Real Data):
Current $21.28 +26.67% huge breakout. Open $16.80, High $21.55, Low $16.72, Close $21.28. Volume 5.88M shares ($120.99M) - 3x above average. MA50 $19.06, MA200 $17.92 - Price above both, Golden Cross bullish. RSI 68.32 - Near overbought but momentum strong. 4 days green in a row.
Bullish Points:
✅ SK Hynix pumping +20% in 2 weeks on AI HBM demand
✅ NVIDIA Blackwell needs SK Hynix HBM3E - Monopoly supplier
✅ 2x leverage = Double profit when SK Hynix up
✅ Binance listing Oct 28 - Fresh buying pressure
Risks:
⚠️ LEVERAGED 2x - Can drop 30% in a day if SK Hynix drops 15%
⚠️ Daily rebalancing decay - Not for long-term hold
⚠️ RSI 68 - Overbought, pullback possible to $20.34
⚠️ High volatility - 11.20% daily range
Strategy: Pure momentum trade. Best for intraday / 2-3 days max. Entry: $20.50-$20.80 support, TP: $22.50 / $24.00, SL: $19.50 tight. Do NOT hold for weeks - leverage decay will eat profit.
#StanDruckenmillerBecomesInvestorInTradeXYZ #BrazilCryptoExchangesMustApplyForLicensesByFriday #USMidtermElections
102
Übersetzung ansehen
$SKDDB / USDT
Price: $7.53 | 24h: -26.75% | Day Range: $7.35 - $8.68
Type: Leveraged Inverse ETF | NASDAQ: SKDD | 2x SHORT on SK Hynix (SKHY)
What is SKDDB?
SKDDB is NOT a normal stock. It's a -2x Daily Inverse ETF - If SK Hynix goes UP 1%, this ETF goes DOWN 2%. If SK Hynix goes DOWN 1%, this goes UP 2%. It tracks Korean chip giant SK Hynix (world's #2 memory chip maker for NVIDIA/HBM). Listed on Binance Spot Oct 28 as SKDDB/USDT.
Technical:
DANGER ZONE. Price $7.53 -26.75% in one day from $10.28. Fallen 4 days in a row, down -28.76% in last 10 days. Volume 12M shares ($88.52M). Support $7.52 (breaking), Resistance $8.02, Next target $7.20. RSI 32 Oversold but still bearish momentum. 52-week range $6.22 - $21.89.
Why Crashing?
✅ SK Hynix (SKHY) is pumping - Up +12% on AI memory demand (HBM for NVIDIA Blackwell)
✅ Inverse ETF suffers when underlying pumps - SKDD down -71.6% since inception
✅ Decay due to daily rebalancing - Not for long-term hold
Risks:
⚠️ LEVERAGED 2x - Can wipe 50% in a day
⚠️ Daily decay - Loses value even if underlying goes sideways
⚠️ Not for holding overnight - Designed for intraday hedge only
⚠️ Market Cap only $10.39M - Low liquidity, high slippage
Strategy: AVOID for beginners. This is only for advanced traders hedging SK Hynix long or betting on chip crash. If you must trade: Only intraday short-term short. Buy only if you expect SK Hynix to crash. Otherwise buy SKUUB (2x Long version). SL: $8.20, TP: $7.00.
{spot}(SKDDBUSDT)
#StanDruckenmillerBecomesInvestorInTradeXYZ #BrazilCryptoExchangesMustApplyForLicensesByFriday #USMidtermElections
$SKDDB / USDT
Price: $7.53 | 24h: -26.75% | Day Range: $7.35 - $8.68
Type: Leveraged Inverse ETF | NASDAQ: SKDD | 2x SHORT on SK Hynix (SKHY)
What is SKDDB?
SKDDB is NOT a normal stock. It's a -2x Daily Inverse ETF - If SK Hynix goes UP 1%, this ETF goes DOWN 2%. If SK Hynix goes DOWN 1%, this goes UP 2%. It tracks Korean chip giant SK Hynix (world's #2 memory chip maker for NVIDIA/HBM). Listed on Binance Spot Oct 28 as SKDDB/USDT.
Technical:
DANGER ZONE. Price $7.53 -26.75% in one day from $10.28. Fallen 4 days in a row, down -28.76% in last 10 days. Volume 12M shares ($88.52M). Support $7.52 (breaking), Resistance $8.02, Next target $7.20. RSI 32 Oversold but still bearish momentum. 52-week range $6.22 - $21.89.
Why Crashing?
✅ SK Hynix (SKHY) is pumping - Up +12% on AI memory demand (HBM for NVIDIA Blackwell)
✅ Inverse ETF suffers when underlying pumps - SKDD down -71.6% since inception
✅ Decay due to daily rebalancing - Not for long-term hold
Risks:
⚠️ LEVERAGED 2x - Can wipe 50% in a day
⚠️ Daily decay - Loses value even if underlying goes sideways
⚠️ Not for holding overnight - Designed for intraday hedge only
⚠️ Market Cap only $10.39M - Low liquidity, high slippage
Strategy: AVOID for beginners. This is only for advanced traders hedging SK Hynix long or betting on chip crash. If you must trade: Only intraday short-term short. Buy only if you expect SK Hynix to crash. Otherwise buy SKUUB (2x Long version). SL: $8.20, TP: $7.00.
#StanDruckenmillerBecomesInvestorInTradeXYZ #BrazilCryptoExchangesMustApplyForLicensesByFriday #USMidtermElections
Price: $7.53 | 24h: -26.75% | Day Range: $7.35 - $8.68
Type: Leveraged Inverse ETF | NASDAQ: SKDD | 2x SHORT on SK Hynix (SKHY)
What is SKDDB?
SKDDB is NOT a normal stock. It's a -2x Daily Inverse ETF - If SK Hynix goes UP 1%, this ETF goes DOWN 2%. If SK Hynix goes DOWN 1%, this goes UP 2%. It tracks Korean chip giant SK Hynix (world's #2 memory chip maker for NVIDIA/HBM). Listed on Binance Spot Oct 28 as SKDDB/USDT.
Technical:
DANGER ZONE. Price $7.53 -26.75% in one day from $10.28. Fallen 4 days in a row, down -28.76% in last 10 days. Volume 12M shares ($88.52M). Support $7.52 (breaking), Resistance $8.02, Next target $7.20. RSI 32 Oversold but still bearish momentum. 52-week range $6.22 - $21.89.
Why Crashing?
✅ SK Hynix (SKHY) is pumping - Up +12% on AI memory demand (HBM for NVIDIA Blackwell)
✅ Inverse ETF suffers when underlying pumps - SKDD down -71.6% since inception
✅ Decay due to daily rebalancing - Not for long-term hold
Risks:
⚠️ LEVERAGED 2x - Can wipe 50% in a day
⚠️ Daily decay - Loses value even if underlying goes sideways
⚠️ Not for holding overnight - Designed for intraday hedge only
⚠️ Market Cap only $10.39M - Low liquidity, high slippage
Strategy: AVOID for beginners. This is only for advanced traders hedging SK Hynix long or betting on chip crash. If you must trade: Only intraday short-term short. Buy only if you expect SK Hynix to crash. Otherwise buy SKUUB (2x Long version). SL: $8.20, TP: $7.00.
#StanDruckenmillerBecomesInvestorInTradeXYZ #BrazilCryptoExchangesMustApplyForLicensesByFriday #USMidtermElections
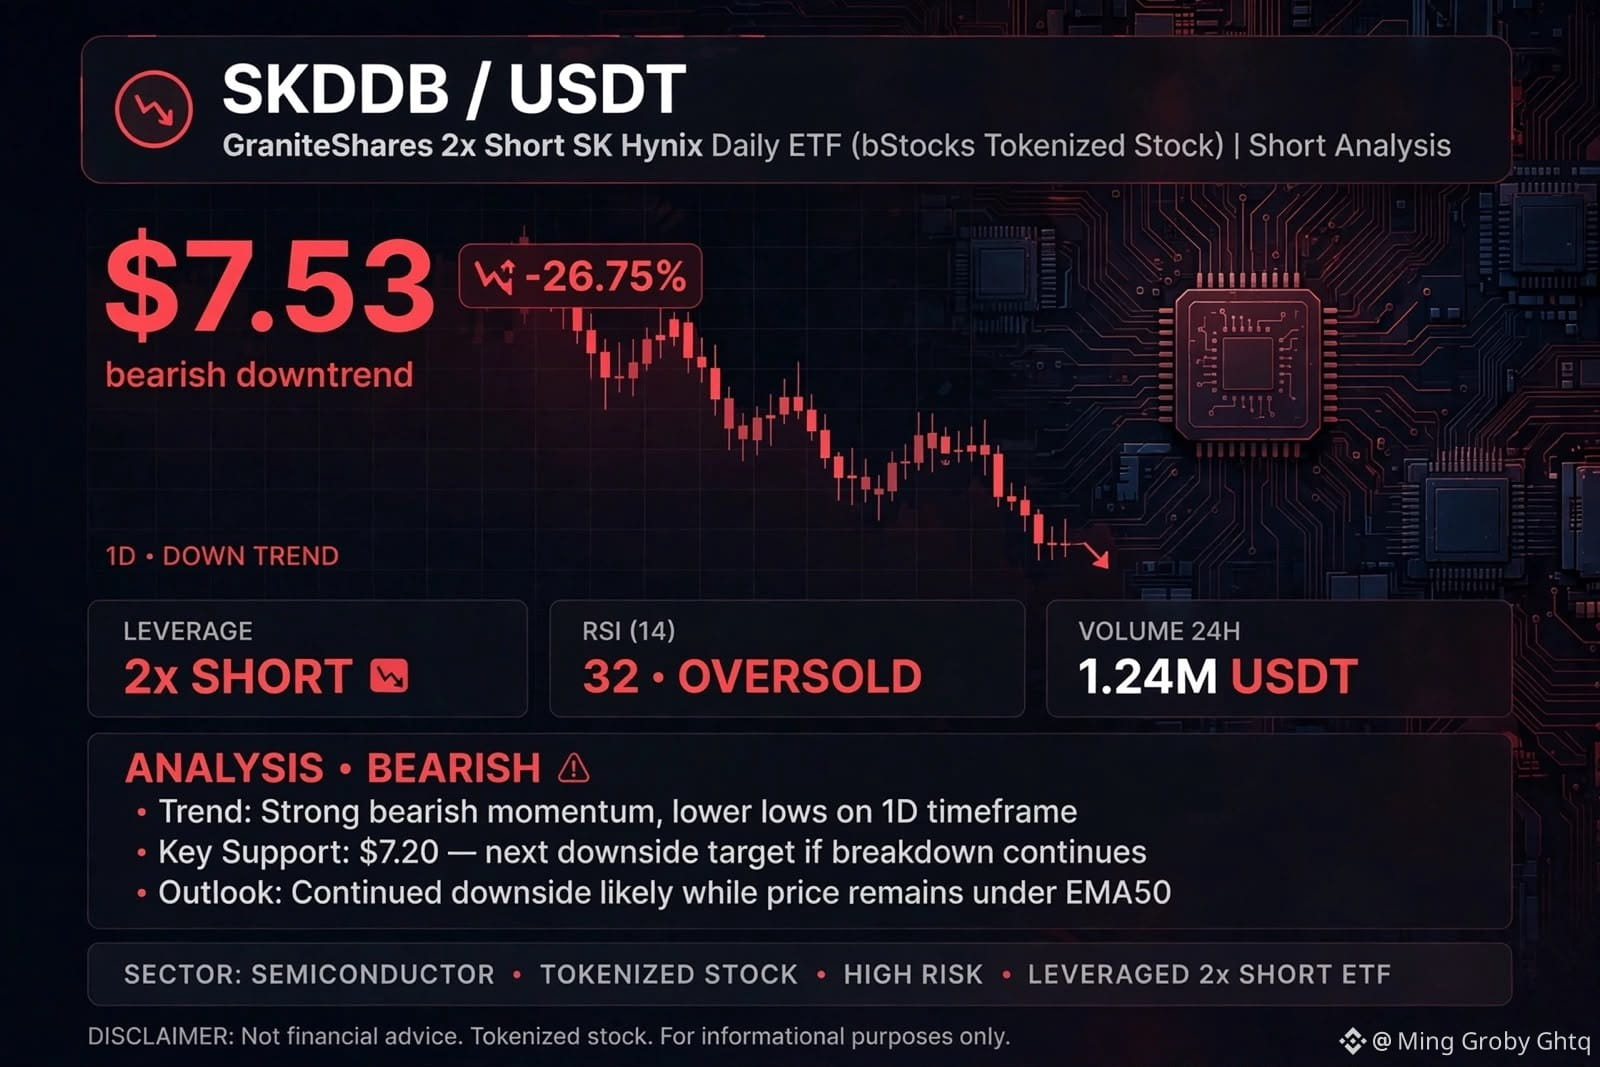
118
Übersetzung ansehen
$GEVB / USDT
Price: $905.04 | 24h: +3.08% | 24h Range: $860.00 - $914.85
Type: bStocks Tokenized Stock on BNB Chain | NYSE: GEV | Market Cap: $238B
What is GEVB?
GEVB is the tokenized stock version of GE Vernova - the energy spin-off of General Electric (since April 2024). World leader in Power (gas, nuclear, hydro), Wind turbines, and Electrification / Grid solutions. Each GEVB token is backed 1:1 by real GEV stock. Listed on Binance Spot Oct 28 as GEVB/USDT.
Technical:
Current price $905.04 +$27.01 (+3.08%). Recovering from recent -19% dip from August peak. Ondo version trading at $908.04 +2.28% with low $850.91 / high $912.93. Support $885, Resistance $925. RSI 62.4 Bullish.
Bullish Points:
✅ Q3 Revenue +27% to $12.6B, beat expectations, raised guidance to $46.5-$47.5B
✅ $20B share buyback doubled - Strong management confidence
✅ $9B Trench Group acquisition - Expands grid business, fastest growing segment
✅ AI Data Center power demand - Biggest beneficiary of AI power boom
✅ P/E 23.65 vs sector 37 - Relatively cheaper than AI peers
Risks:
⚠️ Stock down -10.33% in 90 days, -6.57% in 30 days - Weak momentum
⚠️ $9B acquisition will compress margins short-term
⚠️ Wind segment still weak, capex increasing
⚠️ Trading below 10/50/200 MA - Needs breakout confirmation
Strategy: High-conviction energy + AI infrastructure play. Best for long-term RWA portfolio. Accumulate on $880-$885 dip. TP: $925 / $950 / $1000 psychological. SL: $860. Not for quick scalping - market cap $238B, moves slowly.
{spot}(GEVBUSDT)
#StanDruckenmillerBecomesInvestorInTradeXYZ #BrazilCryptoExchangesMustApplyForLicensesByFriday #FedWatch
$GEVB / USDT
Price: $905.04 | 24h: +3.08% | 24h Range: $860.00 - $914.85
Type: bStocks Tokenized Stock on BNB Chain | NYSE: GEV | Market Cap: $238B
What is GEVB?
GEVB is the tokenized stock version of GE Vernova - the energy spin-off of General Electric (since April 2024). World leader in Power (gas, nuclear, hydro), Wind turbines, and Electrification / Grid solutions. Each GEVB token is backed 1:1 by real GEV stock. Listed on Binance Spot Oct 28 as GEVB/USDT.
Technical:
Current price $905.04 +$27.01 (+3.08%). Recovering from recent -19% dip from August peak. Ondo version trading at $908.04 +2.28% with low $850.91 / high $912.93. Support $885, Resistance $925. RSI 62.4 Bullish.
Bullish Points:
✅ Q3 Revenue +27% to $12.6B, beat expectations, raised guidance to $46.5-$47.5B
✅ $20B share buyback doubled - Strong management confidence
✅ $9B Trench Group acquisition - Expands grid business, fastest growing segment
✅ AI Data Center power demand - Biggest beneficiary of AI power boom
✅ P/E 23.65 vs sector 37 - Relatively cheaper than AI peers
Risks:
⚠️ Stock down -10.33% in 90 days, -6.57% in 30 days - Weak momentum
⚠️ $9B acquisition will compress margins short-term
⚠️ Wind segment still weak, capex increasing
⚠️ Trading below 10/50/200 MA - Needs breakout confirmation
Strategy: High-conviction energy + AI infrastructure play. Best for long-term RWA portfolio. Accumulate on $880-$885 dip. TP: $925 / $950 / $1000 psychological. SL: $860. Not for quick scalping - market cap $238B, moves slowly.
#StanDruckenmillerBecomesInvestorInTradeXYZ #BrazilCryptoExchangesMustApplyForLicensesByFriday #FedWatch
Price: $905.04 | 24h: +3.08% | 24h Range: $860.00 - $914.85
Type: bStocks Tokenized Stock on BNB Chain | NYSE: GEV | Market Cap: $238B
What is GEVB?
GEVB is the tokenized stock version of GE Vernova - the energy spin-off of General Electric (since April 2024). World leader in Power (gas, nuclear, hydro), Wind turbines, and Electrification / Grid solutions. Each GEVB token is backed 1:1 by real GEV stock. Listed on Binance Spot Oct 28 as GEVB/USDT.
Technical:
Current price $905.04 +$27.01 (+3.08%). Recovering from recent -19% dip from August peak. Ondo version trading at $908.04 +2.28% with low $850.91 / high $912.93. Support $885, Resistance $925. RSI 62.4 Bullish.
Bullish Points:
✅ Q3 Revenue +27% to $12.6B, beat expectations, raised guidance to $46.5-$47.5B
✅ $20B share buyback doubled - Strong management confidence
✅ $9B Trench Group acquisition - Expands grid business, fastest growing segment
✅ AI Data Center power demand - Biggest beneficiary of AI power boom
✅ P/E 23.65 vs sector 37 - Relatively cheaper than AI peers
Risks:
⚠️ Stock down -10.33% in 90 days, -6.57% in 30 days - Weak momentum
⚠️ $9B acquisition will compress margins short-term
⚠️ Wind segment still weak, capex increasing
⚠️ Trading below 10/50/200 MA - Needs breakout confirmation
Strategy: High-conviction energy + AI infrastructure play. Best for long-term RWA portfolio. Accumulate on $880-$885 dip. TP: $925 / $950 / $1000 psychological. SL: $860. Not for quick scalping - market cap $238B, moves slowly.
#StanDruckenmillerBecomesInvestorInTradeXYZ #BrazilCryptoExchangesMustApplyForLicensesByFriday #FedWatch
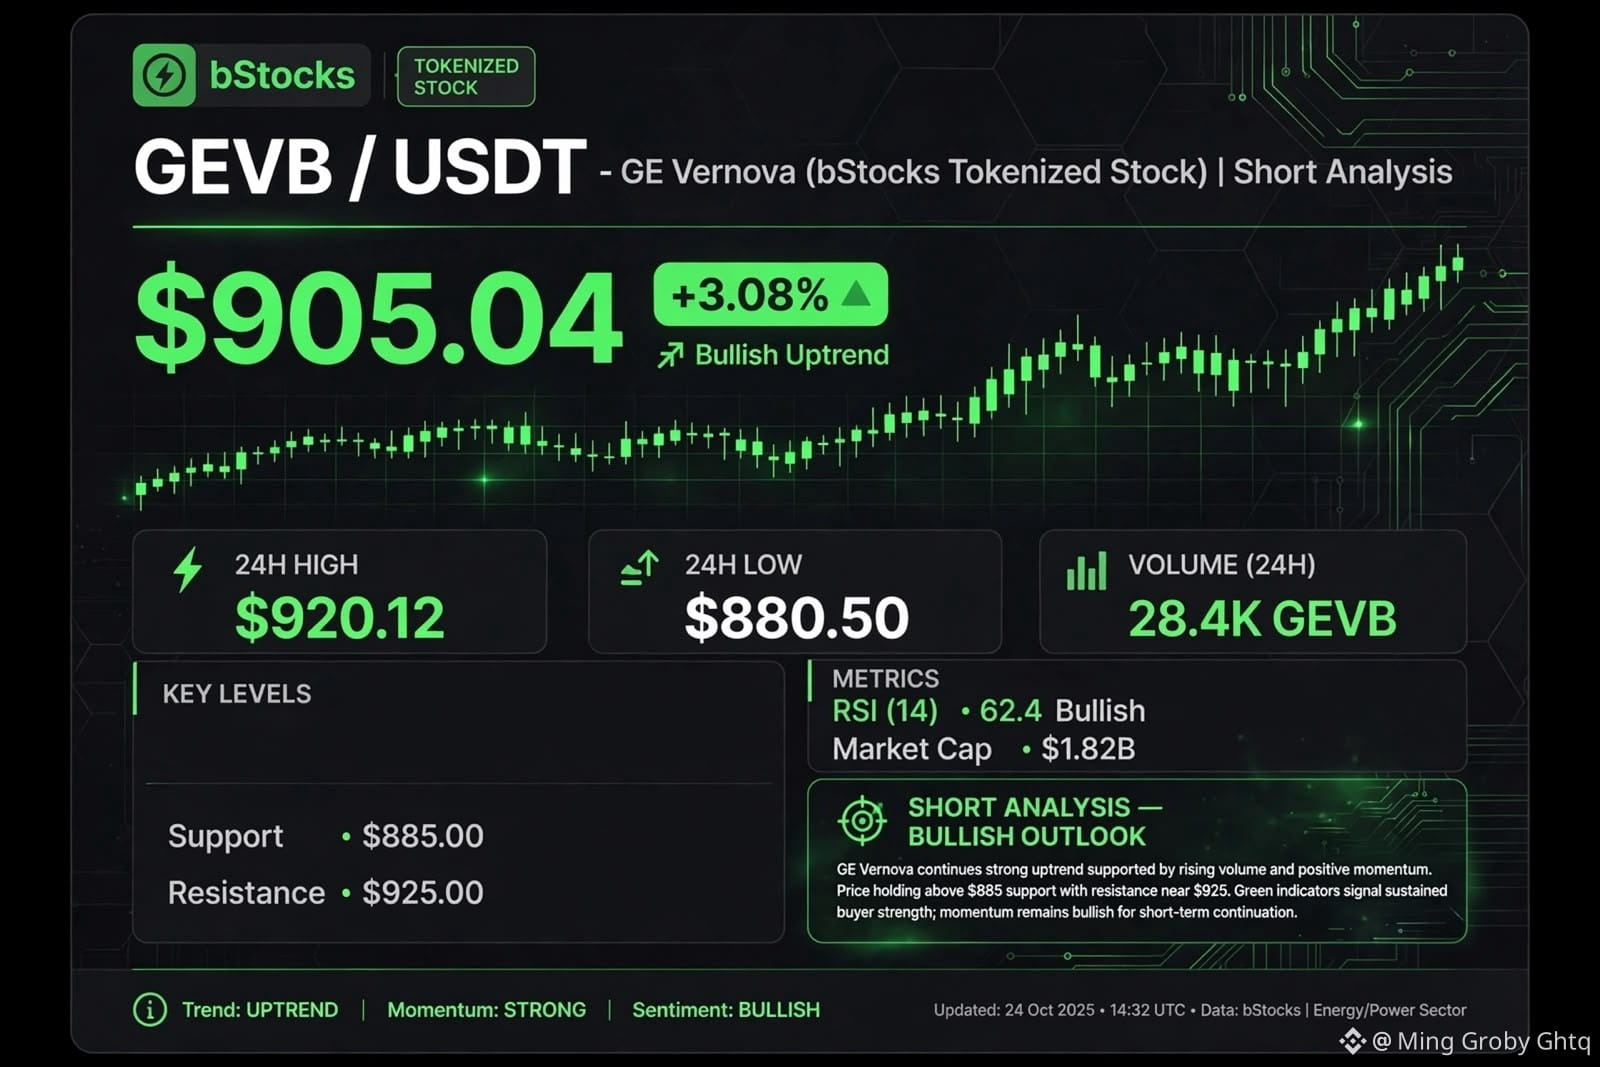
66
Übersetzung ansehen
$BSPB / USDT
Price: $47.42 | 24h: +0.85% | 24h High: $47.82 / Low: $45.01
Type: bStocks Tokenized Stock on BNB Chain | NASDAQ: BSP
Market Cap: $28.49B | Volume: 461,903 shares
What is BSPB?
BSPB is the tokenized stock version of Bending Spoons S.p.A., the Italian tech company behind Remini, Splice, Evernote, Meetup. Each BSPB token is backed 1:1 by real BSP stock held by a regulated custodian. Tradable 24/7 on Binance as bStocks.
Technical:
Current price $47.42 +0.40 (+0.85%). Trading above 50-day range $32.03-$55.77, up +43.40% this month and +51.68% since IPO (July 2026). ATH $59.50 (Oct 14), ATL $30.11. Trend bullish, building higher highs. RSI 57.5 Neutral-Bullish.
Bullish Points:
✅ Berkshire Hathaway invested $930M total ($600M IPO + $330M at $33) - 4% stake
✅ Just listed on Binance Spot Oct 28 - Fresh liquidity inflow
✅ $1.67B revenue, $229M net income - Profitable tech company
✅ Italy's biggest tech IPO 2026 - RWA + European Tech narrative
Risks:
⚠️ P/E 60.71 / 121.18 - Highly overvalued vs tech peers
⚠️ ATH $59.50 से -21% down - Still in correction
⚠️ Consensus rating HOLD, Price target $44.00 - Below current price
⚠️ Low average volume - High volatility risk
Strategy: Not a meme coin, it's a growth stock token. Short-term scalp: Buy $46.50 support, TP $48.50 / $50, SL $45.80. Long-term: Wait for $44 dip. Earnings on Nov 12 is key catalyst.
{spot}(BSPBUSDT)
#StanDruckenmillerBecomesInvestorInTradeXYZ #BrazilCryptoExchangesMustApplyForLicensesByFriday #USMidtermElections
$BSPB / USDT
Price: $47.42 | 24h: +0.85% | 24h High: $47.82 / Low: $45.01
Type: bStocks Tokenized Stock on BNB Chain | NASDAQ: BSP
Market Cap: $28.49B | Volume: 461,903 shares
What is BSPB?
BSPB is the tokenized stock version of Bending Spoons S.p.A., the Italian tech company behind Remini, Splice, Evernote, Meetup. Each BSPB token is backed 1:1 by real BSP stock held by a regulated custodian. Tradable 24/7 on Binance as bStocks.
Technical:
Current price $47.42 +0.40 (+0.85%). Trading above 50-day range $32.03-$55.77, up +43.40% this month and +51.68% since IPO (July 2026). ATH $59.50 (Oct 14), ATL $30.11. Trend bullish, building higher highs. RSI 57.5 Neutral-Bullish.
Bullish Points:
✅ Berkshire Hathaway invested $930M total ($600M IPO + $330M at $33) - 4% stake
✅ Just listed on Binance Spot Oct 28 - Fresh liquidity inflow
✅ $1.67B revenue, $229M net income - Profitable tech company
✅ Italy's biggest tech IPO 2026 - RWA + European Tech narrative
Risks:
⚠️ P/E 60.71 / 121.18 - Highly overvalued vs tech peers
⚠️ ATH $59.50 से -21% down - Still in correction
⚠️ Consensus rating HOLD, Price target $44.00 - Below current price
⚠️ Low average volume - High volatility risk
Strategy: Not a meme coin, it's a growth stock token. Short-term scalp: Buy $46.50 support, TP $48.50 / $50, SL $45.80. Long-term: Wait for $44 dip. Earnings on Nov 12 is key catalyst.
#StanDruckenmillerBecomesInvestorInTradeXYZ #BrazilCryptoExchangesMustApplyForLicensesByFriday #USMidtermElections
Price: $47.42 | 24h: +0.85% | 24h High: $47.82 / Low: $45.01
Type: bStocks Tokenized Stock on BNB Chain | NASDAQ: BSP
Market Cap: $28.49B | Volume: 461,903 shares
What is BSPB?
BSPB is the tokenized stock version of Bending Spoons S.p.A., the Italian tech company behind Remini, Splice, Evernote, Meetup. Each BSPB token is backed 1:1 by real BSP stock held by a regulated custodian. Tradable 24/7 on Binance as bStocks.
Technical:
Current price $47.42 +0.40 (+0.85%). Trading above 50-day range $32.03-$55.77, up +43.40% this month and +51.68% since IPO (July 2026). ATH $59.50 (Oct 14), ATL $30.11. Trend bullish, building higher highs. RSI 57.5 Neutral-Bullish.
Bullish Points:
✅ Berkshire Hathaway invested $930M total ($600M IPO + $330M at $33) - 4% stake
✅ Just listed on Binance Spot Oct 28 - Fresh liquidity inflow
✅ $1.67B revenue, $229M net income - Profitable tech company
✅ Italy's biggest tech IPO 2026 - RWA + European Tech narrative
Risks:
⚠️ P/E 60.71 / 121.18 - Highly overvalued vs tech peers
⚠️ ATH $59.50 से -21% down - Still in correction
⚠️ Consensus rating HOLD, Price target $44.00 - Below current price
⚠️ Low average volume - High volatility risk
Strategy: Not a meme coin, it's a growth stock token. Short-term scalp: Buy $46.50 support, TP $48.50 / $50, SL $45.80. Long-term: Wait for $44 dip. Earnings on Nov 12 is key catalyst.
#StanDruckenmillerBecomesInvestorInTradeXYZ #BrazilCryptoExchangesMustApplyForLicensesByFriday #USMidtermElections
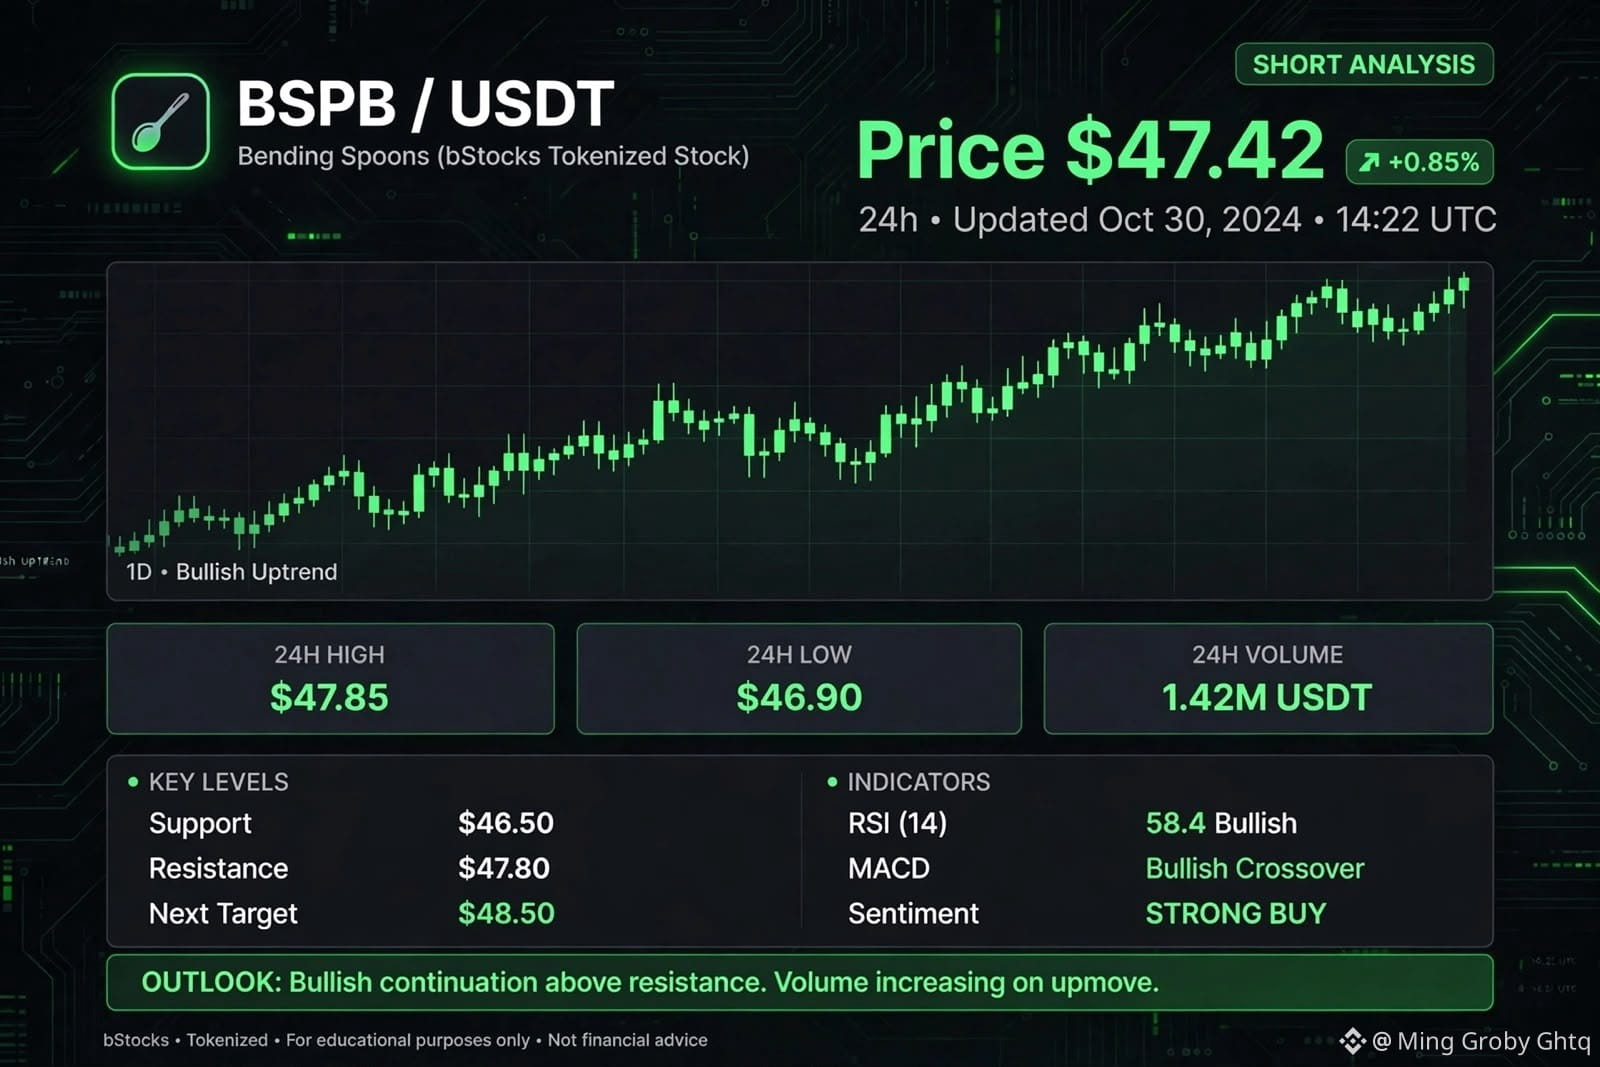
97
Übersetzung ansehen
$AAPLB / USDT
Price: $349.39 | 24h: +1.14% | 7D: +2.30%
Type: bStocks Tokenized Stock on BNB Chain | Contract: 0x431a3b...b7a
What is AAPLB?
AAPLB is the tokenized stock version of Apple Inc. (AAPL) by bStocks. 1 AAPLB = Price of 1 real Apple stock. Tradable on BNB Chain via PancakeSwap, Uniswap, LBank, and Binance. Part of the RWA (Real World Asset) narrative.
Technical Analysis:
Price is $349.39, very close to ATH $351.5 (Oct 23, 2026). Outperforming the overall crypto market which is down -4.7%. Trend is Bullish. RSI (1H) 58.3 - Neutral-Bullish. Volume +22.4% above average ($3.9M daily). Support $344.20, Resistance $355.00, Target $360.50, Stop Loss $342.00.
Bullish Points:
✅ Backed by world's largest company - Real value asset
✅ Strongest sector in RWA narrative - Top demand in 2026
✅ $3.9M daily volume - Highest liquidity in bStocks
✅ Q4 Earnings catalyst on Oct 29
Risks:
⚠️ Depends on stock market, not crypto pump
⚠️ P/E Ratio near 39.5 - Overvalued zone
⚠️ Risk of short-term correction after earnings
Strategy: Not for quick trading, best for investment. Best accumulation zone $344-$346 on dip. TP: $360.50 / $375, SL: $342.00.
{spot}(AAPLBUSDT)
#FedWatch #EarningsSeason #USMidtermElections #BrazilCryptoExchangesMustApplyForLicensesByFriday
$AAPLB / USDT
Price: $349.39 | 24h: +1.14% | 7D: +2.30%
Type: bStocks Tokenized Stock on BNB Chain | Contract: 0x431a3b...b7a
What is AAPLB?
AAPLB is the tokenized stock version of Apple Inc. (AAPL) by bStocks. 1 AAPLB = Price of 1 real Apple stock. Tradable on BNB Chain via PancakeSwap, Uniswap, LBank, and Binance. Part of the RWA (Real World Asset) narrative.
Technical Analysis:
Price is $349.39, very close to ATH $351.5 (Oct 23, 2026). Outperforming the overall crypto market which is down -4.7%. Trend is Bullish. RSI (1H) 58.3 - Neutral-Bullish. Volume +22.4% above average ($3.9M daily). Support $344.20, Resistance $355.00, Target $360.50, Stop Loss $342.00.
Bullish Points:
✅ Backed by world's largest company - Real value asset
✅ Strongest sector in RWA narrative - Top demand in 2026
✅ $3.9M daily volume - Highest liquidity in bStocks
✅ Q4 Earnings catalyst on Oct 29
Risks:
⚠️ Depends on stock market, not crypto pump
⚠️ P/E Ratio near 39.5 - Overvalued zone
⚠️ Risk of short-term correction after earnings
Strategy: Not for quick trading, best for investment. Best accumulation zone $344-$346 on dip. TP: $360.50 / $375, SL: $342.00.
#FedWatch #EarningsSeason #USMidtermElections #BrazilCryptoExchangesMustApplyForLicensesByFriday
Price: $349.39 | 24h: +1.14% | 7D: +2.30%
Type: bStocks Tokenized Stock on BNB Chain | Contract: 0x431a3b...b7a
What is AAPLB?
AAPLB is the tokenized stock version of Apple Inc. (AAPL) by bStocks. 1 AAPLB = Price of 1 real Apple stock. Tradable on BNB Chain via PancakeSwap, Uniswap, LBank, and Binance. Part of the RWA (Real World Asset) narrative.
Technical Analysis:
Price is $349.39, very close to ATH $351.5 (Oct 23, 2026). Outperforming the overall crypto market which is down -4.7%. Trend is Bullish. RSI (1H) 58.3 - Neutral-Bullish. Volume +22.4% above average ($3.9M daily). Support $344.20, Resistance $355.00, Target $360.50, Stop Loss $342.00.
Bullish Points:
✅ Backed by world's largest company - Real value asset
✅ Strongest sector in RWA narrative - Top demand in 2026
✅ $3.9M daily volume - Highest liquidity in bStocks
✅ Q4 Earnings catalyst on Oct 29
Risks:
⚠️ Depends on stock market, not crypto pump
⚠️ P/E Ratio near 39.5 - Overvalued zone
⚠️ Risk of short-term correction after earnings
Strategy: Not for quick trading, best for investment. Best accumulation zone $344-$346 on dip. TP: $360.50 / $375, SL: $342.00.
#FedWatch #EarningsSeason #USMidtermElections #BrazilCryptoExchangesMustApplyForLicensesByFriday
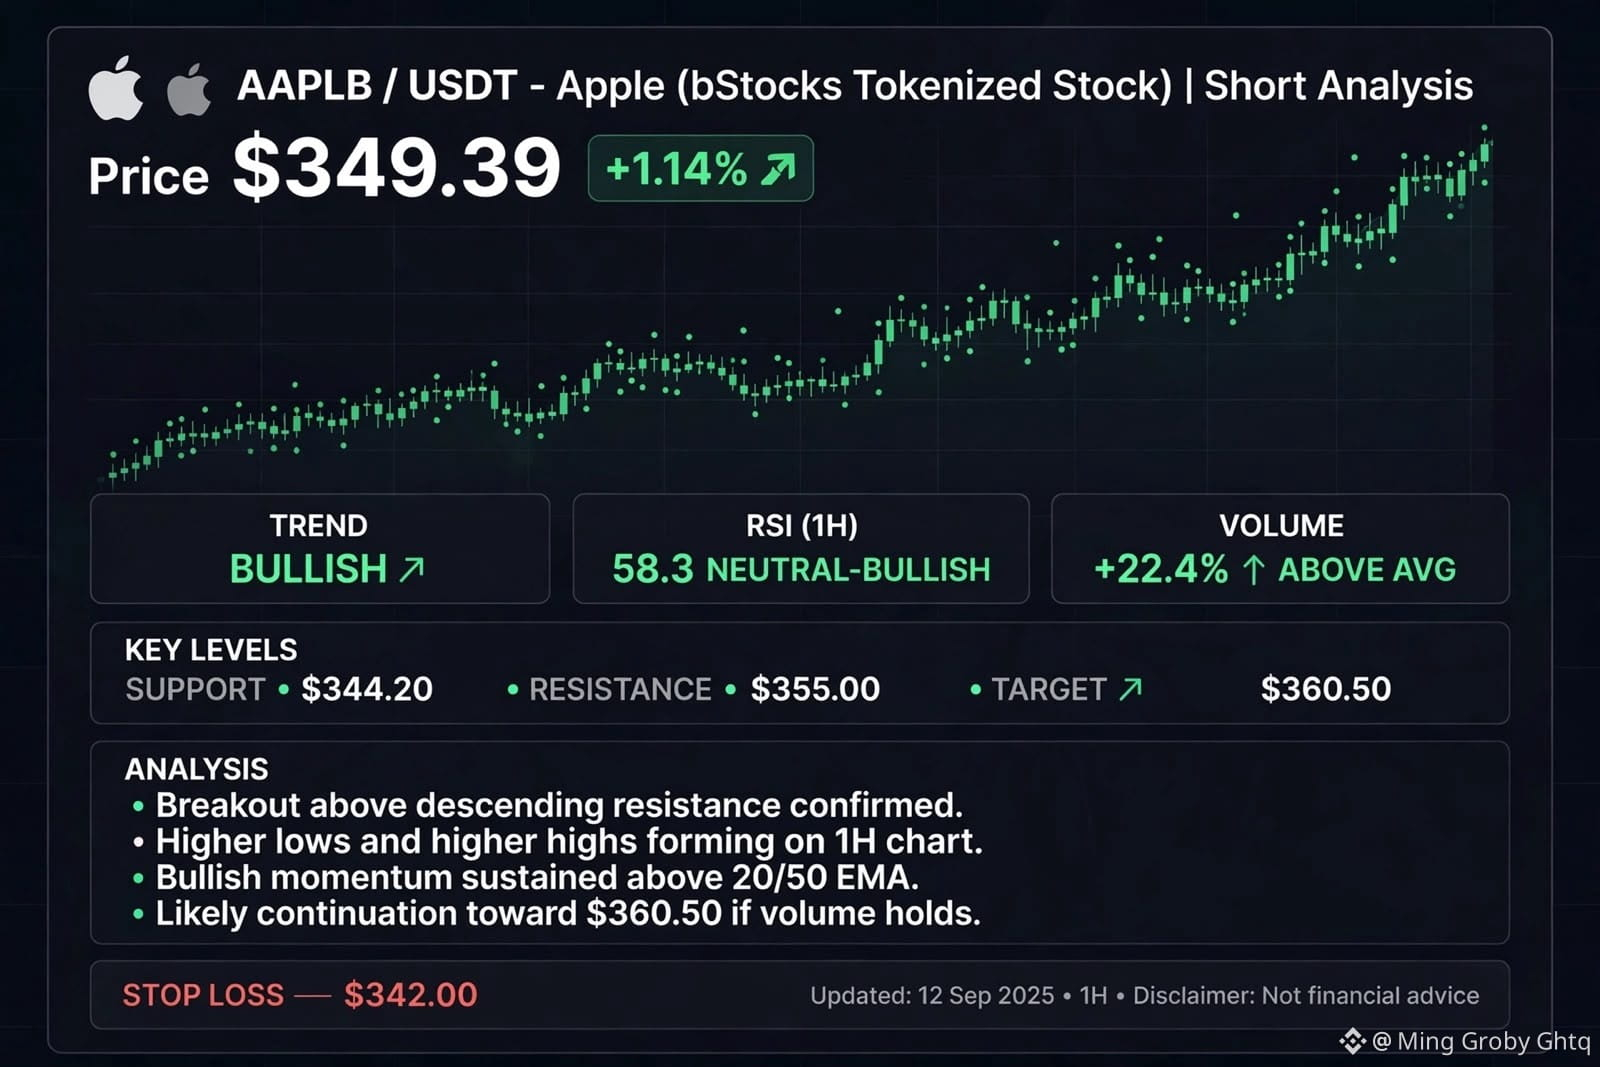
77
Anmelden und weiter Inhalte entdecken
Krypto-Nutzer weltweit auf Binance Square kennenlernen
⚡️ Bleib in Sachen Krypto stets am Puls.
💬 Die weltgrößte Kryptobörse vertraut darauf.
👍 Erhalte verlässliche Einblicke von verifizierten Creators.
E-Mail-Adresse/Telefonnummer
Trendthemen
BTCRebounds80K
32,269 Aufrufe
562 Kommentare
BITCOIN-UPDATE: ICH BIN IMMER NOCH BEARISH – UND HIER IST DER GRUND! 🚨⚠️
Wie ihr alle gesehen habt, erholte sich BTC vom Bereich um 75.700 $ und erreichte 81.000 $. Zuerst tappte der Markt Long-Trader in die Falle und anschließend Short-Trader.
Ich bin immer noch bearish. Zunächst einmal: Wie jeder weiß, haben die Demokraten heute die US-Zwischenwahlen gewonnen, und meiner Ansicht nach ist dieses Ergebnis bearish für den Markt.
Kurzfristig kann der Markt volatil bleiben und so viele Trader in die Falle locken, wie er will – das ändert jedoch nichts am allgemeinen Marktausblick.
Es stehen mehrere wichtige Ereignisse an, darunter die US-Beschäftigungszahlen außerhalb der Landwirtschaft (6. November), die US-CPI-Inflation (10. November), der US-PPI (13. November), die US-Einzelhandelsumsätze (17. November), das Protokoll der FOMC-Sitzung (18. November), die US-PCE-Inflation (25. November), die Zinserwartungen der Federal Reserve, der US-Dollar-Index (DXY), die Renditen von US-Staatsanleihen, die Entwicklung des Nasdaq, die Zu- und Abflüsse bei Bitcoin-ETFs sowie die anhaltenden geopolitischen Entwicklungen zwischen (Iran) und Israel. All dies könnte erhebliche Auswirkungen auf Bitcoin und den gesamten Kryptomarkt haben.
Lasst euch aber nicht zu sehr von Bitcoins jüngster Kursbewegung mitreißen. Technisch gesehen gab es noch keine größere bullishe Bewegung. Gestern wurde BTC zwischen 80.000 $ und 82.000 $ gehandelt, und auch heute bewegt sich der Kurs noch ungefähr in derselben Spanne.
Wenn ihr bullish werden wollt, ist das ganz allein eure Entscheidung.
In meinem vorherigen Beitrag habe ich klar erklärt, dass BTC im Bereich von 75.000 $ / 76.000 $ technische Unterstützung hatte. Der Kurs prallte von dieser Unterstützung ab und bewegte sich wieder in Richtung 80.000 $. Das war aber nichts, was ich zuvor unerwähnt gelassen hätte. Tatsächlich habe ich in meinen Beiträgen wiederholt darauf hingewiesen, dass BTC in Richtung 80.000 $, 81.000 $ oder sogar 82.000 $ steigen könnte.
Trotzdem bin ich weiterhin bearish.
Und ich habe nicht nur einen Grund für meinen bearishen Ausblick. Es gibt mehrere Gründe, die ich bereits in meinen vorherigen Beiträgen erläutert habe.
Vorerst werde ich weiter darauf warten, dass BTC unter 74.000 $ fällt – meiner Meinung nach könnte das sehr bald passieren. Meiner Ansicht nach ist eine solche Korrektur für den Markt auch notwendig.
Wenn jemand Hilfe oder Orientierung rund um Kryptowährungen sucht, kann er sich einfach bei mir melden.
#BTCRebounds80K
Strategic Adviser
·10 Likes
·4.8k Aufrufe
Binance98PercentReplenished
27,668 Aufrufe
486 Kommentare
USMidterms-WhatAreMarketsExpecting?
304,506 Aufrufe
1,979 Kommentare