

8crpto guy
20 Beiträge

8crpto guy
Melden
Nutzer blockieren
10 Following
3 Follower
1 Like gegeben
Beiträge
PINNED
·
--
SPCX
Gesamtübersicht der Investition
bärisch
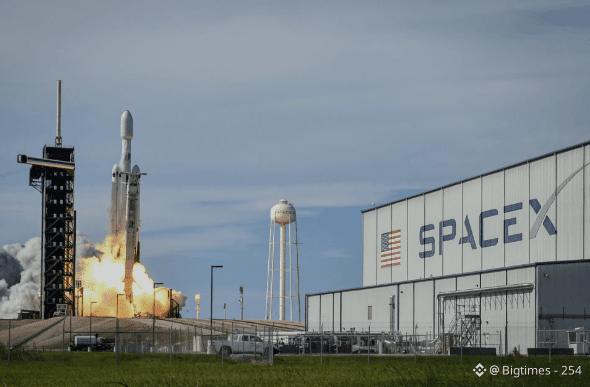
SPCX erzielt einen Überzeugungswert von 61/100 und eine HOLD-Einstufung. Das spiegelt ein erstklassiges zugrunde liegendes Geschäftsmodell (Starlink +50% Wachstum, 83% globale Launch-Quote) wider, das jedoch stark durch eine 45x EV/Umsatz-Multiplikatorbewertung, einen GAAP-Nettoverlust von 4,94 Mrd. $ sowie einen technisch „kaputten“ Chart gebremst wird, der seit seinem Peak vom 16. Juni um 45% eingebrochen ist. Die Aktie hat ihren IPO-Preis von 135 $ bereits überschritten – trotz eines Starship Scrubs und Verkäufen vor den Earnings. Die beiden wichtigsten kurzfristigen Katalysatoren sind der Bericht zum Q2 am 6. August sowie das Auslaufen des December-Lockups. Institutionelle Käufer wie ARK steigen zwar auf aktuellen Kursniveaus ein, aber das Chancen/Risiko-Profil ist ausgewogen statt überzeugend, bis Bewertung und Unsicherheit bezüglich der Ausführung klarer werden.
Thesen-Zusammenfassung:
SPCX ist ein Business über Generationen hinweg (Starlink-Monopol, Launch-Dominanz, KI-Optionen), das in einer überbewerteten Post-IPO-Struktur feststeckt; die Aktie braucht einen Earnings-Katalysator und einen Starship-Beweis für den ursprünglichen Business Case, um neu bewertet zu werden.
Was Würde Diese These Entkräften:
Bull Case widerlegt, wenn das Starship-Programm anhaltende Misserfolge erleidet, sich KI-Verluste über 8 Mrd. $ jährlich hinaus ausweiten oder Musk Kapital in Richtung Tesla/andere Vorhaben umleitet; Bear Case widerlegt durch einen starken Beat der Q2-Ergebnisse und einen erfolgreichen Flight 13.
SPCX
Gesamtübersicht der Investition
bärisch
SPCX erzielt einen Überzeugungswert von 61/100 und eine HOLD-Einstufung. Das spiegelt ein erstklassiges zugrunde liegendes Geschäftsmodell (Starlink +50% Wachstum, 83% globale Launch-Quote) wider, das jedoch stark durch eine 45x EV/Umsatz-Multiplikatorbewertung, einen GAAP-Nettoverlust von 4,94 Mrd. $ sowie einen technisch „kaputten“ Chart gebremst wird, der seit seinem Peak vom 16. Juni um 45% eingebrochen ist. Die Aktie hat ihren IPO-Preis von 135 $ bereits überschritten – trotz eines Starship Scrubs und Verkäufen vor den Earnings. Die beiden wichtigsten kurzfristigen Katalysatoren sind der Bericht zum Q2 am 6. August sowie das Auslaufen des December-Lockups. Institutionelle Käufer wie ARK steigen zwar auf aktuellen Kursniveaus ein, aber das Chancen/Risiko-Profil ist ausgewogen statt überzeugend, bis Bewertung und Unsicherheit bezüglich der Ausführung klarer werden.
Thesen-Zusammenfassung:
SPCX ist ein Business über Generationen hinweg (Starlink-Monopol, Launch-Dominanz, KI-Optionen), das in einer überbewerteten Post-IPO-Struktur feststeckt; die Aktie braucht einen Earnings-Katalysator und einen Starship-Beweis für den ursprünglichen Business Case, um neu bewertet zu werden.
Was Würde Diese These Entkräften:
Bull Case widerlegt, wenn das Starship-Programm anhaltende Misserfolge erleidet, sich KI-Verluste über 8 Mrd. $ jährlich hinaus ausweiten oder Musk Kapital in Richtung Tesla/andere Vorhaben umleitet; Bear Case widerlegt durch einen starken Beat der Q2-Ergebnisse und einen erfolgreichen Flight 13.
Gesamtübersicht der Investition
bärisch
SPCX erzielt einen Überzeugungswert von 61/100 und eine HOLD-Einstufung. Das spiegelt ein erstklassiges zugrunde liegendes Geschäftsmodell (Starlink +50% Wachstum, 83% globale Launch-Quote) wider, das jedoch stark durch eine 45x EV/Umsatz-Multiplikatorbewertung, einen GAAP-Nettoverlust von 4,94 Mrd. $ sowie einen technisch „kaputten“ Chart gebremst wird, der seit seinem Peak vom 16. Juni um 45% eingebrochen ist. Die Aktie hat ihren IPO-Preis von 135 $ bereits überschritten – trotz eines Starship Scrubs und Verkäufen vor den Earnings. Die beiden wichtigsten kurzfristigen Katalysatoren sind der Bericht zum Q2 am 6. August sowie das Auslaufen des December-Lockups. Institutionelle Käufer wie ARK steigen zwar auf aktuellen Kursniveaus ein, aber das Chancen/Risiko-Profil ist ausgewogen statt überzeugend, bis Bewertung und Unsicherheit bezüglich der Ausführung klarer werden.
Thesen-Zusammenfassung:
SPCX ist ein Business über Generationen hinweg (Starlink-Monopol, Launch-Dominanz, KI-Optionen), das in einer überbewerteten Post-IPO-Struktur feststeckt; die Aktie braucht einen Earnings-Katalysator und einen Starship-Beweis für den ursprünglichen Business Case, um neu bewertet zu werden.
Was Würde Diese These Entkräften:
Bull Case widerlegt, wenn das Starship-Programm anhaltende Misserfolge erleidet, sich KI-Verluste über 8 Mrd. $ jährlich hinaus ausweiten oder Musk Kapital in Richtung Tesla/andere Vorhaben umleitet; Bear Case widerlegt durch einen starken Beat der Q2-Ergebnisse und einen erfolgreichen Flight 13.
1
195
·
--
📈 $SPCX — Marktzusammenfassung
Preis: 140,00 $ (−0,91%)
Überzeugungswert: 61/100 · KAUF
Bias: BULLISCH
Modelliertes Kursziel: 232 $ (12 Monate, Konsens); Morgan Stanley Basisszenario 300 $ (12–24 Monate)
SPCX erreicht einen Überzeugungswert von 61/100 und eine KAUF-Einstufung, was auf eine außergewöhnliche fundamentale Dynamik (92% Umsatzwachstum, 191% EBITDA-Wachstum, Cursor geschlossen) zurückzuführen ist – ausgeglichen durch ein Hochrisiko-Profil aufgrund extremer Bewertung, serieller Lockup-Overhang
Zuletzt:
• Aug 2026: Morgan Stanley bestätigt Overweight, Kursziel 300 $; führt ein 600 $ bullisches Bewertungs-Szenario ein.
• Aug 2026: Cursor-Übernahme schließt am 14. Aug; Grok-4.6-Modell veröffentlicht; Meilensteine im KI-Segment beschleunigen sich.
$SPCX
📈 $SPCX — Marktzusammenfassung
Preis: 140,00 $ (−0,91%)
Überzeugungswert: 61/100 · KAUF
Bias: BULLISCH
Modelliertes Kursziel: 232 $ (12 Monate, Konsens); Morgan Stanley Basisszenario 300 $ (12–24 Monate)
SPCX erreicht einen Überzeugungswert von 61/100 und eine KAUF-Einstufung, was auf eine außergewöhnliche fundamentale Dynamik (92% Umsatzwachstum, 191% EBITDA-Wachstum, Cursor geschlossen) zurückzuführen ist – ausgeglichen durch ein Hochrisiko-Profil aufgrund extremer Bewertung, serieller Lockup-Overhang
Zuletzt:
• Aug 2026: Morgan Stanley bestätigt Overweight, Kursziel 300 $; führt ein 600 $ bullisches Bewertungs-Szenario ein.
• Aug 2026: Cursor-Übernahme schließt am 14. Aug; Grok-4.6-Modell veröffentlicht; Meilensteine im KI-Segment beschleunigen sich.
$SPCX
Preis: 140,00 $ (−0,91%)
Überzeugungswert: 61/100 · KAUF
Bias: BULLISCH
Modelliertes Kursziel: 232 $ (12 Monate, Konsens); Morgan Stanley Basisszenario 300 $ (12–24 Monate)
SPCX erreicht einen Überzeugungswert von 61/100 und eine KAUF-Einstufung, was auf eine außergewöhnliche fundamentale Dynamik (92% Umsatzwachstum, 191% EBITDA-Wachstum, Cursor geschlossen) zurückzuführen ist – ausgeglichen durch ein Hochrisiko-Profil aufgrund extremer Bewertung, serieller Lockup-Overhang
Zuletzt:
• Aug 2026: Morgan Stanley bestätigt Overweight, Kursziel 300 $; führt ein 600 $ bullisches Bewertungs-Szenario ein.
• Aug 2026: Cursor-Übernahme schließt am 14. Aug; Grok-4.6-Modell veröffentlicht; Meilensteine im KI-Segment beschleunigen sich.
$SPCX
88
·
--
SpaceX schließt die Übernahme von Cursor für 60 Mrd. US-Dollar in Form reiner Aktien ab; Cursor beginnt mit dem Training von Grok-Modellen auf dem Supercomputer Colossus $SPCX
SpaceX schließt die Übernahme von Cursor für 60 Mrd. US-Dollar in Form reiner Aktien ab; Cursor beginnt mit dem Training von Grok-Modellen auf dem Supercomputer Colossus $SPCX

84
·
--
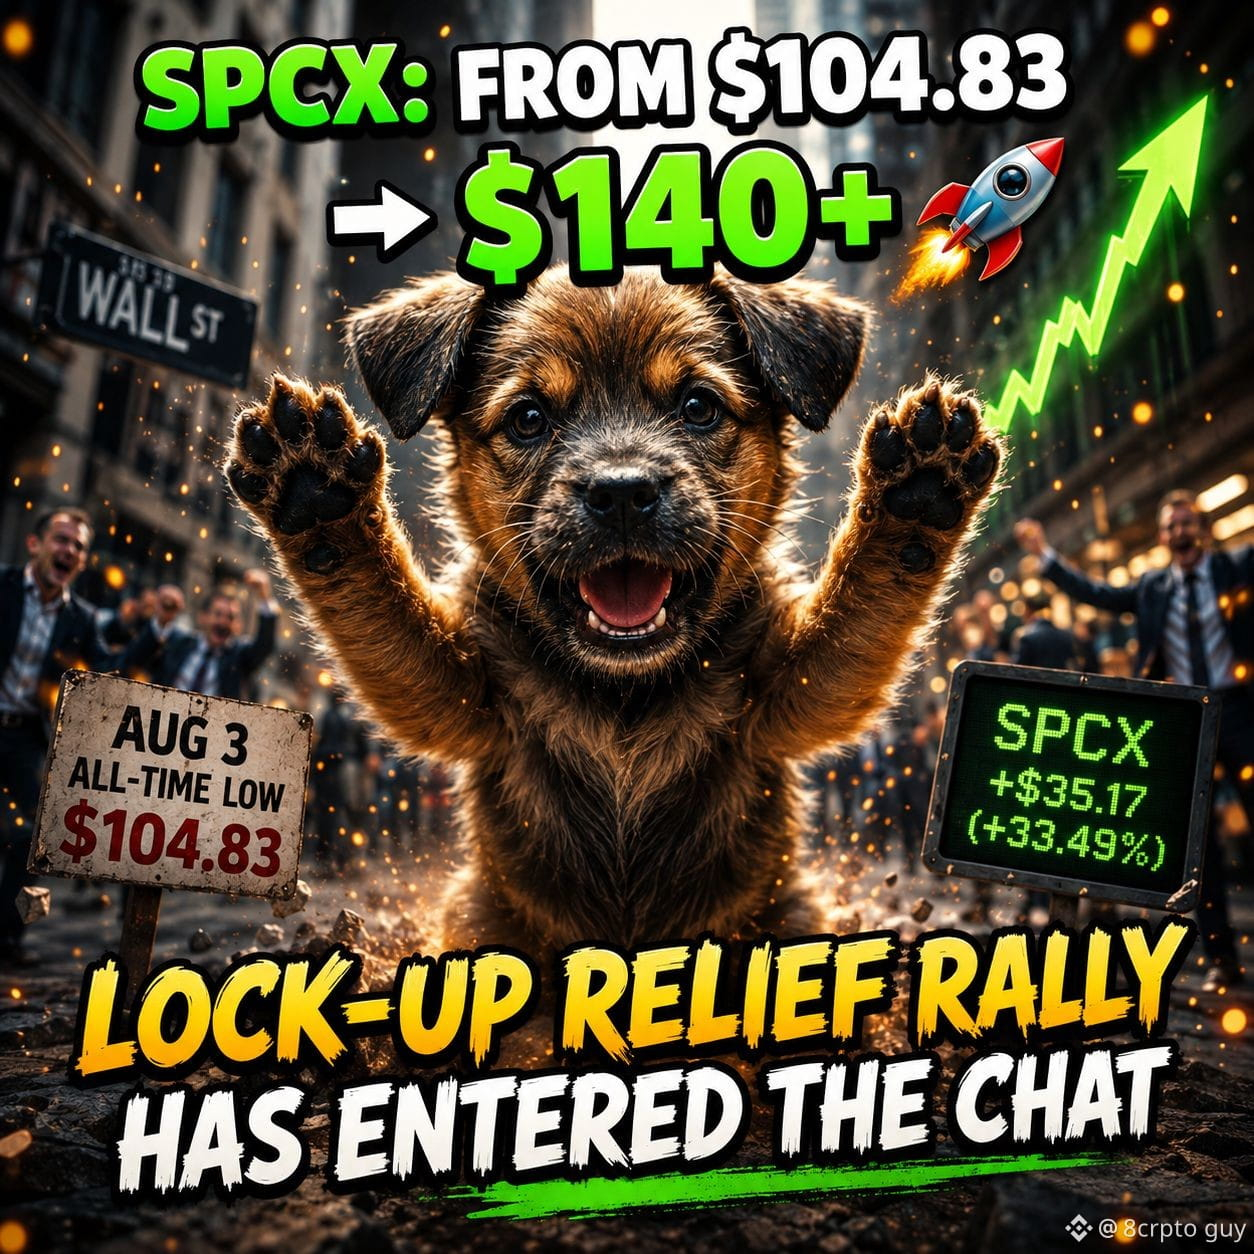
SPCX erholt sich um 30 %+ vom Allzeittief vom 3. August bei 104,83 US-Dollar; erholte sich nach der Lockup-Freigabe um 140 US-Dollar im anschließenden Kursaufschwung
$SPCX
SPCX erholt sich um 30 %+ vom Allzeittief vom 3. August bei 104,83 US-Dollar; erholte sich nach der Lockup-Freigabe um 140 US-Dollar im anschließenden Kursaufschwung
$SPCX
$SPCX
160
·
--
$BTC
➖ $BTC — Marktzusammenfassung
Preis: 64.967 $ (+1,26%)
Überzeugungswert: 54/100 · HALTEN
Bias: NEUTRAL
Modellierter Zielwert: 76.000 $ (Basisszenario über 12 Monate); 120.000 $ (bullisches Szenario bei Verabschiedung des CLARITY Act + Wiederaufnahme der ETF-Zuflüsse) (12 Monate)
BTC erzielt einen Überzeugungswert von 54/100 und eine HALTEN-Bewertung. Der Vermögenswert ist strukturell solide — feste Angebotsmenge, wachsendes institutionelles Infrastruktur-Setup und verbesserte regulatorische Klarheit in den USA — befindet sich derzeit jedoch in einer technisch rangegebundenen Konsolidierung
Zuletzt:
• Jul 2026: GENIUS Act Regelsetzungsfrist verstreicht; Fed-Stillschweigen birgt das Risiko, dass die Stablecoin-Compliance erst bis Januar 2027 vorankommt.
• Aug 2026: BTC konsolidiert zwischen 62.500 und 65.500 $; die fälligen institutionellen Q2-13F-Anmeldungen vom 15. August werden ETF-Bestände offenlegen.
$BTC
➖ $BTC — Marktzusammenfassung
Preis: 64.967 $ (+1,26%)
Überzeugungswert: 54/100 · HALTEN
Bias: NEUTRAL
Modellierter Zielwert: 76.000 $ (Basisszenario über 12 Monate); 120.000 $ (bullisches Szenario bei Verabschiedung des CLARITY Act + Wiederaufnahme der ETF-Zuflüsse) (12 Monate)
BTC erzielt einen Überzeugungswert von 54/100 und eine HALTEN-Bewertung. Der Vermögenswert ist strukturell solide — feste Angebotsmenge, wachsendes institutionelles Infrastruktur-Setup und verbesserte regulatorische Klarheit in den USA — befindet sich derzeit jedoch in einer technisch rangegebundenen Konsolidierung
Zuletzt:
• Jul 2026: GENIUS Act Regelsetzungsfrist verstreicht; Fed-Stillschweigen birgt das Risiko, dass die Stablecoin-Compliance erst bis Januar 2027 vorankommt.
• Aug 2026: BTC konsolidiert zwischen 62.500 und 65.500 $; die fälligen institutionellen Q2-13F-Anmeldungen vom 15. August werden ETF-Bestände offenlegen.
➖ $BTC — Marktzusammenfassung
Preis: 64.967 $ (+1,26%)
Überzeugungswert: 54/100 · HALTEN
Bias: NEUTRAL
Modellierter Zielwert: 76.000 $ (Basisszenario über 12 Monate); 120.000 $ (bullisches Szenario bei Verabschiedung des CLARITY Act + Wiederaufnahme der ETF-Zuflüsse) (12 Monate)
BTC erzielt einen Überzeugungswert von 54/100 und eine HALTEN-Bewertung. Der Vermögenswert ist strukturell solide — feste Angebotsmenge, wachsendes institutionelles Infrastruktur-Setup und verbesserte regulatorische Klarheit in den USA — befindet sich derzeit jedoch in einer technisch rangegebundenen Konsolidierung
Zuletzt:
• Jul 2026: GENIUS Act Regelsetzungsfrist verstreicht; Fed-Stillschweigen birgt das Risiko, dass die Stablecoin-Compliance erst bis Januar 2027 vorankommt.
• Aug 2026: BTC konsolidiert zwischen 62.500 und 65.500 $; die fälligen institutionellen Q2-13F-Anmeldungen vom 15. August werden ETF-Bestände offenlegen.

88
·
--
📈 $NVDA —Marktübersicht
Kurs: $211.94 (+2.93%)
Überzeugungsgrad: 81/100 · KAUF
Bias: BULLISCH
Modelliertes Kursziel: $300 (12 Monate)
NVDA erzielt einen Überzeugungsgrad von 81/100 und eine KAUF-Einstufung, gestützt durch eine Rekordbeschleunigung beim Umsatz, den Start der Vera-Rubin-Plattform ab Q3 2026 sowie ein Forward-KGV von ~21x, das 44% unter seinem 10-Jahres-Durchschnitt liegt.
Aktuell:
• Jun 2026: GTC Taipei: Vera Rubin bestätigt Einstieg in die volle Produktion; Vera-CPU-Auslieferungen an OpenAI, Oracle, Anthropic.
• Jul 2026: KeyBanc erhöht das NVDA-Kursziel von $310 auf $330; Konsens: Strong Buy bleibt bestehen.
📈 $NVDA —Marktübersicht
Kurs: $211.94 (+2.93%)
Überzeugungsgrad: 81/100 · KAUF
Bias: BULLISCH
Modelliertes Kursziel: $300 (12 Monate)
NVDA erzielt einen Überzeugungsgrad von 81/100 und eine KAUF-Einstufung, gestützt durch eine Rekordbeschleunigung beim Umsatz, den Start der Vera-Rubin-Plattform ab Q3 2026 sowie ein Forward-KGV von ~21x, das 44% unter seinem 10-Jahres-Durchschnitt liegt.
Aktuell:
• Jun 2026: GTC Taipei: Vera Rubin bestätigt Einstieg in die volle Produktion; Vera-CPU-Auslieferungen an OpenAI, Oracle, Anthropic.
• Jul 2026: KeyBanc erhöht das NVDA-Kursziel von $310 auf $330; Konsens: Strong Buy bleibt bestehen.
Kurs: $211.94 (+2.93%)
Überzeugungsgrad: 81/100 · KAUF
Bias: BULLISCH
Modelliertes Kursziel: $300 (12 Monate)
NVDA erzielt einen Überzeugungsgrad von 81/100 und eine KAUF-Einstufung, gestützt durch eine Rekordbeschleunigung beim Umsatz, den Start der Vera-Rubin-Plattform ab Q3 2026 sowie ein Forward-KGV von ~21x, das 44% unter seinem 10-Jahres-Durchschnitt liegt.
Aktuell:
• Jun 2026: GTC Taipei: Vera Rubin bestätigt Einstieg in die volle Produktion; Vera-CPU-Auslieferungen an OpenAI, Oracle, Anthropic.
• Jul 2026: KeyBanc erhöht das NVDA-Kursziel von $310 auf $330; Konsens: Strong Buy bleibt bestehen.
73
·
--
$BTC
{spot}(BTCUSDT)
Bitcoin erhält im Bigtimes-Überzeugungsrahmen eine Bewertung von 38/100 und erhält eine HOLD-Einstufung vor dem Hintergrund eines rückläufigen Makros und einer technischen Schwäche. BTC ist im Jahr 2026 bisher um ~31% gefallen, von 93.000 US-Dollar auf ein 21-Monats-Tief nahe 58.000 US-Dollar; ausgelöst durch eine restriktivere Fed und 4,5 Mrd. US-Dollar Abflüsse aus Juni-ETFs — nicht durch ein internes Krypto-Versagen. Die langfristige strukturelle These — begrenztes Angebot, verbesserte US-Regulierung und die SBR-Politik — bleibt intakt, aber für ein Upgrade der Überzeugung ist eine bestätigte Trendwende oberhalb von 65.600 US-Dollar erforderlich.
BTC befindet sich in einem bestätigten Bären-Trend nach dem ATH, der durch eine restriktivere Fed-Politik und Rekord-ETF-Abflüsse getrieben wird; langfristige Knappheit und eine zunehmende regulatorische Klarheit in den USA bieten jedoch einen fundamentalen Boden. Die Entscheidung des FOMC am 28.–29. Juli und die Veröffentlichung der SBR-Architektur sind die nächsten binären Auslöser.
Was Würde Dies Entkräften: Die Überzeugung wird bullisch, wenn: ein nachhaltiger Schlusskurs über 70.000 US-Dollar vorliegt und ETF-Zuflüsse zurückkehren; die Überzeugung kippt zu SELL, wenn: der Kurs bricht und der wöchentliche Schlusskurs unter 57.800 US-Dollar fällt oder eine bestätigte Fed-Zinserhöhung erfolgt.
$BTC
Bitcoin erhält im Bigtimes-Überzeugungsrahmen eine Bewertung von 38/100 und erhält eine HOLD-Einstufung vor dem Hintergrund eines rückläufigen Makros und einer technischen Schwäche. BTC ist im Jahr 2026 bisher um ~31% gefallen, von 93.000 US-Dollar auf ein 21-Monats-Tief nahe 58.000 US-Dollar; ausgelöst durch eine restriktivere Fed und 4,5 Mrd. US-Dollar Abflüsse aus Juni-ETFs — nicht durch ein internes Krypto-Versagen. Die langfristige strukturelle These — begrenztes Angebot, verbesserte US-Regulierung und die SBR-Politik — bleibt intakt, aber für ein Upgrade der Überzeugung ist eine bestätigte Trendwende oberhalb von 65.600 US-Dollar erforderlich.
BTC befindet sich in einem bestätigten Bären-Trend nach dem ATH, der durch eine restriktivere Fed-Politik und Rekord-ETF-Abflüsse getrieben wird; langfristige Knappheit und eine zunehmende regulatorische Klarheit in den USA bieten jedoch einen fundamentalen Boden. Die Entscheidung des FOMC am 28.–29. Juli und die Veröffentlichung der SBR-Architektur sind die nächsten binären Auslöser.
Was Würde Dies Entkräften: Die Überzeugung wird bullisch, wenn: ein nachhaltiger Schlusskurs über 70.000 US-Dollar vorliegt und ETF-Zuflüsse zurückkehren; die Überzeugung kippt zu SELL, wenn: der Kurs bricht und der wöchentliche Schlusskurs unter 57.800 US-Dollar fällt oder eine bestätigte Fed-Zinserhöhung erfolgt.
Bitcoin erhält im Bigtimes-Überzeugungsrahmen eine Bewertung von 38/100 und erhält eine HOLD-Einstufung vor dem Hintergrund eines rückläufigen Makros und einer technischen Schwäche. BTC ist im Jahr 2026 bisher um ~31% gefallen, von 93.000 US-Dollar auf ein 21-Monats-Tief nahe 58.000 US-Dollar; ausgelöst durch eine restriktivere Fed und 4,5 Mrd. US-Dollar Abflüsse aus Juni-ETFs — nicht durch ein internes Krypto-Versagen. Die langfristige strukturelle These — begrenztes Angebot, verbesserte US-Regulierung und die SBR-Politik — bleibt intakt, aber für ein Upgrade der Überzeugung ist eine bestätigte Trendwende oberhalb von 65.600 US-Dollar erforderlich.
BTC befindet sich in einem bestätigten Bären-Trend nach dem ATH, der durch eine restriktivere Fed-Politik und Rekord-ETF-Abflüsse getrieben wird; langfristige Knappheit und eine zunehmende regulatorische Klarheit in den USA bieten jedoch einen fundamentalen Boden. Die Entscheidung des FOMC am 28.–29. Juli und die Veröffentlichung der SBR-Architektur sind die nächsten binären Auslöser.
Was Würde Dies Entkräften: Die Überzeugung wird bullisch, wenn: ein nachhaltiger Schlusskurs über 70.000 US-Dollar vorliegt und ETF-Zuflüsse zurückkehren; die Überzeugung kippt zu SELL, wenn: der Kurs bricht und der wöchentliche Schlusskurs unter 57.800 US-Dollar fällt oder eine bestätigte Fed-Zinserhöhung erfolgt.

77
·
--

Artikel
BNB · BNB (Build and Build) / Binance Coin Jul 2026 · Krypto (BNB Chain / Binance$BNB
#binancecoin
Technische Analyse
Trend
Primärer Abwärtstrend seit dem Okt-2025-ATH ($1.375); der Kurs ist um ~58% auf das aktuelle Niveau gefallen; die wöchentliche Struktur bleibt in einem absteigenden Kanal.
RSI-Signal
RSI neutral (ca. 50–55); nicht überverkauft, keine klare Momentum-Divergenz; vorheriger Feb-Überverkauft-„Bounce“ (RSI 26) konnte die Hochs nicht zurückerobern.
Gleitender Durchschnitt.
Kurs unter EMA20 und EMA50; bärische Supertrend-Widerstandszone im Bereich $685–$715; BTC-Korrelation 0,85+ bedeutet, dass die BTC-Richtung der primäre Treiber ist.
Support / Widerstand
$560–$564 (kritischer Multi-Timeframe-Support); sekundär bei $530 und tiefe Liquiditätszone bei $345. / $634–$653 (Near-Term-Angebotszone); $685 Supertrend-Widerstand; $764 großer 1W-Fibonacci-Widerstand.
BNB · BNB (Build and Build) / Binance Coin Jul 2026 · Krypto (BNB Chain / Binance
$BNB
#binancecoin
Technische Analyse
Trend
Primärer Abwärtstrend seit dem Okt-2025-ATH ($1.375); der Kurs ist um ~58% auf das aktuelle Niveau gefallen; die wöchentliche Struktur bleibt in einem absteigenden Kanal.
RSI-Signal
RSI neutral (ca. 50–55); nicht überverkauft, keine klare Momentum-Divergenz; vorheriger Feb-Überverkauft-„Bounce“ (RSI 26) konnte die Hochs nicht zurückerobern.
Gleitender Durchschnitt.
Kurs unter EMA20 und EMA50; bärische Supertrend-Widerstandszone im Bereich $685–$715; BTC-Korrelation 0,85+ bedeutet, dass die BTC-Richtung der primäre Treiber ist.
Support / Widerstand
$560–$564 (kritischer Multi-Timeframe-Support); sekundär bei $530 und tiefe Liquiditätszone bei $345. / $634–$653 (Near-Term-Angebotszone); $685 Supertrend-Widerstand; $764 großer 1W-Fibonacci-Widerstand.
#binancecoin
Technische Analyse
Trend
Primärer Abwärtstrend seit dem Okt-2025-ATH ($1.375); der Kurs ist um ~58% auf das aktuelle Niveau gefallen; die wöchentliche Struktur bleibt in einem absteigenden Kanal.
RSI-Signal
RSI neutral (ca. 50–55); nicht überverkauft, keine klare Momentum-Divergenz; vorheriger Feb-Überverkauft-„Bounce“ (RSI 26) konnte die Hochs nicht zurückerobern.
Gleitender Durchschnitt.
Kurs unter EMA20 und EMA50; bärische Supertrend-Widerstandszone im Bereich $685–$715; BTC-Korrelation 0,85+ bedeutet, dass die BTC-Richtung der primäre Treiber ist.
Support / Widerstand
$560–$564 (kritischer Multi-Timeframe-Support); sekundär bei $530 und tiefe Liquiditätszone bei $345. / $634–$653 (Near-Term-Angebotszone); $685 Supertrend-Widerstand; $764 großer 1W-Fibonacci-Widerstand.
79
·
--
Artikel
XRP$XRP
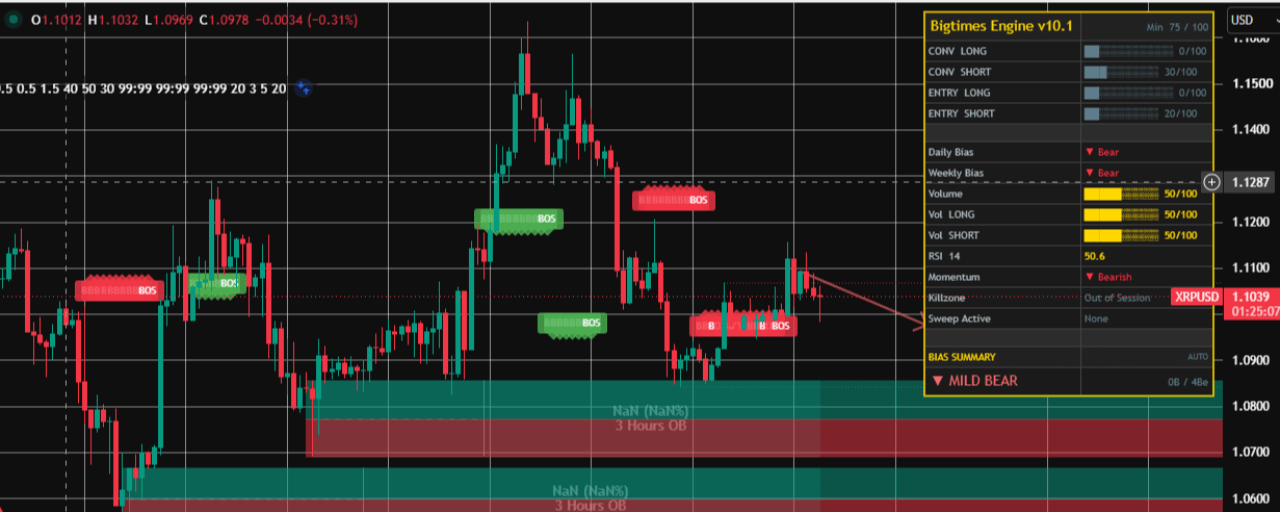
Technische Analyse
Trend
Bärisch — bestätigtes Death Cross (50-Tage-MA $1,20 unter dem 200-Tage-MA $1,50); Kurs im 1-Jahres-Kanal Down seit dem Jul-2025-Zyklus-Top.
RSI-Signal
Neutral — RSI ~54–57 über mehrere Quellen; nicht überverkauft (>30), aber auch kein Momentum; wöchentlicher RSI zuvor bei 34,7 als Hinweis auf strukturelle Schwäche.
Gleitender Durchschnitt
Bärisch — Kurs unter beiden gleitenden Durchschnitten: 50-Tage ($1,20) und 200-Tage ($1,50); EMA20 ($1,11) fungiert als unmittelbarer Support/Widerstand.
Support / Widerstand
$1,07–$1,00 (0,618 Fib / psychologisch; Bruchrisiken sinken auf $0,85–$0,90) / $1,15–$1,19 (EMA50 / Pivot); $1,30 als nächster wichtiger Punkt; $1,46–$1,60 als Zwischenziel im mittelfristigen Bereich
XRP
$XRP
Technische Analyse
Trend
Bärisch — bestätigtes Death Cross (50-Tage-MA $1,20 unter dem 200-Tage-MA $1,50); Kurs im 1-Jahres-Kanal Down seit dem Jul-2025-Zyklus-Top.
RSI-Signal
Neutral — RSI ~54–57 über mehrere Quellen; nicht überverkauft (>30), aber auch kein Momentum; wöchentlicher RSI zuvor bei 34,7 als Hinweis auf strukturelle Schwäche.
Gleitender Durchschnitt
Bärisch — Kurs unter beiden gleitenden Durchschnitten: 50-Tage ($1,20) und 200-Tage ($1,50); EMA20 ($1,11) fungiert als unmittelbarer Support/Widerstand.
Support / Widerstand
$1,07–$1,00 (0,618 Fib / psychologisch; Bruchrisiken sinken auf $0,85–$0,90) / $1,15–$1,19 (EMA50 / Pivot); $1,30 als nächster wichtiger Punkt; $1,46–$1,60 als Zwischenziel im mittelfristigen Bereich
Technische Analyse
Trend
Bärisch — bestätigtes Death Cross (50-Tage-MA $1,20 unter dem 200-Tage-MA $1,50); Kurs im 1-Jahres-Kanal Down seit dem Jul-2025-Zyklus-Top.
RSI-Signal
Neutral — RSI ~54–57 über mehrere Quellen; nicht überverkauft (>30), aber auch kein Momentum; wöchentlicher RSI zuvor bei 34,7 als Hinweis auf strukturelle Schwäche.
Gleitender Durchschnitt
Bärisch — Kurs unter beiden gleitenden Durchschnitten: 50-Tage ($1,20) und 200-Tage ($1,50); EMA20 ($1,11) fungiert als unmittelbarer Support/Widerstand.
Support / Widerstand
$1,07–$1,00 (0,618 Fib / psychologisch; Bruchrisiken sinken auf $0,85–$0,90) / $1,15–$1,19 (EMA50 / Pivot); $1,30 als nächster wichtiger Punkt; $1,46–$1,60 als Zwischenziel im mittelfristigen Bereich
141
·
--
Artikel
TESLA$TSLA
Technische Analyse
Trend
Primärer Abwärtstrend von $498,83 52-Wochen-Hoch; die Aktie ist um ~37% vom Peak gefallen und handelt nach dem Q2-Earnings-Dump nahe an 11-Monats-Tiefs.
RSI-Signal
Tief überverkaufte Bedingungen nach dem Earnings-Selloff; RSI voraussichtlich kurzfristig unter 30, historisch ein Mean-Reversion-Signal für TSLA.
Gleitender Durchschnitt
Die Aktie handelt deutlich unter dem 50-Tage-MA ($402,92) und dem 200-Tage-MA ($403,16); beide MAs in bärischer Konvergenz — starke Widerstände oberhalb.
Unterstützung / Widerstand
$297,82 (52-Wochen-Tief / strukturelle Unterstützung) / $375–$403 (50-Tage-/200-Tage-MA-Cluster)
TESLA
$TSLA
Technische Analyse
Trend
Primärer Abwärtstrend von $498,83 52-Wochen-Hoch; die Aktie ist um ~37% vom Peak gefallen und handelt nach dem Q2-Earnings-Dump nahe an 11-Monats-Tiefs.
RSI-Signal
Tief überverkaufte Bedingungen nach dem Earnings-Selloff; RSI voraussichtlich kurzfristig unter 30, historisch ein Mean-Reversion-Signal für TSLA.
Gleitender Durchschnitt
Die Aktie handelt deutlich unter dem 50-Tage-MA ($402,92) und dem 200-Tage-MA ($403,16); beide MAs in bärischer Konvergenz — starke Widerstände oberhalb.
Unterstützung / Widerstand
$297,82 (52-Wochen-Tief / strukturelle Unterstützung) / $375–$403 (50-Tage-/200-Tage-MA-Cluster)
Technische Analyse
Trend
Primärer Abwärtstrend von $498,83 52-Wochen-Hoch; die Aktie ist um ~37% vom Peak gefallen und handelt nach dem Q2-Earnings-Dump nahe an 11-Monats-Tiefs.
RSI-Signal
Tief überverkaufte Bedingungen nach dem Earnings-Selloff; RSI voraussichtlich kurzfristig unter 30, historisch ein Mean-Reversion-Signal für TSLA.
Gleitender Durchschnitt
Die Aktie handelt deutlich unter dem 50-Tage-MA ($402,92) und dem 200-Tage-MA ($403,16); beide MAs in bärischer Konvergenz — starke Widerstände oberhalb.
Unterstützung / Widerstand
$297,82 (52-Wochen-Tief / strukturelle Unterstützung) / $375–$403 (50-Tage-/200-Tage-MA-Cluster)
145
·
--
Förderung unabhängiger Finanzrecherchen
Wir sind bestrebt, hochwertige Analysen und Bildungsinhalte bereitzustellen, die sich mit Kryptowährungen, Forex und den globalen Finanzmärkten befassen. Mein Ziel ist es, objektive Markt-Einblicke, datenbasierte Forschung und zeitnahe Updates zu liefern, die der Community helfen, fundiertere Entscheidungen zu treffen.
Wenn Sie unsere Arbeit wertschätzen und die fortlaufende Erstellung unabhängiger Marktanalysen unterstützen möchten, können Sie gerne eine freiwillige Spende leisten.
USDT (TRC20) Spendenadresse: TJoujS7hF4DBkxrJc6FEzW1ZEocn3asAYH
Ihre Unterstützung trägt direkt dazu bei: • Umfassende Marktstudien und Analysen • Hochwertige Bildungsinhalte • Zugriff auf professionelle Recherche-Tools und Marktdaten • Kontinuierliche Veröffentlichung wertvoller Erkenntnisse für die Community
Jede Spende wird aufrichtig geschätzt und hilft, unabhängige Finanzrecherchen aufrechtzuerhalten.
Haftungsausschluss: Beiträge sind vollständig freiwillig und stellen keine Bezahlung für Anlageberatung, Finanzdienstleistungen oder garantierte Renditen dar. Alle veröffentlichten Inhalte dienen ausschließlich Bildungs- und Informationszwecken. Bitte führen Sie Ihre eigenen Recherchen durch, bevor Sie Anlageentscheidungen treffen.
#BinanceSquare #Crypto #Bitcoin #USDT #MarketAnalysis #Trading #Investing #Blockchain #Finance #DYOR
$BTC
Förderung unabhängiger Finanzrecherchen
Wir sind bestrebt, hochwertige Analysen und Bildungsinhalte bereitzustellen, die sich mit Kryptowährungen, Forex und den globalen Finanzmärkten befassen. Mein Ziel ist es, objektive Markt-Einblicke, datenbasierte Forschung und zeitnahe Updates zu liefern, die der Community helfen, fundiertere Entscheidungen zu treffen.
Wenn Sie unsere Arbeit wertschätzen und die fortlaufende Erstellung unabhängiger Marktanalysen unterstützen möchten, können Sie gerne eine freiwillige Spende leisten.
USDT (TRC20) Spendenadresse: TJoujS7hF4DBkxrJc6FEzW1ZEocn3asAYH
Ihre Unterstützung trägt direkt dazu bei: • Umfassende Marktstudien und Analysen • Hochwertige Bildungsinhalte • Zugriff auf professionelle Recherche-Tools und Marktdaten • Kontinuierliche Veröffentlichung wertvoller Erkenntnisse für die Community
Jede Spende wird aufrichtig geschätzt und hilft, unabhängige Finanzrecherchen aufrechtzuerhalten.
Haftungsausschluss: Beiträge sind vollständig freiwillig und stellen keine Bezahlung für Anlageberatung, Finanzdienstleistungen oder garantierte Renditen dar. Alle veröffentlichten Inhalte dienen ausschließlich Bildungs- und Informationszwecken. Bitte führen Sie Ihre eigenen Recherchen durch, bevor Sie Anlageentscheidungen treffen.
#BinanceSquare #Crypto #Bitcoin #USDT #MarketAnalysis #Trading #Investing #Blockchain #Finance #DYOR
$BTC
Wir sind bestrebt, hochwertige Analysen und Bildungsinhalte bereitzustellen, die sich mit Kryptowährungen, Forex und den globalen Finanzmärkten befassen. Mein Ziel ist es, objektive Markt-Einblicke, datenbasierte Forschung und zeitnahe Updates zu liefern, die der Community helfen, fundiertere Entscheidungen zu treffen.
Wenn Sie unsere Arbeit wertschätzen und die fortlaufende Erstellung unabhängiger Marktanalysen unterstützen möchten, können Sie gerne eine freiwillige Spende leisten.
USDT (TRC20) Spendenadresse: TJoujS7hF4DBkxrJc6FEzW1ZEocn3asAYH
Ihre Unterstützung trägt direkt dazu bei: • Umfassende Marktstudien und Analysen • Hochwertige Bildungsinhalte • Zugriff auf professionelle Recherche-Tools und Marktdaten • Kontinuierliche Veröffentlichung wertvoller Erkenntnisse für die Community
Jede Spende wird aufrichtig geschätzt und hilft, unabhängige Finanzrecherchen aufrechtzuerhalten.
Haftungsausschluss: Beiträge sind vollständig freiwillig und stellen keine Bezahlung für Anlageberatung, Finanzdienstleistungen oder garantierte Renditen dar. Alle veröffentlichten Inhalte dienen ausschließlich Bildungs- und Informationszwecken. Bitte führen Sie Ihre eigenen Recherchen durch, bevor Sie Anlageentscheidungen treffen.
#BinanceSquare #Crypto #Bitcoin #USDT #MarketAnalysis #Trading #Investing #Blockchain #Finance #DYOR
$BTC
10
·
--

Artikel
GOOGL · Alphabet Inc.$GOOGL.US
Technische Analyse
Trend
Mittelfristiger Aufwärtstrend intakt (200-Tage-DMA steigt), aber kurzfristig bärisch; Aktie um ~17% zurückgekommen nach dem Mai-ATH von $408.61.
RSI-Signal
RSI ~28-42 (je nach Quelle); nähert sich überverkauft; stochastisch überverkauft — die Rückprall-Wahrscheinlichkeit steigt.
Gleitender Durchschnitt
Kurs unter dem 5-, 20-, 50- und 200-DMA-Cluster ($346-$357); bärische MA-Konfiguration kurzfristig.
Support / Widerstand
$334–$337 (Konfluenz über mehrere Zeitebenen) / $357–$375 (EMA-Cluster + vorherige Konsolidierung)
Das Kursloch nach den Earnings schafft ein mögliches Mean-Reversion-Setup nahe dem überverkauften RSI; die Fundamentaldaten sprechen für Unterstützung bei $334; Rückeroberung von $357 wird benötigt, um den Momentum wiederherzustellen.
GOOGL · Alphabet Inc.
$GOOGL.US
Technische Analyse
Trend
Mittelfristiger Aufwärtstrend intakt (200-Tage-DMA steigt), aber kurzfristig bärisch; Aktie um ~17% zurückgekommen nach dem Mai-ATH von $408.61.
RSI-Signal
RSI ~28-42 (je nach Quelle); nähert sich überverkauft; stochastisch überverkauft — die Rückprall-Wahrscheinlichkeit steigt.
Gleitender Durchschnitt
Kurs unter dem 5-, 20-, 50- und 200-DMA-Cluster ($346-$357); bärische MA-Konfiguration kurzfristig.
Support / Widerstand
$334–$337 (Konfluenz über mehrere Zeitebenen) / $357–$375 (EMA-Cluster + vorherige Konsolidierung)
Das Kursloch nach den Earnings schafft ein mögliches Mean-Reversion-Setup nahe dem überverkauften RSI; die Fundamentaldaten sprechen für Unterstützung bei $334; Rückeroberung von $357 wird benötigt, um den Momentum wiederherzustellen.
Technische Analyse
Trend
Mittelfristiger Aufwärtstrend intakt (200-Tage-DMA steigt), aber kurzfristig bärisch; Aktie um ~17% zurückgekommen nach dem Mai-ATH von $408.61.
RSI-Signal
RSI ~28-42 (je nach Quelle); nähert sich überverkauft; stochastisch überverkauft — die Rückprall-Wahrscheinlichkeit steigt.
Gleitender Durchschnitt
Kurs unter dem 5-, 20-, 50- und 200-DMA-Cluster ($346-$357); bärische MA-Konfiguration kurzfristig.
Support / Widerstand
$334–$337 (Konfluenz über mehrere Zeitebenen) / $357–$375 (EMA-Cluster + vorherige Konsolidierung)
Das Kursloch nach den Earnings schafft ein mögliches Mean-Reversion-Setup nahe dem überverkauften RSI; die Fundamentaldaten sprechen für Unterstützung bei $334; Rückeroberung von $357 wird benötigt, um den Momentum wiederherzustellen.
1
88
·
--

Artikel
BTC KOMPLETTE ANALYSE$BTC
Trend
Primärer Trend bärisch: BTC weit unter der EMA200 (~$74.405); Death Cross im frühen 2026 gebildet und anhaltend.
RSI‑Signal
RSI bei ~52–62 (neutral); Erholung nach überverkauften Bedingungen nahe $58K; noch nicht überkauft.
Gleitender Durchschnitt.
Kurs unter der 50‑Monats‑EMA (~$65.150); kurzfristige gleitende Durchschnitte beginnen sich nach oben zu kräuseln, liegen jedoch weiterhin hinter dem langfristigen Widerstand.
Unterstützung / Widerstand
$58.000–$58.500 (mehrmonatiger technischer Boden, getestet am 1. Juli 2026) / $65.600–$66.000 (50‑Monats‑EMA); $74.400 (EMA200); $80.000 (psychologisches Niveau)
BTC ist in einer engen Spanne von $58K–$66K komprimiert; eine Bollinger‑Band‑Squeeze‑Situation signalisiert einen unmittelbar bevorstehenden Richtungs‑Ausbruch; der MACD‑Histogrammwert ist zwar positiv, aber unterhalb der Signal-Linie.
BTC KOMPLETTE ANALYSE
$BTC
Trend
Primärer Trend bärisch: BTC weit unter der EMA200 (~$74.405); Death Cross im frühen 2026 gebildet und anhaltend.
RSI‑Signal
RSI bei ~52–62 (neutral); Erholung nach überverkauften Bedingungen nahe $58K; noch nicht überkauft.
Gleitender Durchschnitt.
Kurs unter der 50‑Monats‑EMA (~$65.150); kurzfristige gleitende Durchschnitte beginnen sich nach oben zu kräuseln, liegen jedoch weiterhin hinter dem langfristigen Widerstand.
Unterstützung / Widerstand
$58.000–$58.500 (mehrmonatiger technischer Boden, getestet am 1. Juli 2026) / $65.600–$66.000 (50‑Monats‑EMA); $74.400 (EMA200); $80.000 (psychologisches Niveau)
BTC ist in einer engen Spanne von $58K–$66K komprimiert; eine Bollinger‑Band‑Squeeze‑Situation signalisiert einen unmittelbar bevorstehenden Richtungs‑Ausbruch; der MACD‑Histogrammwert ist zwar positiv, aber unterhalb der Signal-Linie.
Trend
Primärer Trend bärisch: BTC weit unter der EMA200 (~$74.405); Death Cross im frühen 2026 gebildet und anhaltend.
RSI‑Signal
RSI bei ~52–62 (neutral); Erholung nach überverkauften Bedingungen nahe $58K; noch nicht überkauft.
Gleitender Durchschnitt.
Kurs unter der 50‑Monats‑EMA (~$65.150); kurzfristige gleitende Durchschnitte beginnen sich nach oben zu kräuseln, liegen jedoch weiterhin hinter dem langfristigen Widerstand.
Unterstützung / Widerstand
$58.000–$58.500 (mehrmonatiger technischer Boden, getestet am 1. Juli 2026) / $65.600–$66.000 (50‑Monats‑EMA); $74.400 (EMA200); $80.000 (psychologisches Niveau)
BTC ist in einer engen Spanne von $58K–$66K komprimiert; eine Bollinger‑Band‑Squeeze‑Situation signalisiert einen unmittelbar bevorstehenden Richtungs‑Ausbruch; der MACD‑Histogrammwert ist zwar positiv, aber unterhalb der Signal-Linie.
88
·
--

Artikel
S&P 500$S&P 500
Bewertung: überbewertet
KGV: ~29x nachlaufend (TTM, Daten Feb 2026); vorwärts ~21–22x NTM
Kurs-Buchwert-Verhältnis (K/B): Daten nicht gefunden
EV/EBITDA: ~18–20x (über Dotcom-Vergleichen aus der Zeit vor dem Boom hinaus, laut ISABELNET)
Geschätzter Fair Value: ~7.850 (Wall-Street-Median-Konsens zum Jahresende)
KGV (CAPE) bei ~41–42,5x (zweit-höchstes in 140 Jahren); nachlaufendes KGV 45–55% über dem langfristigen Durchschnitt; das Gewinnwachstum rechtfertigt die Prämie teilweise, aber die Sicherheitsmarge ist dünn.
Finanzanalyse
Umsatzwachstum
Konsens für GJ2026 +11% — das schnellste seit 2022; Q1-Zahlen +12% und damit besser als die +10%-Schätzung.
S&P 500
$S&P 500
Bewertung: überbewertet
KGV: ~29x nachlaufend (TTM, Daten Feb 2026); vorwärts ~21–22x NTM
Kurs-Buchwert-Verhältnis (K/B): Daten nicht gefunden
EV/EBITDA: ~18–20x (über Dotcom-Vergleichen aus der Zeit vor dem Boom hinaus, laut ISABELNET)
Geschätzter Fair Value: ~7.850 (Wall-Street-Median-Konsens zum Jahresende)
KGV (CAPE) bei ~41–42,5x (zweit-höchstes in 140 Jahren); nachlaufendes KGV 45–55% über dem langfristigen Durchschnitt; das Gewinnwachstum rechtfertigt die Prämie teilweise, aber die Sicherheitsmarge ist dünn.
Finanzanalyse
Umsatzwachstum
Konsens für GJ2026 +11% — das schnellste seit 2022; Q1-Zahlen +12% und damit besser als die +10%-Schätzung.
Bewertung: überbewertet
KGV: ~29x nachlaufend (TTM, Daten Feb 2026); vorwärts ~21–22x NTM
Kurs-Buchwert-Verhältnis (K/B): Daten nicht gefunden
EV/EBITDA: ~18–20x (über Dotcom-Vergleichen aus der Zeit vor dem Boom hinaus, laut ISABELNET)
Geschätzter Fair Value: ~7.850 (Wall-Street-Median-Konsens zum Jahresende)
KGV (CAPE) bei ~41–42,5x (zweit-höchstes in 140 Jahren); nachlaufendes KGV 45–55% über dem langfristigen Durchschnitt; das Gewinnwachstum rechtfertigt die Prämie teilweise, aber die Sicherheitsmarge ist dünn.
Finanzanalyse
Umsatzwachstum
Konsens für GJ2026 +11% — das schnellste seit 2022; Q1-Zahlen +12% und damit besser als die +10%-Schätzung.
59
·
--
Gesamte Investitionszusammenfassung
bärisch:
BTC erzielt einen Conviction Score von 44/100 und eine HOLD-Einstufung. Dies spiegelt eine stark bärische kurzfristige technische und makroökonomische Lage wider, die jedoch durch strukturell langfristig bullishen Fundamentaldaten ausgeglichen wird (feste Angebotsmenge, institutionelle Adoption, regulatorische Katalysatoren). Der Vermögenswert befindet sich in einer Hochrisiko-Distribution-Phase, wobei der primäre Trend nach unten zeigt. Allerdings rechtfertigen RSI-Divergenzen sowie geplante regulatorische Katalysatoren für H2 2026 (CLARITY Act, SBR-Architektur-Release, Midterms) eine beobachtende, gestaffelte Akkumulations-Strategie statt eines unmittelbaren Ausstiegs. Risikobereite Anleger sollten konservativ positionieren und die Abwärtsrisiken im Bereich der Unterstützung von 55.500–58.000 USD definieren.
Thesen-Zusammenfassung:
BTC handelt etwa 50% unter seinem ATH im Oktober 2025. Belastet wird dies durch ETF-Abflüsse, geopolitische Risiken und einen technischen Bruch. Gleichzeitig schaffen stark überverkaufte Bedingungen, die Expansion institutioneller Infrastruktur (E*TRADE, Morgan Stanley ETF) sowie ausstehende US-Kryptogesetzgebung ein asymmetrisches Setup für den mittleren Zeithorizont.
Was Würde Diese These Widerlegen:
Ein anhaltender Schlusskurs unter 55.500 USD (Fibonacci-Unterstützung) zusammen mit beschleunigten ETF-Rücknahmen und dem Scheitern des CLARITY Act widerlegt die Erholungsthese und führt zu Kurszielen im Bereich von 39.000–45.000.
Gesamte Investitionszusammenfassung
bärisch:
BTC erzielt einen Conviction Score von 44/100 und eine HOLD-Einstufung. Dies spiegelt eine stark bärische kurzfristige technische und makroökonomische Lage wider, die jedoch durch strukturell langfristig bullishen Fundamentaldaten ausgeglichen wird (feste Angebotsmenge, institutionelle Adoption, regulatorische Katalysatoren). Der Vermögenswert befindet sich in einer Hochrisiko-Distribution-Phase, wobei der primäre Trend nach unten zeigt. Allerdings rechtfertigen RSI-Divergenzen sowie geplante regulatorische Katalysatoren für H2 2026 (CLARITY Act, SBR-Architektur-Release, Midterms) eine beobachtende, gestaffelte Akkumulations-Strategie statt eines unmittelbaren Ausstiegs. Risikobereite Anleger sollten konservativ positionieren und die Abwärtsrisiken im Bereich der Unterstützung von 55.500–58.000 USD definieren.
Thesen-Zusammenfassung:
BTC handelt etwa 50% unter seinem ATH im Oktober 2025. Belastet wird dies durch ETF-Abflüsse, geopolitische Risiken und einen technischen Bruch. Gleichzeitig schaffen stark überverkaufte Bedingungen, die Expansion institutioneller Infrastruktur (E*TRADE, Morgan Stanley ETF) sowie ausstehende US-Kryptogesetzgebung ein asymmetrisches Setup für den mittleren Zeithorizont.
Was Würde Diese These Widerlegen:
Ein anhaltender Schlusskurs unter 55.500 USD (Fibonacci-Unterstützung) zusammen mit beschleunigten ETF-Rücknahmen und dem Scheitern des CLARITY Act widerlegt die Erholungsthese und führt zu Kurszielen im Bereich von 39.000–45.000.
bärisch:
BTC erzielt einen Conviction Score von 44/100 und eine HOLD-Einstufung. Dies spiegelt eine stark bärische kurzfristige technische und makroökonomische Lage wider, die jedoch durch strukturell langfristig bullishen Fundamentaldaten ausgeglichen wird (feste Angebotsmenge, institutionelle Adoption, regulatorische Katalysatoren). Der Vermögenswert befindet sich in einer Hochrisiko-Distribution-Phase, wobei der primäre Trend nach unten zeigt. Allerdings rechtfertigen RSI-Divergenzen sowie geplante regulatorische Katalysatoren für H2 2026 (CLARITY Act, SBR-Architektur-Release, Midterms) eine beobachtende, gestaffelte Akkumulations-Strategie statt eines unmittelbaren Ausstiegs. Risikobereite Anleger sollten konservativ positionieren und die Abwärtsrisiken im Bereich der Unterstützung von 55.500–58.000 USD definieren.
Thesen-Zusammenfassung:
BTC handelt etwa 50% unter seinem ATH im Oktober 2025. Belastet wird dies durch ETF-Abflüsse, geopolitische Risiken und einen technischen Bruch. Gleichzeitig schaffen stark überverkaufte Bedingungen, die Expansion institutioneller Infrastruktur (E*TRADE, Morgan Stanley ETF) sowie ausstehende US-Kryptogesetzgebung ein asymmetrisches Setup für den mittleren Zeithorizont.
Was Würde Diese These Widerlegen:
Ein anhaltender Schlusskurs unter 55.500 USD (Fibonacci-Unterstützung) zusammen mit beschleunigten ETF-Rücknahmen und dem Scheitern des CLARITY Act widerlegt die Erholungsthese und führt zu Kurszielen im Bereich von 39.000–45.000.

63
Anmelden und weiter Inhalte entdecken
Krypto-Nutzer weltweit auf Binance Square kennenlernen
⚡️ Bleib in Sachen Krypto stets am Puls.
💬 Die weltgrößte Kryptobörse vertraut darauf.
👍 Erhalte verlässliche Einblicke von verifizierten Creators.
E-Mail-Adresse/Telefonnummer
Trendthemen
StrategyStriveAdd2305BitcoinThisWeek
16,063 Aufrufe
579 Kommentare
#strategystriveadd2305bitcointhisweek 🚨 2.305 BTC sind gerade in die Unternehmensschatzkammern gewandert
Während die meisten Trader auf die Bitcoin-Preis-Erholung fokussiert waren, haben zwei öffentliche Unternehmen im Stillen große Schritte gemacht. 👀
Strategy und Strive haben gemeinsam 2.305 BTC für 182,7 Millionen Dollar gekauft.
🔹 Strategy kaufte 950 BTC für 75,7 Millionen Dollar
🔹 Strive kaufte 1.355 BTC für rund 107,7 Millionen Dollar
Damit belaufen sich ihre gesamten Bestände auf:
📊 Strategy. 846.000 BTC
📊 Strive. 26.355 BTC
Doch die wahre Geschichte ist nicht die Menge an Bitcoin, die sie gekauft haben.
Sondern, wie sie dafür bezahlt haben.
Strategy nutzte Bargeld, das es bereits hatte.
Strive nutzte sein Aktienfinanzierungsmodell, um den Kauf zu finanzieren. Das bedeutet: Es baut seine Bitcoin-Schatzkammer auf, ohne sich nur auf den Cashflow zu verlassen.
Dieser Unterschied ist entscheidend.
Für Trader und Investoren fügt das eine zusätzliche Analyseebene hinzu: Wie viel Bitcoin hinzugefügt wird, wie es finanziert wird und was das für den langfristigen Wert pro Aktie bedeutet.
Die Kapitalkosten, die bei der BTC-Ansammlung anfallen, und der Aktienwert. Diese Faktoren beginnen, den Markt auf solche Weise zu beeinflussen.
Die Nachfrage nach Corporate-Treasury ist nicht mehr nur am Rande relevant.
Sie wird zu einem Teil des Bitcoin-Ökosystems.
💬 Was denkst du?
Werden mehr Unternehmen anfangen, Bitcoin so zu kaufen?
Wird dieser Trend wachsen?
#bitcoin #Khan62 #BTC #trading
$MSTR
$MARA $BMNR
Khan 62
·4 Likes
·2.8k Aufrufe
TrumpRejectsIranHormuzReopening
20,264 Aufrufe
523 Kommentare
CircleTetherFreezeBitgetHackerWallet
39,591 Aufrufe
633 Kommentare