
Rahul beast
4 Beiträge

Rahul beast
Melden
Nutzer blockieren
Trade eröffnen
1.6 Monate
0 Following
0 Follower
0 Like gegeben
Beiträge
Portfolio
·
--
Artikel
🥇 Gold (XAUUSD) Marktanalyse: Bullen treiben den Kurs nach oben, doch der Widerstand ist nahe!$XAU $BTC
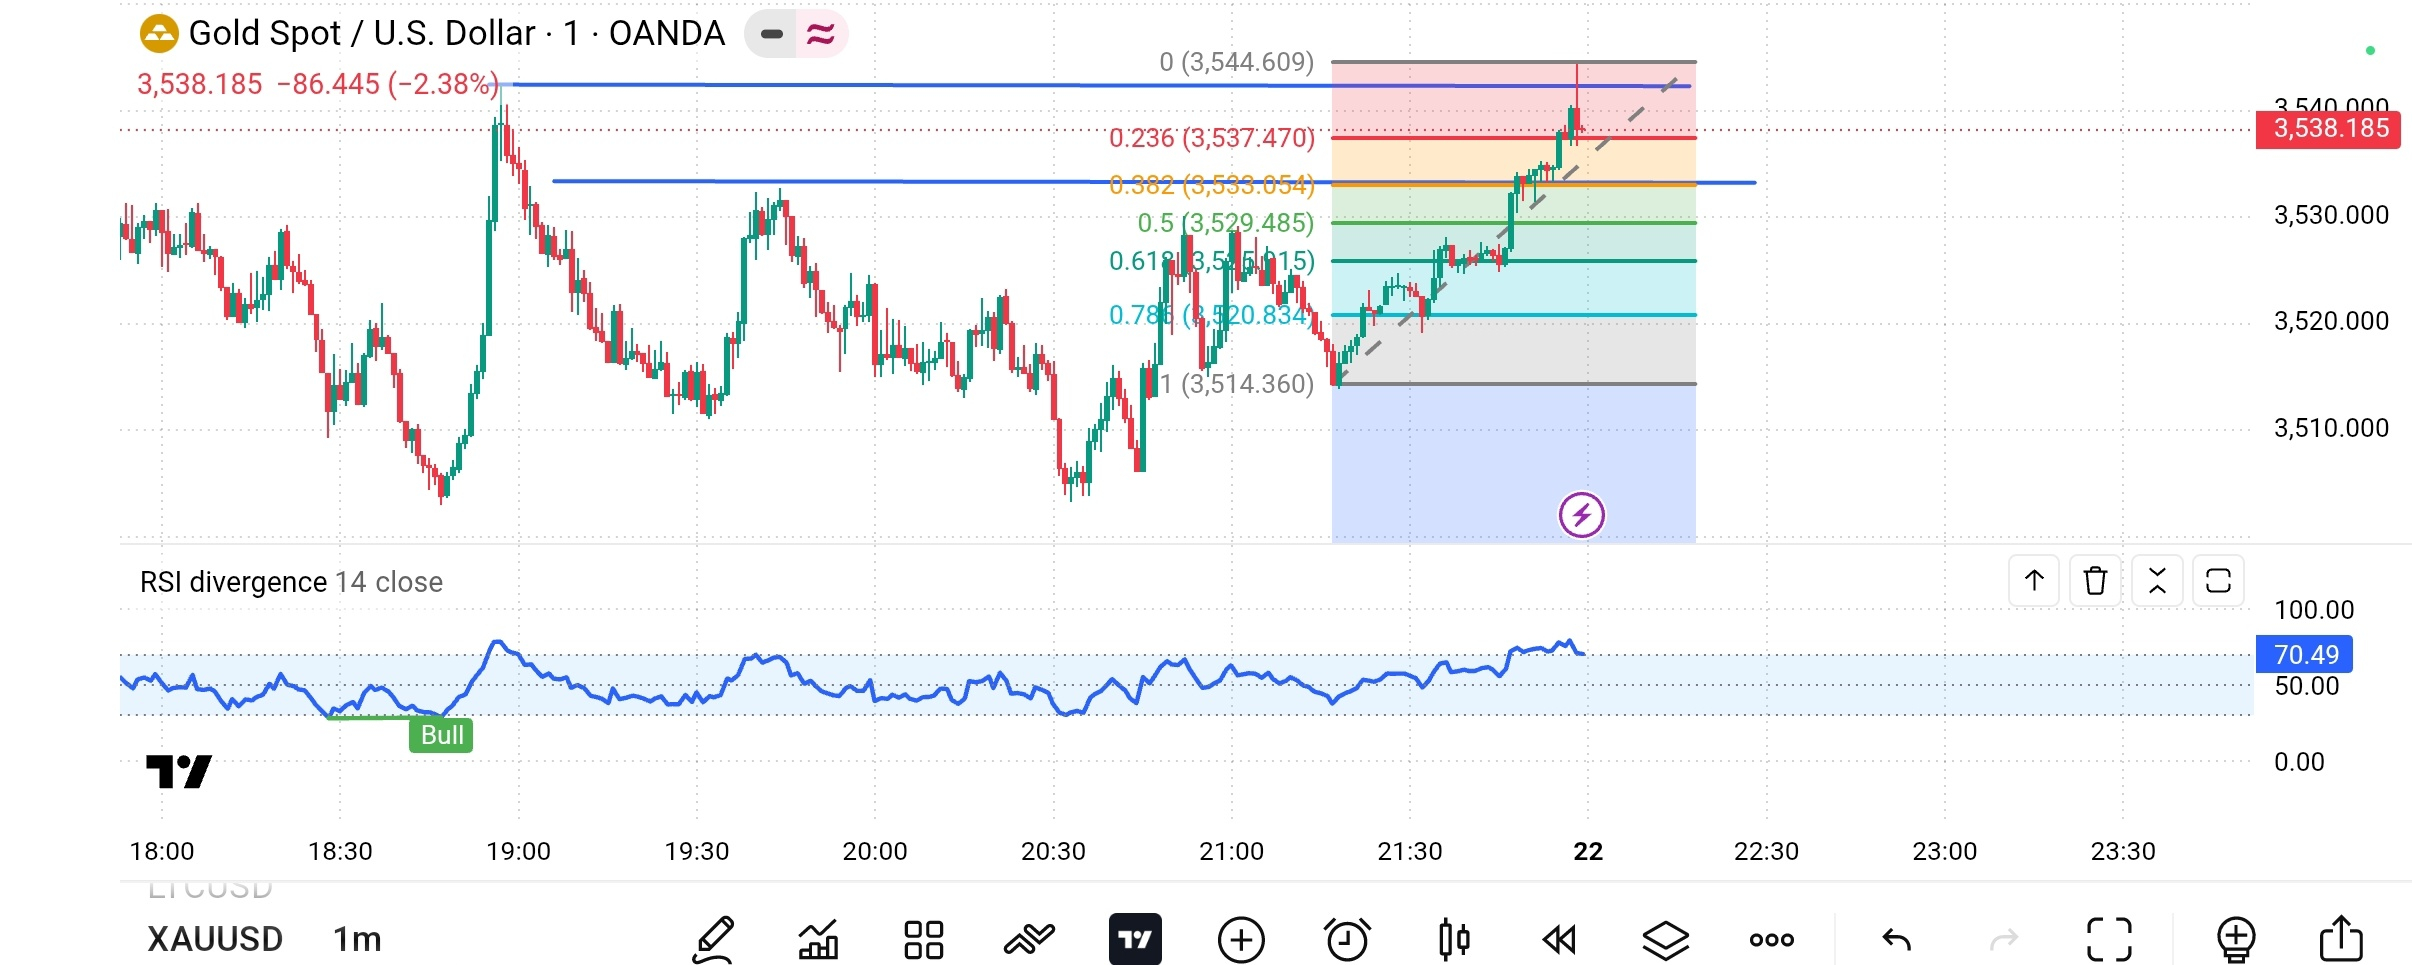
Gold zeigte im 1-Minuten-Chart eine starke bullische Dynamik, wobei Käufer den Kurs in Richtung der Widerstandszone bei 3.540 $ trieben. Die jüngste Kursentwicklung legt jedoch nahe, dass Trader vorsichtig bleiben sollten, während sich der Markt einem wichtigen technischen Niveau nähert.
📊 Technische Analyse
Der Chart zeigt eine kurzfristige Aufwärtsbewegung von etwa 3.514 $ in Richtung des Widerstandsbereichs bei 3.540–3.545 $. Fibonacci-Retracement-Niveaus bieten hilfreiche Orientierungspunkte, um mögliche Unterstützungs- und Widerstandsbereiche zu beobachten.
🥇 Gold (XAUUSD) Marktanalyse: Bullen treiben den Kurs nach oben, doch der Widerstand ist nahe!
$XAU $BTC
Gold zeigte im 1-Minuten-Chart eine starke bullische Dynamik, wobei Käufer den Kurs in Richtung der Widerstandszone bei 3.540 $ trieben. Die jüngste Kursentwicklung legt jedoch nahe, dass Trader vorsichtig bleiben sollten, während sich der Markt einem wichtigen technischen Niveau nähert.
📊 Technische Analyse
Der Chart zeigt eine kurzfristige Aufwärtsbewegung von etwa 3.514 $ in Richtung des Widerstandsbereichs bei 3.540–3.545 $. Fibonacci-Retracement-Niveaus bieten hilfreiche Orientierungspunkte, um mögliche Unterstützungs- und Widerstandsbereiche zu beobachten.
Gold zeigte im 1-Minuten-Chart eine starke bullische Dynamik, wobei Käufer den Kurs in Richtung der Widerstandszone bei 3.540 $ trieben. Die jüngste Kursentwicklung legt jedoch nahe, dass Trader vorsichtig bleiben sollten, während sich der Markt einem wichtigen technischen Niveau nähert.
📊 Technische Analyse
Der Chart zeigt eine kurzfristige Aufwärtsbewegung von etwa 3.514 $ in Richtung des Widerstandsbereichs bei 3.540–3.545 $. Fibonacci-Retracement-Niveaus bieten hilfreiche Orientierungspunkte, um mögliche Unterstützungs- und Widerstandsbereiche zu beobachten.
560
·
--
Artikel
Übersetzung ansehen
Gold (XAUUSD) Market Analysis – Key Levels and Trading Outlook📊 Gold (XAUUSD) Market Analysis – Key Levels and Trading Outlook $XAU $BTC $ETH
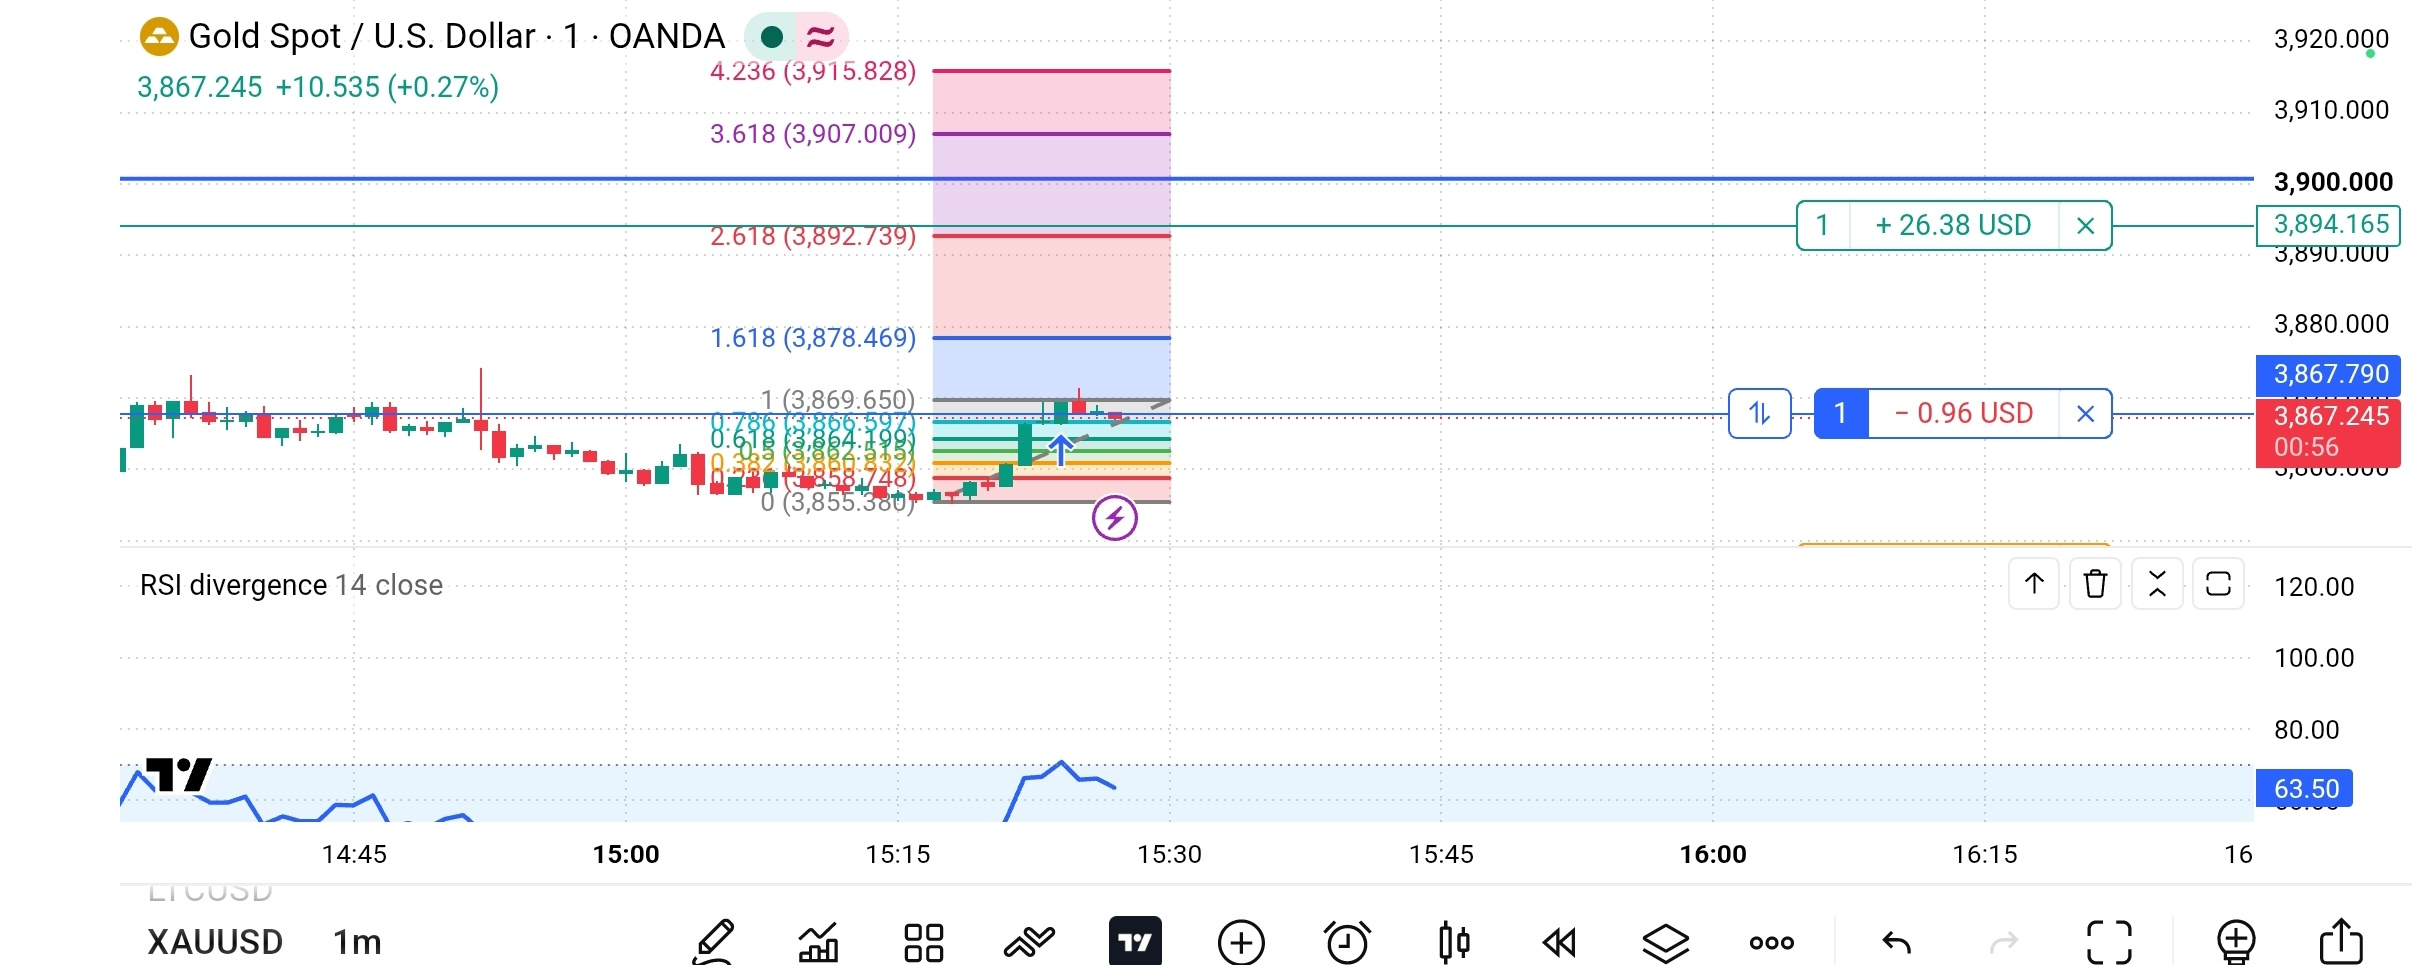
Gold is showing an interesting price movement on the 1-minute chart. After a small downward move, the price recovered and started consolidating around the 3,867 level. This makes the next move important for short-term traders.
🔍 Key Levels to Watch
🟢 Support Zone: 3,855–3,860
This area may act as short-term support if selling pressure returns.
🔴 Resistance Zone: 3,878–3,892
Gold may face selling pressure in this zone. A strong breakout could open the door for further upside.
📈 Bullish Scenario:
If gold breaks above 3,878 with strong momentum, buyers may attempt to push the price toward the 3,892 area and potentially higher levels.
📉 Bearish Scenario:
If the price fails to hold support around 3,855–3,860, sellers could regain control and push gold toward lower levels.
📊 RSI Insight:
The RSI is around 63.5 on the chart, indicating positive short-term momentum. However, momentum can change quickly, especially on a 1-minute timeframe.
💡 My Trading Perspective
The key is to wait for confirmation instead of chasing every candle. Breakouts can fail, and support levels can break. Always manage risk, use appropriate stop-loss levels, and avoid entering a trade based on a single indicator.
⚠️ Risk Disclaimer: This analysis is for educational purposes only, not financial advice. Gold prices can move rapidly, and leveraged trading carries significant risk.
What do you think? Will gold break above resistance or pull back toward support? Share your analysis in the comments! 👇
#Binance #Gold #XAUUSD #GoldAnalysis #TechnicalAnalysis #TradingStrategy #CryptoCommunity
Gold (XAUUSD) Market Analysis – Key Levels and Trading Outlook
📊 Gold (XAUUSD) Market Analysis – Key Levels and Trading Outlook $XAU $BTC $ETH
Gold is showing an interesting price movement on the 1-minute chart. After a small downward move, the price recovered and started consolidating around the 3,867 level. This makes the next move important for short-term traders.
🔍 Key Levels to Watch
🟢 Support Zone: 3,855–3,860
This area may act as short-term support if selling pressure returns.
🔴 Resistance Zone: 3,878–3,892
Gold may face selling pressure in this zone. A strong breakout could open the door for further upside.
📈 Bullish Scenario:
If gold breaks above 3,878 with strong momentum, buyers may attempt to push the price toward the 3,892 area and potentially higher levels.
📉 Bearish Scenario:
If the price fails to hold support around 3,855–3,860, sellers could regain control and push gold toward lower levels.
📊 RSI Insight:
The RSI is around 63.5 on the chart, indicating positive short-term momentum. However, momentum can change quickly, especially on a 1-minute timeframe.
💡 My Trading Perspective
The key is to wait for confirmation instead of chasing every candle. Breakouts can fail, and support levels can break. Always manage risk, use appropriate stop-loss levels, and avoid entering a trade based on a single indicator.
⚠️ Risk Disclaimer: This analysis is for educational purposes only, not financial advice. Gold prices can move rapidly, and leveraged trading carries significant risk.
What do you think? Will gold break above resistance or pull back toward support? Share your analysis in the comments! 👇
#Binance #Gold #XAUUSD #GoldAnalysis #TechnicalAnalysis #TradingStrategy #CryptoCommunity
Gold is showing an interesting price movement on the 1-minute chart. After a small downward move, the price recovered and started consolidating around the 3,867 level. This makes the next move important for short-term traders.
🔍 Key Levels to Watch
🟢 Support Zone: 3,855–3,860
This area may act as short-term support if selling pressure returns.
🔴 Resistance Zone: 3,878–3,892
Gold may face selling pressure in this zone. A strong breakout could open the door for further upside.
📈 Bullish Scenario:
If gold breaks above 3,878 with strong momentum, buyers may attempt to push the price toward the 3,892 area and potentially higher levels.
📉 Bearish Scenario:
If the price fails to hold support around 3,855–3,860, sellers could regain control and push gold toward lower levels.
📊 RSI Insight:
The RSI is around 63.5 on the chart, indicating positive short-term momentum. However, momentum can change quickly, especially on a 1-minute timeframe.
💡 My Trading Perspective
The key is to wait for confirmation instead of chasing every candle. Breakouts can fail, and support levels can break. Always manage risk, use appropriate stop-loss levels, and avoid entering a trade based on a single indicator.
⚠️ Risk Disclaimer: This analysis is for educational purposes only, not financial advice. Gold prices can move rapidly, and leveraged trading carries significant risk.
What do you think? Will gold break above resistance or pull back toward support? Share your analysis in the comments! 👇
#Binance #Gold #XAUUSD #GoldAnalysis #TechnicalAnalysis #TradingStrategy #CryptoCommunity
205
·
--
Artikel
Übersetzung ansehen
📉 Gold Market Analysis: Patience, Strategy & Risk Management📉 Gold Market Analysis: Patience, Strategy & Risk Management $XAUT
Every trader dreams of finding the perfect entry, but the real secret of trading is not predicting every move — it is managing risk and staying disciplined. ❤️
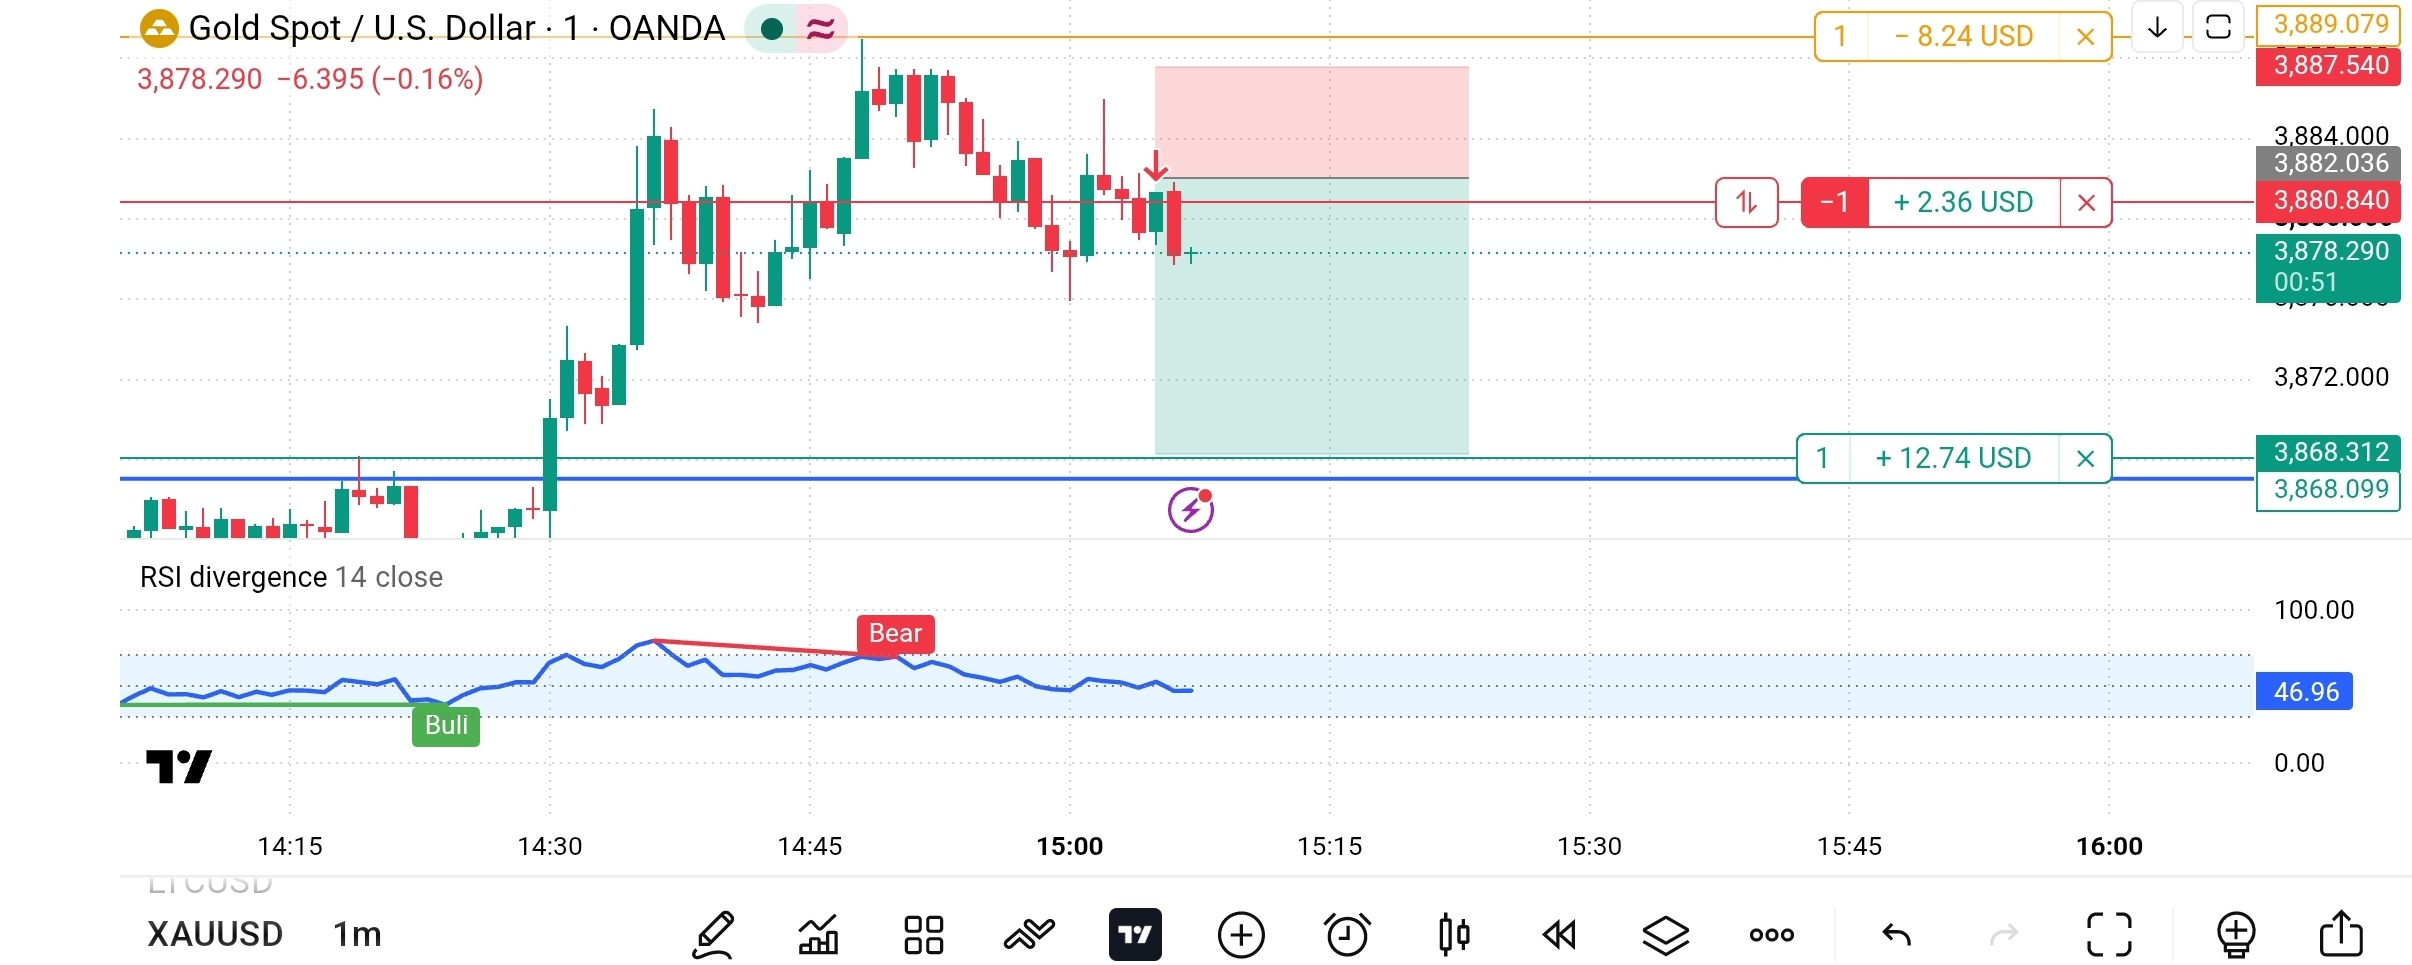
Looking at this $XAU XAUUSD 1-minute chart, Gold made a strong upward move and then started showing signs of short-term weakness. The price is pulling back from recent highs, while the RSI is around 46.96, suggesting that momentum has cooled.
📊 What Does the Chart Tell Us?
🔴 Bearish Scenario: If price continues to face resistance around the recent highs, further downside may be possible.
🟢 Support Zone: The 3868 area appears to be an important support zone on the displayed chart. A clear breakdown would need confirmation before considering further downside.
📈 RSI Insight: RSI near 47 is not an extreme reading. It suggests relatively neutral momentum rather than a strong standalone sell signal.
🎯 My Trading Approach
I would wait for price confirmation instead of entering a trade based on emotion. A clear rejection at resistance or a confirmed break below support could help define a potential setup.
Risk management always comes first:
- Set a stop-loss before entering.
- Keep position size under control.
- Avoid chasing candles.
- Remember that a setup can fail, even when the analysis looks convincing.
💭 A Personal Trading Thought
Trading is a journey of patience, not perfection. Some days bring opportunities, and some days teach us to wait. Protecting capital is also a form of progress.
Analyze carefully. Trade responsibly. Stay consistent.
What do you think about Gold's next move — a further pullback or a recovery? Share your analysis in the comments! 👇
#BinanceSquare #GoldAnalysis #XAUUSD #TradingPsychology #TechnicalAnalysis #RiskManagement
Note: This chart shows Gold Spot / U.S. Dollar (XAUUSD) on OANDA, not a Binance crypto pair. The levels are approximate observations from the screenshot, not guaranteed targets or financial advice. Always verify live prices before making a decision.
#xau
📉 Gold Market Analysis: Patience, Strategy & Risk Management
📉 Gold Market Analysis: Patience, Strategy & Risk Management $XAUT
Every trader dreams of finding the perfect entry, but the real secret of trading is not predicting every move — it is managing risk and staying disciplined. ❤️
Looking at this $XAU XAUUSD 1-minute chart, Gold made a strong upward move and then started showing signs of short-term weakness. The price is pulling back from recent highs, while the RSI is around 46.96, suggesting that momentum has cooled.
📊 What Does the Chart Tell Us?
🔴 Bearish Scenario: If price continues to face resistance around the recent highs, further downside may be possible.
🟢 Support Zone: The 3868 area appears to be an important support zone on the displayed chart. A clear breakdown would need confirmation before considering further downside.
📈 RSI Insight: RSI near 47 is not an extreme reading. It suggests relatively neutral momentum rather than a strong standalone sell signal.
🎯 My Trading Approach
I would wait for price confirmation instead of entering a trade based on emotion. A clear rejection at resistance or a confirmed break below support could help define a potential setup.
Risk management always comes first:
- Set a stop-loss before entering.
- Keep position size under control.
- Avoid chasing candles.
- Remember that a setup can fail, even when the analysis looks convincing.
💭 A Personal Trading Thought
Trading is a journey of patience, not perfection. Some days bring opportunities, and some days teach us to wait. Protecting capital is also a form of progress.
Analyze carefully. Trade responsibly. Stay consistent.
What do you think about Gold's next move — a further pullback or a recovery? Share your analysis in the comments! 👇
#BinanceSquare #GoldAnalysis #XAUUSD #TradingPsychology #TechnicalAnalysis #RiskManagement
Note: This chart shows Gold Spot / U.S. Dollar (XAUUSD) on OANDA, not a Binance crypto pair. The levels are approximate observations from the screenshot, not guaranteed targets or financial advice. Always verify live prices before making a decision.
#xau
Every trader dreams of finding the perfect entry, but the real secret of trading is not predicting every move — it is managing risk and staying disciplined. ❤️
Looking at this $XAU XAUUSD 1-minute chart, Gold made a strong upward move and then started showing signs of short-term weakness. The price is pulling back from recent highs, while the RSI is around 46.96, suggesting that momentum has cooled.
📊 What Does the Chart Tell Us?
🔴 Bearish Scenario: If price continues to face resistance around the recent highs, further downside may be possible.
🟢 Support Zone: The 3868 area appears to be an important support zone on the displayed chart. A clear breakdown would need confirmation before considering further downside.
📈 RSI Insight: RSI near 47 is not an extreme reading. It suggests relatively neutral momentum rather than a strong standalone sell signal.
🎯 My Trading Approach
I would wait for price confirmation instead of entering a trade based on emotion. A clear rejection at resistance or a confirmed break below support could help define a potential setup.
Risk management always comes first:
- Set a stop-loss before entering.
- Keep position size under control.
- Avoid chasing candles.
- Remember that a setup can fail, even when the analysis looks convincing.
💭 A Personal Trading Thought
Trading is a journey of patience, not perfection. Some days bring opportunities, and some days teach us to wait. Protecting capital is also a form of progress.
Analyze carefully. Trade responsibly. Stay consistent.
What do you think about Gold's next move — a further pullback or a recovery? Share your analysis in the comments! 👇
#BinanceSquare #GoldAnalysis #XAUUSD #TradingPsychology #TechnicalAnalysis #RiskManagement
Note: This chart shows Gold Spot / U.S. Dollar (XAUUSD) on OANDA, not a Binance crypto pair. The levels are approximate observations from the screenshot, not guaranteed targets or financial advice. Always verify live prices before making a decision.
#xau
276
·
--
Übersetzung ansehen
📈 BTC/USD Market Analysis | Buyers Are Making a Comeback! 🚀📈 BTC/USD Market Analysis | Buyers Are Making a Comeback! 🚀 $BTC
Bitcoin is showing a strong recovery after a sharp bearish move on the 1-minute chart.
🔍 What the Chart Shows:
- Current Price: Around $64,866
- Market Structure: Price dropped sharply before buyers stepped in with strong bullish candles.
- Buying Momentum: The recent upward movement suggests short-term buying pressure is increasing.
- Resistance Zone: $64,900–$64,950
- Support Zone: $64,700–$64,720
💡 My Trading Perspective:
Bitcoin is attempting to recover from the recent sell-off, but the next move will be important. If buyers maintain momentum and price breaks above the resistance zone, further upside may follow. However, rejection near resistance could lead to another pullback.
🎯 Key Levels to Watch:
✅ Resistance: $64,900–$64,950
✅ Support: $64,700–$64,720
⚠️ A confirmed breakout or breakdown is needed before considering the next move.
🧠 Remember: The 1-minute chart is highly volatile. Always manage risk, use a proper stop-loss, and avoid entering trades based on emotions.
🔥 Trade Smart. Stay Patient. Protect Your Capital.
#Bitcoin #BTCUSD #Binance #CryptoAnalysis #BitcoinTrading #TechnicalAnalysis #CryptoMarket
📈 BTC/USD Market Analysis | Buyers Are Making a Comeback! 🚀
📈 BTC/USD Market Analysis | Buyers Are Making a Comeback! 🚀 $BTC
Bitcoin is showing a strong recovery after a sharp bearish move on the 1-minute chart.
🔍 What the Chart Shows:
- Current Price: Around $64,866
- Market Structure: Price dropped sharply before buyers stepped in with strong bullish candles.
- Buying Momentum: The recent upward movement suggests short-term buying pressure is increasing.
- Resistance Zone: $64,900–$64,950
- Support Zone: $64,700–$64,720
💡 My Trading Perspective:
Bitcoin is attempting to recover from the recent sell-off, but the next move will be important. If buyers maintain momentum and price breaks above the resistance zone, further upside may follow. However, rejection near resistance could lead to another pullback.
🎯 Key Levels to Watch:
✅ Resistance: $64,900–$64,950
✅ Support: $64,700–$64,720
⚠️ A confirmed breakout or breakdown is needed before considering the next move.
🧠 Remember: The 1-minute chart is highly volatile. Always manage risk, use a proper stop-loss, and avoid entering trades based on emotions.
🔥 Trade Smart. Stay Patient. Protect Your Capital.
#Bitcoin #BTCUSD #Binance #CryptoAnalysis #BitcoinTrading #TechnicalAnalysis #CryptoMarket
Bitcoin is showing a strong recovery after a sharp bearish move on the 1-minute chart.
🔍 What the Chart Shows:
- Current Price: Around $64,866
- Market Structure: Price dropped sharply before buyers stepped in with strong bullish candles.
- Buying Momentum: The recent upward movement suggests short-term buying pressure is increasing.
- Resistance Zone: $64,900–$64,950
- Support Zone: $64,700–$64,720
💡 My Trading Perspective:
Bitcoin is attempting to recover from the recent sell-off, but the next move will be important. If buyers maintain momentum and price breaks above the resistance zone, further upside may follow. However, rejection near resistance could lead to another pullback.
🎯 Key Levels to Watch:
✅ Resistance: $64,900–$64,950
✅ Support: $64,700–$64,720
⚠️ A confirmed breakout or breakdown is needed before considering the next move.
🧠 Remember: The 1-minute chart is highly volatile. Always manage risk, use a proper stop-loss, and avoid entering trades based on emotions.
🔥 Trade Smart. Stay Patient. Protect Your Capital.
#Bitcoin #BTCUSD #Binance #CryptoAnalysis #BitcoinTrading #TechnicalAnalysis #CryptoMarket
92
Anmelden und weiter Inhalte entdecken
Krypto-Nutzer weltweit auf Binance Square kennenlernen
⚡️ Bleib in Sachen Krypto stets am Puls.
💬 Die weltgrößte Kryptobörse vertraut darauf.
👍 Erhalte verlässliche Einblicke von verifizierten Creators.
E-Mail-Adresse/Telefonnummer
Trendthemen
NvidiaLoses$2.7TrillionInMonthAndAHalf
19,130 Aufrufe
121 Kommentare
Nvidias 2,7-Billionen-Dollar-Absturz: Wenn die Erzählung wichtiger ist als die Zahlen 📉
Crypto With Faisal
·7 Likes
·5.4k Aufrufe
CanBTCReboundAfterFallingBelow60K?
762,868 Aufrufe
2,986 Kommentare
GlobalStocksFaceLongestLosingStreakSince2023
277,266 Aufrufe
1,992 Kommentare