
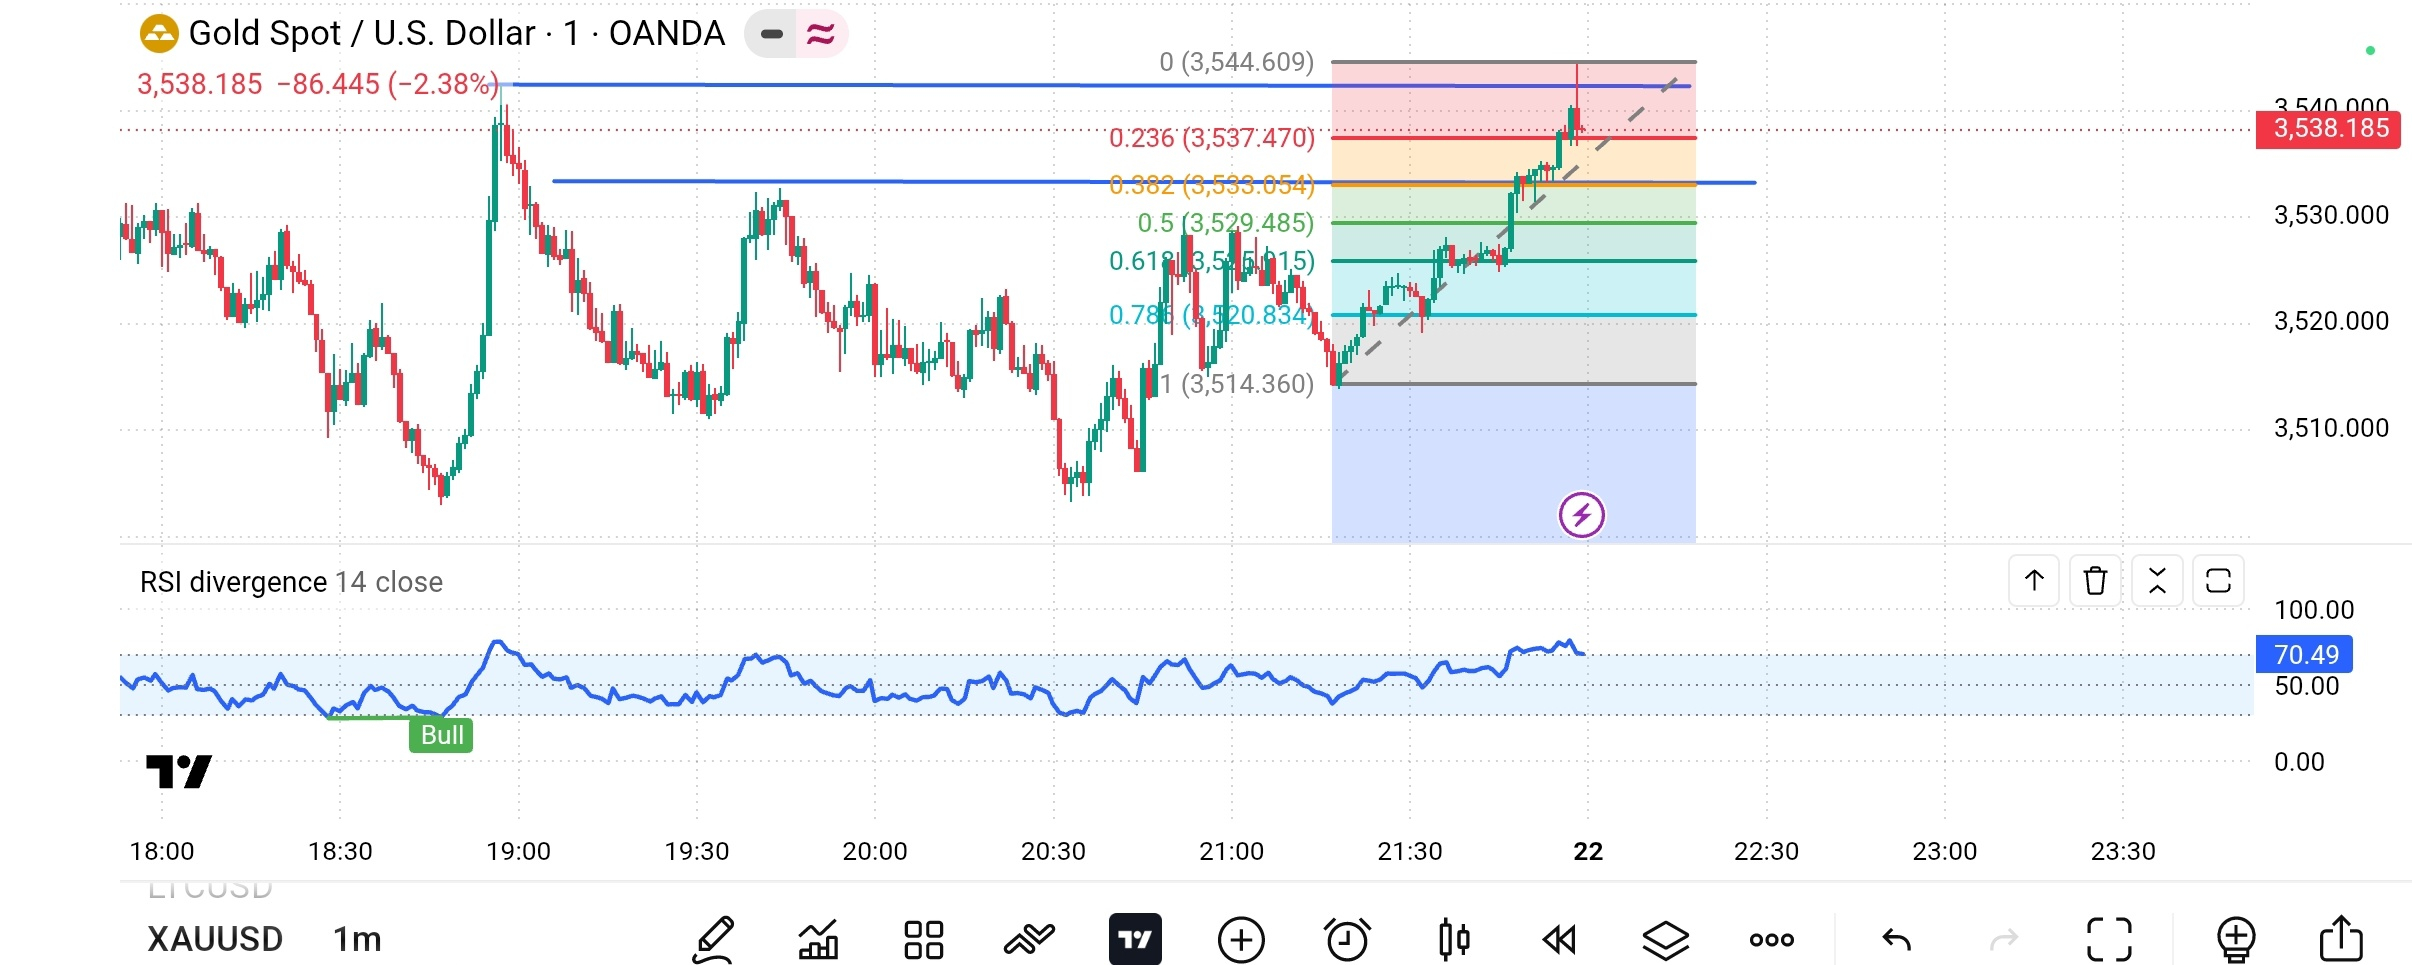


Gold has shown strong bullish momentum on the 1-minute chart, with buyers pushing the price toward the $3,540 resistance zone. However, the latest price action suggests that traders should remain cautious as the market approaches an important technical level.
📊 Technical Analysis
The chart shows a short-term upward move from around $3,514 toward the $3,540–$3,545 resistance area. Fibonacci retracement levels provide useful reference points for monitoring potential support and resistance.
🔹 Key Resistance: $3,540–$3,545
🔹 Immediate Support: $3,533
🔹 Additional Support: $3,529 and $3,525
🔹 Major Short-Term Support: $3,514
📈 RSI Indicator
The RSI is near 70, indicating strong bullish momentum but also suggesting that the market may be approaching overbought conditions. A pullback or consolidation is possible, although an elevated RSI alone does not confirm a reversal.
🚀 What Could Happen Next?
Bullish Scenario: If gold breaks above the $3,545 resistance area and holds above it, buyers may attempt to push the price higher.
Bearish Scenario: If price fails to break resistance, sellers may trigger a pullback toward $3,533 or $3,529.
Sideways Scenario: Gold may consolidate near the resistance zone before choosing its next direction.
💡 My Trading Perspective
The current chart shows bullish short-term momentum, but chasing a strong upward candle can be risky. Watching the resistance breakout, candle closes, and retests may provide a clearer picture of the next move.
⚠️ Risk Management: This analysis is based on a 1-minute chart and is intended for educational purposes only. Short-term price movements can be unpredictable. Always manage risk carefully and never rely on a single indicator.
What do you think? Will Gold break above $3,545, or will sellers push the price lower? Share your analysis in the comments!
#Gold #XAUUSD #GoldAnalysis #TechnicalAnalysis #TradingView #Binance #CryptoTrading #PriceAction