
The-Best-Dealer
238 Beiträge

The-Best-Dealer
Melden
Nutzer blockieren
Hello there welcome 👋
Trade eröffnen
Regelmäßiger Trader
3.8 Jahre
13 Following
407 Follower
373 Like gegeben
Beiträge
Portfolio
Alle
Zitierungen
Übersetzung ansehen
$NVDAB
$NVDAB


Binance Square Official
·
--
Sicherheitswarnung und Durchsetzungsupdate | 7.–13. September 2026
Wir haben die wichtigsten Verstöße hervorgehoben, die letzte Woche identifiziert wurden. Bleiben Sie aufmerksam, um Ihre Gelder und persönlichen Informationen zu schützen.
1. Teilen von Telegram-Kontaktdaten in Beiträgen und Anzeigenamen
Einige Konten verwenden diese Informationen, um Nutzer in private Chats umzuleiten. Unbestätigte Anlageangebote oder Zahlungsaufforderungen können zu Betrug und gestohlenen Geldern führen.
2. Wiederholte Spam-Beiträge mit Zahlungsaufforderungen
Diese Anfragen können genutzt werden, um Nutzer dazu zu bringen, Geld zu senden. Die Überweisung von Geldern an nicht verifizierte Empfänger kann zu finanziellen Verlusten führen.
1. Teilen von Telegram-Kontaktdaten in Beiträgen und Anzeigenamen
Einige Konten verwenden diese Informationen, um Nutzer in private Chats umzuleiten. Unbestätigte Anlageangebote oder Zahlungsaufforderungen können zu Betrug und gestohlenen Geldern führen.
2. Wiederholte Spam-Beiträge mit Zahlungsaufforderungen
Diese Anfragen können genutzt werden, um Nutzer dazu zu bringen, Geld zu senden. Die Überweisung von Geldern an nicht verifizierte Empfänger kann zu finanziellen Verlusten führen.
2
Übersetzung ansehen
$MYX
$MYX
The-Best-Dealer
·
--
MYX Finance (MYX) is trading between $0.0560 and $0.0606 USD, reflecting minor range-bound consolidation over the past 24 hours with moderate turnover relative to its market size.
Key 24-Hour Market Metrics
MetricValueCurrent Price~$0.0560 – $0.0606 USD24-Hour Range$0.0547 – $0.0595 USD24-Hour Trading Volume~$6.5M – $7.4M USDMarket Capitalization~$21.8M – $23.6M USDCirculating Supply~235M – 387M MYX (Max: 1.00B)
Technical & Market Dynamics
Price Action & Ranges: MYX is consolidating in a tight lower-bound range. Local immediate support sits at $0.0545 – $0.0550. Initial upside resistance is capped at $0.0595 – $0.0620, with stronger structural resistance overhead around $0.0750.
Volume Profile: The 24-hour volume of ~$6.5M–$7.4M represents a high volume-to-market-cap ratio (~30%), driven primarily by DEX liquidity and perpetual swap market activity.
Long-Term Context: The token remains significantly down from its historical high of $19.03 (set in September 2025), reflecting heavy supply dilution and prolonged macro correction across smaller cap DeFi derivative tokens.
Protocol Utility
MYX functions as the native governance and fee-accrual token for MYX Finance, an on-chain non-custodial perpetual derivatives DEX operating across Linea, Arbitrum, and BNB Chain. It utilizes a Matching Pool Mechanism (MPM) to allow multi-chain collateralized trading with low capital slippage.
#BTCBreaks80K $MYX
#ChainlinkPowersBottomlinePaymentPlatform
Key 24-Hour Market Metrics
MetricValueCurrent Price~$0.0560 – $0.0606 USD24-Hour Range$0.0547 – $0.0595 USD24-Hour Trading Volume~$6.5M – $7.4M USDMarket Capitalization~$21.8M – $23.6M USDCirculating Supply~235M – 387M MYX (Max: 1.00B)
Technical & Market Dynamics
Price Action & Ranges: MYX is consolidating in a tight lower-bound range. Local immediate support sits at $0.0545 – $0.0550. Initial upside resistance is capped at $0.0595 – $0.0620, with stronger structural resistance overhead around $0.0750.
Volume Profile: The 24-hour volume of ~$6.5M–$7.4M represents a high volume-to-market-cap ratio (~30%), driven primarily by DEX liquidity and perpetual swap market activity.
Long-Term Context: The token remains significantly down from its historical high of $19.03 (set in September 2025), reflecting heavy supply dilution and prolonged macro correction across smaller cap DeFi derivative tokens.
Protocol Utility
MYX functions as the native governance and fee-accrual token for MYX Finance, an on-chain non-custodial perpetual derivatives DEX operating across Linea, Arbitrum, and BNB Chain. It utilizes a Matching Pool Mechanism (MPM) to allow multi-chain collateralized trading with low capital slippage.
#BTCBreaks80K $MYX
#ChainlinkPowersBottomlinePaymentPlatform
2
Übersetzung ansehen
$HYPE
Hyperliquid (HYPE) is trading in the $79.50 – $91.20 USD range, consolidating near multi-week highs after a sustained push driven by strong perpetual DEX trading volume and institutional liquidity inflow.
Key 7-Day Market Metrics
MetricValueCurrent Price~$79.50 – $91.20 USD7-Day Price Range$75.20 – $88.50 USD24-Hour Trading Volume~$1.15B – $1.50B USDMarket Capitalization~$18.7B – $21.2B USD (Rank #9–10)Key Support Levels$75.10 / $70.00 – $72.50Key Resistance Levels$84.00 – $88.50 / $93.50
Technical Structure & Market Drivers
Trend Strength: HYPE remains structurally bullish on medium-to-long timeframes, trading comfortably above its 50-day EMA ($73.90) and 200-day EMA ($56.70), indicating sustained structural demand despite short-term consolidation.
Momentum Oscillators: The 14-day RSI sits near 38–53, reflecting a neutral-to-cooling short-term picture after testing local high resistance around $88–$89.
Protocol On-Chain Metrics: Hyperliquid's 30-day perpetual trading volume continues to average ~$200B+ with annualized protocol revenue hovering near $700M–$900M, providing a fundamental cash-flow backstop via token buybacks and yield mechanisms.
Supply & Valuation Considerations: Circulating supply remains at 222M–252M HYPE ($20B market cap) against a 1B maximum supply (~$80B FDV), making future token unlock schedules and contributor vesting key factors for long-term momentum.
1-Week Scenario Outlook
Bullish Continuation: A high-volume daily close above immediate resistance at $84.00 – $88.50 clears the path toward psychological breakout targets at $93.50 and $108.00 – $112.00.
Consolidation / Base-Building: Holding above primary support at $75.10 favors a range-bound structure between $76.00 and $86.00 while cooling off lower-timeframe overbought indicators.
Bearish Retracement: A breakdown below $75.00 risks a deeper correction toward the major support zone at $70.00 – $72.50, near the 50-day EMA.
#ChainlinkPowersBottomlinePaymentPlatform #BOJHikesRatesTo31YearHigh #HKMAPlansWholesaleCBDCByYearEnd
$HYPE
Hyperliquid (HYPE) is trading in the $79.50 – $91.20 USD range, consolidating near multi-week highs after a sustained push driven by strong perpetual DEX trading volume and institutional liquidity inflow.
Key 7-Day Market Metrics
MetricValueCurrent Price~$79.50 – $91.20 USD7-Day Price Range$75.20 – $88.50 USD24-Hour Trading Volume~$1.15B – $1.50B USDMarket Capitalization~$18.7B – $21.2B USD (Rank #9–10)Key Support Levels$75.10 / $70.00 – $72.50Key Resistance Levels$84.00 – $88.50 / $93.50
Technical Structure & Market Drivers
Trend Strength: HYPE remains structurally bullish on medium-to-long timeframes, trading comfortably above its 50-day EMA ($73.90) and 200-day EMA ($56.70), indicating sustained structural demand despite short-term consolidation.
Momentum Oscillators: The 14-day RSI sits near 38–53, reflecting a neutral-to-cooling short-term picture after testing local high resistance around $88–$89.
Protocol On-Chain Metrics: Hyperliquid's 30-day perpetual trading volume continues to average ~$200B+ with annualized protocol revenue hovering near $700M–$900M, providing a fundamental cash-flow backstop via token buybacks and yield mechanisms.
Supply & Valuation Considerations: Circulating supply remains at 222M–252M HYPE ($20B market cap) against a 1B maximum supply (~$80B FDV), making future token unlock schedules and contributor vesting key factors for long-term momentum.
1-Week Scenario Outlook
Bullish Continuation: A high-volume daily close above immediate resistance at $84.00 – $88.50 clears the path toward psychological breakout targets at $93.50 and $108.00 – $112.00.
Consolidation / Base-Building: Holding above primary support at $75.10 favors a range-bound structure between $76.00 and $86.00 while cooling off lower-timeframe overbought indicators.
Bearish Retracement: A breakdown below $75.00 risks a deeper correction toward the major support zone at $70.00 – $72.50, near the 50-day EMA.
#ChainlinkPowersBottomlinePaymentPlatform #BOJHikesRatesTo31YearHigh #HKMAPlansWholesaleCBDCByYearEnd
Hyperliquid (HYPE) is trading in the $79.50 – $91.20 USD range, consolidating near multi-week highs after a sustained push driven by strong perpetual DEX trading volume and institutional liquidity inflow.
Key 7-Day Market Metrics
MetricValueCurrent Price~$79.50 – $91.20 USD7-Day Price Range$75.20 – $88.50 USD24-Hour Trading Volume~$1.15B – $1.50B USDMarket Capitalization~$18.7B – $21.2B USD (Rank #9–10)Key Support Levels$75.10 / $70.00 – $72.50Key Resistance Levels$84.00 – $88.50 / $93.50
Technical Structure & Market Drivers
Trend Strength: HYPE remains structurally bullish on medium-to-long timeframes, trading comfortably above its 50-day EMA ($73.90) and 200-day EMA ($56.70), indicating sustained structural demand despite short-term consolidation.
Momentum Oscillators: The 14-day RSI sits near 38–53, reflecting a neutral-to-cooling short-term picture after testing local high resistance around $88–$89.
Protocol On-Chain Metrics: Hyperliquid's 30-day perpetual trading volume continues to average ~$200B+ with annualized protocol revenue hovering near $700M–$900M, providing a fundamental cash-flow backstop via token buybacks and yield mechanisms.
Supply & Valuation Considerations: Circulating supply remains at 222M–252M HYPE ($20B market cap) against a 1B maximum supply (~$80B FDV), making future token unlock schedules and contributor vesting key factors for long-term momentum.
1-Week Scenario Outlook
Bullish Continuation: A high-volume daily close above immediate resistance at $84.00 – $88.50 clears the path toward psychological breakout targets at $93.50 and $108.00 – $112.00.
Consolidation / Base-Building: Holding above primary support at $75.10 favors a range-bound structure between $76.00 and $86.00 while cooling off lower-timeframe overbought indicators.
Bearish Retracement: A breakdown below $75.00 risks a deeper correction toward the major support zone at $70.00 – $72.50, near the 50-day EMA.
#ChainlinkPowersBottomlinePaymentPlatform #BOJHikesRatesTo31YearHigh #HKMAPlansWholesaleCBDCByYearEnd
1
126
·
--
Bärisch
Übersetzung ansehen
Harmony (ONE) is trading between $0.00172 and $0.00184 USD, marking a volatile surge of +38% to +50% over the past 24 hours driven by a massive spike in trading volume.
Key 24-Hour Market Metrics
MetricValueCurrent Price~$0.00172 – $0.00184 USD24-Hour Range$0.00123 – $0.00239 USD24-Hour Trading Volume~$129M – $146M USDMarket Capitalization~$25.0M – $27.5M USDCirculating Supply~15.0 Billion ONE
Technical Indicators & Price Action
Volatile Breakout: ONE experienced an explosive intraday expansion, reaching a 24-hour high of $0.00239 before retracing to establish a local consolidation base near $0.00180.
Volume Expansion: The 24-hour volume exceeds 4x the total market capitalization (~$130M+), signaling heavy speculative interest, high DEX activity, and short-squeeze liquidations.
Momentum Oscillators: On lower timeframes (15m–1h), RSI has pulled back from extreme overbought territory (>80) toward the neutral 50–55 zone, indicating momentum cooling after the initial vertical push.
Short-Term Key Scenarios
Bullish Expansion: Holding support above $0.00165 – $0.00170 preserves the upward structure for a potential retest of $0.00210 and the 24-hour high at $0.00239.
Pullback Risk: A breakdown below $0.00150 risks a broader retracement toward baseline support at $0.00123, flushing out over-leveraged breakout long positions.
$ONE
Harmony (ONE) is trading between $0.00172 and $0.00184 USD, marking a volatile surge of +38% to +50% over the past 24 hours driven by a massive spike in trading volume.
Key 24-Hour Market Metrics
MetricValueCurrent Price~$0.00172 – $0.00184 USD24-Hour Range$0.00123 – $0.00239 USD24-Hour Trading Volume~$129M – $146M USDMarket Capitalization~$25.0M – $27.5M USDCirculating Supply~15.0 Billion ONE
Technical Indicators & Price Action
Volatile Breakout: ONE experienced an explosive intraday expansion, reaching a 24-hour high of $0.00239 before retracing to establish a local consolidation base near $0.00180.
Volume Expansion: The 24-hour volume exceeds 4x the total market capitalization (~$130M+), signaling heavy speculative interest, high DEX activity, and short-squeeze liquidations.
Momentum Oscillators: On lower timeframes (15m–1h), RSI has pulled back from extreme overbought territory (>80) toward the neutral 50–55 zone, indicating momentum cooling after the initial vertical push.
Short-Term Key Scenarios
Bullish Expansion: Holding support above $0.00165 – $0.00170 preserves the upward structure for a potential retest of $0.00210 and the 24-hour high at $0.00239.
Pullback Risk: A breakdown below $0.00150 risks a broader retracement toward baseline support at $0.00123, flushing out over-leveraged breakout long positions.
$ONE
Key 24-Hour Market Metrics
MetricValueCurrent Price~$0.00172 – $0.00184 USD24-Hour Range$0.00123 – $0.00239 USD24-Hour Trading Volume~$129M – $146M USDMarket Capitalization~$25.0M – $27.5M USDCirculating Supply~15.0 Billion ONE
Technical Indicators & Price Action
Volatile Breakout: ONE experienced an explosive intraday expansion, reaching a 24-hour high of $0.00239 before retracing to establish a local consolidation base near $0.00180.
Volume Expansion: The 24-hour volume exceeds 4x the total market capitalization (~$130M+), signaling heavy speculative interest, high DEX activity, and short-squeeze liquidations.
Momentum Oscillators: On lower timeframes (15m–1h), RSI has pulled back from extreme overbought territory (>80) toward the neutral 50–55 zone, indicating momentum cooling after the initial vertical push.
Short-Term Key Scenarios
Bullish Expansion: Holding support above $0.00165 – $0.00170 preserves the upward structure for a potential retest of $0.00210 and the 24-hour high at $0.00239.
Pullback Risk: A breakdown below $0.00150 risks a broader retracement toward baseline support at $0.00123, flushing out over-leveraged breakout long positions.
$ONE
1
52
·
--
Bärisch
Übersetzung ansehen
Chasing a BUY (Long) at current prices carries extreme risk, while a SELL / Take Profit (Short) bias has higher technical probability over the next 24 hours due to overextension and high funding costs
$GUSH.ETF
Parabolic Surge (+125.37%): The token has surged vertically from sub-$0.003 to ~$0.0098. Buying directly into vertical green spikes creates poor risk-to-reward because late buyers risk getting caught in immediate profit-taking.
1M Timeframe Selection: You are currently viewing the 1-Month (1M) chart. While the single monthly candle shows a massive bottom bounce from $0.0025, lower timeframes (15m / 1h / 4h) are heavily overbought and due for mean reversion.
Extreme Positive Funding Rate (+0.09216% / 4h): Long positions are paying a very heavy fee every 4 hours to keep positions open. High positive funding often triggers rapid "long squashes" when price stalls.
Overhead Resistance: Strong dynamic resistance sits at the monthly MA(25) line ($0.0131) with immediate psychological resistance at $0.0100.
24-Hour Strategy & Trade Scenarios
Sell / Short / Take Profit (Preferred Bias):
If already in a long position: Consider securing partial or full profits between $0.0098 – $0.0100.
For a short trade: Look for weakness or a break back below $0.0092 on lower timeframes (15m/1h), targeting pullback levels at $0.0075 and $0.0060.
Buy / Long (Contrarian / High Risk):
Avoid buying at market price. Wait for a healthy consolidation pullback to retest support near $0.0070 – $0.0075, or wait for a confirmed 4-hour candle close above $0.0105 backed by continuing volume.
Key Levels to Monitor
TypePrice LevelMajor Resistance$0.0105 – $0.0131 (MA25)Current Level~$0.0098First Support $0.0075Major Support$0.0050
Chasing a BUY (Long) at current prices carries extreme risk, while a SELL / Take Profit (Short) bias has higher technical probability over the next 24 hours due to overextension and high funding costs
$GUSH.ETF
Parabolic Surge (+125.37%): The token has surged vertically from sub-$0.003 to ~$0.0098. Buying directly into vertical green spikes creates poor risk-to-reward because late buyers risk getting caught in immediate profit-taking.
1M Timeframe Selection: You are currently viewing the 1-Month (1M) chart. While the single monthly candle shows a massive bottom bounce from $0.0025, lower timeframes (15m / 1h / 4h) are heavily overbought and due for mean reversion.
Extreme Positive Funding Rate (+0.09216% / 4h): Long positions are paying a very heavy fee every 4 hours to keep positions open. High positive funding often triggers rapid "long squashes" when price stalls.
Overhead Resistance: Strong dynamic resistance sits at the monthly MA(25) line ($0.0131) with immediate psychological resistance at $0.0100.
24-Hour Strategy & Trade Scenarios
Sell / Short / Take Profit (Preferred Bias):
If already in a long position: Consider securing partial or full profits between $0.0098 – $0.0100.
For a short trade: Look for weakness or a break back below $0.0092 on lower timeframes (15m/1h), targeting pullback levels at $0.0075 and $0.0060.
Buy / Long (Contrarian / High Risk):
Avoid buying at market price. Wait for a healthy consolidation pullback to retest support near $0.0070 – $0.0075, or wait for a confirmed 4-hour candle close above $0.0105 backed by continuing volume.
Key Levels to Monitor
TypePrice LevelMajor Resistance$0.0105 – $0.0131 (MA25)Current Level~$0.0098First Support $0.0075Major Support$0.0050
$GUSH.ETF
Parabolic Surge (+125.37%): The token has surged vertically from sub-$0.003 to ~$0.0098. Buying directly into vertical green spikes creates poor risk-to-reward because late buyers risk getting caught in immediate profit-taking.
1M Timeframe Selection: You are currently viewing the 1-Month (1M) chart. While the single monthly candle shows a massive bottom bounce from $0.0025, lower timeframes (15m / 1h / 4h) are heavily overbought and due for mean reversion.
Extreme Positive Funding Rate (+0.09216% / 4h): Long positions are paying a very heavy fee every 4 hours to keep positions open. High positive funding often triggers rapid "long squashes" when price stalls.
Overhead Resistance: Strong dynamic resistance sits at the monthly MA(25) line ($0.0131) with immediate psychological resistance at $0.0100.
24-Hour Strategy & Trade Scenarios
Sell / Short / Take Profit (Preferred Bias):
If already in a long position: Consider securing partial or full profits between $0.0098 – $0.0100.
For a short trade: Look for weakness or a break back below $0.0092 on lower timeframes (15m/1h), targeting pullback levels at $0.0075 and $0.0060.
Buy / Long (Contrarian / High Risk):
Avoid buying at market price. Wait for a healthy consolidation pullback to retest support near $0.0070 – $0.0075, or wait for a confirmed 4-hour candle close above $0.0105 backed by continuing volume.
Key Levels to Monitor
TypePrice LevelMajor Resistance$0.0105 – $0.0131 (MA25)Current Level~$0.0098First Support $0.0075Major Support$0.0050
GUSHETF-1,91%
1
48
Übersetzung ansehen
MYX Finance (MYX) is trading between $0.0560 and $0.0606 USD, reflecting minor range-bound consolidation over the past 24 hours with moderate turnover relative to its market size.
Key 24-Hour Market Metrics
MetricValueCurrent Price~$0.0560 – $0.0606 USD24-Hour Range$0.0547 – $0.0595 USD24-Hour Trading Volume~$6.5M – $7.4M USDMarket Capitalization~$21.8M – $23.6M USDCirculating Supply~235M – 387M MYX (Max: 1.00B)
Technical & Market Dynamics
Price Action & Ranges: MYX is consolidating in a tight lower-bound range. Local immediate support sits at $0.0545 – $0.0550. Initial upside resistance is capped at $0.0595 – $0.0620, with stronger structural resistance overhead around $0.0750.
Volume Profile: The 24-hour volume of ~$6.5M–$7.4M represents a high volume-to-market-cap ratio (~30%), driven primarily by DEX liquidity and perpetual swap market activity.
Long-Term Context: The token remains significantly down from its historical high of $19.03 (set in September 2025), reflecting heavy supply dilution and prolonged macro correction across smaller cap DeFi derivative tokens.
Protocol Utility
MYX functions as the native governance and fee-accrual token for MYX Finance, an on-chain non-custodial perpetual derivatives DEX operating across Linea, Arbitrum, and BNB Chain. It utilizes a Matching Pool Mechanism (MPM) to allow multi-chain collateralized trading with low capital slippage.
#BTCBreaks80K $MYX
#ChainlinkPowersBottomlinePaymentPlatform
MYX Finance (MYX) is trading between $0.0560 and $0.0606 USD, reflecting minor range-bound consolidation over the past 24 hours with moderate turnover relative to its market size.
Key 24-Hour Market Metrics
MetricValueCurrent Price~$0.0560 – $0.0606 USD24-Hour Range$0.0547 – $0.0595 USD24-Hour Trading Volume~$6.5M – $7.4M USDMarket Capitalization~$21.8M – $23.6M USDCirculating Supply~235M – 387M MYX (Max: 1.00B)
Technical & Market Dynamics
Price Action & Ranges: MYX is consolidating in a tight lower-bound range. Local immediate support sits at $0.0545 – $0.0550. Initial upside resistance is capped at $0.0595 – $0.0620, with stronger structural resistance overhead around $0.0750.
Volume Profile: The 24-hour volume of ~$6.5M–$7.4M represents a high volume-to-market-cap ratio (~30%), driven primarily by DEX liquidity and perpetual swap market activity.
Long-Term Context: The token remains significantly down from its historical high of $19.03 (set in September 2025), reflecting heavy supply dilution and prolonged macro correction across smaller cap DeFi derivative tokens.
Protocol Utility
MYX functions as the native governance and fee-accrual token for MYX Finance, an on-chain non-custodial perpetual derivatives DEX operating across Linea, Arbitrum, and BNB Chain. It utilizes a Matching Pool Mechanism (MPM) to allow multi-chain collateralized trading with low capital slippage.
#BTCBreaks80K $MYX
#ChainlinkPowersBottomlinePaymentPlatform
Key 24-Hour Market Metrics
MetricValueCurrent Price~$0.0560 – $0.0606 USD24-Hour Range$0.0547 – $0.0595 USD24-Hour Trading Volume~$6.5M – $7.4M USDMarket Capitalization~$21.8M – $23.6M USDCirculating Supply~235M – 387M MYX (Max: 1.00B)
Technical & Market Dynamics
Price Action & Ranges: MYX is consolidating in a tight lower-bound range. Local immediate support sits at $0.0545 – $0.0550. Initial upside resistance is capped at $0.0595 – $0.0620, with stronger structural resistance overhead around $0.0750.
Volume Profile: The 24-hour volume of ~$6.5M–$7.4M represents a high volume-to-market-cap ratio (~30%), driven primarily by DEX liquidity and perpetual swap market activity.
Long-Term Context: The token remains significantly down from its historical high of $19.03 (set in September 2025), reflecting heavy supply dilution and prolonged macro correction across smaller cap DeFi derivative tokens.
Protocol Utility
MYX functions as the native governance and fee-accrual token for MYX Finance, an on-chain non-custodial perpetual derivatives DEX operating across Linea, Arbitrum, and BNB Chain. It utilizes a Matching Pool Mechanism (MPM) to allow multi-chain collateralized trading with low capital slippage.
#BTCBreaks80K $MYX
#ChainlinkPowersBottomlinePaymentPlatform
1
3
515
Übersetzung ansehen
Solana (SOL) is trading between $101.25 and $105.90 USD, up +2.5% to +4.3% over the last 24 hours with steady trading volume.
Key 24-Hour Performance Data
MetricValueCurrent Price~$101.25 – $105.90 USD24-Hour Range$96.11 – $102.86 USD24-Hour Trading Volume~$3.88B – $4.34B USDMarket Capitalization~$59.5B – $61.9B USD (Rank #7)Immediate Support / ResistanceSupport: $97.94
Technical Indicators & Price Action
Trend & Moving Averages: SOL remains well above its 50-day EMA ($93.05) and 200-day EMA ($93.40), keeping the broader structure bullish while price action consolidates within a tight intraday channel.
Momentum Oscillators:
RSI (14): Sitting near neutral (~50–55) on the daily timeframe, with minor overbought conditions appearing on lower timeframes (5m–15m).
MACD: Displays a mild bullish alignment, though histogram bars show flattening momentum, indicating range-bound chop.
Volume Weighted Average Price (VWAP): SOL is hovering close to its 1-month VWAP (~$100.80), reflecting institutional balance at present levels.
Short-Term Key Scenarios
Bullish Expansion: A sustained 4-hour close above the immediate resistance level at $101.50 – $102.80 could trigger momentum toward target resistance at $105.80 and $108.80.
Bearish Retracement: Loss of local support at $97.90 risks a breakdown toward $95.20, with stronger structural support situated near the 50-day EMA at $93.00.
Solana (SOL) is trading between $101.25 and $105.90 USD, up +2.5% to +4.3% over the last 24 hours with steady trading volume.
Key 24-Hour Performance Data
MetricValueCurrent Price~$101.25 – $105.90 USD24-Hour Range$96.11 – $102.86 USD24-Hour Trading Volume~$3.88B – $4.34B USDMarket Capitalization~$59.5B – $61.9B USD (Rank #7)Immediate Support / ResistanceSupport: $97.94
Technical Indicators & Price Action
Trend & Moving Averages: SOL remains well above its 50-day EMA ($93.05) and 200-day EMA ($93.40), keeping the broader structure bullish while price action consolidates within a tight intraday channel.
Momentum Oscillators:
RSI (14): Sitting near neutral (~50–55) on the daily timeframe, with minor overbought conditions appearing on lower timeframes (5m–15m).
MACD: Displays a mild bullish alignment, though histogram bars show flattening momentum, indicating range-bound chop.
Volume Weighted Average Price (VWAP): SOL is hovering close to its 1-month VWAP (~$100.80), reflecting institutional balance at present levels.
Short-Term Key Scenarios
Bullish Expansion: A sustained 4-hour close above the immediate resistance level at $101.50 – $102.80 could trigger momentum toward target resistance at $105.80 and $108.80.
Bearish Retracement: Loss of local support at $97.90 risks a breakdown toward $95.20, with stronger structural support situated near the 50-day EMA at $93.00.
Key 24-Hour Performance Data
MetricValueCurrent Price~$101.25 – $105.90 USD24-Hour Range$96.11 – $102.86 USD24-Hour Trading Volume~$3.88B – $4.34B USDMarket Capitalization~$59.5B – $61.9B USD (Rank #7)Immediate Support / ResistanceSupport: $97.94
Technical Indicators & Price Action
Trend & Moving Averages: SOL remains well above its 50-day EMA ($93.05) and 200-day EMA ($93.40), keeping the broader structure bullish while price action consolidates within a tight intraday channel.
Momentum Oscillators:
RSI (14): Sitting near neutral (~50–55) on the daily timeframe, with minor overbought conditions appearing on lower timeframes (5m–15m).
MACD: Displays a mild bullish alignment, though histogram bars show flattening momentum, indicating range-bound chop.
Volume Weighted Average Price (VWAP): SOL is hovering close to its 1-month VWAP (~$100.80), reflecting institutional balance at present levels.
Short-Term Key Scenarios
Bullish Expansion: A sustained 4-hour close above the immediate resistance level at $101.50 – $102.80 could trigger momentum toward target resistance at $105.80 and $108.80.
Bearish Retracement: Loss of local support at $97.90 risks a breakdown toward $95.20, with stronger structural support situated near the 50-day EMA at $93.00.
2
258
Über einen typischen Zeitraum von 24 Stunden zeigt Arbitrum (ARB) eine hohe Volatilität, angetrieben durch aktiven Derivatehandel und sich verändernde Marktstimmung:
Kursentwicklung & Spanne: ARB handelt im Allgemeinen in einer engen Spanne zwischen 0,135 $ und 0,150 $, wobei es zu leichten Schwankungen innerhalb des Tages kommt (typischerweise ein Wechsel zwischen -3 % und +3 % an normalen Tagen). In Phasen mit hoher Volatilität durch Nachrichten oder Token-Freigaben kommt es jedoch häufig zu größeren Ausschlägen im zweistelligen Bereich.
24-Stunden-Handelsvolumen: Das Volumen ist im Verhältnis zur Marktkapitalisierung außergewöhnlich hoch und liegt häufig – je nach der allgemeinen Marktdynamik und aktiver Futures-Spekulation – irgendwo zwischen 150 Millionen $ und über 600 Millionen $.
Derivate & Open Interest: Futures-Märkte verzeichnen oft eine starke Beteiligung (mit Millionen beim Open Interest). Dadurch reagieren die 24-Stunden-Charts empfindlich auf Liquidationen durch hohen Hebel, sobald der Preis wichtige technische Unterstützungsniveaus nahe 0,13–0,14 $ oder Widerstände nahe 0,15–0,16 $ testet.
#XRPSinks10% $ARB #XRPSinks10% #FedRateWatch
Über einen typischen Zeitraum von 24 Stunden zeigt Arbitrum (ARB) eine hohe Volatilität, angetrieben durch aktiven Derivatehandel und sich verändernde Marktstimmung:
Kursentwicklung & Spanne: ARB handelt im Allgemeinen in einer engen Spanne zwischen 0,135 $ und 0,150 $, wobei es zu leichten Schwankungen innerhalb des Tages kommt (typischerweise ein Wechsel zwischen -3 % und +3 % an normalen Tagen). In Phasen mit hoher Volatilität durch Nachrichten oder Token-Freigaben kommt es jedoch häufig zu größeren Ausschlägen im zweistelligen Bereich.
24-Stunden-Handelsvolumen: Das Volumen ist im Verhältnis zur Marktkapitalisierung außergewöhnlich hoch und liegt häufig – je nach der allgemeinen Marktdynamik und aktiver Futures-Spekulation – irgendwo zwischen 150 Millionen $ und über 600 Millionen $.
Derivate & Open Interest: Futures-Märkte verzeichnen oft eine starke Beteiligung (mit Millionen beim Open Interest). Dadurch reagieren die 24-Stunden-Charts empfindlich auf Liquidationen durch hohen Hebel, sobald der Preis wichtige technische Unterstützungsniveaus nahe 0,13–0,14 $ oder Widerstände nahe 0,15–0,16 $ testet.
#XRPSinks10% $ARB #XRPSinks10% #FedRateWatch
Kursentwicklung & Spanne: ARB handelt im Allgemeinen in einer engen Spanne zwischen 0,135 $ und 0,150 $, wobei es zu leichten Schwankungen innerhalb des Tages kommt (typischerweise ein Wechsel zwischen -3 % und +3 % an normalen Tagen). In Phasen mit hoher Volatilität durch Nachrichten oder Token-Freigaben kommt es jedoch häufig zu größeren Ausschlägen im zweistelligen Bereich.
24-Stunden-Handelsvolumen: Das Volumen ist im Verhältnis zur Marktkapitalisierung außergewöhnlich hoch und liegt häufig – je nach der allgemeinen Marktdynamik und aktiver Futures-Spekulation – irgendwo zwischen 150 Millionen $ und über 600 Millionen $.
Derivate & Open Interest: Futures-Märkte verzeichnen oft eine starke Beteiligung (mit Millionen beim Open Interest). Dadurch reagieren die 24-Stunden-Charts empfindlich auf Liquidationen durch hohen Hebel, sobald der Preis wichtige technische Unterstützungsniveaus nahe 0,13–0,14 $ oder Widerstände nahe 0,15–0,16 $ testet.
#XRPSinks10% $ARB #XRPSinks10% #FedRateWatch
145
Übersetzung ansehen
$NVDAB
$NVDAB

Binance News
·
--
US-Senat scheitert daran, das CLARITY-Gesetz voranzubringen, da der Schlussabstimmungsantrag (Cloture) nicht die erforderliche Mehrheit erreicht
Der US-Senat brachte das CLARITY-Gesetz nicht voran, nachdem ein Antrag auf Schluss der Debatte die erforderlichen 60 Stimmen nicht erreicht hatte. Laut Odaily läuft die namentliche Abstimmung weiterhin; das Ergebnis steht derzeit bei 47-47.
3
·
--
Bärisch
Übersetzung ansehen
Here is a 24 hrs analysis
📊 Current Market Snapshot
Price: ~$75,760 – $75,890 USD
24-Hour Change: Down ~2.21%
24-Hour Range: Low ~$74,887 / High ~$77,711
Market Sentiment Drivers: Recent downside momentum has been heavily influenced by macroeconomic and regulatory headlines—specifically, the Senate blocking/stalling the Digital Asset Market Clarity Act, which dampened market optimism.
🔍 Short-Term Technical Outlook (Next 24 Hours)
Key Support Levels:
$75,000: A psychological and technical pivot point. Holding this line is critical for maintaining short-term stability.
$74,800 – $74,500: Immediate lower support boundary tested during the recent dip. A high-volume breakdown below this zone risks triggering long liquidations toward the mid-$73,000s.
Key Resistance Levels:
$76,500: Minor intraday hurdle.
$77,700 – $78,000: Strong overhead resistance zone. Bulls need to reclaim this level to invalidate the recent lower-high structure.
Indicators & Momentum:
Short-term oscillators (like the 1-hour and 15-minute RSI sitting near neutral-to-slight buy) suggest a potential consolidation or minor relief bounce after the recent ~2% drop.
However, broader 4-hour and daily metrics show lingering bearish pressure, indicating that rallies may face heavy selling near resistance.
💡 Outlook Summary
Bitcoin is currently consolidating just above the $75,000 threshold. Expect choppy, range-bound price action between $74,800 and $76,500 over the next 24 hours unless a fresh macro catalyst or sudden shift in order book liquidity breaks the range
$BTC
Here is a 24 hrs analysis
📊 Current Market Snapshot
Price: ~$75,760 – $75,890 USD
24-Hour Change: Down ~2.21%
24-Hour Range: Low ~$74,887 / High ~$77,711
Market Sentiment Drivers: Recent downside momentum has been heavily influenced by macroeconomic and regulatory headlines—specifically, the Senate blocking/stalling the Digital Asset Market Clarity Act, which dampened market optimism.
🔍 Short-Term Technical Outlook (Next 24 Hours)
Key Support Levels:
$75,000: A psychological and technical pivot point. Holding this line is critical for maintaining short-term stability.
$74,800 – $74,500: Immediate lower support boundary tested during the recent dip. A high-volume breakdown below this zone risks triggering long liquidations toward the mid-$73,000s.
Key Resistance Levels:
$76,500: Minor intraday hurdle.
$77,700 – $78,000: Strong overhead resistance zone. Bulls need to reclaim this level to invalidate the recent lower-high structure.
Indicators & Momentum:
Short-term oscillators (like the 1-hour and 15-minute RSI sitting near neutral-to-slight buy) suggest a potential consolidation or minor relief bounce after the recent ~2% drop.
However, broader 4-hour and daily metrics show lingering bearish pressure, indicating that rallies may face heavy selling near resistance.
💡 Outlook Summary
Bitcoin is currently consolidating just above the $75,000 threshold. Expect choppy, range-bound price action between $74,800 and $76,500 over the next 24 hours unless a fresh macro catalyst or sudden shift in order book liquidity breaks the range
$BTC
📊 Current Market Snapshot
Price: ~$75,760 – $75,890 USD
24-Hour Change: Down ~2.21%
24-Hour Range: Low ~$74,887 / High ~$77,711
Market Sentiment Drivers: Recent downside momentum has been heavily influenced by macroeconomic and regulatory headlines—specifically, the Senate blocking/stalling the Digital Asset Market Clarity Act, which dampened market optimism.
🔍 Short-Term Technical Outlook (Next 24 Hours)
Key Support Levels:
$75,000: A psychological and technical pivot point. Holding this line is critical for maintaining short-term stability.
$74,800 – $74,500: Immediate lower support boundary tested during the recent dip. A high-volume breakdown below this zone risks triggering long liquidations toward the mid-$73,000s.
Key Resistance Levels:
$76,500: Minor intraday hurdle.
$77,700 – $78,000: Strong overhead resistance zone. Bulls need to reclaim this level to invalidate the recent lower-high structure.
Indicators & Momentum:
Short-term oscillators (like the 1-hour and 15-minute RSI sitting near neutral-to-slight buy) suggest a potential consolidation or minor relief bounce after the recent ~2% drop.
However, broader 4-hour and daily metrics show lingering bearish pressure, indicating that rallies may face heavy selling near resistance.
💡 Outlook Summary
Bitcoin is currently consolidating just above the $75,000 threshold. Expect choppy, range-bound price action between $74,800 and $76,500 over the next 24 hours unless a fresh macro catalyst or sudden shift in order book liquidity breaks the range
$BTC
1
73
Übersetzung ansehen
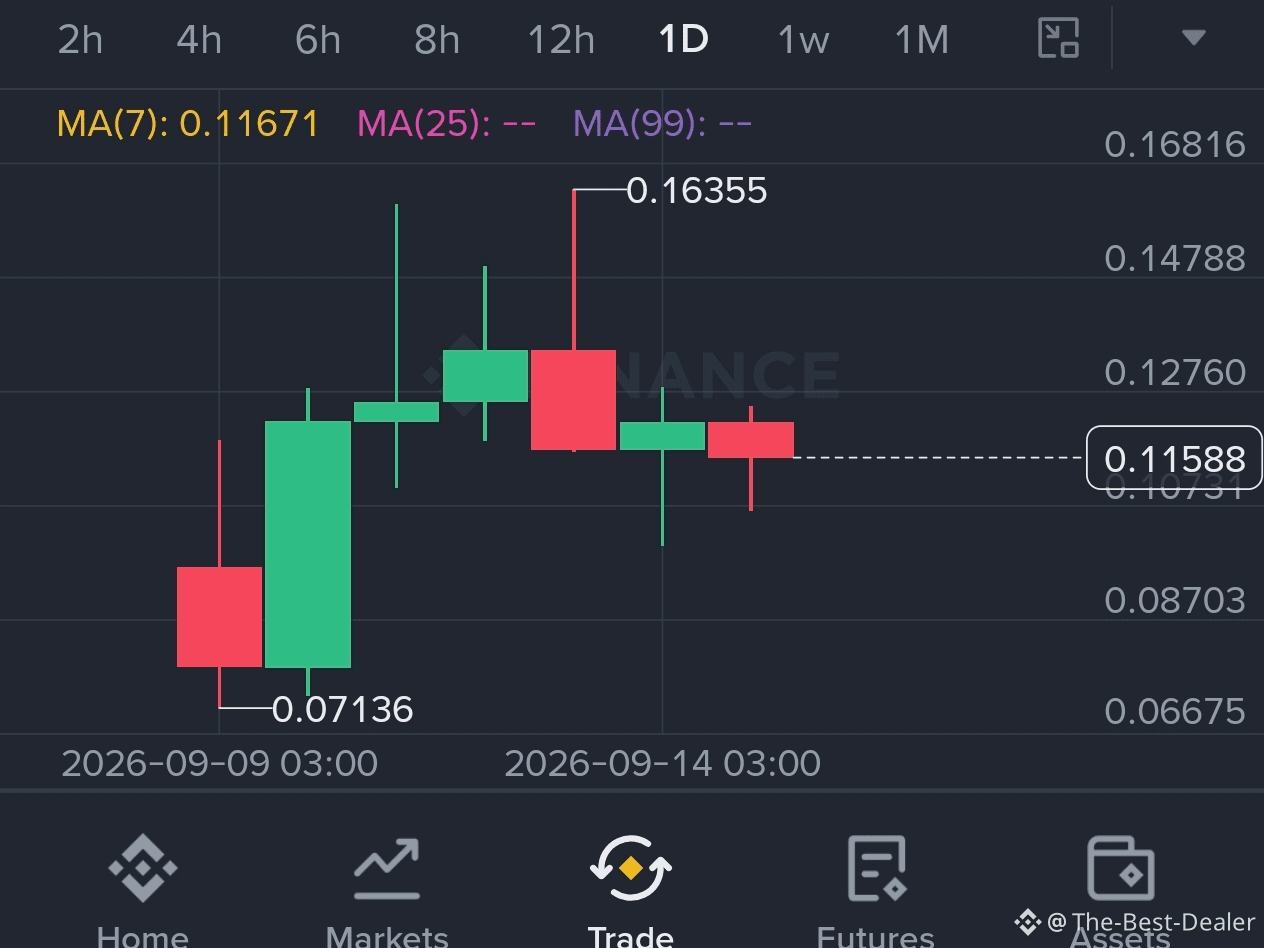
Based on the technical chart data shown in the image for 牛来/USDT (Spot market):
Current Price Action: The asset is currently trading around 0.11588 USDT, reflecting a daily gain of +13.08%.
Moving Average Support: The 7-period moving average (MA(7)) sits closely at 0.11671, showing recent short-term consolidation right near current price levels.
Candlestick Pattern: After a strong impulsive run up to a high of 0.16355, the chart displays a series of tightening, sideways red and green candles (consolidation phase).
Short-Term Outlook (Next 24 Hours)
Sideways to Potentially Down (Correction/Consolidation): Following a sharp double-digit percentage pump, assets typically enter a cooling-off or profit-taking phase. The tight candles near the lower end of the recent range suggest weakness in immediate upward continuation unless volume spikes again.
Key Levels to Watch:
Support sits around the 0.11500 – 0.11400 zone. If it breaks below this, expect further downside continuation in the short term.
Resistance is overhead near 0.11670 (MA(7)) and the recent local highs.
Based on the technical chart data shown in the image for 牛来/USDT (Spot market):
Current Price Action: The asset is currently trading around 0.11588 USDT, reflecting a daily gain of +13.08%.
Moving Average Support: The 7-period moving average (MA(7)) sits closely at 0.11671, showing recent short-term consolidation right near current price levels.
Candlestick Pattern: After a strong impulsive run up to a high of 0.16355, the chart displays a series of tightening, sideways red and green candles (consolidation phase).
Short-Term Outlook (Next 24 Hours)
Sideways to Potentially Down (Correction/Consolidation): Following a sharp double-digit percentage pump, assets typically enter a cooling-off or profit-taking phase. The tight candles near the lower end of the recent range suggest weakness in immediate upward continuation unless volume spikes again.
Key Levels to Watch:
Support sits around the 0.11500 – 0.11400 zone. If it breaks below this, expect further downside continuation in the short term.
Resistance is overhead near 0.11670 (MA(7)) and the recent local highs.
Current Price Action: The asset is currently trading around 0.11588 USDT, reflecting a daily gain of +13.08%.
Moving Average Support: The 7-period moving average (MA(7)) sits closely at 0.11671, showing recent short-term consolidation right near current price levels.
Candlestick Pattern: After a strong impulsive run up to a high of 0.16355, the chart displays a series of tightening, sideways red and green candles (consolidation phase).
Short-Term Outlook (Next 24 Hours)
Sideways to Potentially Down (Correction/Consolidation): Following a sharp double-digit percentage pump, assets typically enter a cooling-off or profit-taking phase. The tight candles near the lower end of the recent range suggest weakness in immediate upward continuation unless volume spikes again.
Key Levels to Watch:
Support sits around the 0.11500 – 0.11400 zone. If it breaks below this, expect further downside continuation in the short term.
Resistance is overhead near 0.11670 (MA(7)) and the recent local highs.
1
1
179
·
--
Bullisch
Hier ist die 24-Stunden-Marktanalyse und technische Analyse für Akedo (AKE):
1. 24-Stunden-Kursentwicklung & Key-Metriken
Aktueller Preis: ca. 0,0151 USD
24-Stunden-Preisänderung: Stabilisierung innerhalb einer engen Spanne, mit leichten Schwankungen von einem leichten Rückgang von -3,5% bis zu einer moderaten Erholung von +3,26% – abhängig vom Kursfeed der Börsen.
24-Stunden-Spanne:
Hoch: ca. 0,0168 USD
Tief: ca. 0,0146 USD
24-Stunden-Handelsvolumen: Starke Liquidität, im Bereich von 21,94 Mio. USD bis 39,68 Mio. USD.
Marktkapitalisierung: Ungefähr 344 Mio. – 352 Mio. USD, damit etwa auf Platz #124 weltweit.
2. Technische Aussichten & Unterstützung/Widerstand
Unmittelbare Unterstützungszone: 0,0130 – 0,0145 USD. Diese Zone diente in jüngster Zeit als entscheidender Boden bei kurzfristigen Rücksetzern. Das Halten oberhalb dieses Bereichs ist essenziell, um ein tieferes Abwärtsrisiko im mittleren Zeithorizont zu verhindern.
Unmittelbare Widerstandszone: 0,0180 – 0,0200 USD. Ein Ausbruch über diese Decke ist erforderlich, damit Bullen wieder starken Aufwärtsdrang zurückgewinnen.
Marktstimmung: Zähe/wechselhafte Kursbewegungen und gedämpfte Handelsvolumina deuten auf eine Phase der Konsolidierung hin – mit einem Tauziehen zwischen Käufern und Verkäufern.
3. Breiterer Kontext
Abstand zum Allzeithoch: AKE erreichte am 2. September 2026 sein Allzeithoch von 0,0360 USD. Auf dem aktuellen Niveau von rund 0,0151 USD handelt das Token etwa 57% unter seinem Peak. Es erlebt damit eine typische Standard-Abkühlung nach einer Rally und eine Volatilität, wie sie für Token aus dem KI- und Gaming-Sektor charakteristisch ist $AKE
Hier ist die 24-Stunden-Marktanalyse und technische Analyse für Akedo (AKE):
1. 24-Stunden-Kursentwicklung & Key-Metriken
Aktueller Preis: ca. 0,0151 USD
24-Stunden-Preisänderung: Stabilisierung innerhalb einer engen Spanne, mit leichten Schwankungen von einem leichten Rückgang von -3,5% bis zu einer moderaten Erholung von +3,26% – abhängig vom Kursfeed der Börsen.
24-Stunden-Spanne:
Hoch: ca. 0,0168 USD
Tief: ca. 0,0146 USD
24-Stunden-Handelsvolumen: Starke Liquidität, im Bereich von 21,94 Mio. USD bis 39,68 Mio. USD.
Marktkapitalisierung: Ungefähr 344 Mio. – 352 Mio. USD, damit etwa auf Platz #124 weltweit.
2. Technische Aussichten & Unterstützung/Widerstand
Unmittelbare Unterstützungszone: 0,0130 – 0,0145 USD. Diese Zone diente in jüngster Zeit als entscheidender Boden bei kurzfristigen Rücksetzern. Das Halten oberhalb dieses Bereichs ist essenziell, um ein tieferes Abwärtsrisiko im mittleren Zeithorizont zu verhindern.
Unmittelbare Widerstandszone: 0,0180 – 0,0200 USD. Ein Ausbruch über diese Decke ist erforderlich, damit Bullen wieder starken Aufwärtsdrang zurückgewinnen.
Marktstimmung: Zähe/wechselhafte Kursbewegungen und gedämpfte Handelsvolumina deuten auf eine Phase der Konsolidierung hin – mit einem Tauziehen zwischen Käufern und Verkäufern.
3. Breiterer Kontext
Abstand zum Allzeithoch: AKE erreichte am 2. September 2026 sein Allzeithoch von 0,0360 USD. Auf dem aktuellen Niveau von rund 0,0151 USD handelt das Token etwa 57% unter seinem Peak. Es erlebt damit eine typische Standard-Abkühlung nach einer Rally und eine Volatilität, wie sie für Token aus dem KI- und Gaming-Sektor charakteristisch ist $AKE
1. 24-Stunden-Kursentwicklung & Key-Metriken
Aktueller Preis: ca. 0,0151 USD
24-Stunden-Preisänderung: Stabilisierung innerhalb einer engen Spanne, mit leichten Schwankungen von einem leichten Rückgang von -3,5% bis zu einer moderaten Erholung von +3,26% – abhängig vom Kursfeed der Börsen.
24-Stunden-Spanne:
Hoch: ca. 0,0168 USD
Tief: ca. 0,0146 USD
24-Stunden-Handelsvolumen: Starke Liquidität, im Bereich von 21,94 Mio. USD bis 39,68 Mio. USD.
Marktkapitalisierung: Ungefähr 344 Mio. – 352 Mio. USD, damit etwa auf Platz #124 weltweit.
2. Technische Aussichten & Unterstützung/Widerstand
Unmittelbare Unterstützungszone: 0,0130 – 0,0145 USD. Diese Zone diente in jüngster Zeit als entscheidender Boden bei kurzfristigen Rücksetzern. Das Halten oberhalb dieses Bereichs ist essenziell, um ein tieferes Abwärtsrisiko im mittleren Zeithorizont zu verhindern.
Unmittelbare Widerstandszone: 0,0180 – 0,0200 USD. Ein Ausbruch über diese Decke ist erforderlich, damit Bullen wieder starken Aufwärtsdrang zurückgewinnen.
Marktstimmung: Zähe/wechselhafte Kursbewegungen und gedämpfte Handelsvolumina deuten auf eine Phase der Konsolidierung hin – mit einem Tauziehen zwischen Käufern und Verkäufern.
3. Breiterer Kontext
Abstand zum Allzeithoch: AKE erreichte am 2. September 2026 sein Allzeithoch von 0,0360 USD. Auf dem aktuellen Niveau von rund 0,0151 USD handelt das Token etwa 57% unter seinem Peak. Es erlebt damit eine typische Standard-Abkühlung nach einer Rally und eine Volatilität, wie sie für Token aus dem KI- und Gaming-Sektor charakteristisch ist $AKE
1
324
Übersetzung ansehen
harry before it ends
harry before it ends
Binance Square Official
·
--
Teile & gewinne Traffic-Belohnungen in unserer Kampagne mit angesagtem Hashtag
✨Thema: FOMC September, Was ist der nächste Schritt der Fed?
👉So nimmst du teil:
Veröffentliche einen kurzen Beitrag oder Artikel mit dem Hashtag #FedRateWatch
Erstelle Inhalte basierend auf den folgenden Blickwinkeln:
- Der August-Core-CPI stieg um 0,3% im Monatsvergleich, und die Wahrscheinlichkeit für eine 25bp-Erhöhung diese Woche liegt nun bei fast 90%. Erwartest du diese Woche eine Zinserhöhung? Handelt es sich um einen einmaligen Schritt oder den Beginn eines längeren Zinserhöhungszyklus?
- Wenn die Erhöhung erfolgt: Wie entwickelt sich das für BTC, Tech-Aktien und Gold? Aufwärts- oder abwärtsgerichtet?
- Wie planst du als Nächstes zu handeln? Teile deinen BTC-, Aktien- oder Gold-Trade/Bestände mit unserem Trade-Sharing-Widget.
⏰Kampagnenzeitraum:
- 2026-09-15 11:00 - 2026-09-17 3:00 UTC
🎁Belohnung:
- Qualifizierte Beiträge, die die oben genannten Richtlinien erfüllen und mehr als 100 Wörter enthalten, werden überprüft und erhalten möglicherweise einen zufälligen Traffic-Boost von 500 bis 3.000 Aufrufen. Du erhältst eine Benachrichtigung von deiner Feed-Secretary, wenn dein Beitrag ausgewählt wird.
- Erhalte die Chance, dass dein Artikel auf Binance Square Official vorgestellt wird
Du brauchst Ideen für deinen Beitrag? Besuche die Themenseite #FedRateWatch oder die Square Guide on How to Post for Better Reach.
✨Thema: FOMC September, Was ist der nächste Schritt der Fed?
👉So nimmst du teil:
Veröffentliche einen kurzen Beitrag oder Artikel mit dem Hashtag #FedRateWatch
Erstelle Inhalte basierend auf den folgenden Blickwinkeln:
- Der August-Core-CPI stieg um 0,3% im Monatsvergleich, und die Wahrscheinlichkeit für eine 25bp-Erhöhung diese Woche liegt nun bei fast 90%. Erwartest du diese Woche eine Zinserhöhung? Handelt es sich um einen einmaligen Schritt oder den Beginn eines längeren Zinserhöhungszyklus?
- Wenn die Erhöhung erfolgt: Wie entwickelt sich das für BTC, Tech-Aktien und Gold? Aufwärts- oder abwärtsgerichtet?
- Wie planst du als Nächstes zu handeln? Teile deinen BTC-, Aktien- oder Gold-Trade/Bestände mit unserem Trade-Sharing-Widget.
⏰Kampagnenzeitraum:
- 2026-09-15 11:00 - 2026-09-17 3:00 UTC
🎁Belohnung:
- Qualifizierte Beiträge, die die oben genannten Richtlinien erfüllen und mehr als 100 Wörter enthalten, werden überprüft und erhalten möglicherweise einen zufälligen Traffic-Boost von 500 bis 3.000 Aufrufen. Du erhältst eine Benachrichtigung von deiner Feed-Secretary, wenn dein Beitrag ausgewählt wird.
- Erhalte die Chance, dass dein Artikel auf Binance Square Official vorgestellt wird
Du brauchst Ideen für deinen Beitrag? Besuche die Themenseite #FedRateWatch oder die Square Guide on How to Post for Better Reach.

1
4
·
--
Bullisch
24-Stunden-Marktleistung & technischer Überblick für AIN/USDT$AIN
{future}(AINUSDT)
Aktueller Kurs: ca. $0,162 – $0,163 USD (Spot-/Perpetual-Referenzwerte unterscheiden sich je nach Börsenliquidität leicht)
Kursentwicklung der letzten 24 Stunden: Moderater Anstieg von etwa +3% bis +3,5% an den Spotmärkten, mit Konsolidierung nach jüngster Volatilität.
Handelsvolumen der letzten 24 Stunden: Hohe Beteiligung mit Kapitalflüssen im Multi-Millionen-Dollar-Bereich (Spotvolumen gepaart mit starkem Interesse an Derivaten/Futures; skaliert insgesamt auf über $48M–$57M über die unterstützten Börsen hinweg).
Marktkapitalisierung: Geschätzt bei etwa $30M – $50M, abhängig von den Berechnungen des umlaufenden Angebots; dabei weist das Volume-to-Market-Cap-Verhältnis auf aktiven spekulativen Handel und kurzfristiges Day-Trading hin.
Wichtige technische Marken zum Beobachten
Unmittelbarer Widerstand: Achte auf die obere Grenze der aktuellen 24-Stunden-Spanne ($0,165 – $0,170). Ein sauberer Ausbruch mit steigenden Umsätzen könnte einen erneuten Push in Richtung lokaler Swing-Highs ermöglichen.
Unmittelbare Unterstützung: Bewegt sich im Bereich der $0,155. Wenn sich der kurzfristige Momentum abschwächt und Verkäufer eingreifen, könnte das Nicht-Halten dieser Marke ein tieferes Retracement in Richtung der $0,145-Basis nach sich ziehen
24-Stunden-Marktleistung & technischer Überblick für AIN/USDT$AIN
Aktueller Kurs: ca. $0,162 – $0,163 USD (Spot-/Perpetual-Referenzwerte unterscheiden sich je nach Börsenliquidität leicht)
Kursentwicklung der letzten 24 Stunden: Moderater Anstieg von etwa +3% bis +3,5% an den Spotmärkten, mit Konsolidierung nach jüngster Volatilität.
Handelsvolumen der letzten 24 Stunden: Hohe Beteiligung mit Kapitalflüssen im Multi-Millionen-Dollar-Bereich (Spotvolumen gepaart mit starkem Interesse an Derivaten/Futures; skaliert insgesamt auf über $48M–$57M über die unterstützten Börsen hinweg).
Marktkapitalisierung: Geschätzt bei etwa $30M – $50M, abhängig von den Berechnungen des umlaufenden Angebots; dabei weist das Volume-to-Market-Cap-Verhältnis auf aktiven spekulativen Handel und kurzfristiges Day-Trading hin.
Wichtige technische Marken zum Beobachten
Unmittelbarer Widerstand: Achte auf die obere Grenze der aktuellen 24-Stunden-Spanne ($0,165 – $0,170). Ein sauberer Ausbruch mit steigenden Umsätzen könnte einen erneuten Push in Richtung lokaler Swing-Highs ermöglichen.
Unmittelbare Unterstützung: Bewegt sich im Bereich der $0,155. Wenn sich der kurzfristige Momentum abschwächt und Verkäufer eingreifen, könnte das Nicht-Halten dieser Marke ein tieferes Retracement in Richtung der $0,145-Basis nach sich ziehen
Aktueller Kurs: ca. $0,162 – $0,163 USD (Spot-/Perpetual-Referenzwerte unterscheiden sich je nach Börsenliquidität leicht)
Kursentwicklung der letzten 24 Stunden: Moderater Anstieg von etwa +3% bis +3,5% an den Spotmärkten, mit Konsolidierung nach jüngster Volatilität.
Handelsvolumen der letzten 24 Stunden: Hohe Beteiligung mit Kapitalflüssen im Multi-Millionen-Dollar-Bereich (Spotvolumen gepaart mit starkem Interesse an Derivaten/Futures; skaliert insgesamt auf über $48M–$57M über die unterstützten Börsen hinweg).
Marktkapitalisierung: Geschätzt bei etwa $30M – $50M, abhängig von den Berechnungen des umlaufenden Angebots; dabei weist das Volume-to-Market-Cap-Verhältnis auf aktiven spekulativen Handel und kurzfristiges Day-Trading hin.
Wichtige technische Marken zum Beobachten
Unmittelbarer Widerstand: Achte auf die obere Grenze der aktuellen 24-Stunden-Spanne ($0,165 – $0,170). Ein sauberer Ausbruch mit steigenden Umsätzen könnte einen erneuten Push in Richtung lokaler Swing-Highs ermöglichen.
Unmittelbare Unterstützung: Bewegt sich im Bereich der $0,155. Wenn sich der kurzfristige Momentum abschwächt und Verkäufer eingreifen, könnte das Nicht-Halten dieser Marke ein tieferes Retracement in Richtung der $0,145-Basis nach sich ziehen
1
162
Übersetzung ansehen
Bedrock (BR) is trading around $0.50 to $0.51 USD, reflecting strong volatility and heavy market activity across both spot and derivatives.
Key metrics for the past 24 hours include:
Price & Performance: The token has experienced minor corrective or sideways movement depending on the exchange pair, following recent bullish momentum that pushed prices higher over the weekly and monthly timeframes.
Trading Volume: 24-hour spot volume sits robustly in the multi-million dollar range (roughly $7.2M to $12M+ depending on aggregator feeds), while futures trading volume dwarfs spot significantly at over $509 million, indicating high leverage and speculative activity.
$BR
Open Interest: Derivative markets show an sharp increase in open interest (up over 76% over a 24-hour window), pointing to aggressive positioning by traders.
Bedrock (BR) is trading around $0.50 to $0.51 USD, reflecting strong volatility and heavy market activity across both spot and derivatives.
Key metrics for the past 24 hours include:
Price & Performance: The token has experienced minor corrective or sideways movement depending on the exchange pair, following recent bullish momentum that pushed prices higher over the weekly and monthly timeframes.
Trading Volume: 24-hour spot volume sits robustly in the multi-million dollar range (roughly $7.2M to $12M+ depending on aggregator feeds), while futures trading volume dwarfs spot significantly at over $509 million, indicating high leverage and speculative activity.
$BR
Open Interest: Derivative markets show an sharp increase in open interest (up over 76% over a 24-hour window), pointing to aggressive positioning by traders.
Key metrics for the past 24 hours include:
Price & Performance: The token has experienced minor corrective or sideways movement depending on the exchange pair, following recent bullish momentum that pushed prices higher over the weekly and monthly timeframes.
Trading Volume: 24-hour spot volume sits robustly in the multi-million dollar range (roughly $7.2M to $12M+ depending on aggregator feeds), while futures trading volume dwarfs spot significantly at over $509 million, indicating high leverage and speculative activity.
$BR
Open Interest: Derivative markets show an sharp increase in open interest (up over 76% over a 24-hour window), pointing to aggressive positioning by traders.
1
92
·
--
Bullisch
Übersetzung ansehen
Threshold Network (T) is currently consolidating in a tight band, reflecting low-volatility conditions across smaller-cap altcoins.
24-Hour Market Overview
Current Price: ~$0.0043 – $0.0044 USD
24-Hour Price Change: Up roughly +0.6% to +1.3%, showing mild upward stabilization
24-Hour Trading Range: Moving between a low of ~$0.00422 and a high of ~$0.00446
24-Hour Trading Volume: Moderate, hovering around $2.5M to $3M USD
Market Capitalization: Approximately $48M to $49M USD (ranking around #376–#473)
Technical Outlook & Sentiment
Range-Bound Action: The short-term price action remains tightly bound as the broader market continues to watch macro indicators and Bitcoin's behavior. There is an absence of sharp impulsive volume, meaning T is largely drifting sideways rather than staging a definitive breakout.
Support & Resistance: Immediate support sits near the $0.0042 level, which has acted as a short-term floor. On the flip side, overhead resistance is clustered around $0.0045 – $0.0046, a zone that requires an influx of volume to clear for any sustained upward push.
Volume Profile: Trading volume remains relatively thin, pointing to a lack of aggressive retail or institutional accumulation over the last 24 hours.$T
{spot}(TUSDT)
Threshold Network (T) is currently consolidating in a tight band, reflecting low-volatility conditions across smaller-cap altcoins.
24-Hour Market Overview
Current Price: ~$0.0043 – $0.0044 USD
24-Hour Price Change: Up roughly +0.6% to +1.3%, showing mild upward stabilization
24-Hour Trading Range: Moving between a low of ~$0.00422 and a high of ~$0.00446
24-Hour Trading Volume: Moderate, hovering around $2.5M to $3M USD
Market Capitalization: Approximately $48M to $49M USD (ranking around #376–#473)
Technical Outlook & Sentiment
Range-Bound Action: The short-term price action remains tightly bound as the broader market continues to watch macro indicators and Bitcoin's behavior. There is an absence of sharp impulsive volume, meaning T is largely drifting sideways rather than staging a definitive breakout.
Support & Resistance: Immediate support sits near the $0.0042 level, which has acted as a short-term floor. On the flip side, overhead resistance is clustered around $0.0045 – $0.0046, a zone that requires an influx of volume to clear for any sustained upward push.
Volume Profile: Trading volume remains relatively thin, pointing to a lack of aggressive retail or institutional accumulation over the last 24 hours.$T
24-Hour Market Overview
Current Price: ~$0.0043 – $0.0044 USD
24-Hour Price Change: Up roughly +0.6% to +1.3%, showing mild upward stabilization
24-Hour Trading Range: Moving between a low of ~$0.00422 and a high of ~$0.00446
24-Hour Trading Volume: Moderate, hovering around $2.5M to $3M USD
Market Capitalization: Approximately $48M to $49M USD (ranking around #376–#473)
Technical Outlook & Sentiment
Range-Bound Action: The short-term price action remains tightly bound as the broader market continues to watch macro indicators and Bitcoin's behavior. There is an absence of sharp impulsive volume, meaning T is largely drifting sideways rather than staging a definitive breakout.
Support & Resistance: Immediate support sits near the $0.0042 level, which has acted as a short-term floor. On the flip side, overhead resistance is clustered around $0.0045 – $0.0046, a zone that requires an influx of volume to clear for any sustained upward push.
Volume Profile: Trading volume remains relatively thin, pointing to a lack of aggressive retail or institutional accumulation over the last 24 hours.$T
1
108
·
--
Bärisch
Übersetzung ansehen
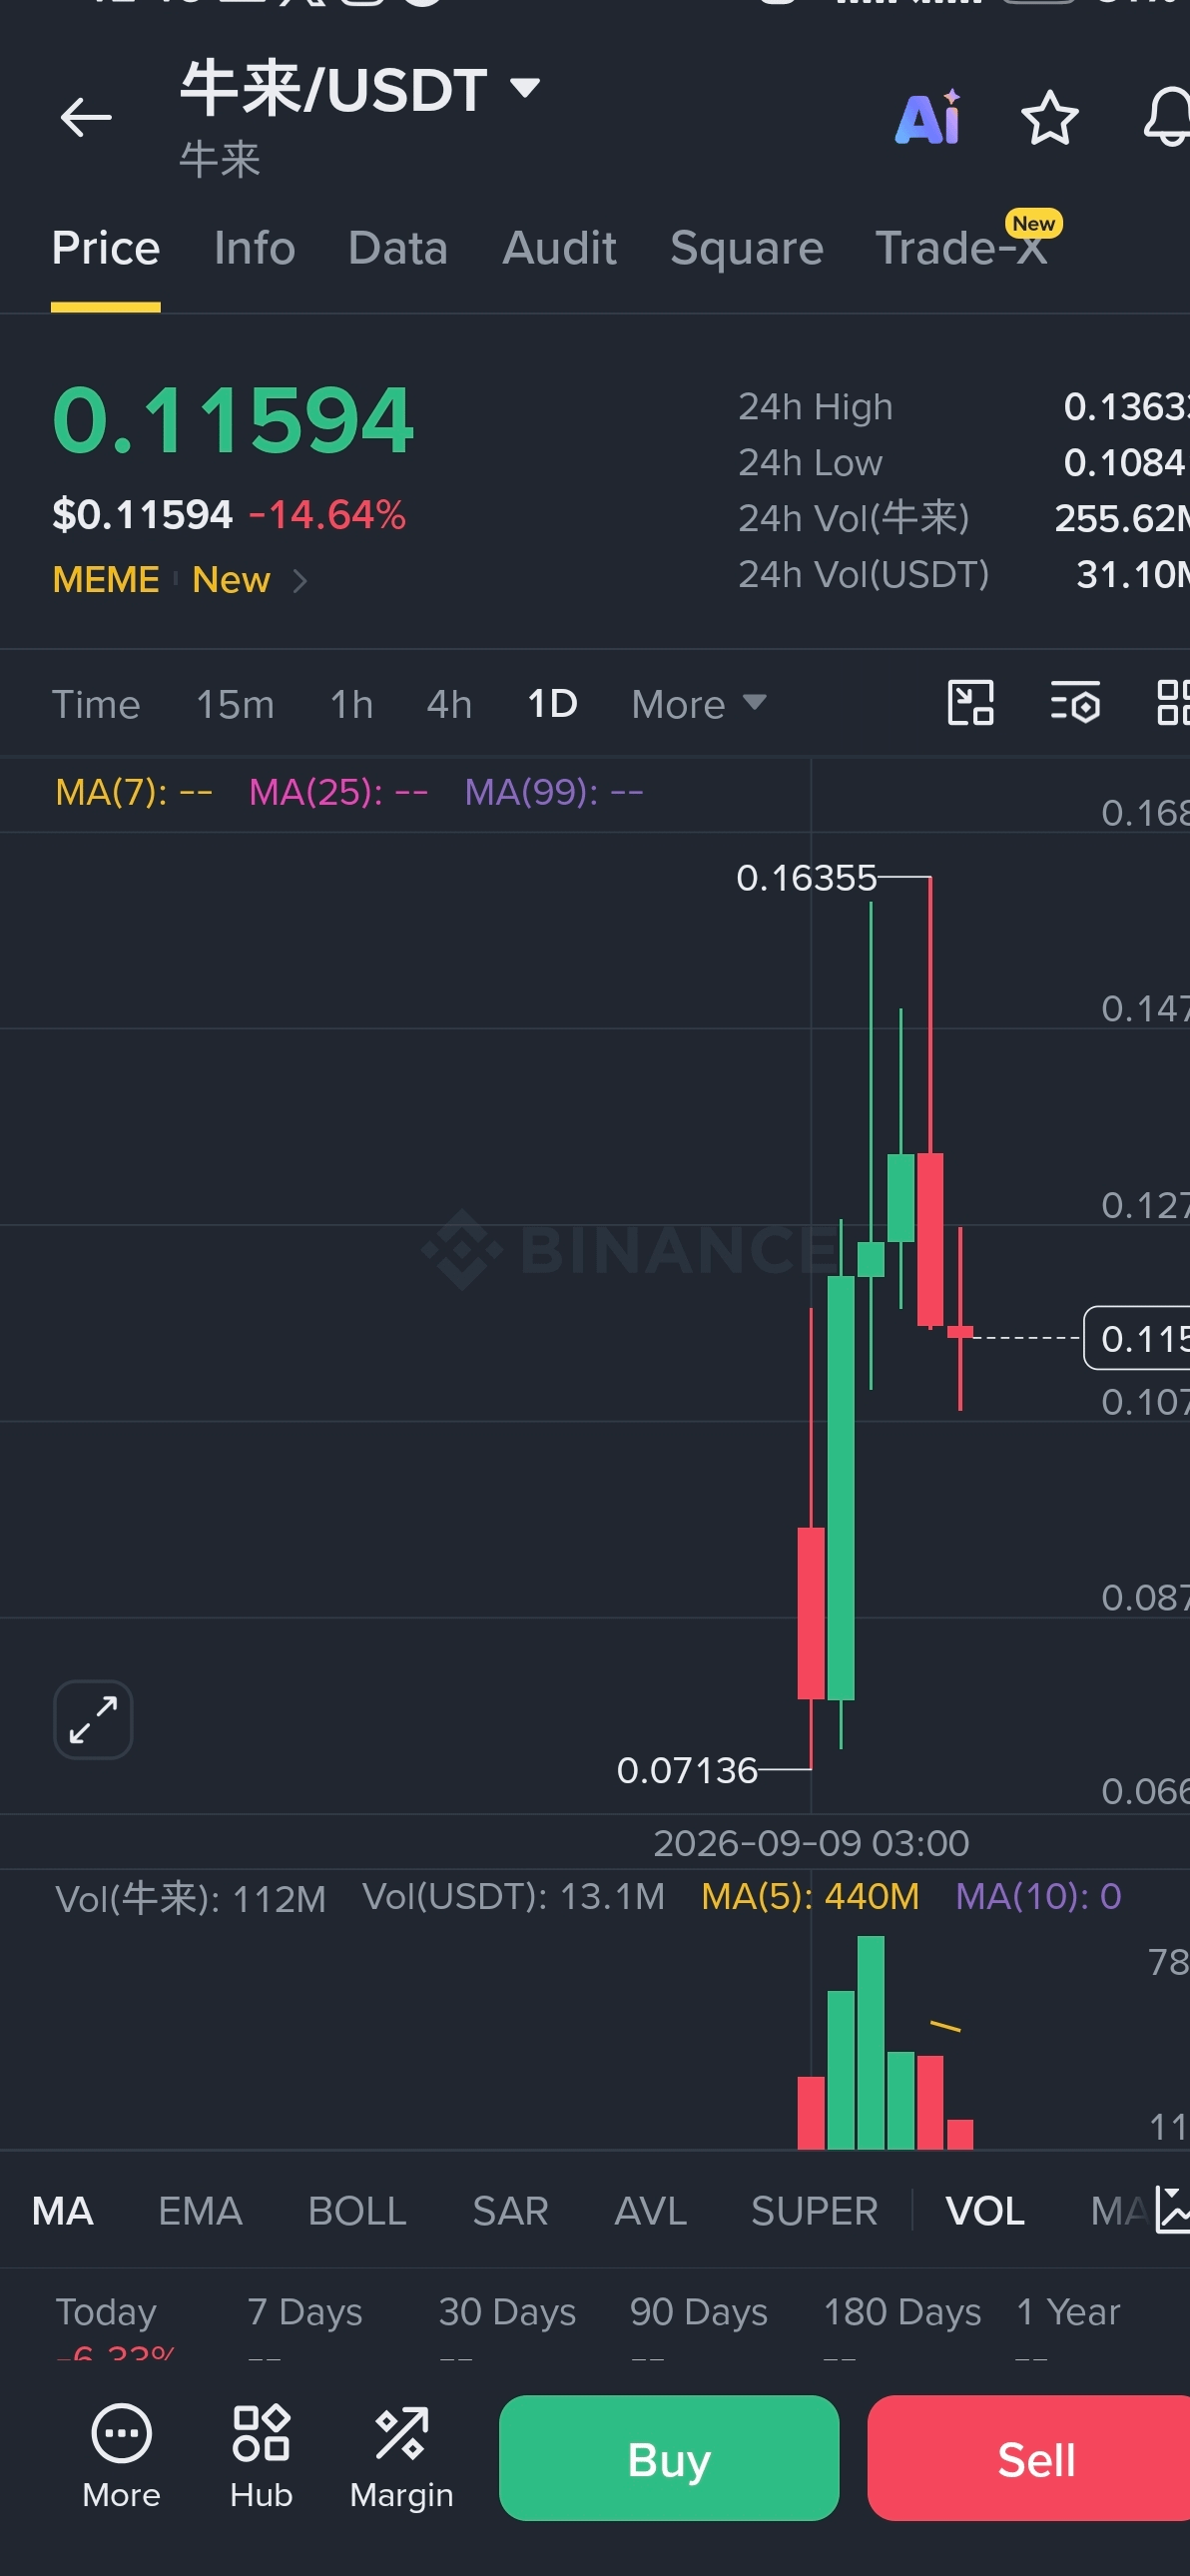
Current Price: 0.11594 USDT
24h Performance: Down 14.64%, trading near the lower end of its daily range.
24h High / Low:
24h High: 0.13633
24h Low: 0.10841
24h Volume: 255.62M 牛来 / 31.10M USDT
Chart Structure & Technical Observations
Recent Volatility: The daily candlestick chart shows a massive impulsive expansion starting around September 9, 2026, spiking to a peak of 0.16355 before experiencing heavy profit-taking and correction.
Current Candle: The active session is showing a red continuation candle pressing down toward support near the 0.10841 low.
Volume Profile: High volume clusters accompanied the initial breakout, but subsequent red volume bars indicate distribution and cooling momentum as short-term traders exit.
Short-Term Outlook (Next 24 Hours)
Support Zone: 0.10840 – 0.11000. Holding this level is critical to prevent a deeper slide toward psychological support zones.
Resistance Zone: 0.12700 – 0.13600. Any relief bounce will face immediate selling pressure around these former support-turned-resistance levels.
Market Bias: Bearish-to-neutral short-term correction following a high-volatility listing pump. Expect choppy consolidation or a retest of the daily low unless buying volume picks up significantly.
Current Price: 0.11594 USDT
24h Performance: Down 14.64%, trading near the lower end of its daily range.
24h High / Low:
24h High: 0.13633
24h Low: 0.10841
24h Volume: 255.62M 牛来 / 31.10M USDT
Chart Structure & Technical Observations
Recent Volatility: The daily candlestick chart shows a massive impulsive expansion starting around September 9, 2026, spiking to a peak of 0.16355 before experiencing heavy profit-taking and correction.
Current Candle: The active session is showing a red continuation candle pressing down toward support near the 0.10841 low.
Volume Profile: High volume clusters accompanied the initial breakout, but subsequent red volume bars indicate distribution and cooling momentum as short-term traders exit.
Short-Term Outlook (Next 24 Hours)
Support Zone: 0.10840 – 0.11000. Holding this level is critical to prevent a deeper slide toward psychological support zones.
Resistance Zone: 0.12700 – 0.13600. Any relief bounce will face immediate selling pressure around these former support-turned-resistance levels.
Market Bias: Bearish-to-neutral short-term correction following a high-volatility listing pump. Expect choppy consolidation or a retest of the daily low unless buying volume picks up significantly.
24h Performance: Down 14.64%, trading near the lower end of its daily range.
24h High / Low:
24h High: 0.13633
24h Low: 0.10841
24h Volume: 255.62M 牛来 / 31.10M USDT
Chart Structure & Technical Observations
Recent Volatility: The daily candlestick chart shows a massive impulsive expansion starting around September 9, 2026, spiking to a peak of 0.16355 before experiencing heavy profit-taking and correction.
Current Candle: The active session is showing a red continuation candle pressing down toward support near the 0.10841 low.
Volume Profile: High volume clusters accompanied the initial breakout, but subsequent red volume bars indicate distribution and cooling momentum as short-term traders exit.
Short-Term Outlook (Next 24 Hours)
Support Zone: 0.10840 – 0.11000. Holding this level is critical to prevent a deeper slide toward psychological support zones.
Resistance Zone: 0.12700 – 0.13600. Any relief bounce will face immediate selling pressure around these former support-turned-resistance levels.
Market Bias: Bearish-to-neutral short-term correction following a high-volatility listing pump. Expect choppy consolidation or a retest of the daily low unless buying volume picks up significantly.
1
50
·
--
Bullisch
Übersetzung ansehen
Can fil come back and goes to 1 to 250 $
Filecoin (FIL) is trading around $0.96 to $0.99, experiencing a significant 24-hour surge of roughly 18% to 22%.
Key 24-Hour Metrics & Market Dynamics
Price Action & Momentum: FIL has outperformed broader Layer 1 category averages, pushing past resistance levels and sparking strong bullish momentum. Despite a minor hourly pullback/consolidation of around 4% to 5% from its intraday peak, the overall 24-hour structure remains strongly green.
Volume Explosion: 24-hour trading volume has surged dramatically—up over 600% compared to typical weekly averages—crossing into the $350M–$430M range across spot and futures markets. This massive liquidity influx indicates heavy institutional or speculative capital rotation into the asset.
Market Capitalization: FIL's market cap has expanded to approximately $799 million, pushing its ranking up as buyers dominate order books (exchange metrics show buyer ratios heavily outweighing sellers over the past day).
Social Sentiment: Market sentiment across social channels is overwhelmingly bullish (averaging around 4.8/5), driven by renewed trader attention on DePIN and decentralized storage networks.
Short-Term Outlook
The explosive volume and strong double-digit gains signal heavy short-term momentum, but such rapid spikes often invite increased intraday volatility. Watch key support near the $0.80–$0.85 zone if a deeper cooling-off phase occurs, while the immediate psychological test lies in holding above $0.95 to sustain a push toward the $1.00+ psychological threshold.
$FIL
{spot}(FILUSDT)
Can fil come back and goes to 1 to 250 $
Filecoin (FIL) is trading around $0.96 to $0.99, experiencing a significant 24-hour surge of roughly 18% to 22%.
Key 24-Hour Metrics & Market Dynamics
Price Action & Momentum: FIL has outperformed broader Layer 1 category averages, pushing past resistance levels and sparking strong bullish momentum. Despite a minor hourly pullback/consolidation of around 4% to 5% from its intraday peak, the overall 24-hour structure remains strongly green.
Volume Explosion: 24-hour trading volume has surged dramatically—up over 600% compared to typical weekly averages—crossing into the $350M–$430M range across spot and futures markets. This massive liquidity influx indicates heavy institutional or speculative capital rotation into the asset.
Market Capitalization: FIL's market cap has expanded to approximately $799 million, pushing its ranking up as buyers dominate order books (exchange metrics show buyer ratios heavily outweighing sellers over the past day).
Social Sentiment: Market sentiment across social channels is overwhelmingly bullish (averaging around 4.8/5), driven by renewed trader attention on DePIN and decentralized storage networks.
Short-Term Outlook
The explosive volume and strong double-digit gains signal heavy short-term momentum, but such rapid spikes often invite increased intraday volatility. Watch key support near the $0.80–$0.85 zone if a deeper cooling-off phase occurs, while the immediate psychological test lies in holding above $0.95 to sustain a push toward the $1.00+ psychological threshold.
$FIL
Filecoin (FIL) is trading around $0.96 to $0.99, experiencing a significant 24-hour surge of roughly 18% to 22%.
Key 24-Hour Metrics & Market Dynamics
Price Action & Momentum: FIL has outperformed broader Layer 1 category averages, pushing past resistance levels and sparking strong bullish momentum. Despite a minor hourly pullback/consolidation of around 4% to 5% from its intraday peak, the overall 24-hour structure remains strongly green.
Volume Explosion: 24-hour trading volume has surged dramatically—up over 600% compared to typical weekly averages—crossing into the $350M–$430M range across spot and futures markets. This massive liquidity influx indicates heavy institutional or speculative capital rotation into the asset.
Market Capitalization: FIL's market cap has expanded to approximately $799 million, pushing its ranking up as buyers dominate order books (exchange metrics show buyer ratios heavily outweighing sellers over the past day).
Social Sentiment: Market sentiment across social channels is overwhelmingly bullish (averaging around 4.8/5), driven by renewed trader attention on DePIN and decentralized storage networks.
Short-Term Outlook
The explosive volume and strong double-digit gains signal heavy short-term momentum, but such rapid spikes often invite increased intraday volatility. Watch key support near the $0.80–$0.85 zone if a deeper cooling-off phase occurs, while the immediate psychological test lies in holding above $0.95 to sustain a push toward the $1.00+ psychological threshold.
$FIL
1
340
Übersetzung ansehen
Filecoin (FIL) is trading in the range of $0.70 to $0.98 USD (hovering around $0.78 - $0.81 on most major spot exchanges).
24-Hour Price Action & Market Metrics
Price Change: Ranging narrowly between a minor -0.35\% correction to a slight+1.4% uptick depending on the exchange feed, showing relatively flat momentum over the past 24 hours.
24-Hour Trading Volume: Roughly $40M to $89M USD across spot markets (with futures volume significantly higher, pushing past several hundred million), indicating moderate short-term liquidity.
Market Capitalization: Approximately $567M to $664M USD, placing it around rank #72 among digital assets.
Circulating Supply: ~828 million FIL out of a total supply approaching 1.96 billion.
Technical Sentiment & Outlook
In-Range Consolidation: The 24-hour chart demonstrates low-amplitude sideways movement following a modest weekly gain of roughly 4%.
Relative Strength Index (RSI): Sits in the neutral zone (mid-40s), pointing to an equilibrium between buyers and sellers in the immediate timeframe.
Order Book Dynamics: Recent exchange data hints at slight divergence—while some platforms register a higher ratio of net buyers over a 24-hour window, overall volume trends suggest cautious market participation without aggressive accumulation or distribution.
Watch immediate local support near the $0.74 – $0.77 region, while overhead resistance sits around $0.85 – $0.90 if short-term bullish momentum tries to break out.
$FIL
Filecoin (FIL) is trading in the range of $0.70 to $0.98 USD (hovering around $0.78 - $0.81 on most major spot exchanges).
24-Hour Price Action & Market Metrics
Price Change: Ranging narrowly between a minor -0.35\% correction to a slight+1.4% uptick depending on the exchange feed, showing relatively flat momentum over the past 24 hours.
24-Hour Trading Volume: Roughly $40M to $89M USD across spot markets (with futures volume significantly higher, pushing past several hundred million), indicating moderate short-term liquidity.
Market Capitalization: Approximately $567M to $664M USD, placing it around rank #72 among digital assets.
Circulating Supply: ~828 million FIL out of a total supply approaching 1.96 billion.
Technical Sentiment & Outlook
In-Range Consolidation: The 24-hour chart demonstrates low-amplitude sideways movement following a modest weekly gain of roughly 4%.
Relative Strength Index (RSI): Sits in the neutral zone (mid-40s), pointing to an equilibrium between buyers and sellers in the immediate timeframe.
Order Book Dynamics: Recent exchange data hints at slight divergence—while some platforms register a higher ratio of net buyers over a 24-hour window, overall volume trends suggest cautious market participation without aggressive accumulation or distribution.
Watch immediate local support near the $0.74 – $0.77 region, while overhead resistance sits around $0.85 – $0.90 if short-term bullish momentum tries to break out.
$FIL
24-Hour Price Action & Market Metrics
Price Change: Ranging narrowly between a minor -0.35\% correction to a slight+1.4% uptick depending on the exchange feed, showing relatively flat momentum over the past 24 hours.
24-Hour Trading Volume: Roughly $40M to $89M USD across spot markets (with futures volume significantly higher, pushing past several hundred million), indicating moderate short-term liquidity.
Market Capitalization: Approximately $567M to $664M USD, placing it around rank #72 among digital assets.
Circulating Supply: ~828 million FIL out of a total supply approaching 1.96 billion.
Technical Sentiment & Outlook
In-Range Consolidation: The 24-hour chart demonstrates low-amplitude sideways movement following a modest weekly gain of roughly 4%.
Relative Strength Index (RSI): Sits in the neutral zone (mid-40s), pointing to an equilibrium between buyers and sellers in the immediate timeframe.
Order Book Dynamics: Recent exchange data hints at slight divergence—while some platforms register a higher ratio of net buyers over a 24-hour window, overall volume trends suggest cautious market participation without aggressive accumulation or distribution.
Watch immediate local support near the $0.74 – $0.77 region, while overhead resistance sits around $0.85 – $0.90 if short-term bullish momentum tries to break out.
$FIL
179
Anmelden und weiter Inhalte entdecken
Krypto-Nutzer weltweit auf Binance Square kennenlernen
⚡️ Bleib in Sachen Krypto stets am Puls.
💬 Die weltgrößte Kryptobörse vertraut darauf.
👍 Erhalte verlässliche Einblicke von verifizierten Creators.
E-Mail-Adresse/Telefonnummer