
Mr_Kaleem
8 Beiträge

Mr_Kaleem
Melden
Nutzer blockieren
Trade eröffnen
Regelmäßiger Trader
10.1 Monate
10 Following
15 Follower
14 Like gegeben
Beiträge
Portfolio
·
--
$BTC : ~$77.200 heute. Die kurzfristige Struktur ist nach der Abweisung nahe $78K neutral bis leicht bärisch. �
Bitget +1
🟢 Unterstützung: $76.000 → $75.000 → $72.850
🔴 Widerstand: $78.500 → $80.000
📈 Bullisch: Ein klarer Ausbruch über $80K könnte den Aufwärtsimpuls neu starten.
📉 Bärisch: Wenn $75K verloren geht, könnte das den Bereich um $72,8K freilegen.
Ausblick: BTC konsolidiert derzeit. Die nächste große Bewegung hängt sehr wahrscheinlich davon ab, ob Käufer $78,5K–$80K zurückerobern oder ob Verkäufer den Kurs unter $75K drücken. #BTC #BTC70K✈️
{spot}(BTCUSDT)
$BTC : ~$77.200 heute. Die kurzfristige Struktur ist nach der Abweisung nahe $78K neutral bis leicht bärisch. �
Bitget +1
🟢 Unterstützung: $76.000 → $75.000 → $72.850
🔴 Widerstand: $78.500 → $80.000
📈 Bullisch: Ein klarer Ausbruch über $80K könnte den Aufwärtsimpuls neu starten.
📉 Bärisch: Wenn $75K verloren geht, könnte das den Bereich um $72,8K freilegen.
Ausblick: BTC konsolidiert derzeit. Die nächste große Bewegung hängt sehr wahrscheinlich davon ab, ob Käufer $78,5K–$80K zurückerobern oder ob Verkäufer den Kurs unter $75K drücken. #BTC #BTC70K✈️
Bitget +1
🟢 Unterstützung: $76.000 → $75.000 → $72.850
🔴 Widerstand: $78.500 → $80.000
📈 Bullisch: Ein klarer Ausbruch über $80K könnte den Aufwärtsimpuls neu starten.
📉 Bärisch: Wenn $75K verloren geht, könnte das den Bereich um $72,8K freilegen.
Ausblick: BTC konsolidiert derzeit. Die nächste große Bewegung hängt sehr wahrscheinlich davon ab, ob Käufer $78,5K–$80K zurückerobern oder ob Verkäufer den Kurs unter $75K drücken. #BTC #BTC70K✈️
40
·
--
Bullisch
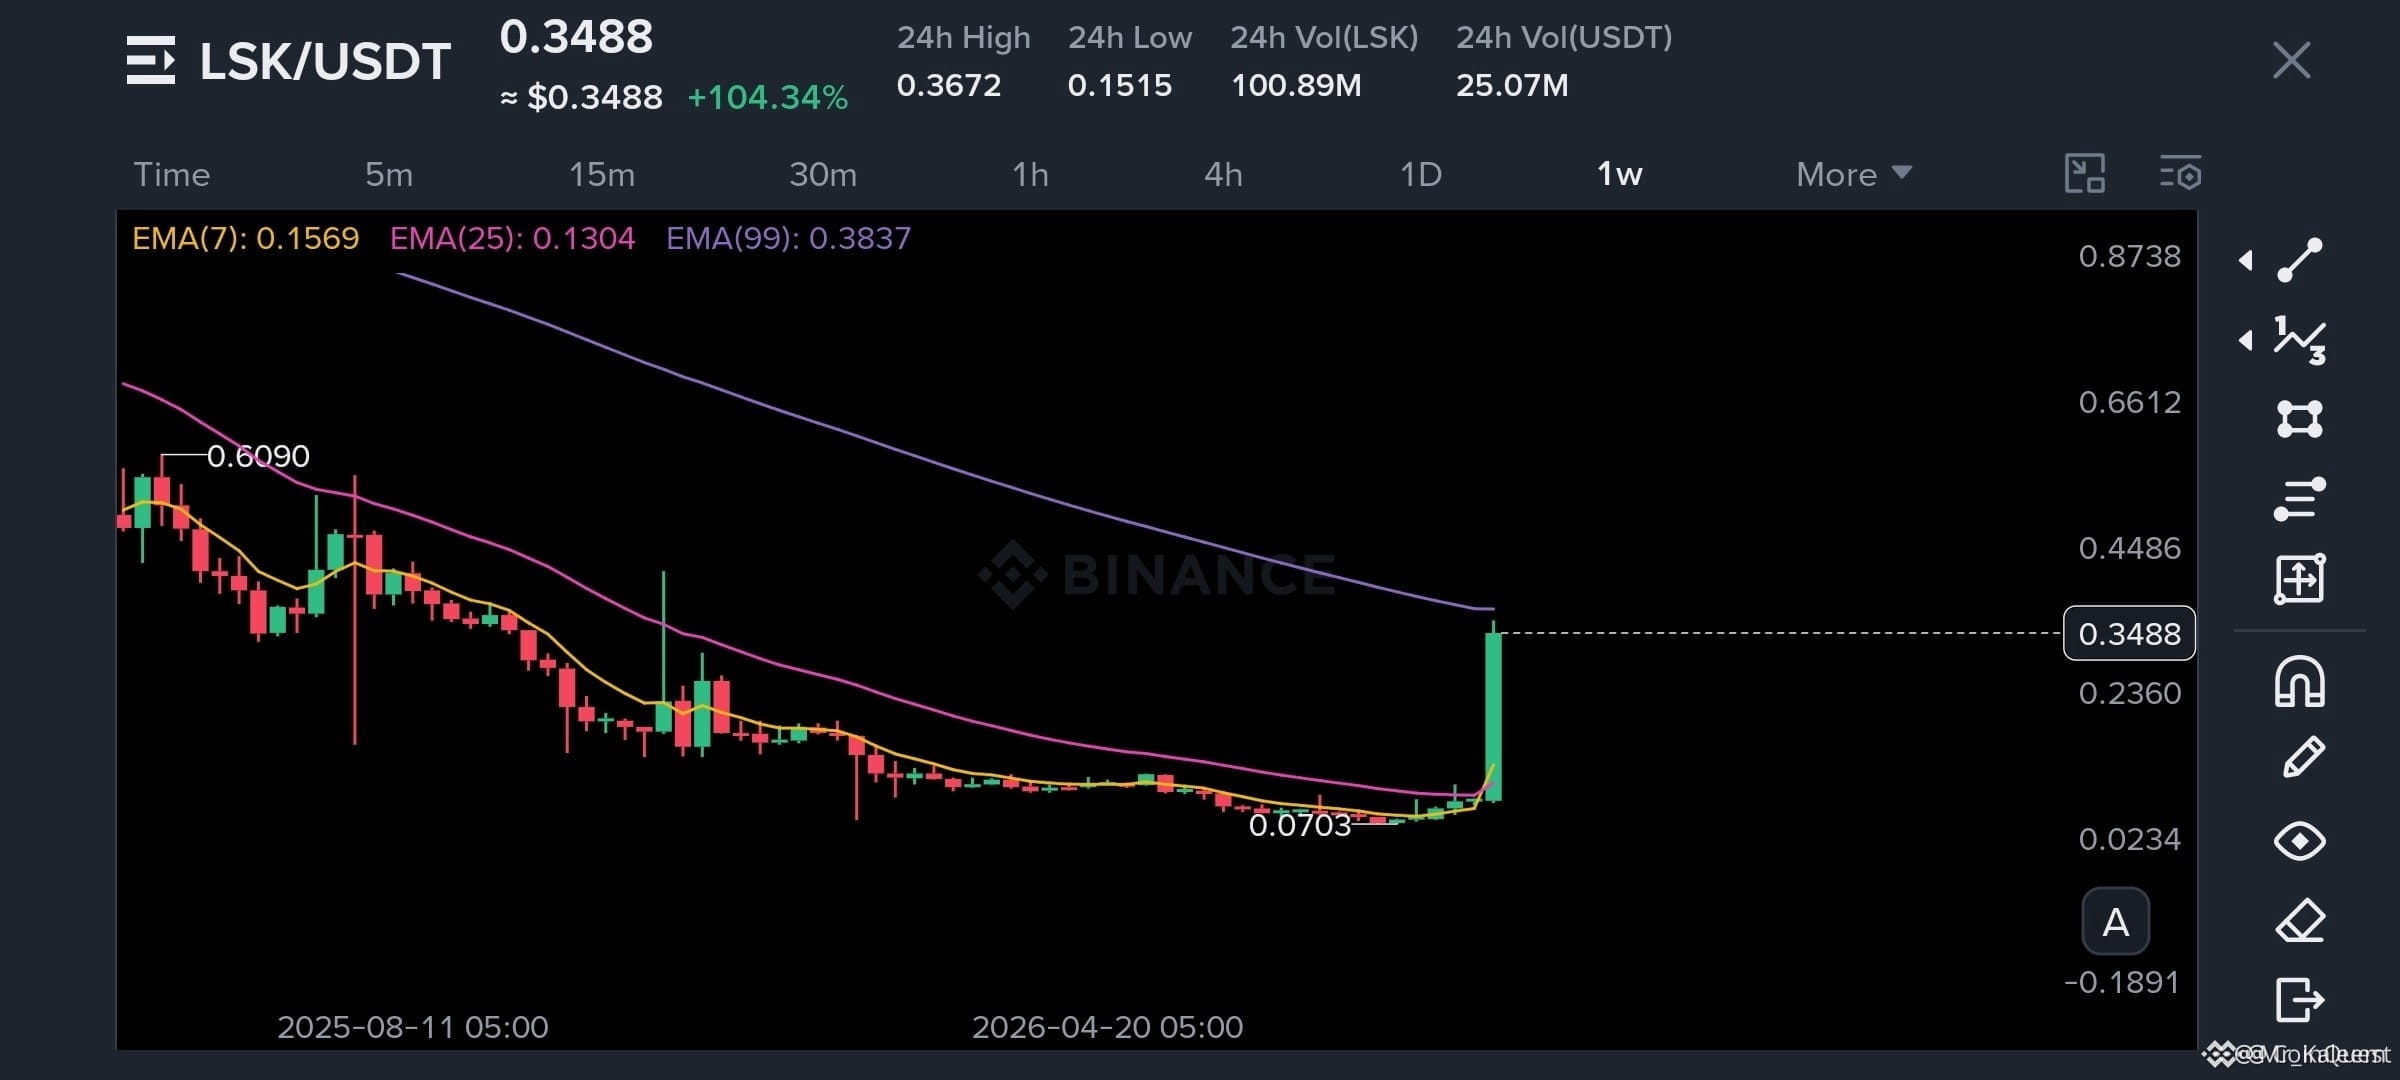
$LSK gerade von einer vergessenen Ansammlungzone zu einem vertikalen Move von 100%+ gewechselt. Jetzt läuft sie direkt in den Bereich, in dem dieser Rallye-Impuls getestet werden könnte...
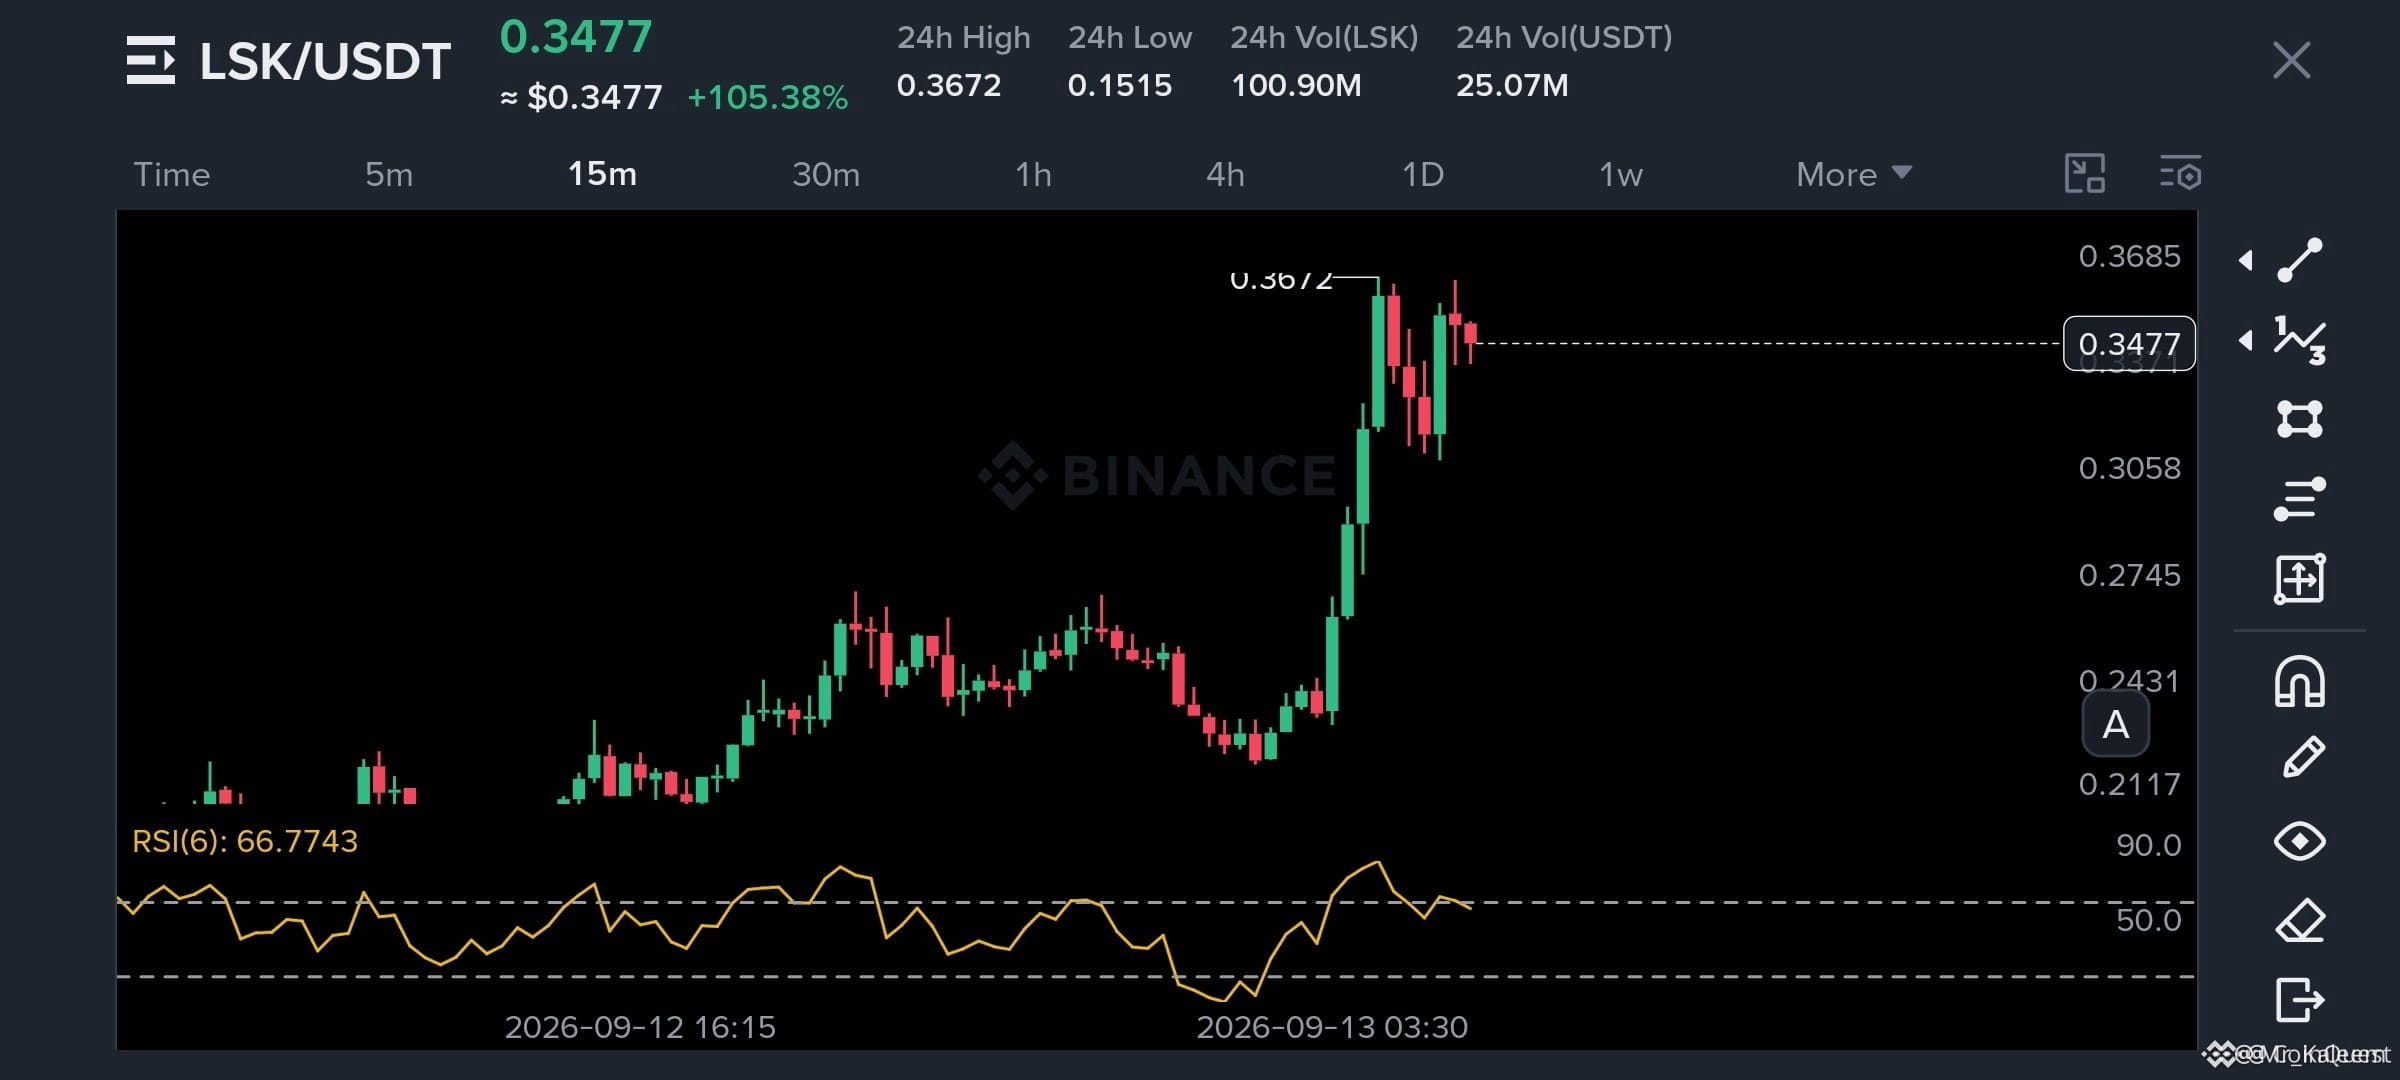
Der Kurs stieß auf $0.3672 und liegt jetzt bei etwa $0.3515, direkt unter der größeren $0.3800 bis $0.4000 Supply-Zone. Auf dem 15m-Chart beginnt der Kaufdruck nachzulassen: wiederholte obere Dochte und möglicherweise bildet sich nahe den Hochs ein doppelter Top.
Deshalb jage ich hier keine grünen Kerzen hinterher.
Ich beobachte $0.3520 bis $0.3720 für eine Short-Position, aber ich möchte eine Zurückweisung sehen, statt die Stärke blind zu shorten. Ein Bruch auf 15m unter $0.3480 würde den Verkäufern mehr Bestätigung geben.
Die Ziele sind zuerst $0.3337 und als Nächstes $0.2921, mit $0.42 als Invalidierung oberhalb des jüngsten Hochs.
Nach einem so aggressiven Move ist der interessante Trade nicht immer die nächste grüne Kerze.
Manchmal ist es das Finden der Stelle, an der die ersten ernsthaften Verkäufer schon warten.#ClarityActFacesProceduralVoteSept15 #LSK
{spot}(LSKUSDT)
$LSK gerade von einer vergessenen Ansammlungzone zu einem vertikalen Move von 100%+ gewechselt. Jetzt läuft sie direkt in den Bereich, in dem dieser Rallye-Impuls getestet werden könnte...
Der Kurs stieß auf $0.3672 und liegt jetzt bei etwa $0.3515, direkt unter der größeren $0.3800 bis $0.4000 Supply-Zone. Auf dem 15m-Chart beginnt der Kaufdruck nachzulassen: wiederholte obere Dochte und möglicherweise bildet sich nahe den Hochs ein doppelter Top.
Deshalb jage ich hier keine grünen Kerzen hinterher.
Ich beobachte $0.3520 bis $0.3720 für eine Short-Position, aber ich möchte eine Zurückweisung sehen, statt die Stärke blind zu shorten. Ein Bruch auf 15m unter $0.3480 würde den Verkäufern mehr Bestätigung geben.
Die Ziele sind zuerst $0.3337 und als Nächstes $0.2921, mit $0.42 als Invalidierung oberhalb des jüngsten Hochs.
Nach einem so aggressiven Move ist der interessante Trade nicht immer die nächste grüne Kerze.
Manchmal ist es das Finden der Stelle, an der die ersten ernsthaften Verkäufer schon warten.#ClarityActFacesProceduralVoteSept15 #LSK
Der Kurs stieß auf $0.3672 und liegt jetzt bei etwa $0.3515, direkt unter der größeren $0.3800 bis $0.4000 Supply-Zone. Auf dem 15m-Chart beginnt der Kaufdruck nachzulassen: wiederholte obere Dochte und möglicherweise bildet sich nahe den Hochs ein doppelter Top.
Deshalb jage ich hier keine grünen Kerzen hinterher.
Ich beobachte $0.3520 bis $0.3720 für eine Short-Position, aber ich möchte eine Zurückweisung sehen, statt die Stärke blind zu shorten. Ein Bruch auf 15m unter $0.3480 würde den Verkäufern mehr Bestätigung geben.
Die Ziele sind zuerst $0.3337 und als Nächstes $0.2921, mit $0.42 als Invalidierung oberhalb des jüngsten Hochs.
Nach einem so aggressiven Move ist der interessante Trade nicht immer die nächste grüne Kerze.
Manchmal ist es das Finden der Stelle, an der die ersten ernsthaften Verkäufer schon warten.#ClarityActFacesProceduralVoteSept15 #LSK
62
·
--
Bullisch
$ETH /USDT 4H-Analyse – Starker bullischer Momentum bestätigt
Kursbewegung im Fokus:
ETH ist entschlossen über die Konsolidierungszone von 2.500–2.550 ausgebrochen, mit einer kraftvollen impulsiven Kerze.
Der Kurs handelt klar oberhalb aller wichtigen gleitenden Durchschnitte (MA7, MA25, MA99) und bestätigt, dass die bullische Struktur intakt bleibt.
Das jüngste Swing-High bei 2.665,99 wirkt als unmittelbarer Widerstand; ein sauberer Ausbruch über diese Marke ebnet den Weg Richtung 2.750–2.800.
Volumenprofil & Marktteilnahme:
Ein massiver Volumenschub auf der letzten grünen Kerze zeigt starke Käuferüberzeugung und institutionelles Interesse.
Das Volumenprofil stützt den Ausbruch, statt eine Erschöpfung zu signalisieren – ein gesundes Zeichen für die Fortsetzung.
Trading-Idee: Long ETH/USDT
Einstiegszone: 2.550 – 2.590 (aktuelle Niveaus oder leichter Pullback in 2.570–2.580)
Stop Loss: 2.430 (unter dem Tief der Ausbruchskerze und unterstützend unterhalb der wichtigen MA)
Take Profit 1: 2.700 (Teilgewinn – 50%)
Take Profit 2: 2.800 – 2.850 (finales Ziel)
Risk-Reward: ~1:3,5 auf das volle Ziel
Risikomanagement: Nur 1% des Kapitals riskieren. Stop auf Break-even nachziehen, sobald TP1 erreicht ist.
Dieses Setup bietet einen Long mit hoher Wahrscheinlichkeit und klarer Invalidierung bei einem Bruch unter das jüngste Struktur-Tief.
📌 Teile nur persönliche Meinungen
keine finanzielle Beratung oder Empfehlung zum Kauf/Verkauf. Krypto ist sehr riskant; mache deine eigene Recherche (DYOR) und du bist allein verantwortlich. Kein Coin-Promotion
$ETH #Ethereum #CryptoTradingInsights #priceaction #volumeprofile $ETH
{spot}(ETHUSDT)
$ETH /USDT 4H-Analyse – Starker bullischer Momentum bestätigt
Kursbewegung im Fokus:
ETH ist entschlossen über die Konsolidierungszone von 2.500–2.550 ausgebrochen, mit einer kraftvollen impulsiven Kerze.
Der Kurs handelt klar oberhalb aller wichtigen gleitenden Durchschnitte (MA7, MA25, MA99) und bestätigt, dass die bullische Struktur intakt bleibt.
Das jüngste Swing-High bei 2.665,99 wirkt als unmittelbarer Widerstand; ein sauberer Ausbruch über diese Marke ebnet den Weg Richtung 2.750–2.800.
Volumenprofil & Marktteilnahme:
Ein massiver Volumenschub auf der letzten grünen Kerze zeigt starke Käuferüberzeugung und institutionelles Interesse.
Das Volumenprofil stützt den Ausbruch, statt eine Erschöpfung zu signalisieren – ein gesundes Zeichen für die Fortsetzung.
Trading-Idee: Long ETH/USDT
Einstiegszone: 2.550 – 2.590 (aktuelle Niveaus oder leichter Pullback in 2.570–2.580)
Stop Loss: 2.430 (unter dem Tief der Ausbruchskerze und unterstützend unterhalb der wichtigen MA)
Take Profit 1: 2.700 (Teilgewinn – 50%)
Take Profit 2: 2.800 – 2.850 (finales Ziel)
Risk-Reward: ~1:3,5 auf das volle Ziel
Risikomanagement: Nur 1% des Kapitals riskieren. Stop auf Break-even nachziehen, sobald TP1 erreicht ist.
Dieses Setup bietet einen Long mit hoher Wahrscheinlichkeit und klarer Invalidierung bei einem Bruch unter das jüngste Struktur-Tief.
📌 Teile nur persönliche Meinungen
keine finanzielle Beratung oder Empfehlung zum Kauf/Verkauf. Krypto ist sehr riskant; mache deine eigene Recherche (DYOR) und du bist allein verantwortlich. Kein Coin-Promotion
$ETH #Ethereum #CryptoTradingInsights #priceaction #volumeprofile $ETH
Kursbewegung im Fokus:
ETH ist entschlossen über die Konsolidierungszone von 2.500–2.550 ausgebrochen, mit einer kraftvollen impulsiven Kerze.
Der Kurs handelt klar oberhalb aller wichtigen gleitenden Durchschnitte (MA7, MA25, MA99) und bestätigt, dass die bullische Struktur intakt bleibt.
Das jüngste Swing-High bei 2.665,99 wirkt als unmittelbarer Widerstand; ein sauberer Ausbruch über diese Marke ebnet den Weg Richtung 2.750–2.800.
Volumenprofil & Marktteilnahme:
Ein massiver Volumenschub auf der letzten grünen Kerze zeigt starke Käuferüberzeugung und institutionelles Interesse.
Das Volumenprofil stützt den Ausbruch, statt eine Erschöpfung zu signalisieren – ein gesundes Zeichen für die Fortsetzung.
Trading-Idee: Long ETH/USDT
Einstiegszone: 2.550 – 2.590 (aktuelle Niveaus oder leichter Pullback in 2.570–2.580)
Stop Loss: 2.430 (unter dem Tief der Ausbruchskerze und unterstützend unterhalb der wichtigen MA)
Take Profit 1: 2.700 (Teilgewinn – 50%)
Take Profit 2: 2.800 – 2.850 (finales Ziel)
Risk-Reward: ~1:3,5 auf das volle Ziel
Risikomanagement: Nur 1% des Kapitals riskieren. Stop auf Break-even nachziehen, sobald TP1 erreicht ist.
Dieses Setup bietet einen Long mit hoher Wahrscheinlichkeit und klarer Invalidierung bei einem Bruch unter das jüngste Struktur-Tief.
📌 Teile nur persönliche Meinungen
keine finanzielle Beratung oder Empfehlung zum Kauf/Verkauf. Krypto ist sehr riskant; mache deine eigene Recherche (DYOR) und du bist allein verantwortlich. Kein Coin-Promotion
$ETH #Ethereum #CryptoTradingInsights #priceaction #volumeprofile $ETH
65
·
--
Übersetzung ansehen
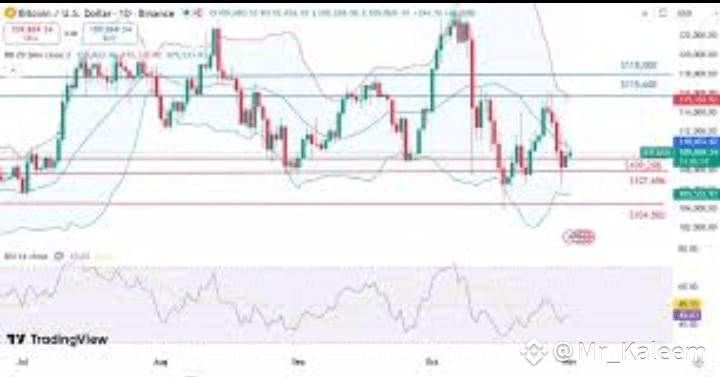
📈 Quick Bitcoin Update
As of now, Bitcoin is trading around USD $91,300, showing a modest bounce from the sharp sell-off earlier this month.
🔎 What Happened Recently
November 2025 has been rough — Bitcoin fell more than 21%, making this the steepest monthly decline since mid-2022.
The fall was driven by a mix of heavy profit-taking from institutional and corporate holders, forced liquidations in a risk-off environment, and uncertainty around global interest-rate policies.
More recently, some stability returned: interest-rate-cut expectations from the Federal Reserve have rekindled investor interest, and modest buying has helped Bitcoin reclaim the $91,000 zone.
🔮 What’s Next — Scenarios Ahead
📈 Optimistic view: If macro-economic conditions improve (e.g. rate cuts, renewed institutional confidence), Bitcoin could target $100,000+ again in the coming months.
⚠️ Cautious view: The market remains volatile. If negative sentiment returns or liquidity dries up, Bitcoin could retest the lower support — in the $82,000–$85,000 zone — before any sustainable upside.
📊 What to watch: Key triggers will likely be interest-rate decisions, institutional flows (e.g. ETF moves), and macroeconomic developments globally.
Overall, Bitcoin appears to be in a “pause and recover” phase — not entirely out of the woods, but showing tentative signs that the worst of the recent correction may be over.
If you like, I can put together a short 6-month forecast with possible price zones and probabilities (bullish / bearish) — might help if you’re thinking about investing.
$BTC
{future}(BTCUSDT)
$BTC #BTC #CPIWatch #trade
{future}(BTCDOMUSDT)
📈 Quick Bitcoin Update
As of now, Bitcoin is trading around USD $91,300, showing a modest bounce from the sharp sell-off earlier this month.
🔎 What Happened Recently
November 2025 has been rough — Bitcoin fell more than 21%, making this the steepest monthly decline since mid-2022.
The fall was driven by a mix of heavy profit-taking from institutional and corporate holders, forced liquidations in a risk-off environment, and uncertainty around global interest-rate policies.
More recently, some stability returned: interest-rate-cut expectations from the Federal Reserve have rekindled investor interest, and modest buying has helped Bitcoin reclaim the $91,000 zone.
🔮 What’s Next — Scenarios Ahead
📈 Optimistic view: If macro-economic conditions improve (e.g. rate cuts, renewed institutional confidence), Bitcoin could target $100,000+ again in the coming months.
⚠️ Cautious view: The market remains volatile. If negative sentiment returns or liquidity dries up, Bitcoin could retest the lower support — in the $82,000–$85,000 zone — before any sustainable upside.
📊 What to watch: Key triggers will likely be interest-rate decisions, institutional flows (e.g. ETF moves), and macroeconomic developments globally.
Overall, Bitcoin appears to be in a “pause and recover” phase — not entirely out of the woods, but showing tentative signs that the worst of the recent correction may be over.
If you like, I can put together a short 6-month forecast with possible price zones and probabilities (bullish / bearish) — might help if you’re thinking about investing.
$BTC
$BTC #BTC #CPIWatch #trade
As of now, Bitcoin is trading around USD $91,300, showing a modest bounce from the sharp sell-off earlier this month.
🔎 What Happened Recently
November 2025 has been rough — Bitcoin fell more than 21%, making this the steepest monthly decline since mid-2022.
The fall was driven by a mix of heavy profit-taking from institutional and corporate holders, forced liquidations in a risk-off environment, and uncertainty around global interest-rate policies.
More recently, some stability returned: interest-rate-cut expectations from the Federal Reserve have rekindled investor interest, and modest buying has helped Bitcoin reclaim the $91,000 zone.
🔮 What’s Next — Scenarios Ahead
📈 Optimistic view: If macro-economic conditions improve (e.g. rate cuts, renewed institutional confidence), Bitcoin could target $100,000+ again in the coming months.
⚠️ Cautious view: The market remains volatile. If negative sentiment returns or liquidity dries up, Bitcoin could retest the lower support — in the $82,000–$85,000 zone — before any sustainable upside.
📊 What to watch: Key triggers will likely be interest-rate decisions, institutional flows (e.g. ETF moves), and macroeconomic developments globally.
Overall, Bitcoin appears to be in a “pause and recover” phase — not entirely out of the woods, but showing tentative signs that the worst of the recent correction may be over.
If you like, I can put together a short 6-month forecast with possible price zones and probabilities (bullish / bearish) — might help if you’re thinking about investing.
$BTC
$BTC #BTC #CPIWatch #trade
7
·
--
Übersetzung ansehen
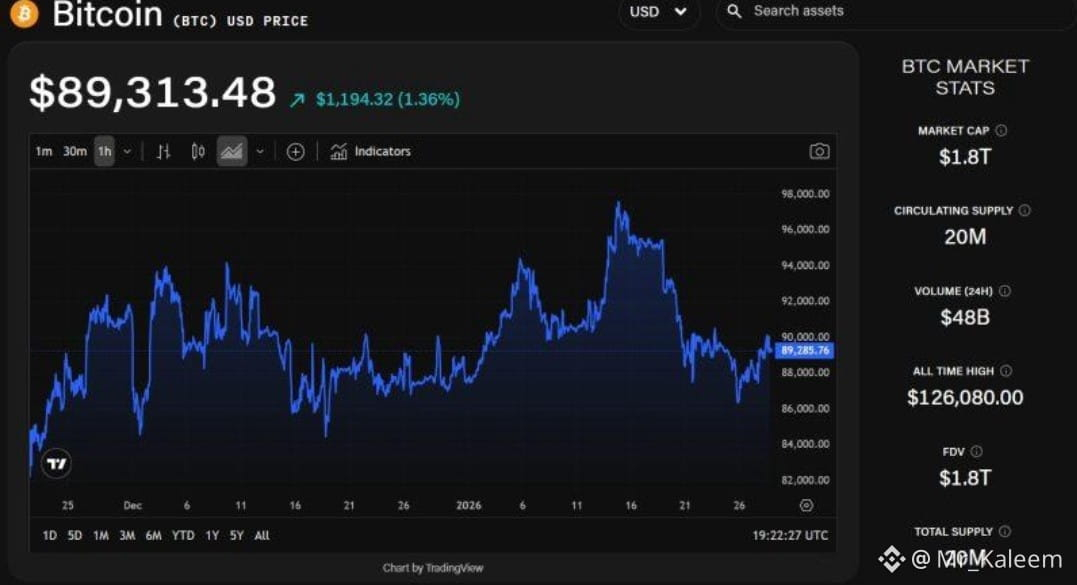
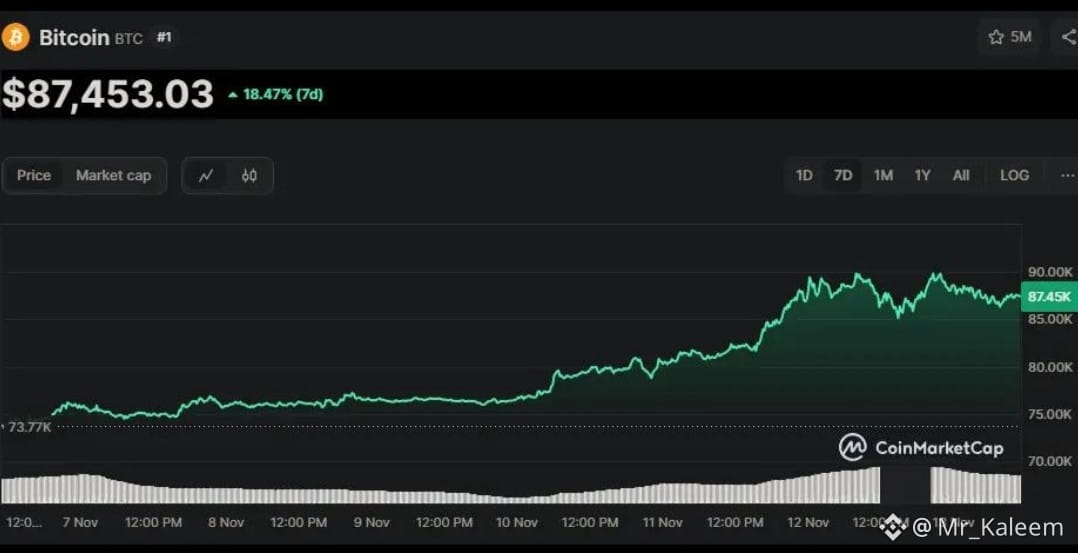
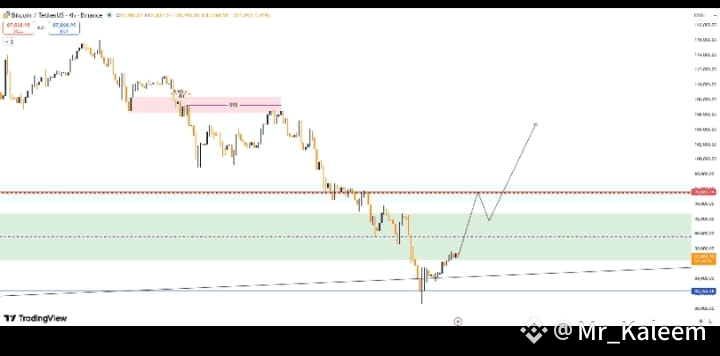
Here’s a short, up-to-date analysis of Bitcoin (BTC) as of late November 2025:
📊 Bitcoin Market Snapshot & Analysis
Price Action
Bitcoin has rebounded a bit and is trading near $88,000 after a sharp drop to around $80,000 earlier this week.
This bounce signals some stabilization, though it’s still below the highs seen in October (above six figures).
Key Drivers of the Decline
Forced liquidations: The recent sell-off has been exacerbated by leverage unwinds.
Risk-off sentiment: Broader markets are turning more cautious, and speculative assets like Bitcoin are under pressure.
Macro uncertainty: Rate-cut expectations from the Fed are unclear, which is weakening some of Bitcoin’s appeal.
Possible Scenarios
Bullish Case: If BTC continues to hold around $86K–$88K, we could see a “squeeze” that pushes it higher in the near term, maybe aiming for a 10–12% rally.
Bearish Case: A breakdown below $80,000 could reignite more downside, especially if more liquidation pressure comes in.
On-Chain & Flow Insights
Despite the drop, some on-chain data suggests long-term holders remain committed, and institutional flows might not be fully out yet.
However, ETF outflows are a concern: heavy redemptions have been recorded, putting pressure on demand.
Outlook
The current rebound could be a relief bounce, not necessarily a full recovery.
The market is at a key inflection point: how BTC behaves around $90K (if it reaches there) will be important.
Risk remains elevated, so traders may prefer to wait for clearer confirmation before leaning bullish again.
If you like, I can run a technical analysis with likely support and resistance zones for the next month — do you want me to do that?
$BTC
{future}(BTCUSDT)
#CryptoIn401k #USJobsData #BTCRebound90kNext? #ProjectCrypto #WriteToEarnUpgrade
Here’s a short, up-to-date analysis of Bitcoin (BTC) as of late November 2025:
📊 Bitcoin Market Snapshot & Analysis
Price Action
Bitcoin has rebounded a bit and is trading near $88,000 after a sharp drop to around $80,000 earlier this week.
This bounce signals some stabilization, though it’s still below the highs seen in October (above six figures).
Key Drivers of the Decline
Forced liquidations: The recent sell-off has been exacerbated by leverage unwinds.
Risk-off sentiment: Broader markets are turning more cautious, and speculative assets like Bitcoin are under pressure.
Macro uncertainty: Rate-cut expectations from the Fed are unclear, which is weakening some of Bitcoin’s appeal.
Possible Scenarios
Bullish Case: If BTC continues to hold around $86K–$88K, we could see a “squeeze” that pushes it higher in the near term, maybe aiming for a 10–12% rally.
Bearish Case: A breakdown below $80,000 could reignite more downside, especially if more liquidation pressure comes in.
On-Chain & Flow Insights
Despite the drop, some on-chain data suggests long-term holders remain committed, and institutional flows might not be fully out yet.
However, ETF outflows are a concern: heavy redemptions have been recorded, putting pressure on demand.
Outlook
The current rebound could be a relief bounce, not necessarily a full recovery.
The market is at a key inflection point: how BTC behaves around $90K (if it reaches there) will be important.
Risk remains elevated, so traders may prefer to wait for clearer confirmation before leaning bullish again.
If you like, I can run a technical analysis with likely support and resistance zones for the next month — do you want me to do that?
$BTC
#CryptoIn401k #USJobsData #BTCRebound90kNext? #ProjectCrypto #WriteToEarnUpgrade
📊 Bitcoin Market Snapshot & Analysis
Price Action
Bitcoin has rebounded a bit and is trading near $88,000 after a sharp drop to around $80,000 earlier this week.
This bounce signals some stabilization, though it’s still below the highs seen in October (above six figures).
Key Drivers of the Decline
Forced liquidations: The recent sell-off has been exacerbated by leverage unwinds.
Risk-off sentiment: Broader markets are turning more cautious, and speculative assets like Bitcoin are under pressure.
Macro uncertainty: Rate-cut expectations from the Fed are unclear, which is weakening some of Bitcoin’s appeal.
Possible Scenarios
Bullish Case: If BTC continues to hold around $86K–$88K, we could see a “squeeze” that pushes it higher in the near term, maybe aiming for a 10–12% rally.
Bearish Case: A breakdown below $80,000 could reignite more downside, especially if more liquidation pressure comes in.
On-Chain & Flow Insights
Despite the drop, some on-chain data suggests long-term holders remain committed, and institutional flows might not be fully out yet.
However, ETF outflows are a concern: heavy redemptions have been recorded, putting pressure on demand.
Outlook
The current rebound could be a relief bounce, not necessarily a full recovery.
The market is at a key inflection point: how BTC behaves around $90K (if it reaches there) will be important.
Risk remains elevated, so traders may prefer to wait for clearer confirmation before leaning bullish again.
If you like, I can run a technical analysis with likely support and resistance zones for the next month — do you want me to do that?
$BTC
#CryptoIn401k #USJobsData #BTCRebound90kNext? #ProjectCrypto #WriteToEarnUpgrade
10
·
--
Artikel
Übersetzung ansehen
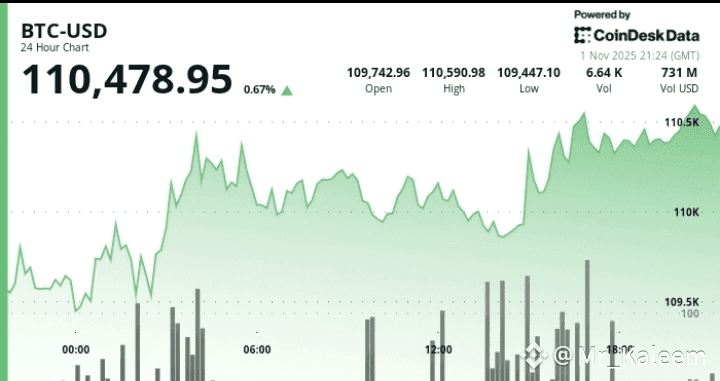
.Here’s a short, up-to-date analysis of Bitcoin (BTC) as of November 2025:
---
📊 Market Snapshot & Key Drivers
1. Price Retreat & Volatility
Bitcoin has fallen sharply from its October 2025 peak above $126K, dropping below $90K.
According to Bitmorpho’s technicals, BTC is currently trading around $84K–$85K, approaching key support zones near $82K–$80K.
The RSI is weak (neutral-to-bearish) and the MACD indicates selling pressure.
2. Macro & Institutional Influences
Macro headwinds: Uncertainty around future U.S. interest rate cuts is weighing on investor sentiment.
ETF dynamics: While some Bitcoin ETF products are seeing outflows, large “whale” holders (10K BTC+) are accumulating, anchoring the market.
Regulatory tailwinds: Pro-crypto policies are contributing to long-term institutional conviction.
3. Seasonality Lens
Historically, November has been a very strong month for Bitcoin, with average gains of ~42% — but that figure is skewed by extreme outliers. The median gain is closer to 8.8%.
Some bullish forecasts suggest a recovery toward $125K–$134K later in November if momentum returns.
---
🔎 Risks to Watch
A break below $80K could trigger deeper correction pressure.
Continued ETF outflows may sap liquidity and signal diminishing institutional risk appetite.
Macro uncertainty — especially around central bank policy — remains a wildcard.
---
✅ Bull vs. Bear Scenarios
Scenario Potential Outcome
Bullish If support around $82K–$85K holds and ETF inflows pick up, a rally back toward $120K+ is possible.
Bearish Breakdown below $80K could open the door to a deeper correction, possibly toward $75K or lower.
---
💡 Bottom Line
Bitcoin is in a moment of flux. The drop from recent highs suggests sentiment is fragile, but some large investors are using this dip to accumulate. If macro conditions improve and inflows return, we could see a rebound. On the flip side, a failure to hold support could deepen the correction.
---
If you like, I can run a quantitative forecast (using on-chain + technical + macro models) for Bitcoin’s price over the next 3 months — do you want me to do that? $BTC #BTCVolatility #ProjectCrypto #CryptoIn401k
.
Here’s a short, up-to-date analysis of Bitcoin (BTC) as of November 2025:
---
📊 Market Snapshot & Key Drivers
1. Price Retreat & Volatility
Bitcoin has fallen sharply from its October 2025 peak above $126K, dropping below $90K.
According to Bitmorpho’s technicals, BTC is currently trading around $84K–$85K, approaching key support zones near $82K–$80K.
The RSI is weak (neutral-to-bearish) and the MACD indicates selling pressure.
2. Macro & Institutional Influences
Macro headwinds: Uncertainty around future U.S. interest rate cuts is weighing on investor sentiment.
ETF dynamics: While some Bitcoin ETF products are seeing outflows, large “whale” holders (10K BTC+) are accumulating, anchoring the market.
Regulatory tailwinds: Pro-crypto policies are contributing to long-term institutional conviction.
3. Seasonality Lens
Historically, November has been a very strong month for Bitcoin, with average gains of ~42% — but that figure is skewed by extreme outliers. The median gain is closer to 8.8%.
Some bullish forecasts suggest a recovery toward $125K–$134K later in November if momentum returns.
---
🔎 Risks to Watch
A break below $80K could trigger deeper correction pressure.
Continued ETF outflows may sap liquidity and signal diminishing institutional risk appetite.
Macro uncertainty — especially around central bank policy — remains a wildcard.
---
✅ Bull vs. Bear Scenarios
Scenario Potential Outcome
Bullish If support around $82K–$85K holds and ETF inflows pick up, a rally back toward $120K+ is possible.
Bearish Breakdown below $80K could open the door to a deeper correction, possibly toward $75K or lower.
---
💡 Bottom Line
Bitcoin is in a moment of flux. The drop from recent highs suggests sentiment is fragile, but some large investors are using this dip to accumulate. If macro conditions improve and inflows return, we could see a rebound. On the flip side, a failure to hold support could deepen the correction.
---
If you like, I can run a quantitative forecast (using on-chain + technical + macro models) for Bitcoin’s price over the next 3 months — do you want me to do that? $BTC #BTCVolatility #ProjectCrypto #CryptoIn401k
---
📊 Market Snapshot & Key Drivers
1. Price Retreat & Volatility
Bitcoin has fallen sharply from its October 2025 peak above $126K, dropping below $90K.
According to Bitmorpho’s technicals, BTC is currently trading around $84K–$85K, approaching key support zones near $82K–$80K.
The RSI is weak (neutral-to-bearish) and the MACD indicates selling pressure.
2. Macro & Institutional Influences
Macro headwinds: Uncertainty around future U.S. interest rate cuts is weighing on investor sentiment.
ETF dynamics: While some Bitcoin ETF products are seeing outflows, large “whale” holders (10K BTC+) are accumulating, anchoring the market.
Regulatory tailwinds: Pro-crypto policies are contributing to long-term institutional conviction.
3. Seasonality Lens
Historically, November has been a very strong month for Bitcoin, with average gains of ~42% — but that figure is skewed by extreme outliers. The median gain is closer to 8.8%.
Some bullish forecasts suggest a recovery toward $125K–$134K later in November if momentum returns.
---
🔎 Risks to Watch
A break below $80K could trigger deeper correction pressure.
Continued ETF outflows may sap liquidity and signal diminishing institutional risk appetite.
Macro uncertainty — especially around central bank policy — remains a wildcard.
---
✅ Bull vs. Bear Scenarios
Scenario Potential Outcome
Bullish If support around $82K–$85K holds and ETF inflows pick up, a rally back toward $120K+ is possible.
Bearish Breakdown below $80K could open the door to a deeper correction, possibly toward $75K or lower.
---
💡 Bottom Line
Bitcoin is in a moment of flux. The drop from recent highs suggests sentiment is fragile, but some large investors are using this dip to accumulate. If macro conditions improve and inflows return, we could see a rebound. On the flip side, a failure to hold support could deepen the correction.
---
If you like, I can run a quantitative forecast (using on-chain + technical + macro models) for Bitcoin’s price over the next 3 months — do you want me to do that? $BTC #BTCVolatility #ProjectCrypto #CryptoIn401k
1
·
--
Artikel
Übersetzung ansehen
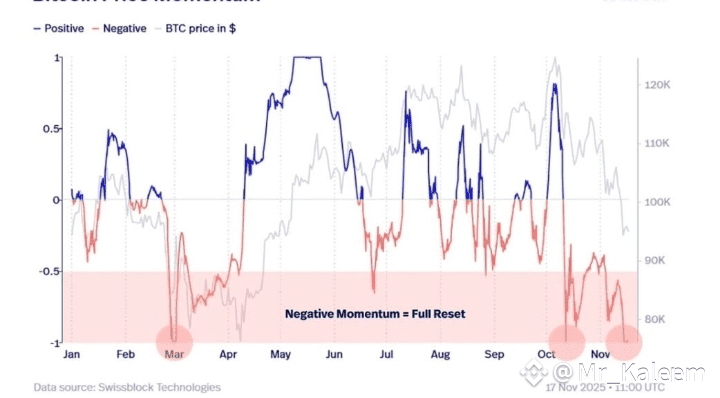
hiHere’s a short analysis of the latest Bitcoin (BTC) outlook:
🧭 Recent Price Action & Key Risks
Bitcoin has dropped sharply in November, falling from its October highs. Several sources report a strong “risk-off” sentiment dragging BTC into the ~$80K range.
Long-term holders are increasing their sell-pressure, which may signal weakening conviction.
According to Binance’s CEO, the current volatility is largely driven by investor deleveraging and broader market risk, not a unique crypto meltdown.
🔎 Technical & On-Chain View
Analysts see a crucial support zone around $82K; if that breaks, downside could accelerate.
On the flip side, some models suggest a range-bound consolidation between $92K-$98K as BTC digests recent volatility.
From an on-chain perspective, despite the pullback, accumulation continues in some segments — suggesting that not all participants are capitulating.
📅 Seasonality & Macro Factors
Historically, November has been a strong month for Bitcoin, with average gains often cited around +42%, though the median is closer to +8.8% — meaning past performance may not always deliver monster rallies.
Macro risks remain: regulatory uncertainty, possible rate moves, and broader financial risk aversion could continue to pressure BTC.
🔭 What Could Happen Next
Bearish scenario:
Break below $82K could lead to further losses, potentially unlocking more long-term holder selling.
ETF outflows or macro shocks may amplify downside.
Bullish scenario:
If BTC can stabilize and reclaim $92K–$96K, a bounce back toward $100K+ is possible. Some analysts even model a “V-shape” recovery.
Positive catalysts (e.g. dovish Fed signal, renewed ETF inflows) could spark a short squeeze.
✅ Bottom Line
Bitcoin’s current pullback is painful, but not out of the ordinary in a volatile macro climate. Key support around $82K will be critical. If this zone holds and institutional interest returns, there could be room for a recovery. However, a breakdown could trigger a steeper correction as long-term holders unwind.
If you like, I can run a chart-based technical forecast (with probability ranges) for BTC over the next 1–3 months — do you want me to do that?
$BTC
$BTC #BTCVolatility #CryptoIn401k #BTC90kBreakingPoint
hi
Here’s a short analysis of the latest Bitcoin (BTC) outlook:
🧭 Recent Price Action & Key Risks
Bitcoin has dropped sharply in November, falling from its October highs. Several sources report a strong “risk-off” sentiment dragging BTC into the ~$80K range.
Long-term holders are increasing their sell-pressure, which may signal weakening conviction.
According to Binance’s CEO, the current volatility is largely driven by investor deleveraging and broader market risk, not a unique crypto meltdown.
🔎 Technical & On-Chain View
Analysts see a crucial support zone around $82K; if that breaks, downside could accelerate.
On the flip side, some models suggest a range-bound consolidation between $92K-$98K as BTC digests recent volatility.
From an on-chain perspective, despite the pullback, accumulation continues in some segments — suggesting that not all participants are capitulating.
📅 Seasonality & Macro Factors
Historically, November has been a strong month for Bitcoin, with average gains often cited around +42%, though the median is closer to +8.8% — meaning past performance may not always deliver monster rallies.
Macro risks remain: regulatory uncertainty, possible rate moves, and broader financial risk aversion could continue to pressure BTC.
🔭 What Could Happen Next
Bearish scenario:
Break below $82K could lead to further losses, potentially unlocking more long-term holder selling.
ETF outflows or macro shocks may amplify downside.
Bullish scenario:
If BTC can stabilize and reclaim $92K–$96K, a bounce back toward $100K+ is possible. Some analysts even model a “V-shape” recovery.
Positive catalysts (e.g. dovish Fed signal, renewed ETF inflows) could spark a short squeeze.
✅ Bottom Line
Bitcoin’s current pullback is painful, but not out of the ordinary in a volatile macro climate. Key support around $82K will be critical. If this zone holds and institutional interest returns, there could be room for a recovery. However, a breakdown could trigger a steeper correction as long-term holders unwind.
If you like, I can run a chart-based technical forecast (with probability ranges) for BTC over the next 1–3 months — do you want me to do that?
$BTC
$BTC #BTCVolatility #CryptoIn401k #BTC90kBreakingPoint
🧭 Recent Price Action & Key Risks
Bitcoin has dropped sharply in November, falling from its October highs. Several sources report a strong “risk-off” sentiment dragging BTC into the ~$80K range.
Long-term holders are increasing their sell-pressure, which may signal weakening conviction.
According to Binance’s CEO, the current volatility is largely driven by investor deleveraging and broader market risk, not a unique crypto meltdown.
🔎 Technical & On-Chain View
Analysts see a crucial support zone around $82K; if that breaks, downside could accelerate.
On the flip side, some models suggest a range-bound consolidation between $92K-$98K as BTC digests recent volatility.
From an on-chain perspective, despite the pullback, accumulation continues in some segments — suggesting that not all participants are capitulating.
📅 Seasonality & Macro Factors
Historically, November has been a strong month for Bitcoin, with average gains often cited around +42%, though the median is closer to +8.8% — meaning past performance may not always deliver monster rallies.
Macro risks remain: regulatory uncertainty, possible rate moves, and broader financial risk aversion could continue to pressure BTC.
🔭 What Could Happen Next
Bearish scenario:
Break below $82K could lead to further losses, potentially unlocking more long-term holder selling.
ETF outflows or macro shocks may amplify downside.
Bullish scenario:
If BTC can stabilize and reclaim $92K–$96K, a bounce back toward $100K+ is possible. Some analysts even model a “V-shape” recovery.
Positive catalysts (e.g. dovish Fed signal, renewed ETF inflows) could spark a short squeeze.
✅ Bottom Line
Bitcoin’s current pullback is painful, but not out of the ordinary in a volatile macro climate. Key support around $82K will be critical. If this zone holds and institutional interest returns, there could be room for a recovery. However, a breakdown could trigger a steeper correction as long-term holders unwind.
If you like, I can run a chart-based technical forecast (with probability ranges) for BTC over the next 1–3 months — do you want me to do that?
$BTC
$BTC #BTCVolatility #CryptoIn401k #BTC90kBreakingPoint
8
27
·
--
Hier ist eine kurze, aktuelle Analyse von Bitcoin (BTC) zum 21. November 2025:
📉 Marktüberblick & Technische Daten
Bitcoin ist kurzfristig unter $90.000 gefallen und hat einen ~7-Monats-Tiefstand von etwa $86.300 erreicht, bevor es wieder auf etwa $88.000 anstieg.
Diese Bewegung hat einen Großteil der Gewinne von 2025 ausgelöscht, mit über $1 Billion an Marktkapitalisierung, die vom Kryptomarkt gelöscht wurden.
On-Chain-Daten deuten auf einen „Leverage Flush“ hin: Eine große Anzahl von Long-Positionen wurde liquidiert.
Laut technischen Analysten testet Bitcoin nun eine kritische langfristige Unterstützungstrendlinie, die bis Anfang 2023 zurückreicht.
🔍 Schlüsselrisiken & Katalysatoren
Death Cross Risiko: Analysten warnen, dass Bitcoin ein „Death Cross“ bilden könnte — wenn der 50-Tage-Durchschnitt unter den 200-Tage-Durchschnitt fällt. Das signalisiert oft weiteres Abwärtspotenzial.
Makro Druck: Bedenken über Zinssenkungen in den USA und schwache makroökonomische Stimmung belasten Risikoanlagen, einschließlich Bitcoin.
ETF-Abflüsse: Die institutionelle Investition über Spot Bitcoin ETFs hat Berichten zufolge nachgelassen, was zu einem Abwärtsdruck beiträgt.
📈 Mögliche Szenarien & Ausblick
Bärischer Basisfall (55% Wahrscheinlichkeit): BTC schafft es nicht, $94K zurückzugewinnen, bricht nach unten, möglicherweise schließt der November bei etwa $78K–$84K.
Stabilisierung (30% Wahrscheinlichkeit): BTC erholt sich auf $92K–$96K und konsolidiert sich, während die makroökonomischen Risiken nachlassen.
Short Squeeze Rückprall (15% Wahrscheinlichkeit): Eine bullische Überraschung (z.B. dovish Fed, große ETF-Zuflüsse) könnte einen scharfen Rückprall über $100K auslösen.
KI-basierte Modelle deuten auch darauf hin, dass Bitcoin unter $110K gehandelt werden könnte, es sei denn, es gibt einen neuen Katalysator.
✅ Fazit
Bitcoin steht unter erheblichem kurzfristigem Druck und sieht sich sowohl technischen als auch makroökonomischen Gegenwinden gegenüber. Aber es ist kein gerader Crash — wir könnten in naher Zukunft einen Handel innerhalb einer Spanne sehen, mit dem Potenzial für eine Erholung, wenn sich die Märkte stabilisieren oder die Risikobereitschaft zurückkehrt.
Wenn Sie möchten, kann ich eine detaillierte On-Chain + technische Analyse (mit projizierten Szenarien für die nächsten 1–3 Monate) durchführen. Möchten Sie, dass ich das tue?
$BTC #BTCVolatility #USJobsData #BTC90kBreakingPoint #USStocksForecast2026
Hier ist eine kurze, aktuelle Analyse von Bitcoin (BTC) zum 21. November 2025:
📉 Marktüberblick & Technische Daten
Bitcoin ist kurzfristig unter $90.000 gefallen und hat einen ~7-Monats-Tiefstand von etwa $86.300 erreicht, bevor es wieder auf etwa $88.000 anstieg.
Diese Bewegung hat einen Großteil der Gewinne von 2025 ausgelöscht, mit über $1 Billion an Marktkapitalisierung, die vom Kryptomarkt gelöscht wurden.
On-Chain-Daten deuten auf einen „Leverage Flush“ hin: Eine große Anzahl von Long-Positionen wurde liquidiert.
Laut technischen Analysten testet Bitcoin nun eine kritische langfristige Unterstützungstrendlinie, die bis Anfang 2023 zurückreicht.
🔍 Schlüsselrisiken & Katalysatoren
Death Cross Risiko: Analysten warnen, dass Bitcoin ein „Death Cross“ bilden könnte — wenn der 50-Tage-Durchschnitt unter den 200-Tage-Durchschnitt fällt. Das signalisiert oft weiteres Abwärtspotenzial.
Makro Druck: Bedenken über Zinssenkungen in den USA und schwache makroökonomische Stimmung belasten Risikoanlagen, einschließlich Bitcoin.
ETF-Abflüsse: Die institutionelle Investition über Spot Bitcoin ETFs hat Berichten zufolge nachgelassen, was zu einem Abwärtsdruck beiträgt.
📈 Mögliche Szenarien & Ausblick
Bärischer Basisfall (55% Wahrscheinlichkeit): BTC schafft es nicht, $94K zurückzugewinnen, bricht nach unten, möglicherweise schließt der November bei etwa $78K–$84K.
Stabilisierung (30% Wahrscheinlichkeit): BTC erholt sich auf $92K–$96K und konsolidiert sich, während die makroökonomischen Risiken nachlassen.
Short Squeeze Rückprall (15% Wahrscheinlichkeit): Eine bullische Überraschung (z.B. dovish Fed, große ETF-Zuflüsse) könnte einen scharfen Rückprall über $100K auslösen.
KI-basierte Modelle deuten auch darauf hin, dass Bitcoin unter $110K gehandelt werden könnte, es sei denn, es gibt einen neuen Katalysator.
✅ Fazit
Bitcoin steht unter erheblichem kurzfristigem Druck und sieht sich sowohl technischen als auch makroökonomischen Gegenwinden gegenüber. Aber es ist kein gerader Crash — wir könnten in naher Zukunft einen Handel innerhalb einer Spanne sehen, mit dem Potenzial für eine Erholung, wenn sich die Märkte stabilisieren oder die Risikobereitschaft zurückkehrt.
Wenn Sie möchten, kann ich eine detaillierte On-Chain + technische Analyse (mit projizierten Szenarien für die nächsten 1–3 Monate) durchführen. Möchten Sie, dass ich das tue?
$BTC #BTCVolatility #USJobsData #BTC90kBreakingPoint #USStocksForecast2026
📉 Marktüberblick & Technische Daten
Bitcoin ist kurzfristig unter $90.000 gefallen und hat einen ~7-Monats-Tiefstand von etwa $86.300 erreicht, bevor es wieder auf etwa $88.000 anstieg.
Diese Bewegung hat einen Großteil der Gewinne von 2025 ausgelöscht, mit über $1 Billion an Marktkapitalisierung, die vom Kryptomarkt gelöscht wurden.
On-Chain-Daten deuten auf einen „Leverage Flush“ hin: Eine große Anzahl von Long-Positionen wurde liquidiert.
Laut technischen Analysten testet Bitcoin nun eine kritische langfristige Unterstützungstrendlinie, die bis Anfang 2023 zurückreicht.
🔍 Schlüsselrisiken & Katalysatoren
Death Cross Risiko: Analysten warnen, dass Bitcoin ein „Death Cross“ bilden könnte — wenn der 50-Tage-Durchschnitt unter den 200-Tage-Durchschnitt fällt. Das signalisiert oft weiteres Abwärtspotenzial.
Makro Druck: Bedenken über Zinssenkungen in den USA und schwache makroökonomische Stimmung belasten Risikoanlagen, einschließlich Bitcoin.
ETF-Abflüsse: Die institutionelle Investition über Spot Bitcoin ETFs hat Berichten zufolge nachgelassen, was zu einem Abwärtsdruck beiträgt.
📈 Mögliche Szenarien & Ausblick
Bärischer Basisfall (55% Wahrscheinlichkeit): BTC schafft es nicht, $94K zurückzugewinnen, bricht nach unten, möglicherweise schließt der November bei etwa $78K–$84K.
Stabilisierung (30% Wahrscheinlichkeit): BTC erholt sich auf $92K–$96K und konsolidiert sich, während die makroökonomischen Risiken nachlassen.
Short Squeeze Rückprall (15% Wahrscheinlichkeit): Eine bullische Überraschung (z.B. dovish Fed, große ETF-Zuflüsse) könnte einen scharfen Rückprall über $100K auslösen.
KI-basierte Modelle deuten auch darauf hin, dass Bitcoin unter $110K gehandelt werden könnte, es sei denn, es gibt einen neuen Katalysator.
✅ Fazit
Bitcoin steht unter erheblichem kurzfristigem Druck und sieht sich sowohl technischen als auch makroökonomischen Gegenwinden gegenüber. Aber es ist kein gerader Crash — wir könnten in naher Zukunft einen Handel innerhalb einer Spanne sehen, mit dem Potenzial für eine Erholung, wenn sich die Märkte stabilisieren oder die Risikobereitschaft zurückkehrt.
Wenn Sie möchten, kann ich eine detaillierte On-Chain + technische Analyse (mit projizierten Szenarien für die nächsten 1–3 Monate) durchführen. Möchten Sie, dass ich das tue?
$BTC #BTCVolatility #USJobsData #BTC90kBreakingPoint #USStocksForecast2026

6
287
Anmelden und weiter Inhalte entdecken
Krypto-Nutzer weltweit auf Binance Square kennenlernen
⚡️ Bleib in Sachen Krypto stets am Puls.
💬 Die weltgrößte Kryptobörse vertraut darauf.
👍 Erhalte verlässliche Einblicke von verifizierten Creators.
E-Mail-Adresse/Telefonnummer
Trendthemen
BTCBreaks80K
166,951 Aufrufe
2,712 Kommentare
🚨₿ $BTC SICHERT $80K ZURÜCK — ABER DER ECHTE KAMPF BEGINNT JETZT! 🔥👀
#Bitcoin hat die Marke von $80.000 überschritten und erreicht in letzter Zeit rund $80.703, während sich die Markstimmung erholte — trotz Zinsschritten und regulatorischer Bedenken.
MarketWatch
+1
💥 AUSBRUCH ODER FALLENSTELLER?
Die $80K-Marke ist nun ein entscheidender Bereich, den Trader im Blick haben sollten. Starke Anschlusskäufe könnten den Schwung tragen, während Gewinnmitnahmen, Leverage und makroökonomische Unsicherheit scharfe Richtungswechsel auslösen könnten.
🌊 DIE WELLENWIRKUNG:
₿ BCTC-Momentum könnte das Sentiment bei ETH und Altcoins beeinflussen, aber ein breiter Rally ist nicht garantiert.
🎯 DIE GROẞE FRAGE: Bereitet sich Bitcoin auf seinen nächsten großen Move vor — oder verlangt der Markt erst einmal eine tiefere Korrektur?
🔥 VERFOLGE NICHT DIE KERZE — BEOBACHTE VOLUMEN, LIQUIDITÄT & MARKTSTRUKTUR!
👑 MFI CRYPTO 🚀
💬 STEIGT BTC ÜBER $85K ALS NÄCHSTES? ODER ÜBERRASCHENDER RÜCKSETZER?
#Bitcoin #BTC #Crypto #Altcoins #Ethereum #Trading #Binance #MFiCrypto
#btcbreaks80k
MFI crypto
·5 Likes
·2.8k Aufrufe
比特币突破8万
114,846 Aufrufe
343 Kommentare
BitcoinMarketCapTopsTesla
4,984 Aufrufe
254 Kommentare