

AruStresso
50 Beiträge

AruStresso
Melden
Nutzer blockieren
Trade eröffnen

SOL Halter
Regelmäßiger Trader
5.4 Jahre
150 Following
34 Follower
8 Like gegeben
Beiträge
Portfolio
Alle
Zitierungen
·
--
Bullisch
Übersetzung ansehen
**$SOL Latest News — Bullish Catalysts Piling Up**
**Biggest mover: Forward Industries (FWDI)**
The Nasdaq-listed company disclosed it now holds **8.5 million SOL** (~1.4% of circulating supply, worth over 1 billion USDT), adding **949,000 SOL** last quarter at an average cost of ~83 USDT. Roughly 13% of its quarterly revenue came from SOL. This is the single largest corporate SOL treasury on record.
**Spot ETF inflows hit all-time high**
US Solana spot ETFs pulled in **~188 million USDT** in the week ending Sep 28 — a record weekly inflow. Bitwise's BSOL alone took 128 million USDT (68% of total).
**Fiserv + US banks go live on Solana**
Payment giant Fiserv launched its digital asset platform on Solana, with **90+ banks and credit unions** in North Dakota now using the Solana-based "Roughrider Coin" for interbank settlement. This marks Solana's first production-grade integration into US banking infrastructure.
**Takeaway:** All recent headlines are bullish — institutional buying (Forward + ETFs) and real-world adoption (bank stablecoins). Price is currently consolidating around 120 USDT after hitting 124.90 resistance. Whether the news can push a breakout above 125 USDT is the key near-term question. For reference only — final call is yours.
{spot}(SOLUSDT)
#sol
**$SOL Latest News — Bullish Catalysts Piling Up**
**Biggest mover: Forward Industries (FWDI)**
The Nasdaq-listed company disclosed it now holds **8.5 million SOL** (~1.4% of circulating supply, worth over 1 billion USDT), adding **949,000 SOL** last quarter at an average cost of ~83 USDT. Roughly 13% of its quarterly revenue came from SOL. This is the single largest corporate SOL treasury on record.
**Spot ETF inflows hit all-time high**
US Solana spot ETFs pulled in **~188 million USDT** in the week ending Sep 28 — a record weekly inflow. Bitwise's BSOL alone took 128 million USDT (68% of total).
**Fiserv + US banks go live on Solana**
Payment giant Fiserv launched its digital asset platform on Solana, with **90+ banks and credit unions** in North Dakota now using the Solana-based "Roughrider Coin" for interbank settlement. This marks Solana's first production-grade integration into US banking infrastructure.
**Takeaway:** All recent headlines are bullish — institutional buying (Forward + ETFs) and real-world adoption (bank stablecoins). Price is currently consolidating around 120 USDT after hitting 124.90 resistance. Whether the news can push a breakout above 125 USDT is the key near-term question. For reference only — final call is yours.
#sol
**Biggest mover: Forward Industries (FWDI)**
The Nasdaq-listed company disclosed it now holds **8.5 million SOL** (~1.4% of circulating supply, worth over 1 billion USDT), adding **949,000 SOL** last quarter at an average cost of ~83 USDT. Roughly 13% of its quarterly revenue came from SOL. This is the single largest corporate SOL treasury on record.
**Spot ETF inflows hit all-time high**
US Solana spot ETFs pulled in **~188 million USDT** in the week ending Sep 28 — a record weekly inflow. Bitwise's BSOL alone took 128 million USDT (68% of total).
**Fiserv + US banks go live on Solana**
Payment giant Fiserv launched its digital asset platform on Solana, with **90+ banks and credit unions** in North Dakota now using the Solana-based "Roughrider Coin" for interbank settlement. This marks Solana's first production-grade integration into US banking infrastructure.
**Takeaway:** All recent headlines are bullish — institutional buying (Forward + ETFs) and real-world adoption (bank stablecoins). Price is currently consolidating around 120 USDT after hitting 124.90 resistance. Whether the news can push a breakout above 125 USDT is the key near-term question. For reference only — final call is yours.
#sol
30
·
--
Bullisch
$SOL
**Kerze & Indikator-Lesung**
- RSI6 bei 81,32 befindet sich tief im überkauften Bereich — das Risiko für kurzfristige Rücksetzer ist erhöht
- Der Kurs ist etwa ~28% vom Tief bei 95,90 gestiegen und testet nun erneut das Swing-High bei 124,90
- Die jüngsten 4h-Kerzen zeigen starke bullische Dynamik, aber die obere Lunte bei 124,90 markiert klaren Verkaufsdruck
**Wichtige Levels**
- Widerstand: 124,90 (lokales Hoch), dann 130 (psychologische Marke)
- Unterstützung: 117,65 (jüngstes Tief), 110,40 (vorherige Ausbruchsbasis)
**Ausblick für morgen (nur zur Orientierung)**
- **Tendenz**: Bullisch kurzfristig, aber überkauft — erwarte entweder eine Ausbruchsfortsetzung oder eine Konsolidierung mit Rücksetzer
- **Long-Einstiegszone**: 118–120 (Pullback-Unterstützung)
- **Stop-Loss**: 116 (unter dem jüngsten Swing-Tief)
- **Ziel 1**: 125 (erneuter Test des Hochs)
- **Ziel 2**: 130 (psychologisch runde Marke)
Risikohinweis: RSI überkauft bedeutet, dass scharfe Fehlausbrüche möglich sind. Positionsgröße steuern.
#sol #btc #eth #ltc #gram
{spot}(SOLUSDT)
Deine Wahl für morgen?
$SOL
**Kerze & Indikator-Lesung**
- RSI6 bei 81,32 befindet sich tief im überkauften Bereich — das Risiko für kurzfristige Rücksetzer ist erhöht
- Der Kurs ist etwa ~28% vom Tief bei 95,90 gestiegen und testet nun erneut das Swing-High bei 124,90
- Die jüngsten 4h-Kerzen zeigen starke bullische Dynamik, aber die obere Lunte bei 124,90 markiert klaren Verkaufsdruck
**Wichtige Levels**
- Widerstand: 124,90 (lokales Hoch), dann 130 (psychologische Marke)
- Unterstützung: 117,65 (jüngstes Tief), 110,40 (vorherige Ausbruchsbasis)
**Ausblick für morgen (nur zur Orientierung)**
- **Tendenz**: Bullisch kurzfristig, aber überkauft — erwarte entweder eine Ausbruchsfortsetzung oder eine Konsolidierung mit Rücksetzer
- **Long-Einstiegszone**: 118–120 (Pullback-Unterstützung)
- **Stop-Loss**: 116 (unter dem jüngsten Swing-Tief)
- **Ziel 1**: 125 (erneuter Test des Hochs)
- **Ziel 2**: 130 (psychologisch runde Marke)
Risikohinweis: RSI überkauft bedeutet, dass scharfe Fehlausbrüche möglich sind. Positionsgröße steuern.
#sol #btc #eth #ltc #gram
Deine Wahl für morgen?
**Kerze & Indikator-Lesung**
- RSI6 bei 81,32 befindet sich tief im überkauften Bereich — das Risiko für kurzfristige Rücksetzer ist erhöht
- Der Kurs ist etwa ~28% vom Tief bei 95,90 gestiegen und testet nun erneut das Swing-High bei 124,90
- Die jüngsten 4h-Kerzen zeigen starke bullische Dynamik, aber die obere Lunte bei 124,90 markiert klaren Verkaufsdruck
**Wichtige Levels**
- Widerstand: 124,90 (lokales Hoch), dann 130 (psychologische Marke)
- Unterstützung: 117,65 (jüngstes Tief), 110,40 (vorherige Ausbruchsbasis)
**Ausblick für morgen (nur zur Orientierung)**
- **Tendenz**: Bullisch kurzfristig, aber überkauft — erwarte entweder eine Ausbruchsfortsetzung oder eine Konsolidierung mit Rücksetzer
- **Long-Einstiegszone**: 118–120 (Pullback-Unterstützung)
- **Stop-Loss**: 116 (unter dem jüngsten Swing-Tief)
- **Ziel 1**: 125 (erneuter Test des Hochs)
- **Ziel 2**: 130 (psychologisch runde Marke)
Risikohinweis: RSI überkauft bedeutet, dass scharfe Fehlausbrüche möglich sind. Positionsgröße steuern.
#sol #btc #eth #ltc #gram
Deine Wahl für morgen?
Bullish
Bearish
13 Stunde(n) übrig
141
·
--
Bullisch
Übersetzung ansehen
**📊 Crypto Market Update — Oct 2, 2026**
**$BTC : +2.77% on the day, trading at ~86,433 USDT**
BTC opened the month with a strong push, climbing from ~84,100 to a high of 86,884 before consolidating around 86,400. The bulk of the move happened in the Asian session, with volume spiking during the 12:00 UTC+8 candle. Short-term momentum is bullish but approaching overbought territory — key support sits near 85,000, resistance around 87,000.
**$ETH : +2.50% on the day, trading at ~2,748 USDT**
ETH tracked BTC higher, moving from ~2,680 to 2,777 intraday before pulling back slightly. Relative strength vs BTC is roughly in line — no major outperformance or divergence yet.
**🔥 Top headlines moving markets today:**
1. **Bitget hack update — ~387.5M USDT stolen, attacker consolidating into $BTC**
The September 25 exploit (zero-day in third-party security tool) has the attacker converting stolen stablecoins and XAUt into ETH/AVAX, then bridging to BTC via THORChain and Chainflip, and using CoinJoin to mix funds. Over 342M USDT remains under attacker control. Initial clues point to North Korean hackers. This adds near-term sell-side risk if the attacker offloads BTC.
2. **Ethereum EIP-8363 withdrawn — no staking reward burn in Hegotá upgrade**
The proposal that would have burned validator rewards as staking supply grew has been pulled by its author. Staking yields stay at current levels (~2.6% net), which means less deflationary pressure on ETH supply than the market had priced in. Slightly bearish for ETH and LDO-type staking tokens.
**💡 Quick take:**
October is off to a green start, but two overhangs are worth watching — the Bitget hacker's BTC holdings (potential dump risk) and the EIP-8363 withdrawal (removing a supply-burn catalyst for ETH). Stay nimble, keep an eye on the 85,000 level on BTC — a break below could signal a deeper pullback.
*Data as of 19:12 UTC+8, Oct 2. Not financial advice — DYOR.*
#btc #eth #sol
{spot}(BTCUSDT)
{spot}(ETHUSDT)
{spot}(SOLUSDT)
**📊 Crypto Market Update — Oct 2, 2026**
**$BTC : +2.77% on the day, trading at ~86,433 USDT**
BTC opened the month with a strong push, climbing from ~84,100 to a high of 86,884 before consolidating around 86,400. The bulk of the move happened in the Asian session, with volume spiking during the 12:00 UTC+8 candle. Short-term momentum is bullish but approaching overbought territory — key support sits near 85,000, resistance around 87,000.
**$ETH : +2.50% on the day, trading at ~2,748 USDT**
ETH tracked BTC higher, moving from ~2,680 to 2,777 intraday before pulling back slightly. Relative strength vs BTC is roughly in line — no major outperformance or divergence yet.
**🔥 Top headlines moving markets today:**
1. **Bitget hack update — ~387.5M USDT stolen, attacker consolidating into $BTC **
The September 25 exploit (zero-day in third-party security tool) has the attacker converting stolen stablecoins and XAUt into ETH/AVAX, then bridging to BTC via THORChain and Chainflip, and using CoinJoin to mix funds. Over 342M USDT remains under attacker control. Initial clues point to North Korean hackers. This adds near-term sell-side risk if the attacker offloads BTC.
2. **Ethereum EIP-8363 withdrawn — no staking reward burn in Hegotá upgrade**
The proposal that would have burned validator rewards as staking supply grew has been pulled by its author. Staking yields stay at current levels (~2.6% net), which means less deflationary pressure on ETH supply than the market had priced in. Slightly bearish for ETH and LDO-type staking tokens.
**💡 Quick take:**
October is off to a green start, but two overhangs are worth watching — the Bitget hacker's BTC holdings (potential dump risk) and the EIP-8363 withdrawal (removing a supply-burn catalyst for ETH). Stay nimble, keep an eye on the 85,000 level on BTC — a break below could signal a deeper pullback.
*Data as of 19:12 UTC+8, Oct 2. Not financial advice — DYOR.*
#btc #eth #sol
**$BTC : +2.77% on the day, trading at ~86,433 USDT**
BTC opened the month with a strong push, climbing from ~84,100 to a high of 86,884 before consolidating around 86,400. The bulk of the move happened in the Asian session, with volume spiking during the 12:00 UTC+8 candle. Short-term momentum is bullish but approaching overbought territory — key support sits near 85,000, resistance around 87,000.
**$ETH : +2.50% on the day, trading at ~2,748 USDT**
ETH tracked BTC higher, moving from ~2,680 to 2,777 intraday before pulling back slightly. Relative strength vs BTC is roughly in line — no major outperformance or divergence yet.
**🔥 Top headlines moving markets today:**
1. **Bitget hack update — ~387.5M USDT stolen, attacker consolidating into $BTC **
The September 25 exploit (zero-day in third-party security tool) has the attacker converting stolen stablecoins and XAUt into ETH/AVAX, then bridging to BTC via THORChain and Chainflip, and using CoinJoin to mix funds. Over 342M USDT remains under attacker control. Initial clues point to North Korean hackers. This adds near-term sell-side risk if the attacker offloads BTC.
2. **Ethereum EIP-8363 withdrawn — no staking reward burn in Hegotá upgrade**
The proposal that would have burned validator rewards as staking supply grew has been pulled by its author. Staking yields stay at current levels (~2.6% net), which means less deflationary pressure on ETH supply than the market had priced in. Slightly bearish for ETH and LDO-type staking tokens.
**💡 Quick take:**
October is off to a green start, but two overhangs are worth watching — the Bitget hacker's BTC holdings (potential dump risk) and the EIP-8363 withdrawal (removing a supply-burn catalyst for ETH). Stay nimble, keep an eye on the 85,000 level on BTC — a break below could signal a deeper pullback.
*Data as of 19:12 UTC+8, Oct 2. Not financial advice — DYOR.*
#btc #eth #sol
85
·
--
Übersetzung ansehen
What do you think about the market sentiment today?
$BTC $ETH $SOL
What do you think about the market sentiment today?
$BTC $ETH $SOL
$BTC $ETH $SOL
Bullish
Bearish
10 Stunde(n) übrig
363
·
--
Bullisch
$LTC
- **Einstiegszone**: 68,0–69,5 (Rücksetzer auf das jüngste Ausbruchsniveau / deine Kauf-Marker-Zone)
- **Stop-Loss**: ~65,5 (unterhalb des jüngsten Swing-Tiefs)
- **Ziel 1**: 74,99 (vorheriges Hoch)
- **Ziel 2**: 78–80 (nächste Widerstandszone, falls der Ausbruch bestätigt)
- **Bullisches Szenario**: RSI dreht nach oben aus dem mittleren Bereich, starker Bounce von ca. 64er-Tief, Rückeroberung des 68,52-Niveaus auf 4h
Risikomanagement entsprechend.
#ltc
{spot}(LTCUSDT)
$LTC
- **Einstiegszone**: 68,0–69,5 (Rücksetzer auf das jüngste Ausbruchsniveau / deine Kauf-Marker-Zone)
- **Stop-Loss**: ~65,5 (unterhalb des jüngsten Swing-Tiefs)
- **Ziel 1**: 74,99 (vorheriges Hoch)
- **Ziel 2**: 78–80 (nächste Widerstandszone, falls der Ausbruch bestätigt)
- **Bullisches Szenario**: RSI dreht nach oben aus dem mittleren Bereich, starker Bounce von ca. 64er-Tief, Rückeroberung des 68,52-Niveaus auf 4h
Risikomanagement entsprechend.
#ltc
- **Einstiegszone**: 68,0–69,5 (Rücksetzer auf das jüngste Ausbruchsniveau / deine Kauf-Marker-Zone)
- **Stop-Loss**: ~65,5 (unterhalb des jüngsten Swing-Tiefs)
- **Ziel 1**: 74,99 (vorheriges Hoch)
- **Ziel 2**: 78–80 (nächste Widerstandszone, falls der Ausbruch bestätigt)
- **Bullisches Szenario**: RSI dreht nach oben aus dem mittleren Bereich, starker Bounce von ca. 64er-Tief, Rückeroberung des 68,52-Niveaus auf 4h
Risikomanagement entsprechend.
#ltc
103
·
--
Bullisch
Übersetzung ansehen
$GRAM
Bullish Entry & Target
Entry zone: 1.505 – 1.530 (recent swing low area, where the "B" buy signal sits; price has been building higher lows off this base)
Stop-loss: 1.470 (below the recent consolidation low, invalidates the rebound structure)
Target 1: 1.614 (prior resistance / "S" sell signal level, first major hurdle)
Target 2: 1.724 (the spike high, ultimate resistance on this 4h chart)
Why it's bullish here
Price retraced ~20% from the 1.724 peak and is now bouncing off the 1.50 zone with higher lows
RSI (6/12/24 all ~54–58) is climbing back above midline — momentum turning up, not yet overbought
4h structure: sharp rally → orderly pullback → recovery attempt = classic continuation setup
Risk note
If 1.470 breaks, the pullback deepens and the bullish thesis weakens; the 1.724 spike high is a strong rejection zone, so take partial profits near 1.60 first.
#gram
{spot}(GRAMUSDT)
$GRAM
Bullish Entry & Target
Entry zone: 1.505 – 1.530 (recent swing low area, where the "B" buy signal sits; price has been building higher lows off this base)
Stop-loss: 1.470 (below the recent consolidation low, invalidates the rebound structure)
Target 1: 1.614 (prior resistance / "S" sell signal level, first major hurdle)
Target 2: 1.724 (the spike high, ultimate resistance on this 4h chart)
Why it's bullish here
Price retraced ~20% from the 1.724 peak and is now bouncing off the 1.50 zone with higher lows
RSI (6/12/24 all ~54–58) is climbing back above midline — momentum turning up, not yet overbought
4h structure: sharp rally → orderly pullback → recovery attempt = classic continuation setup
Risk note
If 1.470 breaks, the pullback deepens and the bullish thesis weakens; the 1.724 spike high is a strong rejection zone, so take partial profits near 1.60 first.
#gram
Bullish Entry & Target
Entry zone: 1.505 – 1.530 (recent swing low area, where the "B" buy signal sits; price has been building higher lows off this base)
Stop-loss: 1.470 (below the recent consolidation low, invalidates the rebound structure)
Target 1: 1.614 (prior resistance / "S" sell signal level, first major hurdle)
Target 2: 1.724 (the spike high, ultimate resistance on this 4h chart)
Why it's bullish here
Price retraced ~20% from the 1.724 peak and is now bouncing off the 1.50 zone with higher lows
RSI (6/12/24 all ~54–58) is climbing back above midline — momentum turning up, not yet overbought
4h structure: sharp rally → orderly pullback → recovery attempt = classic continuation setup
Risk note
If 1.470 breaks, the pullback deepens and the bullish thesis weakens; the 1.724 spike high is a strong rejection zone, so take partial profits near 1.60 first.
#gram
275
·
--
Bullisch
$ETH
- **Einstiegszone**: 2.690–2.750 (Pullback zum jüngsten Ausbruch / 4h-Support)
- **Sofortiges Ziel**: 2.807 (vorheriges Swing-High)
- **Erweitertes Ziel**: 2.880–2.900 (nächster Widerstandsbereich, falls der Ausbruch hält)
- **Invalidierung**: unter 2.650 (Bruch des jüngsten Konsolidierungs-Tiefs)
- **Hinweis**: RSI6 bei 72,73 nähert sich im 4h-Chart dem Overbought-Bereich — hier hinterherzujagen birgt ein höheres Risiko; warte auf einen kleinen Pullback für ein besseres R:R.
#eth #ETH
$ETH
- **Einstiegszone**: 2.690–2.750 (Pullback zum jüngsten Ausbruch / 4h-Support)
- **Sofortiges Ziel**: 2.807 (vorheriges Swing-High)
- **Erweitertes Ziel**: 2.880–2.900 (nächster Widerstandsbereich, falls der Ausbruch hält)
- **Invalidierung**: unter 2.650 (Bruch des jüngsten Konsolidierungs-Tiefs)
- **Hinweis**: RSI6 bei 72,73 nähert sich im 4h-Chart dem Overbought-Bereich — hier hinterherzujagen birgt ein höheres Risiko; warte auf einen kleinen Pullback für ein besseres R:R.
#eth #ETH
- **Einstiegszone**: 2.690–2.750 (Pullback zum jüngsten Ausbruch / 4h-Support)
- **Sofortiges Ziel**: 2.807 (vorheriges Swing-High)
- **Erweitertes Ziel**: 2.880–2.900 (nächster Widerstandsbereich, falls der Ausbruch hält)
- **Invalidierung**: unter 2.650 (Bruch des jüngsten Konsolidierungs-Tiefs)
- **Hinweis**: RSI6 bei 72,73 nähert sich im 4h-Chart dem Overbought-Bereich — hier hinterherzujagen birgt ein höheres Risiko; warte auf einen kleinen Pullback für ein besseres R:R.
#eth #ETH
52
·
--
Bullisch
Übersetzung ansehen
$BTC
- **Entry zone**: 84,800–85,200 (4h breakout retest of prior resistance-turned-support)
- **Target 1**: 86,900 (current 24h high)
- **Target 2**: 88,500 (next major resistance)
- **Stop loss**: Below 83,600 (invalidates the 4h breakout structure)
{spot}(BTCUSDT)
#btc
$BTC
- **Entry zone**: 84,800–85,200 (4h breakout retest of prior resistance-turned-support)
- **Target 1**: 86,900 (current 24h high)
- **Target 2**: 88,500 (next major resistance)
- **Stop loss**: Below 83,600 (invalidates the 4h breakout structure)
#btc
- **Entry zone**: 84,800–85,200 (4h breakout retest of prior resistance-turned-support)
- **Target 1**: 86,900 (current 24h high)
- **Target 2**: 88,500 (next major resistance)
- **Stop loss**: Below 83,600 (invalidates the 4h breakout structure)
#btc
1
82
·
--
**Bullisches Setup auf $SOL 1H:**
- **Einstiegszone**: 120.5 – 121.5 (Pullback auf das kürzlich überbrückte Niveau)
- **Ziel 1**: 124.9 (vorheriges Swing-High)
- **Ziel 2**: 128+ (Extension, falls 124.9 durchbricht)
- **Invalidierung**: Unter 118 (letztes Swing-Tief)
RSI steigt, aber noch nicht überkauft, es ist noch Luft nach oben.
**Bullisches Setup auf $SOL 1H:**
- **Einstiegszone**: 120.5 – 121.5 (Pullback auf das kürzlich überbrückte Niveau)
- **Ziel 1**: 124.9 (vorheriges Swing-High)
- **Ziel 2**: 128+ (Extension, falls 124.9 durchbricht)
- **Invalidierung**: Unter 118 (letztes Swing-Tief)
RSI steigt, aber noch nicht überkauft, es ist noch Luft nach oben.
- **Einstiegszone**: 120.5 – 121.5 (Pullback auf das kürzlich überbrückte Niveau)
- **Ziel 1**: 124.9 (vorheriges Swing-High)
- **Ziel 2**: 128+ (Extension, falls 124.9 durchbricht)
- **Invalidierung**: Unter 118 (letztes Swing-Tief)
RSI steigt, aber noch nicht überkauft, es ist noch Luft nach oben.
113
·
--
Krypto-Markt-Update | 1. Okt 📊
$BTC ~$83,5K: abgewiesen nahe $85K, mit $83K als entscheidender Unterstützung
$ETH ~$2.680: hält sich, nachdem das beste Quartal aller Zeiten erreicht wurde
$SOL ~$118: schwächstes der drei heute, um etwa 3–4% gefallen
Q3 endete stark, aber die Renditen sind erhöht und alle Blicke richten sich auf den NFP-Freitag. Ein Ausbruch über $85,5K eröffnet $90K, während ein Verlust von $83K $80K in den Fokus rückt.
Geduld statt FOMO. 🎯
Keine Finanzberatung. Informiere dich selbst (DYOR).
#Bitcoin #Ethereum #Solana #BinanceSquare
{spot}(BTCUSDT)
{spot}(ETHUSDT)
{spot}(SOLUSDT)
Krypto-Markt-Update | 1. Okt 📊
$BTC ~$83,5K: abgewiesen nahe $85K, mit $83K als entscheidender Unterstützung
$ETH ~$2.680: hält sich, nachdem das beste Quartal aller Zeiten erreicht wurde
$SOL ~$118: schwächstes der drei heute, um etwa 3–4% gefallen
Q3 endete stark, aber die Renditen sind erhöht und alle Blicke richten sich auf den NFP-Freitag. Ein Ausbruch über $85,5K eröffnet $90K, während ein Verlust von $83K $80K in den Fokus rückt.
Geduld statt FOMO. 🎯
Keine Finanzberatung. Informiere dich selbst (DYOR).
#Bitcoin #Ethereum #Solana #BinanceSquare
$BTC ~$83,5K: abgewiesen nahe $85K, mit $83K als entscheidender Unterstützung
$ETH ~$2.680: hält sich, nachdem das beste Quartal aller Zeiten erreicht wurde
$SOL ~$118: schwächstes der drei heute, um etwa 3–4% gefallen
Q3 endete stark, aber die Renditen sind erhöht und alle Blicke richten sich auf den NFP-Freitag. Ein Ausbruch über $85,5K eröffnet $90K, während ein Verlust von $83K $80K in den Fokus rückt.
Geduld statt FOMO. 🎯
Keine Finanzberatung. Informiere dich selbst (DYOR).
#Bitcoin #Ethereum #Solana #BinanceSquare
85
·
--
$ETH
**Bullische Signale erkannt:**
- Die neuesten Kerzen zeigen eine starke grüne Erholung von ~2.660 Unterstützung, wobei RSI6/12/24 alle steigen (61,5 / 57,0 / 54,1) und es keine bärische Divergenz gibt — die kurzfristige Dynamik dreht nach oben.
- Der Kurs hielt die Unterstützungszone 2.627–2.660 zweimal aus (Sep 28 Tief, Sep 30 Retest) und bildete eine höhere Tief-Struktur — mittelfristig bullisches Signal.
**Wichtige Levels:**
- Widerstand: 2.748 (jüngstes Hoch) → 2.780+
- Unterstützung: 2.660 (unmittelbar) → 2.628 (stark)
**Ausblick:**
Die kurzfristige Tendenz ist bullisch. Wenn 2.748 durchbrochen wird, ist das nächste Ziel ~2.780–2.800. Risiko: Wenn 2.660 nicht gehalten wird, würde das die Setups ungültig machen. Letztlich liegt die Entscheidung bei dir.
{spot}(ETHUSDT)
$ETH
**Bullische Signale erkannt:**
- Die neuesten Kerzen zeigen eine starke grüne Erholung von ~2.660 Unterstützung, wobei RSI6/12/24 alle steigen (61,5 / 57,0 / 54,1) und es keine bärische Divergenz gibt — die kurzfristige Dynamik dreht nach oben.
- Der Kurs hielt die Unterstützungszone 2.627–2.660 zweimal aus (Sep 28 Tief, Sep 30 Retest) und bildete eine höhere Tief-Struktur — mittelfristig bullisches Signal.
**Wichtige Levels:**
- Widerstand: 2.748 (jüngstes Hoch) → 2.780+
- Unterstützung: 2.660 (unmittelbar) → 2.628 (stark)
**Ausblick:**
Die kurzfristige Tendenz ist bullisch. Wenn 2.748 durchbrochen wird, ist das nächste Ziel ~2.780–2.800. Risiko: Wenn 2.660 nicht gehalten wird, würde das die Setups ungültig machen. Letztlich liegt die Entscheidung bei dir.
**Bullische Signale erkannt:**
- Die neuesten Kerzen zeigen eine starke grüne Erholung von ~2.660 Unterstützung, wobei RSI6/12/24 alle steigen (61,5 / 57,0 / 54,1) und es keine bärische Divergenz gibt — die kurzfristige Dynamik dreht nach oben.
- Der Kurs hielt die Unterstützungszone 2.627–2.660 zweimal aus (Sep 28 Tief, Sep 30 Retest) und bildete eine höhere Tief-Struktur — mittelfristig bullisches Signal.
**Wichtige Levels:**
- Widerstand: 2.748 (jüngstes Hoch) → 2.780+
- Unterstützung: 2.660 (unmittelbar) → 2.628 (stark)
**Ausblick:**
Die kurzfristige Tendenz ist bullisch. Wenn 2.748 durchbrochen wird, ist das nächste Ziel ~2.780–2.800. Risiko: Wenn 2.660 nicht gehalten wird, würde das die Setups ungültig machen. Letztlich liegt die Entscheidung bei dir.
37
·
--
Übersetzung ansehen
$BTC
Candle Pattern Interpretation
Around 09-29 05:30 at 82,574 — Double Bottom / Swing Low — Bearish exhaustion, strong buying interest at the lows — Strong bullish signal
Around 10-01 04:30 at 85,640 — Long Upper Wick / Spike Rejection — Bulls pushed hard but failed to hold highs, profit-taking pressure — Bearish signal, medium strength
Latest candle at 83,916 — Bounce off mid-range support — Price recovering after dipping to ~83,200 area — Mild bullish signal
Conclusion & Trading Suggestions
Direction: Cautiously bullish — wait for confirmation
Entry zone: 83,200–83,500 (near short-term support)
Stop-loss: Below 82,500 (break of recent swing low invalidates the bullish setup)
Target 1: 84,800 (range resistance)
Target 2: 85,600 (recent high)
Risk reminder: The long upper wick at 85,640 indicates significant selling pressure above. If 83,200 support breaks, a retest of 82,500 is likely. Trade with proper position sizing — the final call is yours.
{spot}(BTCUSDT)
$BTC
Candle Pattern Interpretation
Around 09-29 05:30 at 82,574 — Double Bottom / Swing Low — Bearish exhaustion, strong buying interest at the lows — Strong bullish signal
Around 10-01 04:30 at 85,640 — Long Upper Wick / Spike Rejection — Bulls pushed hard but failed to hold highs, profit-taking pressure — Bearish signal, medium strength
Latest candle at 83,916 — Bounce off mid-range support — Price recovering after dipping to ~83,200 area — Mild bullish signal
Conclusion & Trading Suggestions
Direction: Cautiously bullish — wait for confirmation
Entry zone: 83,200–83,500 (near short-term support)
Stop-loss: Below 82,500 (break of recent swing low invalidates the bullish setup)
Target 1: 84,800 (range resistance)
Target 2: 85,600 (recent high)
Risk reminder: The long upper wick at 85,640 indicates significant selling pressure above. If 83,200 support breaks, a retest of 82,500 is likely. Trade with proper position sizing — the final call is yours.
Candle Pattern Interpretation
Around 09-29 05:30 at 82,574 — Double Bottom / Swing Low — Bearish exhaustion, strong buying interest at the lows — Strong bullish signal
Around 10-01 04:30 at 85,640 — Long Upper Wick / Spike Rejection — Bulls pushed hard but failed to hold highs, profit-taking pressure — Bearish signal, medium strength
Latest candle at 83,916 — Bounce off mid-range support — Price recovering after dipping to ~83,200 area — Mild bullish signal
Conclusion & Trading Suggestions
Direction: Cautiously bullish — wait for confirmation
Entry zone: 83,200–83,500 (near short-term support)
Stop-loss: Below 82,500 (break of recent swing low invalidates the bullish setup)
Target 1: 84,800 (range resistance)
Target 2: 85,600 (recent high)
Risk reminder: The long upper wick at 85,640 indicates significant selling pressure above. If 83,200 support breaks, a retest of 82,500 is likely. Trade with proper position sizing — the final call is yours.
54
·
--
Übersetzung ansehen
$ZRO
1. Candle Pattern Interpretation
09-25 low at 1.428 — Higher Low + Bullish Rejection — Bears exhausted, buyers stepped in — Strong signal
09-29 ~ 10-01 peak at 1.884 — Sharp Spike + Rejection Candle — Blow-off top, sellers took control — Strong bearish signal
Current zone 1.652 — Pullback to prior consolidation zone — Testing support from mid-range — Medium signal
RSI analysis: RSI6 at 35.32, RSI12 at 40.54, RSI24 at 46.65 — all three lines are declining from overbought territory and approaching oversold zone. RSI6 is nearing the 30-level which typically acts as a short-term bounce zone, but no bullish crossover has not formed yet — bearish momentum is fading but not yet reversed.
2. Support / Resistance Levels
Short-term resistance: 1.770 (recent rejection level)
Key resistance: 1.884 (recent high)
3. Comprehensive Technical Assessment
Price spiked from 1.428 to 1.884 (+32%) in a strong rally, then pulled back sharply to 1.652 (-12.3% from peak). RSI across all periods is cooling off from overbought. The pullback is retesting the mid-range consolidation zone. Volume during the pullback. Overall trend: short-term pullback within a medium-term uptrend. Bull-bear balance: short-term bearish momentum dominant, but approaching a potential support bounce zone.
4. Conclusion & Trading Suggestions
4-hour bullish case for ZRO:
If this zone holds, a bounce toward 1.75–1.80 is plausible in the next 4 hours.
Direction: Wait for confirmation (bullish bounce setup forming
Entry zone: 1.60–1.65 (if support holds with a bullish candle close above 1.65
Stop-loss: Below 1.58 (break of 24h low)
Target 1: 1.75, Target 2: 1.82
Risk reminder: The recent sharp rejection from 1.884 shows strong selling pressure. If 1.62 breaks decisively, the pullback could extend to 1.54 or lower. The final call is yours.
Note: This is technical analysis is for reference only and not financial advice. Always do your own research.
{spot}(ZROUSDT)
$ZRO
1. Candle Pattern Interpretation
09-25 low at 1.428 — Higher Low + Bullish Rejection — Bears exhausted, buyers stepped in — Strong signal
09-29 ~ 10-01 peak at 1.884 — Sharp Spike + Rejection Candle — Blow-off top, sellers took control — Strong bearish signal
Current zone 1.652 — Pullback to prior consolidation zone — Testing support from mid-range — Medium signal
RSI analysis: RSI6 at 35.32, RSI12 at 40.54, RSI24 at 46.65 — all three lines are declining from overbought territory and approaching oversold zone. RSI6 is nearing the 30-level which typically acts as a short-term bounce zone, but no bullish crossover has not formed yet — bearish momentum is fading but not yet reversed.
2. Support / Resistance Levels
Short-term resistance: 1.770 (recent rejection level)
Key resistance: 1.884 (recent high)
3. Comprehensive Technical Assessment
Price spiked from 1.428 to 1.884 (+32%) in a strong rally, then pulled back sharply to 1.652 (-12.3% from peak). RSI across all periods is cooling off from overbought. The pullback is retesting the mid-range consolidation zone. Volume during the pullback. Overall trend: short-term pullback within a medium-term uptrend. Bull-bear balance: short-term bearish momentum dominant, but approaching a potential support bounce zone.
4. Conclusion & Trading Suggestions
4-hour bullish case for ZRO:
If this zone holds, a bounce toward 1.75–1.80 is plausible in the next 4 hours.
Direction: Wait for confirmation (bullish bounce setup forming
Entry zone: 1.60–1.65 (if support holds with a bullish candle close above 1.65
Stop-loss: Below 1.58 (break of 24h low)
Target 1: 1.75, Target 2: 1.82
Risk reminder: The recent sharp rejection from 1.884 shows strong selling pressure. If 1.62 breaks decisively, the pullback could extend to 1.54 or lower. The final call is yours.
Note: This is technical analysis is for reference only and not financial advice. Always do your own research.
1. Candle Pattern Interpretation
09-25 low at 1.428 — Higher Low + Bullish Rejection — Bears exhausted, buyers stepped in — Strong signal
09-29 ~ 10-01 peak at 1.884 — Sharp Spike + Rejection Candle — Blow-off top, sellers took control — Strong bearish signal
Current zone 1.652 — Pullback to prior consolidation zone — Testing support from mid-range — Medium signal
RSI analysis: RSI6 at 35.32, RSI12 at 40.54, RSI24 at 46.65 — all three lines are declining from overbought territory and approaching oversold zone. RSI6 is nearing the 30-level which typically acts as a short-term bounce zone, but no bullish crossover has not formed yet — bearish momentum is fading but not yet reversed.
2. Support / Resistance Levels
Short-term resistance: 1.770 (recent rejection level)
Key resistance: 1.884 (recent high)
3. Comprehensive Technical Assessment
Price spiked from 1.428 to 1.884 (+32%) in a strong rally, then pulled back sharply to 1.652 (-12.3% from peak). RSI across all periods is cooling off from overbought. The pullback is retesting the mid-range consolidation zone. Volume during the pullback. Overall trend: short-term pullback within a medium-term uptrend. Bull-bear balance: short-term bearish momentum dominant, but approaching a potential support bounce zone.
4. Conclusion & Trading Suggestions
4-hour bullish case for ZRO:
If this zone holds, a bounce toward 1.75–1.80 is plausible in the next 4 hours.
Direction: Wait for confirmation (bullish bounce setup forming
Entry zone: 1.60–1.65 (if support holds with a bullish candle close above 1.65
Stop-loss: Below 1.58 (break of 24h low)
Target 1: 1.75, Target 2: 1.82
Risk reminder: The recent sharp rejection from 1.884 shows strong selling pressure. If 1.62 breaks decisively, the pullback could extend to 1.54 or lower. The final call is yours.
Note: This is technical analysis is for reference only and not financial advice. Always do your own research.
193
·
--
📊 $SOL 4H Outlook — Range-gebunden, bärische Tendenz nahe dem Support
Aktueller Preis: 117,93 USDT
Nachdem $SOL diese Woche früh ein lokales Hoch bei 124,90 erreicht hat, ist es zurückgekommen und handelt nun nahe dem unteren Ende seiner jüngsten Spanne. So beobachte ich die nächsten 4 Stunden:
Wichtige Levels:
🟢 Support: ~116,00 (jüngstes Swing-Tief) → 112,60 (wichtiger Support)
🔴 Widerstand: ~121,80 (letztes Ablehnungs-Hoch) → 124,90 (Spitzenwert der Spanne)
Technische Einschätzung:
RSI (6/12/24) liegt allesamt unter 50 (42–47 Bereich) → bärischer Momentum
Die Spike-Ablehnung bei ~122 (dieses „S“-Mark“) bestätigt, dass Verkäufer nahe den Hochs aktiv sind
Derzeit testet der Kurs die untere Grenze der 116–122-Spanne
Szenarien für 4H: 1. Bärisch (höhere Wahrscheinlichkeit): Wenn 116 mit Volumen bricht, ist das nächste Ziel voraussichtlich die Zone 113–112,60 2. Bullisch (braucht Bestätigung): Nur wenn 120+ zurückerobert und gehalten wird, würde auf einen Retest von 122+ hindeuten 3. Neutral: Seitwärts zwischen 116–120, falls kein Katalysator kommt
Mein Fazit: Leicht bärisch für den kurzfristigen Zeitraum. Ich warte auf einen bestätigten Break von 116, bevor ich mich festlege. Range-Trading ist hier riskant — Fehlausbrüche sind häufig.
⚠️ Keine Finanzberatung. Mach dir selbst eine eigene Meinung (DYOR).
#SOL #SOLUSDT #Crypto #TechnicalAnalysis #Trading
📊 $SOL 4H Outlook — Range-gebunden, bärische Tendenz nahe dem Support
Aktueller Preis: 117,93 USDT
Nachdem $SOL diese Woche früh ein lokales Hoch bei 124,90 erreicht hat, ist es zurückgekommen und handelt nun nahe dem unteren Ende seiner jüngsten Spanne. So beobachte ich die nächsten 4 Stunden:
Wichtige Levels:
🟢 Support: ~116,00 (jüngstes Swing-Tief) → 112,60 (wichtiger Support)
🔴 Widerstand: ~121,80 (letztes Ablehnungs-Hoch) → 124,90 (Spitzenwert der Spanne)
Technische Einschätzung:
RSI (6/12/24) liegt allesamt unter 50 (42–47 Bereich) → bärischer Momentum
Die Spike-Ablehnung bei ~122 (dieses „S“-Mark“) bestätigt, dass Verkäufer nahe den Hochs aktiv sind
Derzeit testet der Kurs die untere Grenze der 116–122-Spanne
Szenarien für 4H: 1. Bärisch (höhere Wahrscheinlichkeit): Wenn 116 mit Volumen bricht, ist das nächste Ziel voraussichtlich die Zone 113–112,60 2. Bullisch (braucht Bestätigung): Nur wenn 120+ zurückerobert und gehalten wird, würde auf einen Retest von 122+ hindeuten 3. Neutral: Seitwärts zwischen 116–120, falls kein Katalysator kommt
Mein Fazit: Leicht bärisch für den kurzfristigen Zeitraum. Ich warte auf einen bestätigten Break von 116, bevor ich mich festlege. Range-Trading ist hier riskant — Fehlausbrüche sind häufig.
⚠️ Keine Finanzberatung. Mach dir selbst eine eigene Meinung (DYOR).
#SOL #SOLUSDT #Crypto #TechnicalAnalysis #Trading
Aktueller Preis: 117,93 USDT
Nachdem $SOL diese Woche früh ein lokales Hoch bei 124,90 erreicht hat, ist es zurückgekommen und handelt nun nahe dem unteren Ende seiner jüngsten Spanne. So beobachte ich die nächsten 4 Stunden:
Wichtige Levels:
🟢 Support: ~116,00 (jüngstes Swing-Tief) → 112,60 (wichtiger Support)
🔴 Widerstand: ~121,80 (letztes Ablehnungs-Hoch) → 124,90 (Spitzenwert der Spanne)
Technische Einschätzung:
RSI (6/12/24) liegt allesamt unter 50 (42–47 Bereich) → bärischer Momentum
Die Spike-Ablehnung bei ~122 (dieses „S“-Mark“) bestätigt, dass Verkäufer nahe den Hochs aktiv sind
Derzeit testet der Kurs die untere Grenze der 116–122-Spanne
Szenarien für 4H: 1. Bärisch (höhere Wahrscheinlichkeit): Wenn 116 mit Volumen bricht, ist das nächste Ziel voraussichtlich die Zone 113–112,60 2. Bullisch (braucht Bestätigung): Nur wenn 120+ zurückerobert und gehalten wird, würde auf einen Retest von 122+ hindeuten 3. Neutral: Seitwärts zwischen 116–120, falls kein Katalysator kommt
Mein Fazit: Leicht bärisch für den kurzfristigen Zeitraum. Ich warte auf einen bestätigten Break von 116, bevor ich mich festlege. Range-Trading ist hier riskant — Fehlausbrüche sind häufig.
⚠️ Keine Finanzberatung. Mach dir selbst eine eigene Meinung (DYOR).
#SOL #SOLUSDT #Crypto #TechnicalAnalysis #Trading
1
1
297
·
--
$SOL Bereit für den nächsten Schub 🚀
$SOL hat auf dem 1H-Chart eine beeindruckende Widerstandsfähigkeit gezeigt. Deshalb bin ich bullisch:
📊 Das Setup
$SOL ist auf 112,60 gefallen und hart zurückgeprallt – das ist ein solider höherer Tiefpunkt
Der Rücksetzer von 124,90 fand starken Support bei etwa 115,85, und wir sind bereits wieder über 119
Der RSI steigt wieder aus dem überverkauften Bereich (RSI6 bei 58,55) und hat noch jede Menge Spielraum bis Überkauft – das Momentum kippt zurück zu den Bullen
Gewinne über 7 Tage bei +4,90%, über 30 Tage bei +16,07% – der Makrotrend ist eindeutig nach oben
🎯 Wichtige Levels zum Beobachten
Support: 116,0 (sofort) / 112,6 (stark)
Widerstand: 122,0 (erster Zielbereich) / 124,9 (vorheriges Hoch)
Ein Ausbruch über 124,90 würde die Fortsetzung bestätigen und den Weg in Richtung 130+ öffnen
💡 Mein Fazit: Das ist ein klassischer bullischer Retest nach einem Breakout. SOL bildet höhere Tiefs, und Rücksetzer werden aggressiv gekauft. Wenn du auf der Suche nach einem Einstieg bist, ist die Zone 116–118 ein solider Bereich mit gutem Chance-Risiko-Verhältnis. Stop unter 112, Ziel 124–128.
Keine Finanzberatung, nur meine Einschätzung anhand der Charts. Was denkt ihr – sehen wir gleich, dass SOL neue Hochs bricht? 👇
#SOL #Solana #Crypto #TechnischeAnalyse #Altcoin
$SOL Bereit für den nächsten Schub 🚀
$SOL hat auf dem 1H-Chart eine beeindruckende Widerstandsfähigkeit gezeigt. Deshalb bin ich bullisch:
📊 Das Setup
$SOL ist auf 112,60 gefallen und hart zurückgeprallt – das ist ein solider höherer Tiefpunkt
Der Rücksetzer von 124,90 fand starken Support bei etwa 115,85, und wir sind bereits wieder über 119
Der RSI steigt wieder aus dem überverkauften Bereich (RSI6 bei 58,55) und hat noch jede Menge Spielraum bis Überkauft – das Momentum kippt zurück zu den Bullen
Gewinne über 7 Tage bei +4,90%, über 30 Tage bei +16,07% – der Makrotrend ist eindeutig nach oben
🎯 Wichtige Levels zum Beobachten
Support: 116,0 (sofort) / 112,6 (stark)
Widerstand: 122,0 (erster Zielbereich) / 124,9 (vorheriges Hoch)
Ein Ausbruch über 124,90 würde die Fortsetzung bestätigen und den Weg in Richtung 130+ öffnen
💡 Mein Fazit: Das ist ein klassischer bullischer Retest nach einem Breakout. SOL bildet höhere Tiefs, und Rücksetzer werden aggressiv gekauft. Wenn du auf der Suche nach einem Einstieg bist, ist die Zone 116–118 ein solider Bereich mit gutem Chance-Risiko-Verhältnis. Stop unter 112, Ziel 124–128.
Keine Finanzberatung, nur meine Einschätzung anhand der Charts. Was denkt ihr – sehen wir gleich, dass SOL neue Hochs bricht? 👇
#SOL #Solana #Crypto #TechnischeAnalyse #Altcoin
$SOL hat auf dem 1H-Chart eine beeindruckende Widerstandsfähigkeit gezeigt. Deshalb bin ich bullisch:
📊 Das Setup
$SOL ist auf 112,60 gefallen und hart zurückgeprallt – das ist ein solider höherer Tiefpunkt
Der Rücksetzer von 124,90 fand starken Support bei etwa 115,85, und wir sind bereits wieder über 119
Der RSI steigt wieder aus dem überverkauften Bereich (RSI6 bei 58,55) und hat noch jede Menge Spielraum bis Überkauft – das Momentum kippt zurück zu den Bullen
Gewinne über 7 Tage bei +4,90%, über 30 Tage bei +16,07% – der Makrotrend ist eindeutig nach oben
🎯 Wichtige Levels zum Beobachten
Support: 116,0 (sofort) / 112,6 (stark)
Widerstand: 122,0 (erster Zielbereich) / 124,9 (vorheriges Hoch)
Ein Ausbruch über 124,90 würde die Fortsetzung bestätigen und den Weg in Richtung 130+ öffnen
💡 Mein Fazit: Das ist ein klassischer bullischer Retest nach einem Breakout. SOL bildet höhere Tiefs, und Rücksetzer werden aggressiv gekauft. Wenn du auf der Suche nach einem Einstieg bist, ist die Zone 116–118 ein solider Bereich mit gutem Chance-Risiko-Verhältnis. Stop unter 112, Ziel 124–128.
Keine Finanzberatung, nur meine Einschätzung anhand der Charts. Was denkt ihr – sehen wir gleich, dass SOL neue Hochs bricht? 👇
#SOL #Solana #Crypto #TechnischeAnalyse #Altcoin
2
1
1.3k
·
--
Übersetzung ansehen
ZRO/USDT — Breaking Out of a Multi-Day Range 🚀
$ZRO just smashed through its 1.655 resistance and hit a fresh local high of 1.775, up over 16% in 24 hours. Here's what I'm seeing on the 1H chart:
Price Action
$ZRO has been consolidating in a 1.44–1.70 range since Sep 25, with multiple tests of both sides
Today's candle decisively broke above the 1.655 pivot level on strong volume — a textbook range breakout
From the Sep 23 low of 1.331, ZRO is now up roughly 33% in about a week
RSI — Getting Hot
RSI6 is at 81.15 — deep in overbought territory
RSI12 at 70.28 and RSI24 at 62.10 confirm momentum is strong across timeframes
Overbought doesn't always mean reversal — in strong uptrends, RSI can stay elevated for days
Key Levels to Watch
Immediate resistance: 1.775 (current high)
Support: 1.655 (previous resistance, now potential support)
Stronger support: 1.553–1.550 zone (recent swing low area)
My Take The breakout is valid and momentum is clearly bullish, but chasing at 1.76 with RSI6 above 80 is risky. A pullback to retest the 1.655 breakout level would offer a much better risk/reward entry. If it holds that level as support, the next leg up could target 2.0+.
If it fails to hold 1.655, we're back in the range and the breakout was a fakeout.
Always manage your risk. This is not financial advice.
#ZRO #LayerZero #Crypto #TechnicalAnalysis #Altcoins
ZRO/USDT — Breaking Out of a Multi-Day Range 🚀
$ZRO just smashed through its 1.655 resistance and hit a fresh local high of 1.775, up over 16% in 24 hours. Here's what I'm seeing on the 1H chart:
Price Action
$ZRO has been consolidating in a 1.44–1.70 range since Sep 25, with multiple tests of both sides
Today's candle decisively broke above the 1.655 pivot level on strong volume — a textbook range breakout
From the Sep 23 low of 1.331, ZRO is now up roughly 33% in about a week
RSI — Getting Hot
RSI6 is at 81.15 — deep in overbought territory
RSI12 at 70.28 and RSI24 at 62.10 confirm momentum is strong across timeframes
Overbought doesn't always mean reversal — in strong uptrends, RSI can stay elevated for days
Key Levels to Watch
Immediate resistance: 1.775 (current high)
Support: 1.655 (previous resistance, now potential support)
Stronger support: 1.553–1.550 zone (recent swing low area)
My Take The breakout is valid and momentum is clearly bullish, but chasing at 1.76 with RSI6 above 80 is risky. A pullback to retest the 1.655 breakout level would offer a much better risk/reward entry. If it holds that level as support, the next leg up could target 2.0+.
If it fails to hold 1.655, we're back in the range and the breakout was a fakeout.
Always manage your risk. This is not financial advice.
#ZRO #LayerZero #Crypto #TechnicalAnalysis #Altcoins
$ZRO just smashed through its 1.655 resistance and hit a fresh local high of 1.775, up over 16% in 24 hours. Here's what I'm seeing on the 1H chart:
Price Action
$ZRO has been consolidating in a 1.44–1.70 range since Sep 25, with multiple tests of both sides
Today's candle decisively broke above the 1.655 pivot level on strong volume — a textbook range breakout
From the Sep 23 low of 1.331, ZRO is now up roughly 33% in about a week
RSI — Getting Hot
RSI6 is at 81.15 — deep in overbought territory
RSI12 at 70.28 and RSI24 at 62.10 confirm momentum is strong across timeframes
Overbought doesn't always mean reversal — in strong uptrends, RSI can stay elevated for days
Key Levels to Watch
Immediate resistance: 1.775 (current high)
Support: 1.655 (previous resistance, now potential support)
Stronger support: 1.553–1.550 zone (recent swing low area)
My Take The breakout is valid and momentum is clearly bullish, but chasing at 1.76 with RSI6 above 80 is risky. A pullback to retest the 1.655 breakout level would offer a much better risk/reward entry. If it holds that level as support, the next leg up could target 2.0+.
If it fails to hold 1.655, we're back in the range and the breakout was a fakeout.
Always manage your risk. This is not financial advice.
#ZRO #LayerZero #Crypto #TechnicalAnalysis #Altcoins
2
360
·
--
Ich fühle dich, Bruder.
Ich fühle dich, Bruder.

Nusacrypt
·
--
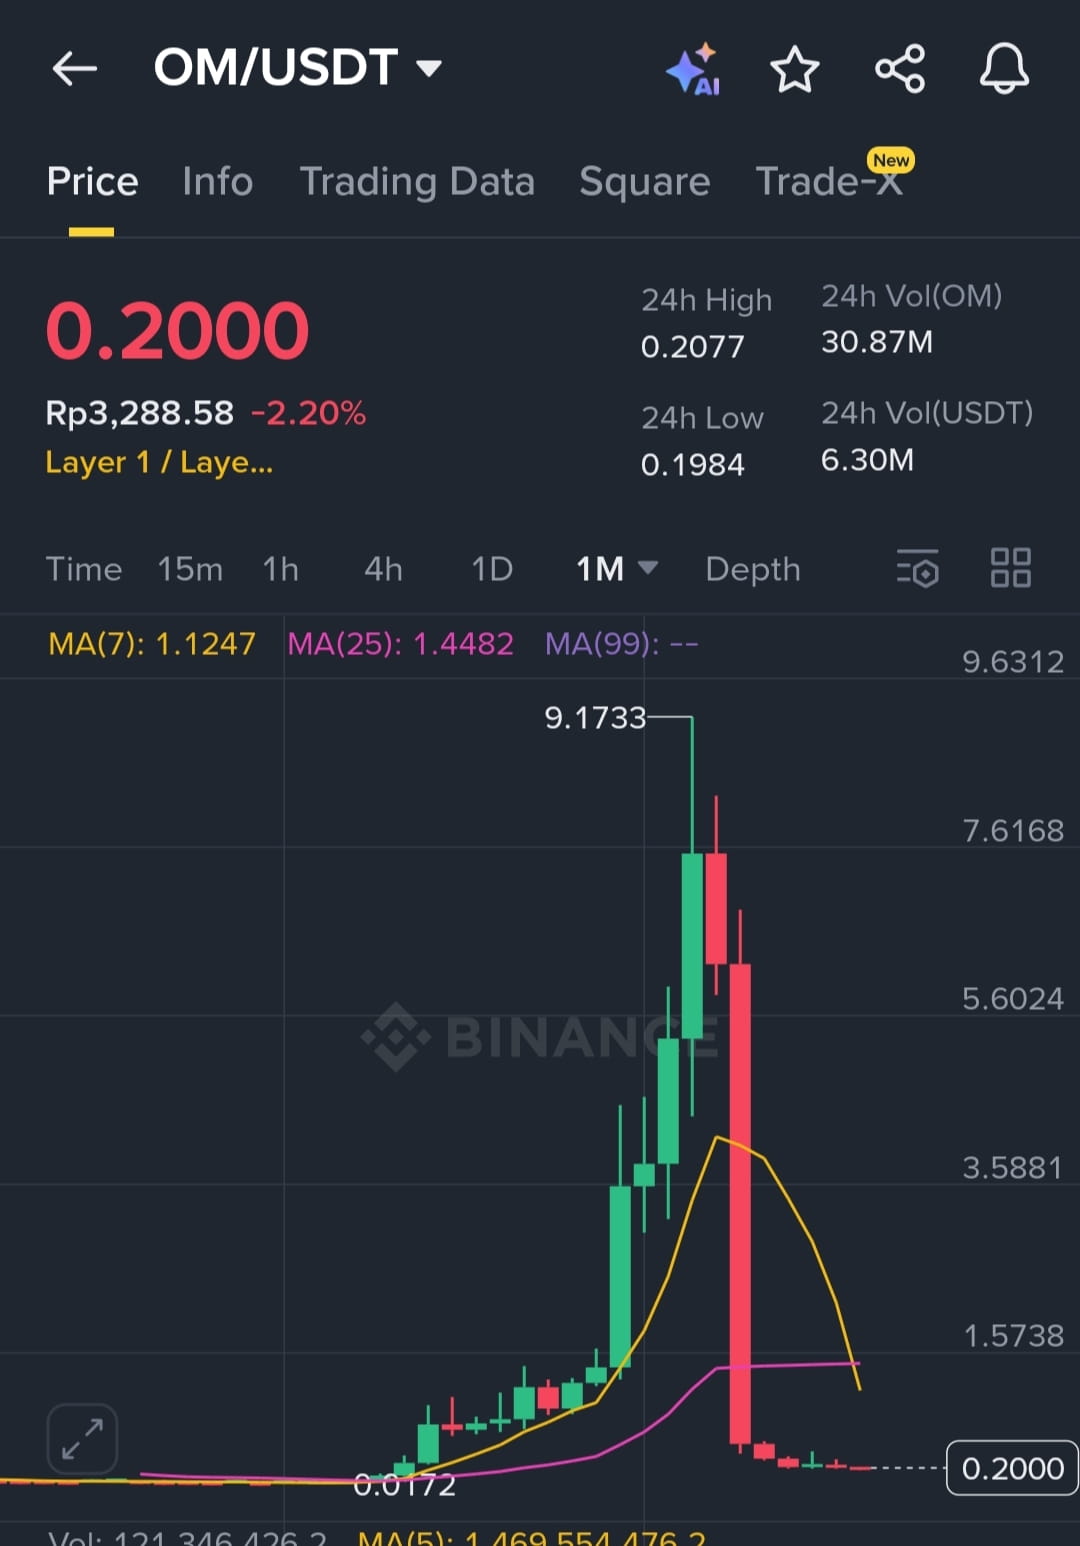
Ich habe mein Vertrauen in $OM gesetzt und alles verloren. Von 100.000 $ bis kaum noch 2.000 $ übrig... mein Leben fühlt sich zerbrochen an. Ich kann nicht schlafen, ich kann nicht klar denken. Diese Münze hat nicht nur mein Geld, sondern auch meine Hoffnung aufgebraucht.😭
·
--
Gekauft für 0.65$
Verkaufen oder halten?
Gekauft für 0.65$
Verkaufen oder halten?
Verkaufen oder halten?


CoinQuest
·
--
Bullisch$SYN /USDT Aufwärtstrend entfacht mit neuer Long-Möglichkeit
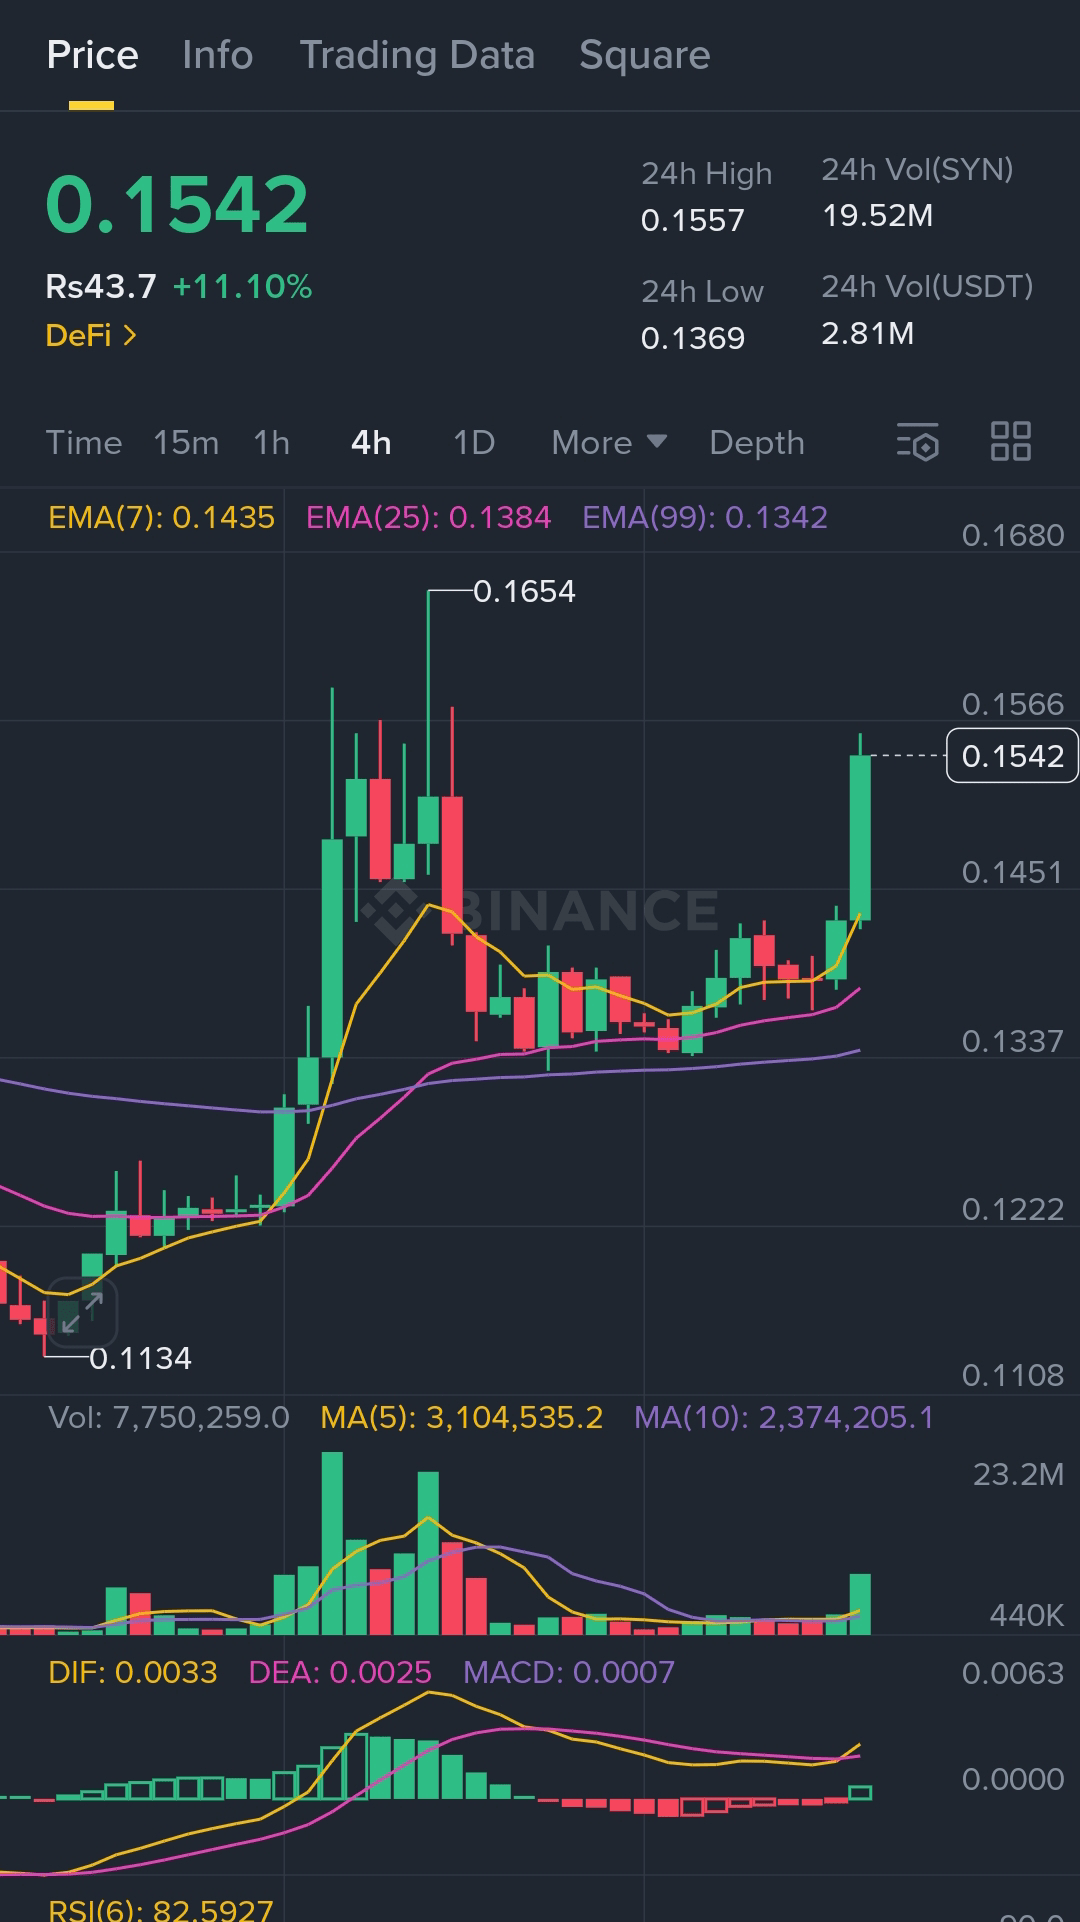
SYN hat ein starkes Comeback hingelegt und signalisiert einen erneuten Aufwärtstrend. Nach dem Testen der wichtigen Unterstützung bei $0.1369 steigt es nun wieder und wird derzeit bei $0.1539 gehandelt.
Die Dynamik nimmt zu, mit soliden grünen Kerzen im 4H-Chart und zunehmendem Volumen, das die Bewegung unterstützt.
📊 Handelsplan:
Kaufzone: $0.1500 – $0.1530
SL: Unter $0.1440
TP1: $0.1650
TP2: $0.1725
Über $0.1500 zu halten könnte den Bullen die Oberhand geben. Achten Sie auf die Bestätigung des Volumens für eine Fortsetzung.
SYN hat ein starkes Comeback hingelegt und signalisiert einen erneuten Aufwärtstrend. Nach dem Testen der wichtigen Unterstützung bei $0.1369 steigt es nun wieder und wird derzeit bei $0.1539 gehandelt.
Die Dynamik nimmt zu, mit soliden grünen Kerzen im 4H-Chart und zunehmendem Volumen, das die Bewegung unterstützt.
📊 Handelsplan:
Kaufzone: $0.1500 – $0.1530
SL: Unter $0.1440
TP1: $0.1650
TP2: $0.1725
Über $0.1500 zu halten könnte den Bullen die Oberhand geben. Achten Sie auf die Bestätigung des Volumens für eine Fortsetzung.
·
--
Gekauft für 0.65$
Verkaufen oder halten?
Gekauft für 0.65$
Verkaufen oder halten?
Verkaufen oder halten?

Eloise-23
·
--
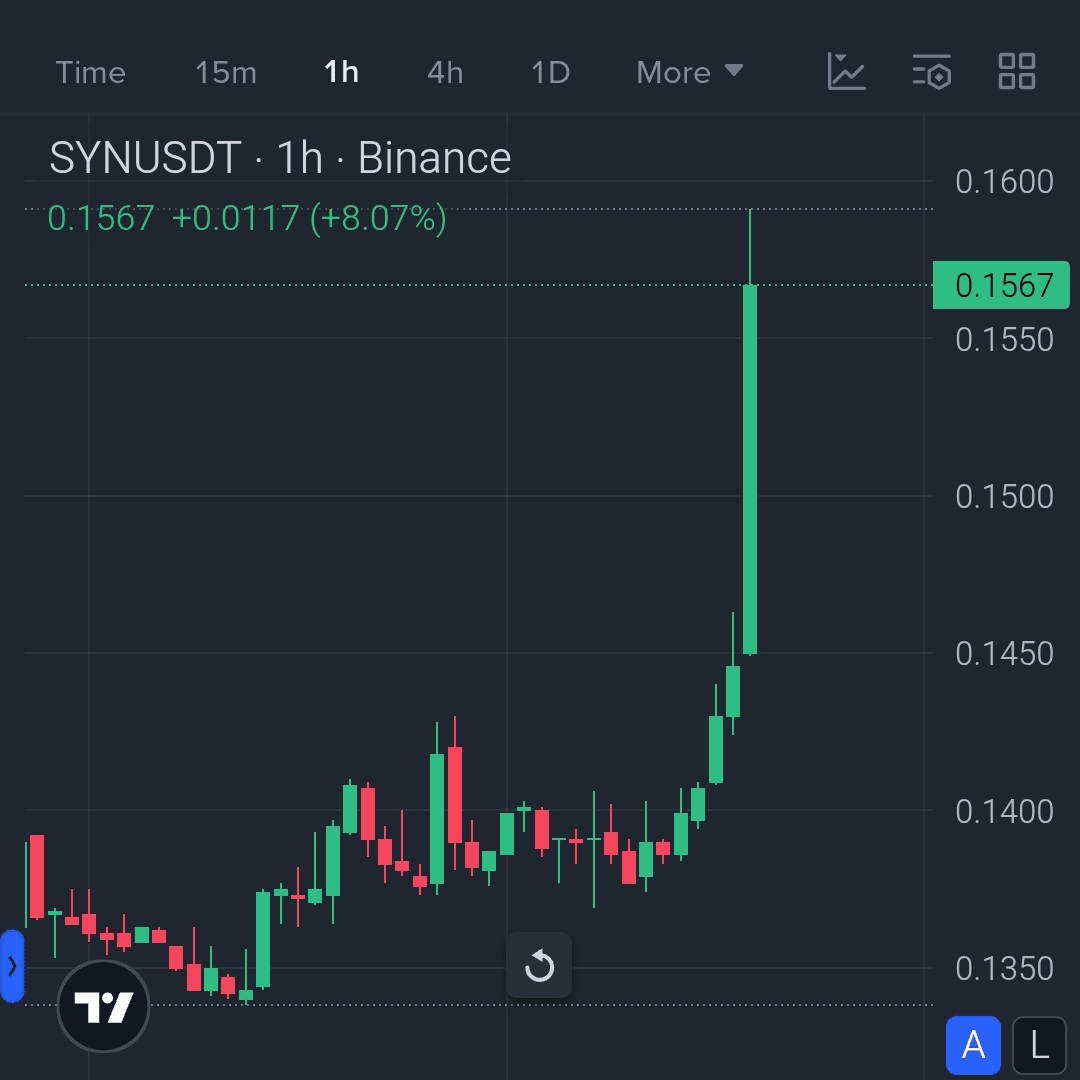
Bullisch$SYN ist gerade durchgestartet.
Sauberer Ausbruch auf der 1H mit Volumen, das ihn unterstützt. Bullen zeigen Stärke über $0.145.
Achte auf die Zone $0.155,$0.157 für dein Spiel.
Ziele bei $0.165, $0.1725 und $0.18 festgelegt. Halte SL eng bei $0.149.
Bewege dich smart, stapel stabil
#SYN #CryptoHustle
Sauberer Ausbruch auf der 1H mit Volumen, das ihn unterstützt. Bullen zeigen Stärke über $0.145.
Achte auf die Zone $0.155,$0.157 für dein Spiel.
Ziele bei $0.165, $0.1725 und $0.18 festgelegt. Halte SL eng bei $0.149.
Bewege dich smart, stapel stabil
#SYN #CryptoHustle
5
·
--
Gekauft für 0,65$
Soll ich halten oder verkaufen?
Gekauft für 0,65$
Soll ich halten oder verkaufen?
Soll ich halten oder verkaufen?

BlockchainBaller
·
--
$SYN sieht gut aus
$SYN ist gerade mit einer starken grünen Kerze auf dem 1H-Chart aus der Konsolidierung explodiert, was starken bullischen Schwung und zunehmendes Volumen zeigt. Der Ausbruch aus dem Bereich von $0.145 signalisiert den Beginn eines potenziellen Fortsetzungsrallys.
Einstiegszone: $0.1550 – $0.1570
🎯 Ziel 1: $0.1650
🎯 Ziel 2: $0.1725
🎯 Ziel 3: $0.1800
Stop-Loss: $0.1490
Risikohinweis: Halten Sie sich an ein Risiko von 1–2% pro Trade. Überwachen Sie das Volumen, ein sauberer Rücktest der Ausbruchszone könnte einen zweiten Einstieg bieten. Der Schwung ist zugunsten der Bullen, reiten Sie die Welle, aber managen Sie das Risiko.
$SYN ist gerade mit einer starken grünen Kerze auf dem 1H-Chart aus der Konsolidierung explodiert, was starken bullischen Schwung und zunehmendes Volumen zeigt. Der Ausbruch aus dem Bereich von $0.145 signalisiert den Beginn eines potenziellen Fortsetzungsrallys.
Einstiegszone: $0.1550 – $0.1570
🎯 Ziel 1: $0.1650
🎯 Ziel 2: $0.1725
🎯 Ziel 3: $0.1800
Stop-Loss: $0.1490
Risikohinweis: Halten Sie sich an ein Risiko von 1–2% pro Trade. Überwachen Sie das Volumen, ein sauberer Rücktest der Ausbruchszone könnte einen zweiten Einstieg bieten. Der Schwung ist zugunsten der Bullen, reiten Sie die Welle, aber managen Sie das Risiko.
Anmelden und weiter Inhalte entdecken
Krypto-Nutzer weltweit auf Binance Square kennenlernen
⚡️ Bleib in Sachen Krypto stets am Puls.
💬 Die weltgrößte Kryptobörse vertraut darauf.
👍 Erhalte verlässliche Einblicke von verifizierten Creators.
E-Mail-Adresse/Telefonnummer
Trendthemen
NFPWatch
10.9M Aufrufe
19,340 Kommentare
Krypto-News | Bitcoin nähert sich der Marke von 85.000 US-Dollar, während die Renditen von US-Staatsanleihen vor dem Bericht zu den NFP zurückgehen
Binance News
·42 Likes
·51.4k Aufrufe
BitcoinFundingRateTriplesTo10%
178,641 Aufrufe
1,232 Kommentare
BitcoinSurpasses$86KUp2.99%
59,286 Aufrufe
117 Kommentare