
Maida Sufyan
27 Beiträge

Maida Sufyan
Melden
Nutzer blockieren
12 Following
9 Follower
13 Like gegeben
Beiträge
·
--
Übersetzung ansehen
$BTC
Short-term structure remains weak: on the 4-hour chart, price is below the 7/25/99 moving averages, with bearish MA alignment. SuperTrend remains down at $68,683.18.
There is a tentative rebound signal: MACD made a golden cross two 4-hour candles ago, but RSI(6) is only 38.17, so the signal has not yet shown strong upside momentum.
Flow and positioning are mixed: 1-day capital flow shows a net outflow of 3,008.01 BTC. Futures funding is slightly negative at -0.0013%, while 74.22% of all futures accounts are long; crowded long positioning can add volatility if price weakens.
What matters next: reclaiming and holding above the short moving averages would improve the rebound setup. A loss of the recent $63.7K–$64.0K area would keep downside pressure in focus. These are scenario markers, not trade instructions.#USSpotXRPETFsSeeLargestWeeklyOutflowIn8Months #WillFOMCMinutesReinforceRateHikeExpectations? #BitcoinActiveSupplyInProfitDropsBelow45%
$BTC
Short-term structure remains weak: on the 4-hour chart, price is below the 7/25/99 moving averages, with bearish MA alignment. SuperTrend remains down at $68,683.18.
There is a tentative rebound signal: MACD made a golden cross two 4-hour candles ago, but RSI(6) is only 38.17, so the signal has not yet shown strong upside momentum.
Flow and positioning are mixed: 1-day capital flow shows a net outflow of 3,008.01 BTC. Futures funding is slightly negative at -0.0013%, while 74.22% of all futures accounts are long; crowded long positioning can add volatility if price weakens.
What matters next: reclaiming and holding above the short moving averages would improve the rebound setup. A loss of the recent $63.7K–$64.0K area would keep downside pressure in focus. These are scenario markers, not trade instructions.#USSpotXRPETFsSeeLargestWeeklyOutflowIn8Months #WillFOMCMinutesReinforceRateHikeExpectations? #BitcoinActiveSupplyInProfitDropsBelow45%
Short-term structure remains weak: on the 4-hour chart, price is below the 7/25/99 moving averages, with bearish MA alignment. SuperTrend remains down at $68,683.18.
There is a tentative rebound signal: MACD made a golden cross two 4-hour candles ago, but RSI(6) is only 38.17, so the signal has not yet shown strong upside momentum.
Flow and positioning are mixed: 1-day capital flow shows a net outflow of 3,008.01 BTC. Futures funding is slightly negative at -0.0013%, while 74.22% of all futures accounts are long; crowded long positioning can add volatility if price weakens.
What matters next: reclaiming and holding above the short moving averages would improve the rebound setup. A loss of the recent $63.7K–$64.0K area would keep downside pressure in focus. These are scenario markers, not trade instructions.#USSpotXRPETFsSeeLargestWeeklyOutflowIn8Months #WillFOMCMinutesReinforceRateHikeExpectations? #BitcoinActiveSupplyInProfitDropsBelow45%
83
·
--
$XRP
{spot}(XRPUSDT)
liegt bei etwa $1.2562, ein Plus von +0.41% in den letzten 24 Stunden, nachdem der Kurs zwischen $1.2423 und $1.2646 gehandelt wurde.
Kurzfristiger Trend: Weiterhin vorsichtig. XRP liegt über 7 Tage um -3.08% und über 30 Tage um -15.40% im Minus.
Momentum: Der RSI(6) liegt bei 36 und ist neutral, aber eher schwach als überhitzt. Der MACD bleibt in einem Death Cross und der SuperTrend zeigt weiterhin nach unten, was das technische Bild belastet.
Wichtige Zonen im Blick: Die Unterstützung der jüngsten Handelsspanne liegt bei etwa $1.20; das 7-Tage-Hoch nahe $1.34 ist der erste Bereich, in dem sich das Momentum verbessern müsste. Das aktuelle Volumen ist im Vergleich zum 7-Tage-Durchschnitt gering, während die Orderströme großer Marktteilnehmer einen Nettoabfluss zeigen.
bitte sag mir etwas über meinen Beitrag. Und sag mir, dass du gute Ratschläge hast 😊
$XRP
liegt bei etwa $1.2562, ein Plus von +0.41% in den letzten 24 Stunden, nachdem der Kurs zwischen $1.2423 und $1.2646 gehandelt wurde.
Kurzfristiger Trend: Weiterhin vorsichtig. XRP liegt über 7 Tage um -3.08% und über 30 Tage um -15.40% im Minus.
Momentum: Der RSI(6) liegt bei 36 und ist neutral, aber eher schwach als überhitzt. Der MACD bleibt in einem Death Cross und der SuperTrend zeigt weiterhin nach unten, was das technische Bild belastet.
Wichtige Zonen im Blick: Die Unterstützung der jüngsten Handelsspanne liegt bei etwa $1.20; das 7-Tage-Hoch nahe $1.34 ist der erste Bereich, in dem sich das Momentum verbessern müsste. Das aktuelle Volumen ist im Vergleich zum 7-Tage-Durchschnitt gering, während die Orderströme großer Marktteilnehmer einen Nettoabfluss zeigen.
bitte sag mir etwas über meinen Beitrag. Und sag mir, dass du gute Ratschläge hast 😊
liegt bei etwa $1.2562, ein Plus von +0.41% in den letzten 24 Stunden, nachdem der Kurs zwischen $1.2423 und $1.2646 gehandelt wurde.
Kurzfristiger Trend: Weiterhin vorsichtig. XRP liegt über 7 Tage um -3.08% und über 30 Tage um -15.40% im Minus.
Momentum: Der RSI(6) liegt bei 36 und ist neutral, aber eher schwach als überhitzt. Der MACD bleibt in einem Death Cross und der SuperTrend zeigt weiterhin nach unten, was das technische Bild belastet.
Wichtige Zonen im Blick: Die Unterstützung der jüngsten Handelsspanne liegt bei etwa $1.20; das 7-Tage-Hoch nahe $1.34 ist der erste Bereich, in dem sich das Momentum verbessern müsste. Das aktuelle Volumen ist im Vergleich zum 7-Tage-Durchschnitt gering, während die Orderströme großer Marktteilnehmer einen Nettoabfluss zeigen.
bitte sag mir etwas über meinen Beitrag. Und sag mir, dass du gute Ratschläge hast 😊
206
·
--
Übersetzung ansehen
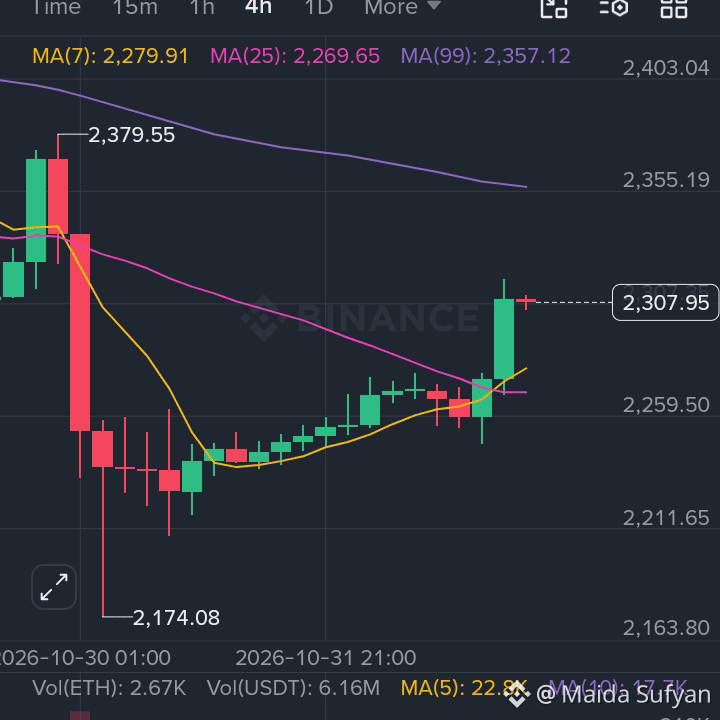
$ETH
{spot}(ETHUSDT)
Current price: Around $2,295
Support: $2,251 / $2,206
Resistance: $2,327 / $2,373
RSI: 37.7 — weak momentum.
Trend: Short-term bearish, with a possible recovery if resistance breaks.
Market outlook:
A move above $2,327 could strengthen bullish momentum.
A break below $2,251 could increase selling pressure.
This is a market observation, not a guaranteed price prediction. Crypto prices are highly volatile.#BTCPayServerUrgesOperatorsToShutDownInstances #BinanceToResumePhaseOneOfWithdrawals #BTCPayServerUrgesOperatorsToShutDownInstances
$ETH
Current price: Around $2,295
Support: $2,251 / $2,206
Resistance: $2,327 / $2,373
RSI: 37.7 — weak momentum.
Trend: Short-term bearish, with a possible recovery if resistance breaks.
Market outlook:
A move above $2,327 could strengthen bullish momentum.
A break below $2,251 could increase selling pressure.
This is a market observation, not a guaranteed price prediction. Crypto prices are highly volatile.#BTCPayServerUrgesOperatorsToShutDownInstances #BinanceToResumePhaseOneOfWithdrawals #BTCPayServerUrgesOperatorsToShutDownInstances
Current price: Around $2,295
Support: $2,251 / $2,206
Resistance: $2,327 / $2,373
RSI: 37.7 — weak momentum.
Trend: Short-term bearish, with a possible recovery if resistance breaks.
Market outlook:
A move above $2,327 could strengthen bullish momentum.
A break below $2,251 could increase selling pressure.
This is a market observation, not a guaranteed price prediction. Crypto prices are highly volatile.#BTCPayServerUrgesOperatorsToShutDownInstances #BinanceToResumePhaseOneOfWithdrawals #BTCPayServerUrgesOperatorsToShutDownInstances
98
·
--
$DOT wird zum Stand vom 2026-10-23 bei etwa $1.126 gehandelt und ist in den vergangenen 24 Stunden um rund +0,8 % gestiegen. Die Tagesspanne lag bei $1.103–$1.203. Das deutet auf eine moderate Erholung hin, zeigt aber auch, dass der Kurs weiterhin empfindlich auf die jüngsten Tiefstände reagiert.
Fundamental stützt sich die Investmentthese für Polkadot weiterhin auf seine interoperable Multi-Chain-Architektur und die Entwicklung des Ökosystems. Entscheidend ist, ob die Netzwerkaktivität, die Entwicklerbeteiligung und die Nachfrage nach dem Nutzen von DOT zunehmen. Andernfalls könnte die Kursdynamik fragil bleiben, selbst wenn sich der Kryptomarkt insgesamt erholt.#SwedishCentralBankUrgesEKronaReview #BinancePick
{spot}(DOTUSDT)
$DOT wird zum Stand vom 2026-10-23 bei etwa $1.126 gehandelt und ist in den vergangenen 24 Stunden um rund +0,8 % gestiegen. Die Tagesspanne lag bei $1.103–$1.203. Das deutet auf eine moderate Erholung hin, zeigt aber auch, dass der Kurs weiterhin empfindlich auf die jüngsten Tiefstände reagiert.
Fundamental stützt sich die Investmentthese für Polkadot weiterhin auf seine interoperable Multi-Chain-Architektur und die Entwicklung des Ökosystems. Entscheidend ist, ob die Netzwerkaktivität, die Entwicklerbeteiligung und die Nachfrage nach dem Nutzen von DOT zunehmen. Andernfalls könnte die Kursdynamik fragil bleiben, selbst wenn sich der Kryptomarkt insgesamt erholt.#SwedishCentralBankUrgesEKronaReview #BinancePick
Fundamental stützt sich die Investmentthese für Polkadot weiterhin auf seine interoperable Multi-Chain-Architektur und die Entwicklung des Ökosystems. Entscheidend ist, ob die Netzwerkaktivität, die Entwicklerbeteiligung und die Nachfrage nach dem Nutzen von DOT zunehmen. Andernfalls könnte die Kursdynamik fragil bleiben, selbst wenn sich der Kryptomarkt insgesamt erholt.#SwedishCentralBankUrgesEKronaReview #BinancePick
1
121
·
--
Übersetzung ansehen
$BTC
{spot}(BTCUSDT)
That shows short-term buying strength, but the nearby daily high is also an area where momentum may pause. Continuation would depend on BTC holding above the session open near $82.7K and whether volume remains supportive; a move back below that area would signal that the current push is losing traction.#EarningsSeason #OCCIssuesFirstFinalRuleUnderGENIUSAct
$BTC
That shows short-term buying strength, but the nearby daily high is also an area where momentum may pause. Continuation would depend on BTC holding above the session open near $82.7K and whether volume remains supportive; a move back below that area would signal that the current push is losing traction.#EarningsSeason #OCCIssuesFirstFinalRuleUnderGENIUSAct
That shows short-term buying strength, but the nearby daily high is also an area where momentum may pause. Continuation would depend on BTC holding above the session open near $82.7K and whether volume remains supportive; a move back below that area would signal that the current push is losing traction.#EarningsSeason #OCCIssuesFirstFinalRuleUnderGENIUSAct
80
·
--
Hallo 👋 sieh dir bitte meinen Beitrag an und reagiere darauf
😊
$ZEC wird am 2026-10-21 zu 1.336,85 $ gehandelt, etwa +12,2 % höher als in den vergangenen 24 Stunden. Die Tagesspanne liegt bei 1.175,07–1.340,00 $. Die Bewegung ist stark und der Kurs liegt nahe am Tageshoch, während das gemeldete Spot-Handelsvolumen etwa 213,7 Mio. $ beträgt.
Das wichtigste Unterscheidungsmerkmal von ZEC sind datenschutzorientierte Zahlungen. Daher kann die Bewertung stark auf die Nachfrage nach Datenschutztechnologien, den Zugang zu Börsen und regulatorische Schlagzeilen reagieren. Damit die aktuelle Bewegung anhält, müsste der Kurs durch anhaltendes Volumen und eine breitere Risikobereitschaft am Kryptomarkt gestützt bleiben. Ein schneller Rückgang vom Tageshoch oder ein nachlassendes Handelsvolumen würden darauf hindeuten, dass die kurzfristige Dynamik abkühlt. Die Volatilität kann deutlich höher sein als bei größeren, liquideren Vermögenswerten, daher ist ein gutes Risikomanagement wichtig.#ZcashDevelopersConfirmNovemberDateForNU7Upgrade #GENIUSActExpectedToTakeEffectJan18,2027 #SolanaSetToActivateAlpenglowToday
{future}(ZECUSDT)
Hallo 👋 sieh dir bitte meinen Beitrag an und reagiere darauf
😊
$ZEC wird am 2026-10-21 zu 1.336,85 $ gehandelt, etwa +12,2 % höher als in den vergangenen 24 Stunden. Die Tagesspanne liegt bei 1.175,07–1.340,00 $. Die Bewegung ist stark und der Kurs liegt nahe am Tageshoch, während das gemeldete Spot-Handelsvolumen etwa 213,7 Mio. $ beträgt.
Das wichtigste Unterscheidungsmerkmal von ZEC sind datenschutzorientierte Zahlungen. Daher kann die Bewertung stark auf die Nachfrage nach Datenschutztechnologien, den Zugang zu Börsen und regulatorische Schlagzeilen reagieren. Damit die aktuelle Bewegung anhält, müsste der Kurs durch anhaltendes Volumen und eine breitere Risikobereitschaft am Kryptomarkt gestützt bleiben. Ein schneller Rückgang vom Tageshoch oder ein nachlassendes Handelsvolumen würden darauf hindeuten, dass die kurzfristige Dynamik abkühlt. Die Volatilität kann deutlich höher sein als bei größeren, liquideren Vermögenswerten, daher ist ein gutes Risikomanagement wichtig.#ZcashDevelopersConfirmNovemberDateForNU7Upgrade #GENIUSActExpectedToTakeEffectJan18,2027 #SolanaSetToActivateAlpenglowToday
😊
$ZEC wird am 2026-10-21 zu 1.336,85 $ gehandelt, etwa +12,2 % höher als in den vergangenen 24 Stunden. Die Tagesspanne liegt bei 1.175,07–1.340,00 $. Die Bewegung ist stark und der Kurs liegt nahe am Tageshoch, während das gemeldete Spot-Handelsvolumen etwa 213,7 Mio. $ beträgt.
Das wichtigste Unterscheidungsmerkmal von ZEC sind datenschutzorientierte Zahlungen. Daher kann die Bewertung stark auf die Nachfrage nach Datenschutztechnologien, den Zugang zu Börsen und regulatorische Schlagzeilen reagieren. Damit die aktuelle Bewegung anhält, müsste der Kurs durch anhaltendes Volumen und eine breitere Risikobereitschaft am Kryptomarkt gestützt bleiben. Ein schneller Rückgang vom Tageshoch oder ein nachlassendes Handelsvolumen würden darauf hindeuten, dass die kurzfristige Dynamik abkühlt. Die Volatilität kann deutlich höher sein als bei größeren, liquideren Vermögenswerten, daher ist ein gutes Risikomanagement wichtig.#ZcashDevelopersConfirmNovemberDateForNU7Upgrade #GENIUSActExpectedToTakeEffectJan18,2027 #SolanaSetToActivateAlpenglowToday
490
·
--
Übersetzung ansehen
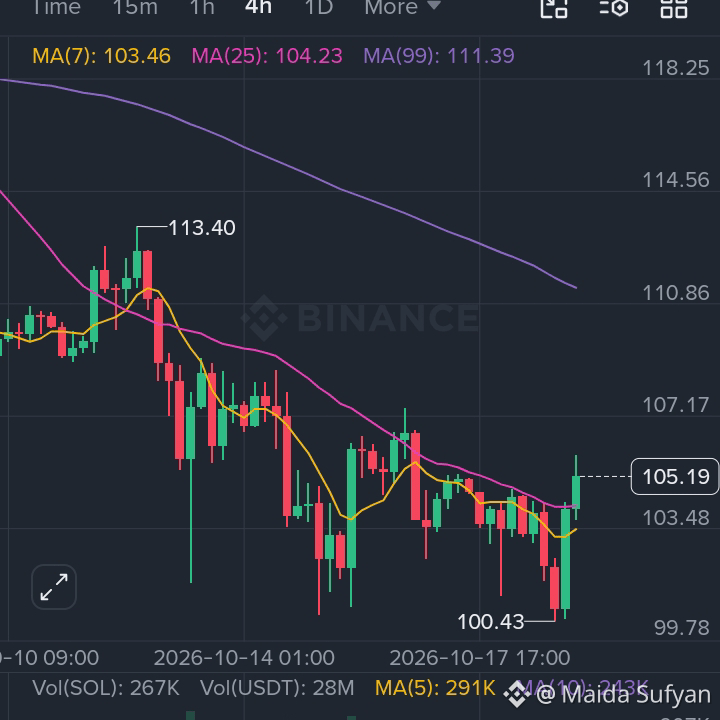
$SOL is around $105.22 as of 2026-10-19, up +0.5% over the past 24 hours. Its session range is $100.43–$105.90, so price is trading close to the day’s high.
The short-term picture is constructive only if SOL can keep holding near the upper end of that range with sustained volume. A move back below the day’s midpoint would indicate that buyers are losing momentum. Broader direction will also remain sensitive to BTC’s trend and overall risk appetite across major altcoins.#GrayscaleAndRepublicLaunchThreeCryptoFunds #ElSalvadorBitcoinHoldingsSurpass7800BTC #CelestiaRises16%To2026High
{spot}(SOLUSDT)
$SOL is around $105.22 as of 2026-10-19, up +0.5% over the past 24 hours. Its session range is $100.43–$105.90, so price is trading close to the day’s high.
The short-term picture is constructive only if SOL can keep holding near the upper end of that range with sustained volume. A move back below the day’s midpoint would indicate that buyers are losing momentum. Broader direction will also remain sensitive to BTC’s trend and overall risk appetite across major altcoins.#GrayscaleAndRepublicLaunchThreeCryptoFunds #ElSalvadorBitcoinHoldingsSurpass7800BTC #CelestiaRises16%To2026High
The short-term picture is constructive only if SOL can keep holding near the upper end of that range with sustained volume. A move back below the day’s midpoint would indicate that buyers are losing momentum. Broader direction will also remain sensitive to BTC’s trend and overall risk appetite across major altcoins.#GrayscaleAndRepublicLaunchThreeCryptoFunds #ElSalvadorBitcoinHoldingsSurpass7800BTC #CelestiaRises16%To2026High
90
·
--
Übersetzung ansehen
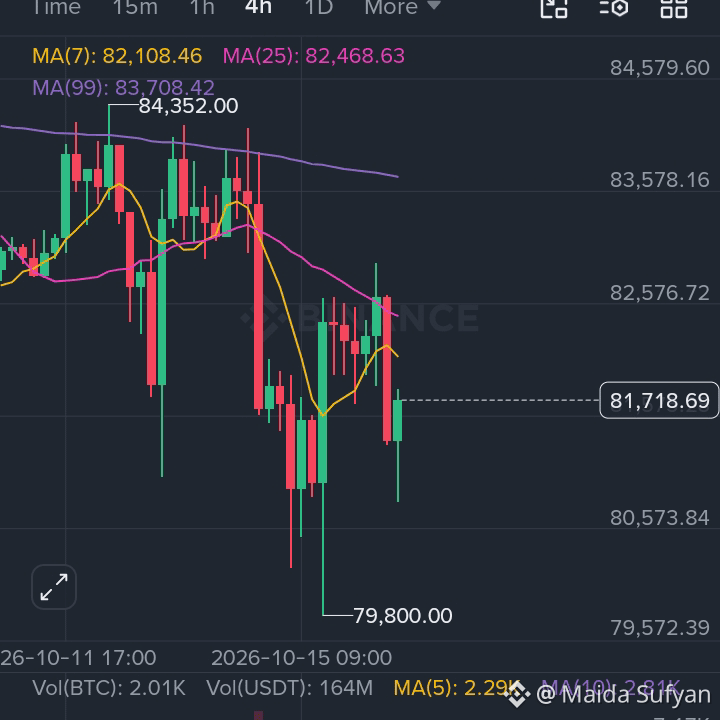
$BTC is trading at $81,569.19 as of 2026-10-16, down -1.16% over the past 24 hours. It traded between $80,809.25 and $82,940.81, showing active intraday volatility.
The near-term picture is mixed: holding above the day’s low would suggest buyers are still defending dips, while a move back above the session high would signal renewed momentum. A break below the low would increase downside pressure. Broader direction will still depend heavily on overall risk appetite, ETF and institutional flows, and macro headlines.😕#OctoberFedHikeOddsFallToAround17% #SolanaAlpenglowUpgradeToActivateOnOct21 #USSeptemberPPIRisesTo6.3%
$BTC is trading at $81,569.19 as of 2026-10-16, down -1.16% over the past 24 hours. It traded between $80,809.25 and $82,940.81, showing active intraday volatility.
The near-term picture is mixed: holding above the day’s low would suggest buyers are still defending dips, while a move back above the session high would signal renewed momentum. A break below the low would increase downside pressure. Broader direction will still depend heavily on overall risk appetite, ETF and institutional flows, and macro headlines.😕#OctoberFedHikeOddsFallToAround17% #SolanaAlpenglowUpgradeToActivateOnOct21 #USSeptemberPPIRisesTo6.3%
The near-term picture is mixed: holding above the day’s low would suggest buyers are still defending dips, while a move back above the session high would signal renewed momentum. A break below the low would increase downside pressure. Broader direction will still depend heavily on overall risk appetite, ETF and institutional flows, and macro headlines.😕#OctoberFedHikeOddsFallToAround17% #SolanaAlpenglowUpgradeToActivateOnOct21 #USSeptemberPPIRisesTo6.3%
119
·
--
Übersetzung ansehen
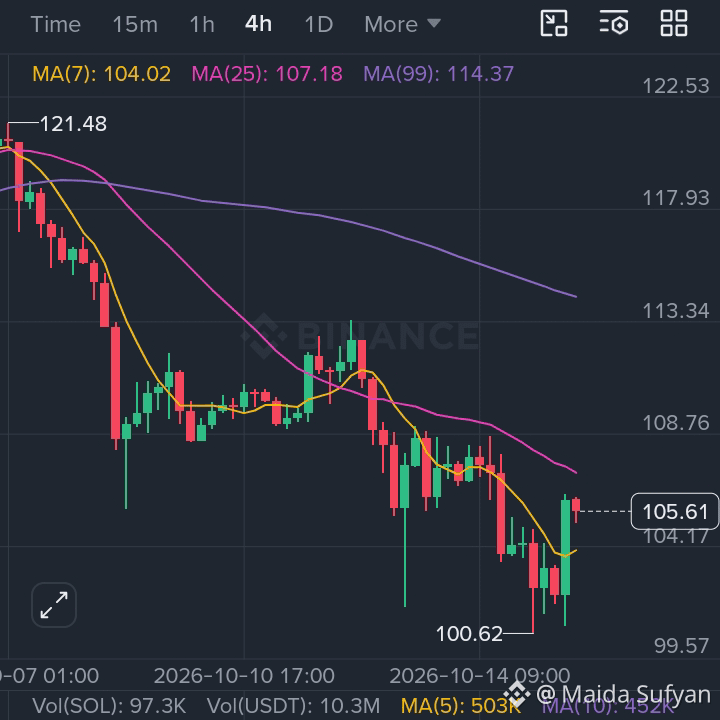
$SOL is trading at $105.65 as of 2026-10-15, up about +0.6% over the last 24 hours. Its session range has been $100.62–$106.30, so price is currently near the upper end of that range.
The short-term tone is constructive while SOL holds near the day’s high, but a clean move beyond the current range would need sustained volume. A drop back toward the lower end of today’s range would signal that buyers are losing momentu.
{future}(SOLUSDT)
.#BlackRockCryptoAssetsJump63% #CPIWatch #SouthKoreaPlansTighterCybersecurityRules
$SOL is trading at $105.65 as of 2026-10-15, up about +0.6% over the last 24 hours. Its session range has been $100.62–$106.30, so price is currently near the upper end of that range.
The short-term tone is constructive while SOL holds near the day’s high, but a clean move beyond the current range would need sustained volume. A drop back toward the lower end of today’s range would signal that buyers are losing momentu.
.#BlackRockCryptoAssetsJump63% #CPIWatch #SouthKoreaPlansTighterCybersecurityRules
The short-term tone is constructive while SOL holds near the day’s high, but a clean move beyond the current range would need sustained volume. A drop back toward the lower end of today’s range would signal that buyers are losing momentu.
.#BlackRockCryptoAssetsJump63% #CPIWatch #SouthKoreaPlansTighterCybersecurityRules
93
·
--
Artikel
Übersetzung ansehen
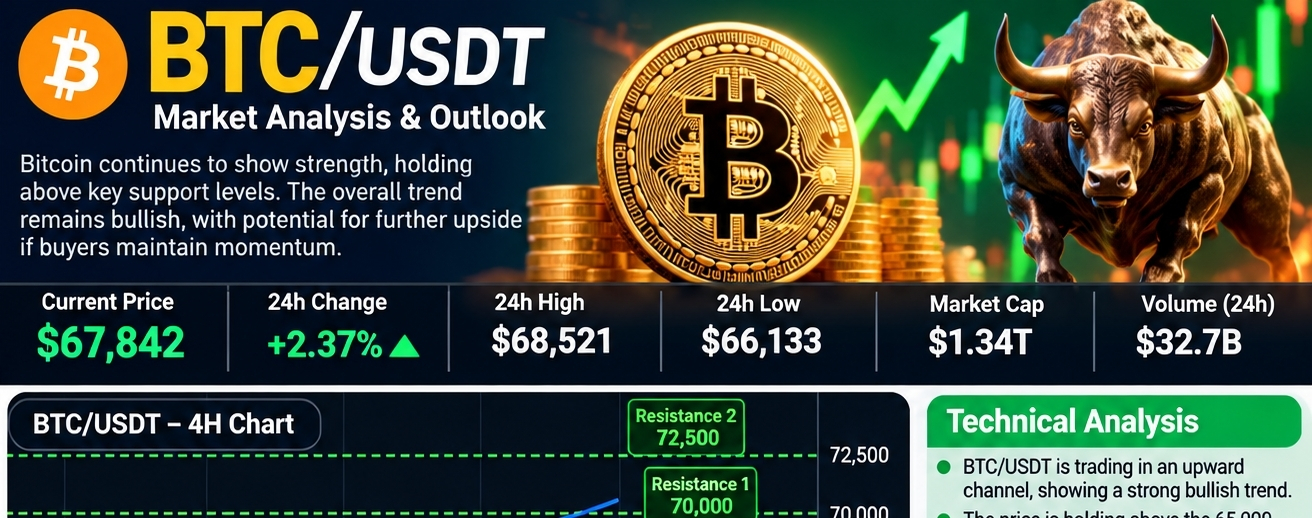
BTC/USDT📊$BTC Market Analysis: Bitcoin Price Outlook
🪙 Introduction
Bitcoin (BTC) is one of the most popular cryptocurrencies in the digital market. The BTC/USDT trading pair shows the price of Bitcoin in Tether (USDT). Traders monitor this pair to identify potential buying and selling opportunities.
📈 Market Analysis
Bitcoin's market direction depends on buying pressure, selling activity, trading volume, and overall market sentiment. If BTC/USDT breaks above a key resistance level with strong volume, the price may continue moving upward. However, if selling pressure increases, Bitcoin could experience a short-term correction.
🎯 Key Levels to Watch
- Resistance: Watch recent price highs for possible breakout opportunities.
- Support: Monitor recent price lows where buyers may enter the market.
- Volume: Higher trading volume can help confirm a price breakout.
- Trend: Monitor the 4-hour and daily charts to understand the market direction.
🔮 Market Outlook
BTC/USDT may continue its upward movement if buyers maintain strong momentum and the price breaks above resistance. On the other hand, losing an important support level could lead to further downside.
Traders should monitor market conditions carefully and avoid making decisions based on predictions alone.
✅ Conclusion
Bitcoin remains an important cryptocurrency to watch. Technical analysis, market sentiment, and risk management can help traders make more informed decisions. Always use stop-loss orders when appropriate and never risk more than you can afford to loss.
BTC/USDT
📊$BTC Market Analysis: Bitcoin Price Outlook
🪙 Introduction
Bitcoin (BTC) is one of the most popular cryptocurrencies in the digital market. The BTC/USDT trading pair shows the price of Bitcoin in Tether (USDT). Traders monitor this pair to identify potential buying and selling opportunities.
📈 Market Analysis
Bitcoin's market direction depends on buying pressure, selling activity, trading volume, and overall market sentiment. If BTC/USDT breaks above a key resistance level with strong volume, the price may continue moving upward. However, if selling pressure increases, Bitcoin could experience a short-term correction.
🎯 Key Levels to Watch
- Resistance: Watch recent price highs for possible breakout opportunities.
- Support: Monitor recent price lows where buyers may enter the market.
- Volume: Higher trading volume can help confirm a price breakout.
- Trend: Monitor the 4-hour and daily charts to understand the market direction.
🔮 Market Outlook
BTC/USDT may continue its upward movement if buyers maintain strong momentum and the price breaks above resistance. On the other hand, losing an important support level could lead to further downside.
Traders should monitor market conditions carefully and avoid making decisions based on predictions alone.
✅ Conclusion
Bitcoin remains an important cryptocurrency to watch. Technical analysis, market sentiment, and risk management can help traders make more informed decisions. Always use stop-loss orders when appropriate and never risk more than you can afford to loss.
🪙 Introduction
Bitcoin (BTC) is one of the most popular cryptocurrencies in the digital market. The BTC/USDT trading pair shows the price of Bitcoin in Tether (USDT). Traders monitor this pair to identify potential buying and selling opportunities.
📈 Market Analysis
Bitcoin's market direction depends on buying pressure, selling activity, trading volume, and overall market sentiment. If BTC/USDT breaks above a key resistance level with strong volume, the price may continue moving upward. However, if selling pressure increases, Bitcoin could experience a short-term correction.
🎯 Key Levels to Watch
- Resistance: Watch recent price highs for possible breakout opportunities.
- Support: Monitor recent price lows where buyers may enter the market.
- Volume: Higher trading volume can help confirm a price breakout.
- Trend: Monitor the 4-hour and daily charts to understand the market direction.
🔮 Market Outlook
BTC/USDT may continue its upward movement if buyers maintain strong momentum and the price breaks above resistance. On the other hand, losing an important support level could lead to further downside.
Traders should monitor market conditions carefully and avoid making decisions based on predictions alone.
✅ Conclusion
Bitcoin remains an important cryptocurrency to watch. Technical analysis, market sentiment, and risk management can help traders make more informed decisions. Always use stop-loss orders when appropriate and never risk more than you can afford to loss.
1
81
·
--
Übersetzung ansehen
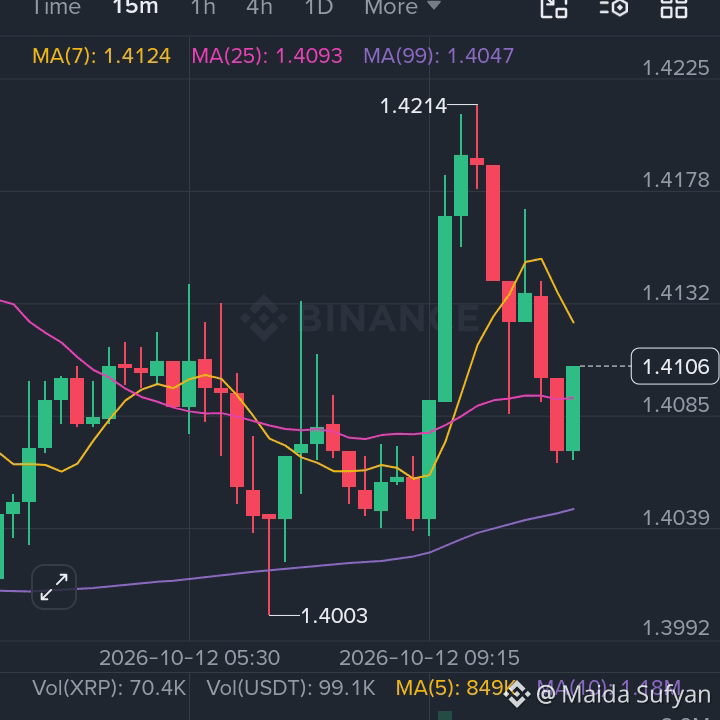
$XRP
Trend: Neutral to bearish in the short term.
Support: $1.34–$1.37.
Resistance: $1.43–$1.45.
Bullish scenario: A breakout above $1.45 could indicate improving momentum.
Bearish scenario: A break below $1.34 could lead to further weakness.$XRP
{spot}(XRPUSDT)
#XRPLedgerPatchesXRPCreationBug #STRKRisesAbout20%In24Hours
$XRP
Trend: Neutral to bearish in the short term.
Support: $1.34–$1.37.
Resistance: $1.43–$1.45.
Bullish scenario: A breakout above $1.45 could indicate improving momentum.
Bearish scenario: A break below $1.34 could lead to further weakness.$XRP
#XRPLedgerPatchesXRPCreationBug #STRKRisesAbout20%In24Hours
Trend: Neutral to bearish in the short term.
Support: $1.34–$1.37.
Resistance: $1.43–$1.45.
Bullish scenario: A breakout above $1.45 could indicate improving momentum.
Bearish scenario: A break below $1.34 could lead to further weakness.$XRP
#XRPLedgerPatchesXRPCreationBug #STRKRisesAbout20%In24Hours
88
·
--
Übersetzung ansehen
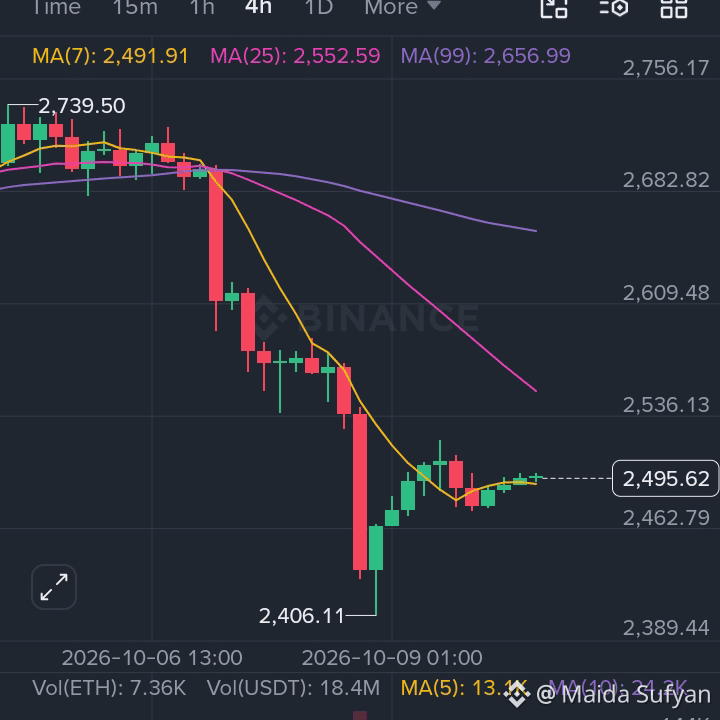
$ETH
Trend: Mixed, with a potentially bullish outlook on the daily chart.
Support: $2,460 and $2,410.
Resistance: $2,510 and $2,570.
Bullish scenario: A break above $2,510 may open the way toward $2,570.
Bearish scenario: A drop below $2,460 may lead to further weakness.
{spot}(ETHUSDT)
#XRPLedgerPatchesXRPCreationBug #STRKRisesAbout20%In24Hours #CFTCMovesToFoldEventContractsIntoSwapsRules
$ETH
Trend: Mixed, with a potentially bullish outlook on the daily chart.
Support: $2,460 and $2,410.
Resistance: $2,510 and $2,570.
Bullish scenario: A break above $2,510 may open the way toward $2,570.
Bearish scenario: A drop below $2,460 may lead to further weakness.
#XRPLedgerPatchesXRPCreationBug #STRKRisesAbout20%In24Hours #CFTCMovesToFoldEventContractsIntoSwapsRules
Trend: Mixed, with a potentially bullish outlook on the daily chart.
Support: $2,460 and $2,410.
Resistance: $2,510 and $2,570.
Bullish scenario: A break above $2,510 may open the way toward $2,570.
Bearish scenario: A drop below $2,460 may lead to further weakness.
#XRPLedgerPatchesXRPCreationBug #STRKRisesAbout20%In24Hours #CFTCMovesToFoldEventContractsIntoSwapsRules
101
·
--
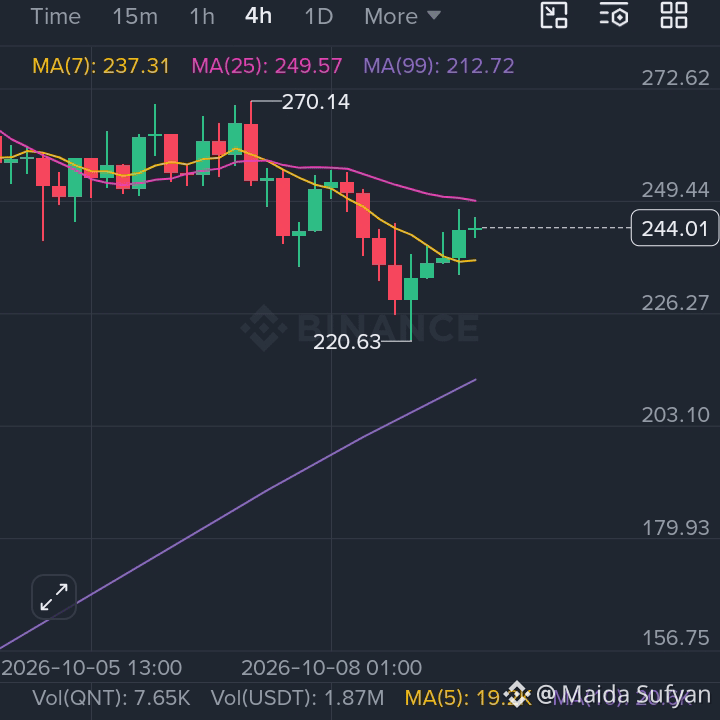
$QNT.US 🟢 Unterstützung: $221
🔴 Widerstand: $253
📈 Bullisches Signal: Ein Ausbruch über $253 könnte auf eine Aufwärtsdynamik hindeuten.
📉 Bärisches Signal: Ein Durchbruch unter $221 könnte auf eine weitere Schwäche hindeuten.
⚠️ Markttrend: Volatil, mit gemischten kurzfristigen Signalen.
{stock_us}(QNT.US)
$QNT.US 🟢 Unterstützung: $221
🔴 Widerstand: $253
📈 Bullisches Signal: Ein Ausbruch über $253 könnte auf eine Aufwärtsdynamik hindeuten.
📉 Bärisches Signal: Ein Durchbruch unter $221 könnte auf eine weitere Schwäche hindeuten.
⚠️ Markttrend: Volatil, mit gemischten kurzfristigen Signalen.
🔴 Widerstand: $253
📈 Bullisches Signal: Ein Ausbruch über $253 könnte auf eine Aufwärtsdynamik hindeuten.
📉 Bärisches Signal: Ein Durchbruch unter $221 könnte auf eine weitere Schwäche hindeuten.
⚠️ Markttrend: Volatil, mit gemischten kurzfristigen Signalen.
QNTUS+3,30%
747
·
--
Übersetzung ansehen
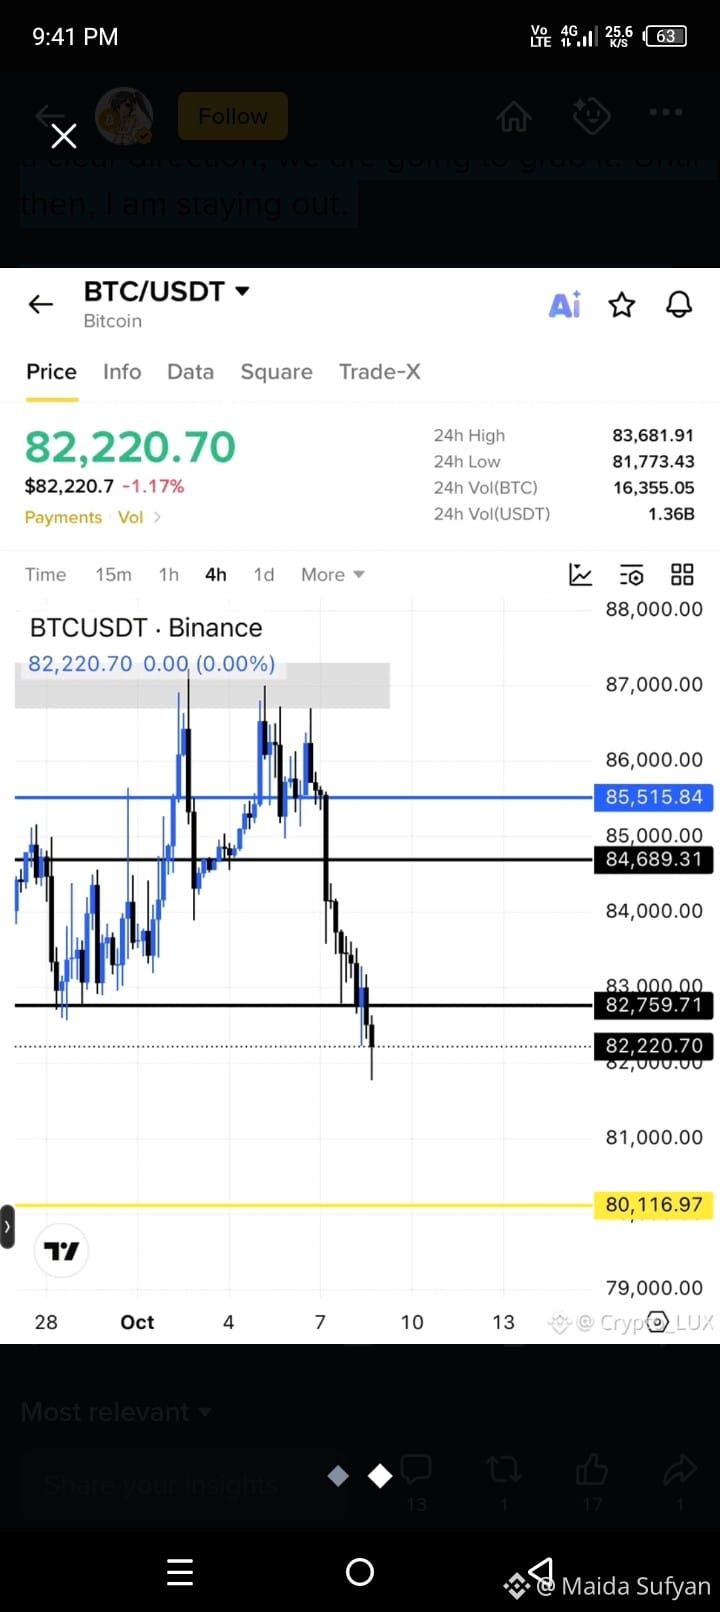
$BTC is under $82,000, but here is what I am looking at. I have been out of the market since yesterday, just watching the moves.
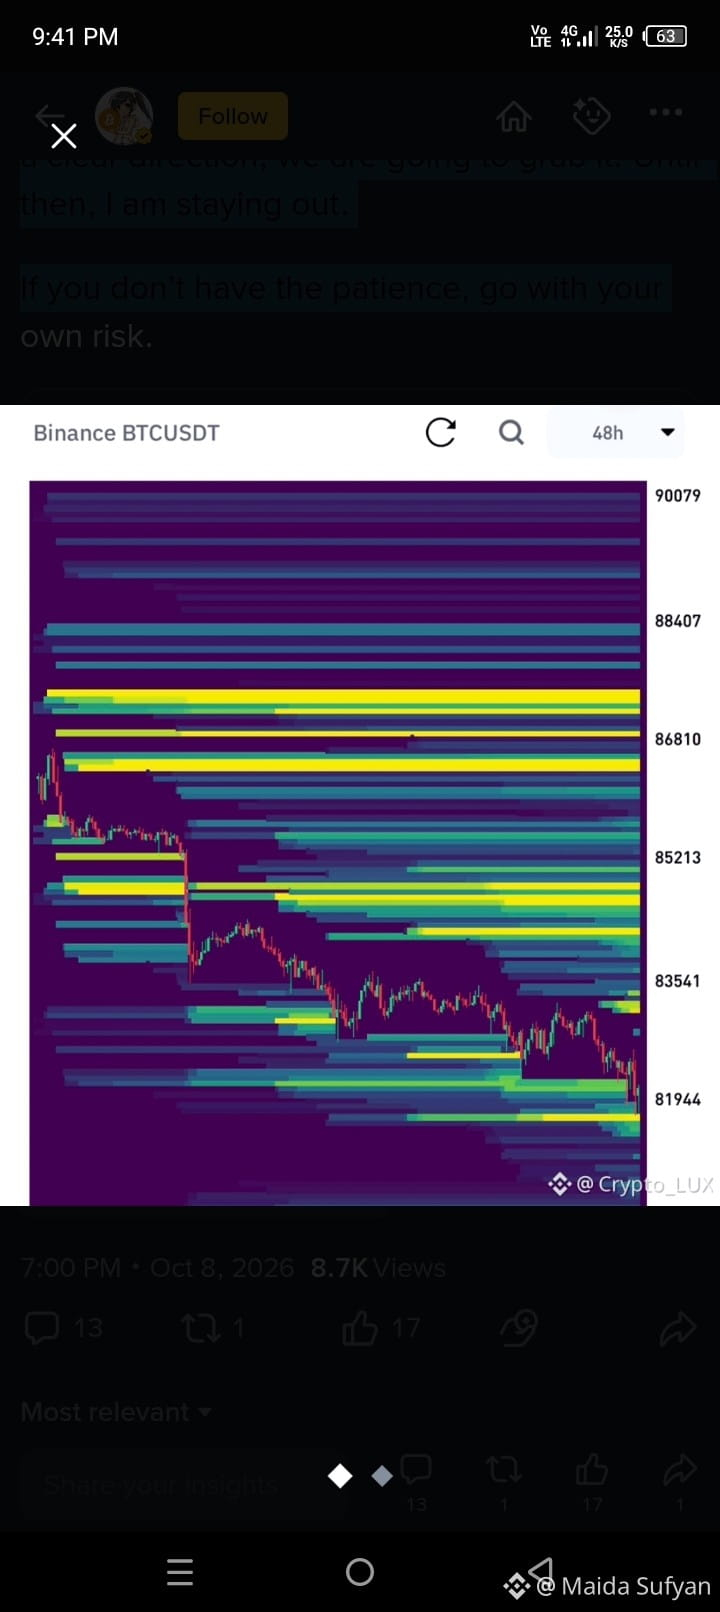
$82,750 still needs to be tested and retraced for a valid move, but the liquidation chart is saying it all. There is a liquidation cluster around $84,000, which I am eyeing at this moment.
The market needs to hit that level first, take out the shorts, and then invalidate the structure shift.
Fundamentals are bad, but this is where the market can trap retail traders. So avoid FOMO for now. What if you miss the move? At least your wallet is protected.
Just hold for a moment. If the market gives us a clear direction, we are going to grab it. Until then, I am staying out.
If you don’t have the patience, go with your own risk .
{spot}(BTCUSDT)
#FedMinutesFocusOnOctoberPause #IMFGrantsWaiverForElSalvadorBitcoinBreach
$BTC is under $82,000, but here is what I am looking at. I have been out of the market since yesterday, just watching the moves.
$82,750 still needs to be tested and retraced for a valid move, but the liquidation chart is saying it all. There is a liquidation cluster around $84,000, which I am eyeing at this moment.
The market needs to hit that level first, take out the shorts, and then invalidate the structure shift.
Fundamentals are bad, but this is where the market can trap retail traders. So avoid FOMO for now. What if you miss the move? At least your wallet is protected.
Just hold for a moment. If the market gives us a clear direction, we are going to grab it. Until then, I am staying out.
If you don’t have the patience, go with your own risk .
#FedMinutesFocusOnOctoberPause #IMFGrantsWaiverForElSalvadorBitcoinBreach
$82,750 still needs to be tested and retraced for a valid move, but the liquidation chart is saying it all. There is a liquidation cluster around $84,000, which I am eyeing at this moment.
The market needs to hit that level first, take out the shorts, and then invalidate the structure shift.
Fundamentals are bad, but this is where the market can trap retail traders. So avoid FOMO for now. What if you miss the move? At least your wallet is protected.
Just hold for a moment. If the market gives us a clear direction, we are going to grab it. Until then, I am staying out.
If you don’t have the patience, go with your own risk .
#FedMinutesFocusOnOctoberPause #IMFGrantsWaiverForElSalvadorBitcoinBreach
57
·
--
Bullisch
$GSB Aktueller Preis: etwa 933 USDT auf Basis aktueller Marktdaten. �
CoinGecko
24H-Trend: leicht bullisch (+1,1%), aber der 7-Tage-Trend ist nach wie vor leicht negativ. �
CoinGecko
Unterstützung: etwa 916–920
Widerstand: etwa 940–960
Ausblick: Ein klarer Ausbruch über 960 könnte den bullischen Impuls verbessern; der Verlust von 916 würde das Setup schwächen.
{spot}(GSBUSDT)
#IMFGrantsWaiverForElSalvadorBitcoinBreach #BinanceLaunchesBinanceIntelligence #IMFSaysTokenizedMarketsSmall
$GSB Aktueller Preis: etwa 933 USDT auf Basis aktueller Marktdaten. �
CoinGecko
24H-Trend: leicht bullisch (+1,1%), aber der 7-Tage-Trend ist nach wie vor leicht negativ. �
CoinGecko
Unterstützung: etwa 916–920
Widerstand: etwa 940–960
Ausblick: Ein klarer Ausbruch über 960 könnte den bullischen Impuls verbessern; der Verlust von 916 würde das Setup schwächen.
#IMFGrantsWaiverForElSalvadorBitcoinBreach #BinanceLaunchesBinanceIntelligence #IMFSaysTokenizedMarketsSmall
CoinGecko
24H-Trend: leicht bullisch (+1,1%), aber der 7-Tage-Trend ist nach wie vor leicht negativ. �
CoinGecko
Unterstützung: etwa 916–920
Widerstand: etwa 940–960
Ausblick: Ein klarer Ausbruch über 960 könnte den bullischen Impuls verbessern; der Verlust von 916 würde das Setup schwächen.
#IMFGrantsWaiverForElSalvadorBitcoinBreach #BinanceLaunchesBinanceIntelligence #IMFSaysTokenizedMarketsSmall
96
·
--
$MOVR
💰 Aktueller Preis: etwa 1,95 $
📈 Trend: Der kurzfristige Trend sieht bullisch/positiv aus.
🟢 Widerstand: 2,06 $, danach 2,38–2,88 $.
🔴 Unterstützung: 1,85–1,90 $; darunter könnte 1,69 $ die nächste Unterstützung sein.
🚀 Bullisches Signal: Ein starker Ausbruch über 2,06 $ könnte den Weg für weitere Kursgewinne ebnen.#IglooShutsDownAbstractBlockchain 🤪
$MOVR
💰 Aktueller Preis: etwa 1,95 $
📈 Trend: Der kurzfristige Trend sieht bullisch/positiv aus.
🟢 Widerstand: 2,06 $, danach 2,38–2,88 $.
🔴 Unterstützung: 1,85–1,90 $; darunter könnte 1,69 $ die nächste Unterstützung sein.
🚀 Bullisches Signal: Ein starker Ausbruch über 2,06 $ könnte den Weg für weitere Kursgewinne ebnen.#IglooShutsDownAbstractBlockchain 🤪
💰 Aktueller Preis: etwa 1,95 $
📈 Trend: Der kurzfristige Trend sieht bullisch/positiv aus.
🟢 Widerstand: 2,06 $, danach 2,38–2,88 $.
🔴 Unterstützung: 1,85–1,90 $; darunter könnte 1,69 $ die nächste Unterstützung sein.
🚀 Bullisches Signal: Ein starker Ausbruch über 2,06 $ könnte den Weg für weitere Kursgewinne ebnen.#IglooShutsDownAbstractBlockchain 🤪
386
·
--
$MOVR
{spot}(MOVRUSDT)
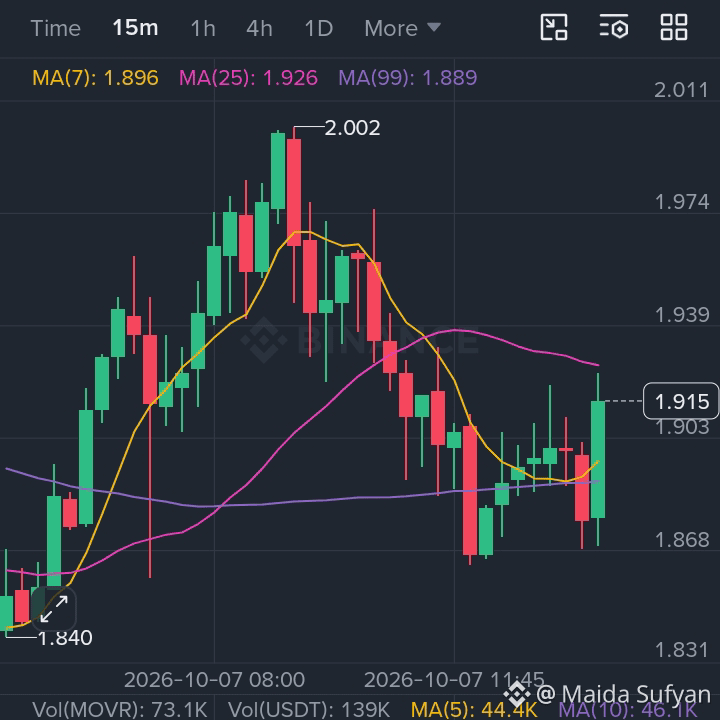
wird zum Stand vom 2026-10-07 bei $1.911 gehandelt, ein Plus von 2.52% in den vergangenen 24 Stunden. Die 24-Stunden-Spanne liegt bei $1.807–$2.002. Der Preis befindet sich damit derzeit in der oberen Hälfte dieser Spanne, was auf eine leichte positive Dynamik hindeutet.#BinanceLaunchesBinanceIntelligence #SECApproves3XBitcoinETF #IglooShutsDownAbstractBlockchain
$MOVR
wird zum Stand vom 2026-10-07 bei $1.911 gehandelt, ein Plus von 2.52% in den vergangenen 24 Stunden. Die 24-Stunden-Spanne liegt bei $1.807–$2.002. Der Preis befindet sich damit derzeit in der oberen Hälfte dieser Spanne, was auf eine leichte positive Dynamik hindeutet.#BinanceLaunchesBinanceIntelligence #SECApproves3XBitcoinETF #IglooShutsDownAbstractBlockchain
wird zum Stand vom 2026-10-07 bei $1.911 gehandelt, ein Plus von 2.52% in den vergangenen 24 Stunden. Die 24-Stunden-Spanne liegt bei $1.807–$2.002. Der Preis befindet sich damit derzeit in der oberen Hälfte dieser Spanne, was auf eine leichte positive Dynamik hindeutet.#BinanceLaunchesBinanceIntelligence #SECApproves3XBitcoinETF #IglooShutsDownAbstractBlockchain
361
·
--
Übersetzung ansehen
Tokenization could change how the world accesses equity markets - but this won't happen overnight.
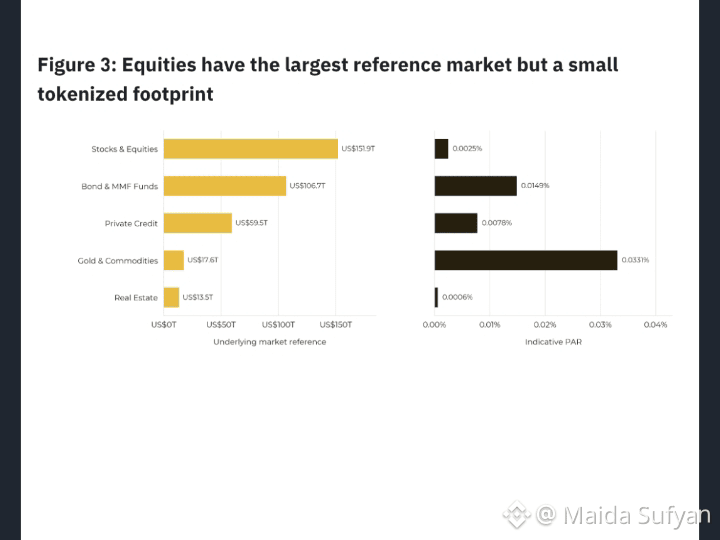
Tokenized equities grew 390% in 2026, yet cover just 0.0029% of the US$151.9T listed equity market.
Binance Research's base case: approximately US$349B by 2030, up from US$4.43B today.
Tokenization could change how the world accesses equity markets - but this won't happen overnight.
Tokenized equities grew 390% in 2026, yet cover just 0.0029% of the US$151.9T listed equity market.
Binance Research's base case: approximately US$349B by 2030, up from US$4.43B today.
Tokenized equities grew 390% in 2026, yet cover just 0.0029% of the US$151.9T listed equity market.
Binance Research's base case: approximately US$349B by 2030, up from US$4.43B today.
65
·
--
$MUBARAK
{future}(MUBARAKUSDT)
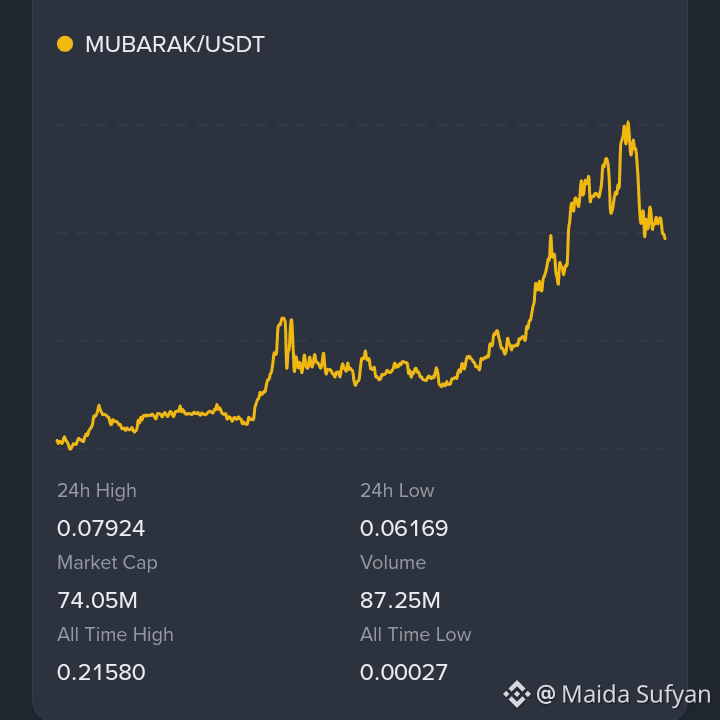
liegt zum Stand vom 2026-10-04 bei $0.07293, ein Plus von 17.3% in den vergangenen 24 Stunden. Er wurde zwischen $0.06169 und $0.07924 gehandelt und zeigt eine starke Dynamik, aber auch die für Meme-Token typische hohe Volatilität im Tagesverlauf. Die Spot-Daten von Binance weisen außerdem ein 24-Stunden-Quote-Volumen von rund $19.1M aus, was auf eine aktive Liquidität hindeutet; scharfe Kursumkehrungen bleiben jedoch ein wesentliches Risiko.#FedOctoberRateHikeOddsFallTo17% #GreekPoliceBustCryptoScamRingArrest17 🤭
$MUBARAK
liegt zum Stand vom 2026-10-04 bei $0.07293, ein Plus von 17.3% in den vergangenen 24 Stunden. Er wurde zwischen $0.06169 und $0.07924 gehandelt und zeigt eine starke Dynamik, aber auch die für Meme-Token typische hohe Volatilität im Tagesverlauf. Die Spot-Daten von Binance weisen außerdem ein 24-Stunden-Quote-Volumen von rund $19.1M aus, was auf eine aktive Liquidität hindeutet; scharfe Kursumkehrungen bleiben jedoch ein wesentliches Risiko.#FedOctoberRateHikeOddsFallTo17% #GreekPoliceBustCryptoScamRingArrest17 🤭
liegt zum Stand vom 2026-10-04 bei $0.07293, ein Plus von 17.3% in den vergangenen 24 Stunden. Er wurde zwischen $0.06169 und $0.07924 gehandelt und zeigt eine starke Dynamik, aber auch die für Meme-Token typische hohe Volatilität im Tagesverlauf. Die Spot-Daten von Binance weisen außerdem ein 24-Stunden-Quote-Volumen von rund $19.1M aus, was auf eine aktive Liquidität hindeutet; scharfe Kursumkehrungen bleiben jedoch ein wesentliches Risiko.#FedOctoberRateHikeOddsFallTo17% #GreekPoliceBustCryptoScamRingArrest17 🤭
1
256
·
--
Übersetzung ansehen
$IO
{spot}(IOUSDT)
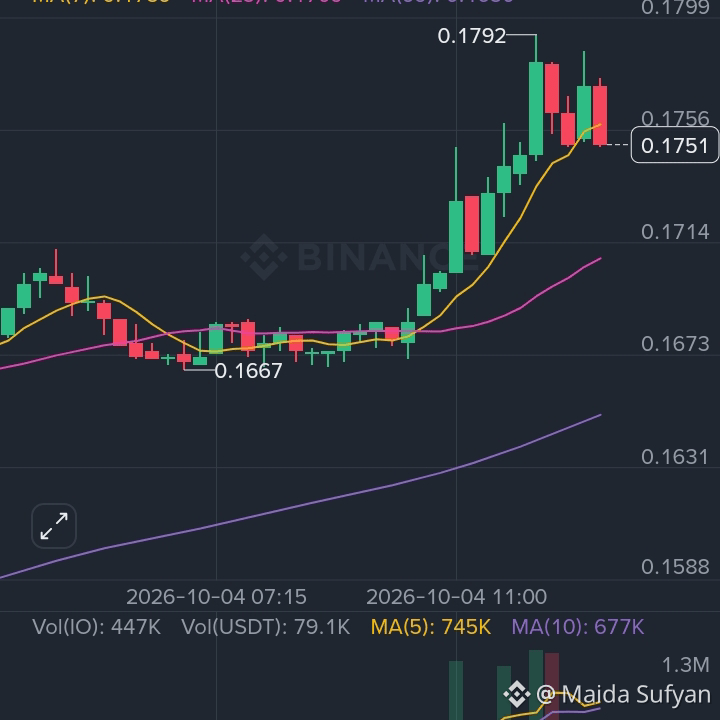
#NvidiaHitsRecordHighUp2.4% #CerebrasSinksNearly20%OnReportNvidiaToPowerOpenAI is trading at $0.1755 as of 2026-10-04, up +15.2% over the last 24 hours. It moved from a $0.1524 open to a $0.1792 high, so momentum is strong but the price is also close to the day’s high.
The key near-term question is whether IO can hold above its earlier breakout area around the day’s open; sustained volume would support continued interest, while a move back below that area would show the rally is losing strength. Its AI/infrastructure narrative can amplify volatility, so sharp reversals remain possible.#SECHaltsCryptoETFReviewsAmidFundingLapse
$IO
#NvidiaHitsRecordHighUp2.4% #CerebrasSinksNearly20%OnReportNvidiaToPowerOpenAI is trading at $0.1755 as of 2026-10-04, up +15.2% over the last 24 hours. It moved from a $0.1524 open to a $0.1792 high, so momentum is strong but the price is also close to the day’s high.
The key near-term question is whether IO can hold above its earlier breakout area around the day’s open; sustained volume would support continued interest, while a move back below that area would show the rally is losing strength. Its AI/infrastructure narrative can amplify volatility, so sharp reversals remain possible.#SECHaltsCryptoETFReviewsAmidFundingLapse
#NvidiaHitsRecordHighUp2.4% #CerebrasSinksNearly20%OnReportNvidiaToPowerOpenAI is trading at $0.1755 as of 2026-10-04, up +15.2% over the last 24 hours. It moved from a $0.1524 open to a $0.1792 high, so momentum is strong but the price is also close to the day’s high.
The key near-term question is whether IO can hold above its earlier breakout area around the day’s open; sustained volume would support continued interest, while a move back below that area would show the rally is losing strength. Its AI/infrastructure narrative can amplify volatility, so sharp reversals remain possible.#SECHaltsCryptoETFReviewsAmidFundingLapse
2
201
Anmelden und weiter Inhalte entdecken
Krypto-Nutzer weltweit auf Binance Square kennenlernen
⚡️ Bleib in Sachen Krypto stets am Puls.
💬 Die weltgrößte Kryptobörse vertraut darauf.
👍 Erhalte verlässliche Einblicke von verifizierten Creators.
E-Mail-Adresse/Telefonnummer
Trendthemen
AnthropicToDebutAfter$83IPOPricing
15,333 Aufrufe
189 Kommentare
Aktienindex-Futures kaum verändert, während Anthropic den IPO-Preis vor dem Börsengang auf 83 US-Dollar festlegt
Binance News
·8 Likes
·7.8k Aufrufe
BTCRemainsUnderPressureAfterHawkishFOMCMinutes
57,463 Aufrufe
1,488 Kommentare
NvidiaBoardReportedlySplitOverHuang’sReturn
19,065 Aufrufe
746 Kommentare