

KingNo1 Trader
22 Beiträge

KingNo1 Trader
Melden
Nutzer blockieren
Trade eröffnen
Hochfrequenz-Trader
2.8 Jahre
11 Following
3 Follower
3 Like gegeben
Beiträge
Portfolio
$GTC
{future}(GTCUSDT)
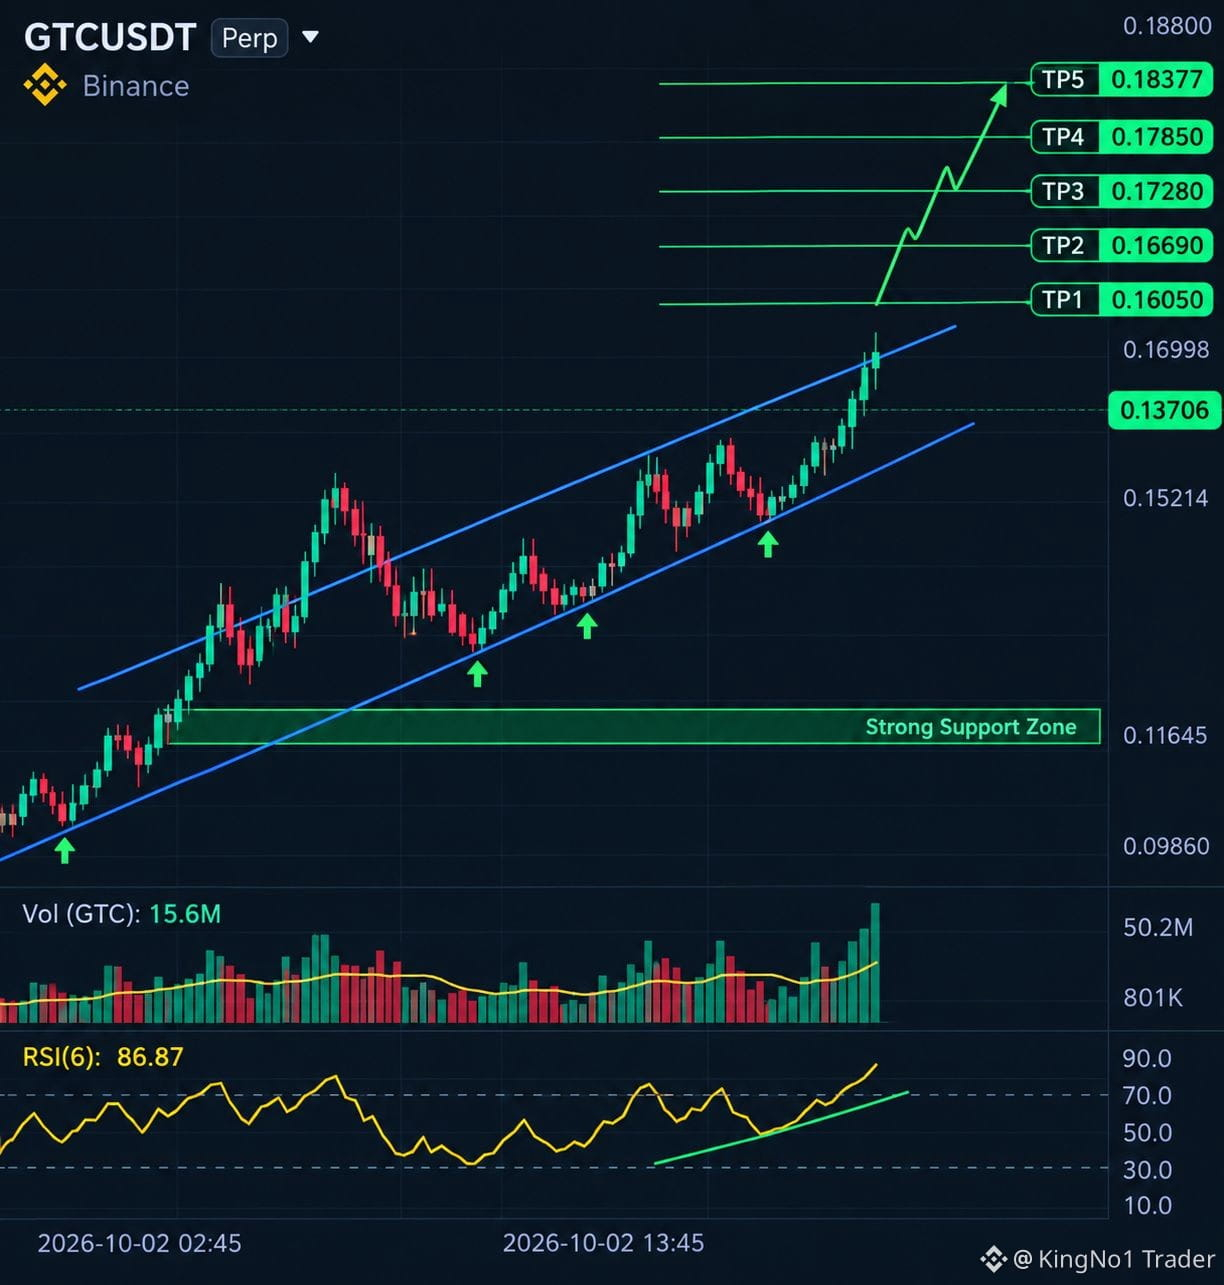
GTCUSDT zeigt nach der Erholung von der Support-Zone bei 0.11645 eine starke bullische Dynamik. Der Preis bildet innerhalb einer aufsteigenden Trendstruktur höhere Hochs und höhere Tiefs, während ein zunehmendes Volumen die aktuelle Aufwärtsbewegung unterstützt. Ein anhaltender Ausbruch über den Widerstandsbereich bei 0.15214 könnte die bullische Fortsetzung Richtung höherer Kursniveaus verstärken.
Die prognostizierten Aufwärtsziele sind TP1: 0.16050, TP2: 0.16690, TP3: 0.17280, TP4: 0.17850 und TP5: 0.18377. Der Bereich 0.11645–0.12000 bleibt eine wichtige Support-Zone; wenn die bullische Struktur oberhalb dieses Bereichs erhalten bleibt, bleibt das Aufwärts-Szenario technisch intakt. Der RSI ist bereits erhöht, daher können kurzfristige Rücksetzer oder Konsolidierungen auftreten, bevor es zu einer weiteren Fortsetzung kommt.
#BitcoinFundingRateTriplesTo10% #XRPPostsFirstThreeGreenMonthsInQ3
#GTCUSDT
$GTC
GTCUSDT zeigt nach der Erholung von der Support-Zone bei 0.11645 eine starke bullische Dynamik. Der Preis bildet innerhalb einer aufsteigenden Trendstruktur höhere Hochs und höhere Tiefs, während ein zunehmendes Volumen die aktuelle Aufwärtsbewegung unterstützt. Ein anhaltender Ausbruch über den Widerstandsbereich bei 0.15214 könnte die bullische Fortsetzung Richtung höherer Kursniveaus verstärken.
Die prognostizierten Aufwärtsziele sind TP1: 0.16050, TP2: 0.16690, TP3: 0.17280, TP4: 0.17850 und TP5: 0.18377. Der Bereich 0.11645–0.12000 bleibt eine wichtige Support-Zone; wenn die bullische Struktur oberhalb dieses Bereichs erhalten bleibt, bleibt das Aufwärts-Szenario technisch intakt. Der RSI ist bereits erhöht, daher können kurzfristige Rücksetzer oder Konsolidierungen auftreten, bevor es zu einer weiteren Fortsetzung kommt.
#BitcoinFundingRateTriplesTo10% #XRPPostsFirstThreeGreenMonthsInQ3
#GTCUSDT
GTCUSDT zeigt nach der Erholung von der Support-Zone bei 0.11645 eine starke bullische Dynamik. Der Preis bildet innerhalb einer aufsteigenden Trendstruktur höhere Hochs und höhere Tiefs, während ein zunehmendes Volumen die aktuelle Aufwärtsbewegung unterstützt. Ein anhaltender Ausbruch über den Widerstandsbereich bei 0.15214 könnte die bullische Fortsetzung Richtung höherer Kursniveaus verstärken.
Die prognostizierten Aufwärtsziele sind TP1: 0.16050, TP2: 0.16690, TP3: 0.17280, TP4: 0.17850 und TP5: 0.18377. Der Bereich 0.11645–0.12000 bleibt eine wichtige Support-Zone; wenn die bullische Struktur oberhalb dieses Bereichs erhalten bleibt, bleibt das Aufwärts-Szenario technisch intakt. Der RSI ist bereits erhöht, daher können kurzfristige Rücksetzer oder Konsolidierungen auftreten, bevor es zu einer weiteren Fortsetzung kommt.
#BitcoinFundingRateTriplesTo10% #XRPPostsFirstThreeGreenMonthsInQ3
#GTCUSDT
174
Übersetzung ansehen
$MOVR
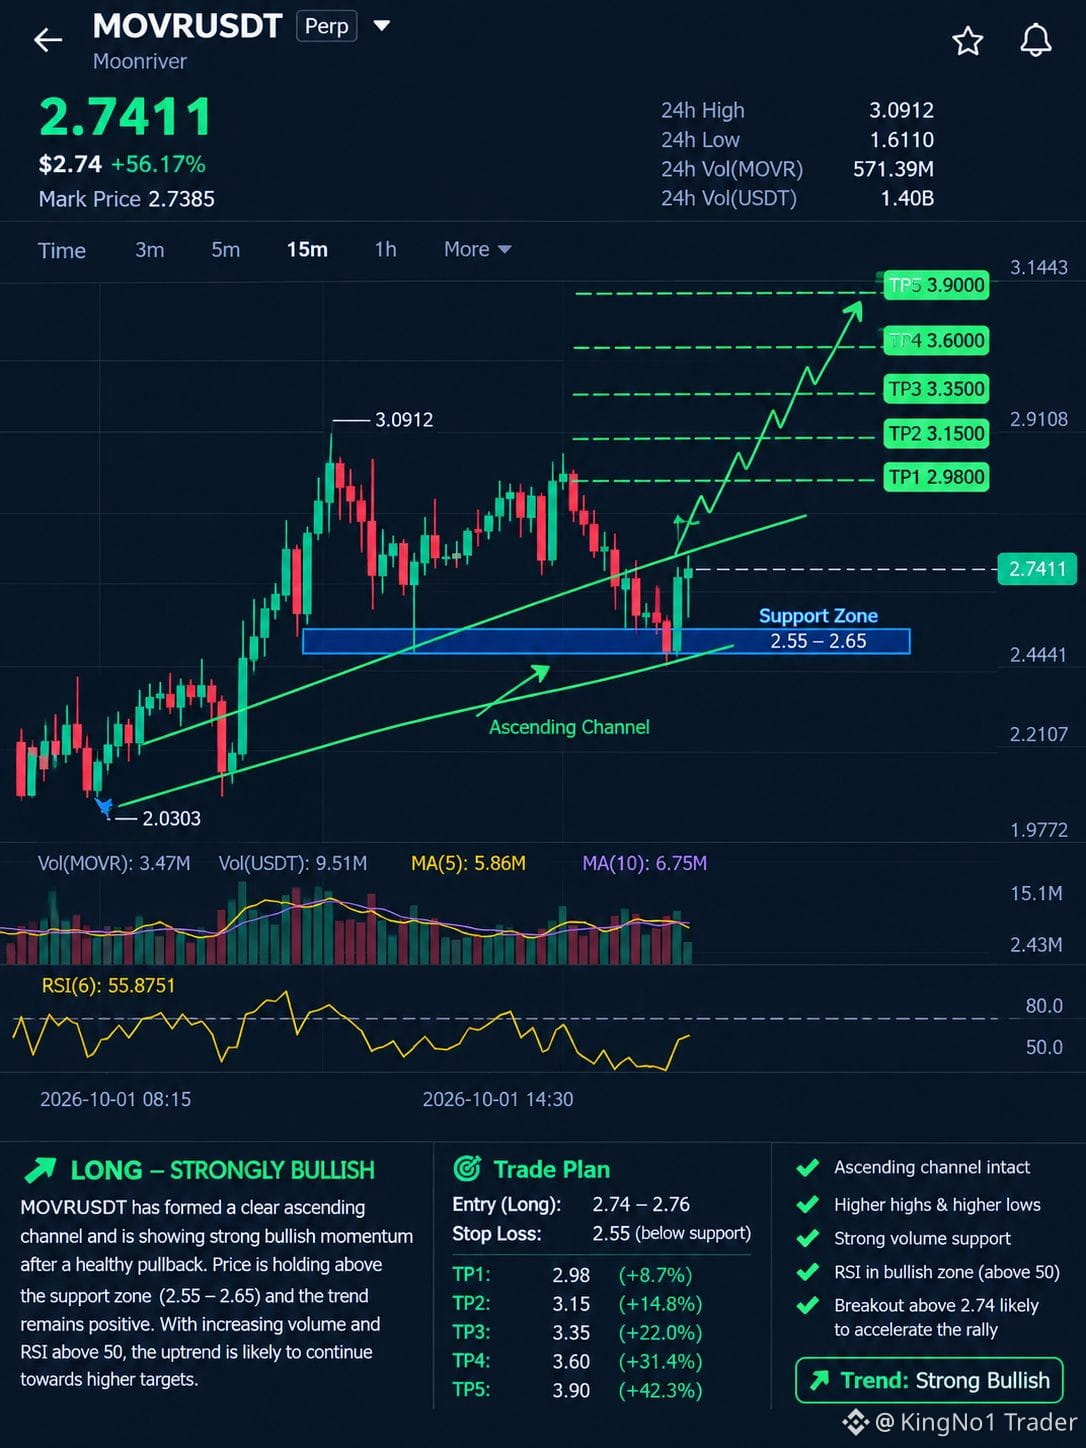
MOVR/USDT is showing a strongly bullish structure, with price holding above the 2.55–2.65 support zone and respecting an ascending channel. The current price around 2.74 suggests bullish momentum is rebuilding, while RSI is above 50, supporting the continuation setup. A sustained move above 2.75–2.80 could open the path toward TP1: 2.98 and TP2: 3.15.
If bullish momentum continues with increasing volume, the next upside levels are TP3: 3.35, TP4: 3.60, and TP5: 3.90. The overall structure remains bullish while price holds the key 2.55–2.65 support area; a decisive break below this zone would weaken the bullish setup.
{future}(MOVRUSDT)
$MOVR
MOVR/USDT is showing a strongly bullish structure, with price holding above the 2.55–2.65 support zone and respecting an ascending channel. The current price around 2.74 suggests bullish momentum is rebuilding, while RSI is above 50, supporting the continuation setup. A sustained move above 2.75–2.80 could open the path toward TP1: 2.98 and TP2: 3.15.
If bullish momentum continues with increasing volume, the next upside levels are TP3: 3.35, TP4: 3.60, and TP5: 3.90. The overall structure remains bullish while price holds the key 2.55–2.65 support area; a decisive break below this zone would weaken the bullish setup.
MOVR/USDT is showing a strongly bullish structure, with price holding above the 2.55–2.65 support zone and respecting an ascending channel. The current price around 2.74 suggests bullish momentum is rebuilding, while RSI is above 50, supporting the continuation setup. A sustained move above 2.75–2.80 could open the path toward TP1: 2.98 and TP2: 3.15.
If bullish momentum continues with increasing volume, the next upside levels are TP3: 3.35, TP4: 3.60, and TP5: 3.90. The overall structure remains bullish while price holds the key 2.55–2.65 support area; a decisive break below this zone would weaken the bullish setup.
273
Übersetzung ansehen
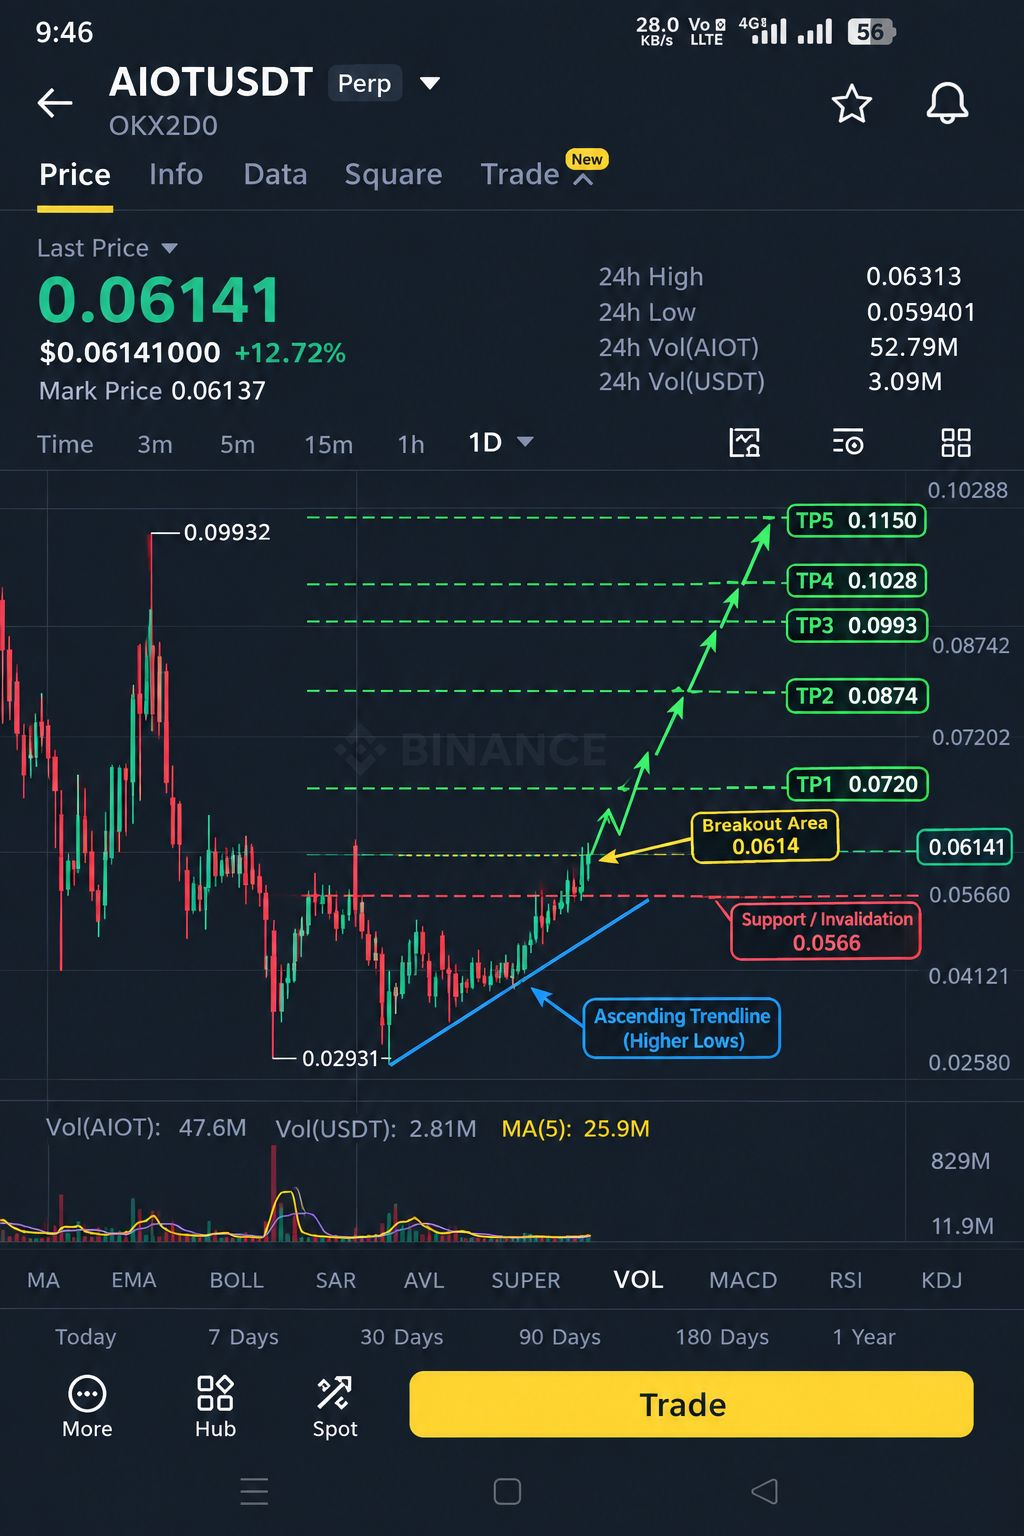
$AIOT AIOT/USDT is showing a strong bullish structure after breaking above the 0.0566 resistance/support zone and pushing toward 0.0614–0.0615. The ascending trendline is producing higher lows, while the recent upward expansion suggests increasing buying momentum. If price sustains above 0.0566 and the breakout remains valid, the bullish continuation structure remains intact. TP1 = 0.0720 is the first major upside target; a clean breakout above TP1 can open the way toward TP2 = 0.0874.
Above TP2, the next major resistance/target is TP3 = 0.0993, which is close to the previous major swing high around 0.09932. A decisive breakout through this area would strengthen the continuation setup toward TP4 = 0.1028. If momentum remains strong and buyers maintain control, the extended bullish target is TP5 = 0.1150. The key level to watch on any pullback is 0.0566; sustained trading below that level would weaken this bullish setup.
{future}(AIOTUSDT)
$AIOT AIOT/USDT is showing a strong bullish structure after breaking above the 0.0566 resistance/support zone and pushing toward 0.0614–0.0615. The ascending trendline is producing higher lows, while the recent upward expansion suggests increasing buying momentum. If price sustains above 0.0566 and the breakout remains valid, the bullish continuation structure remains intact. TP1 = 0.0720 is the first major upside target; a clean breakout above TP1 can open the way toward TP2 = 0.0874.
Above TP2, the next major resistance/target is TP3 = 0.0993, which is close to the previous major swing high around 0.09932. A decisive breakout through this area would strengthen the continuation setup toward TP4 = 0.1028. If momentum remains strong and buyers maintain control, the extended bullish target is TP5 = 0.1150. The key level to watch on any pullback is 0.0566; sustained trading below that level would weaken this bullish setup.
Above TP2, the next major resistance/target is TP3 = 0.0993, which is close to the previous major swing high around 0.09932. A decisive breakout through this area would strengthen the continuation setup toward TP4 = 0.1028. If momentum remains strong and buyers maintain control, the extended bullish target is TP5 = 0.1150. The key level to watch on any pullback is 0.0566; sustained trading below that level would weaken this bullish setup.
1
504
Übersetzung ansehen
Patience, Patience & Patience
Only one strategy that always works.
That is Patience.
Patience, Patience & Patience
Only one strategy that always works.
That is Patience.
Only one strategy that always works.
That is Patience.
1
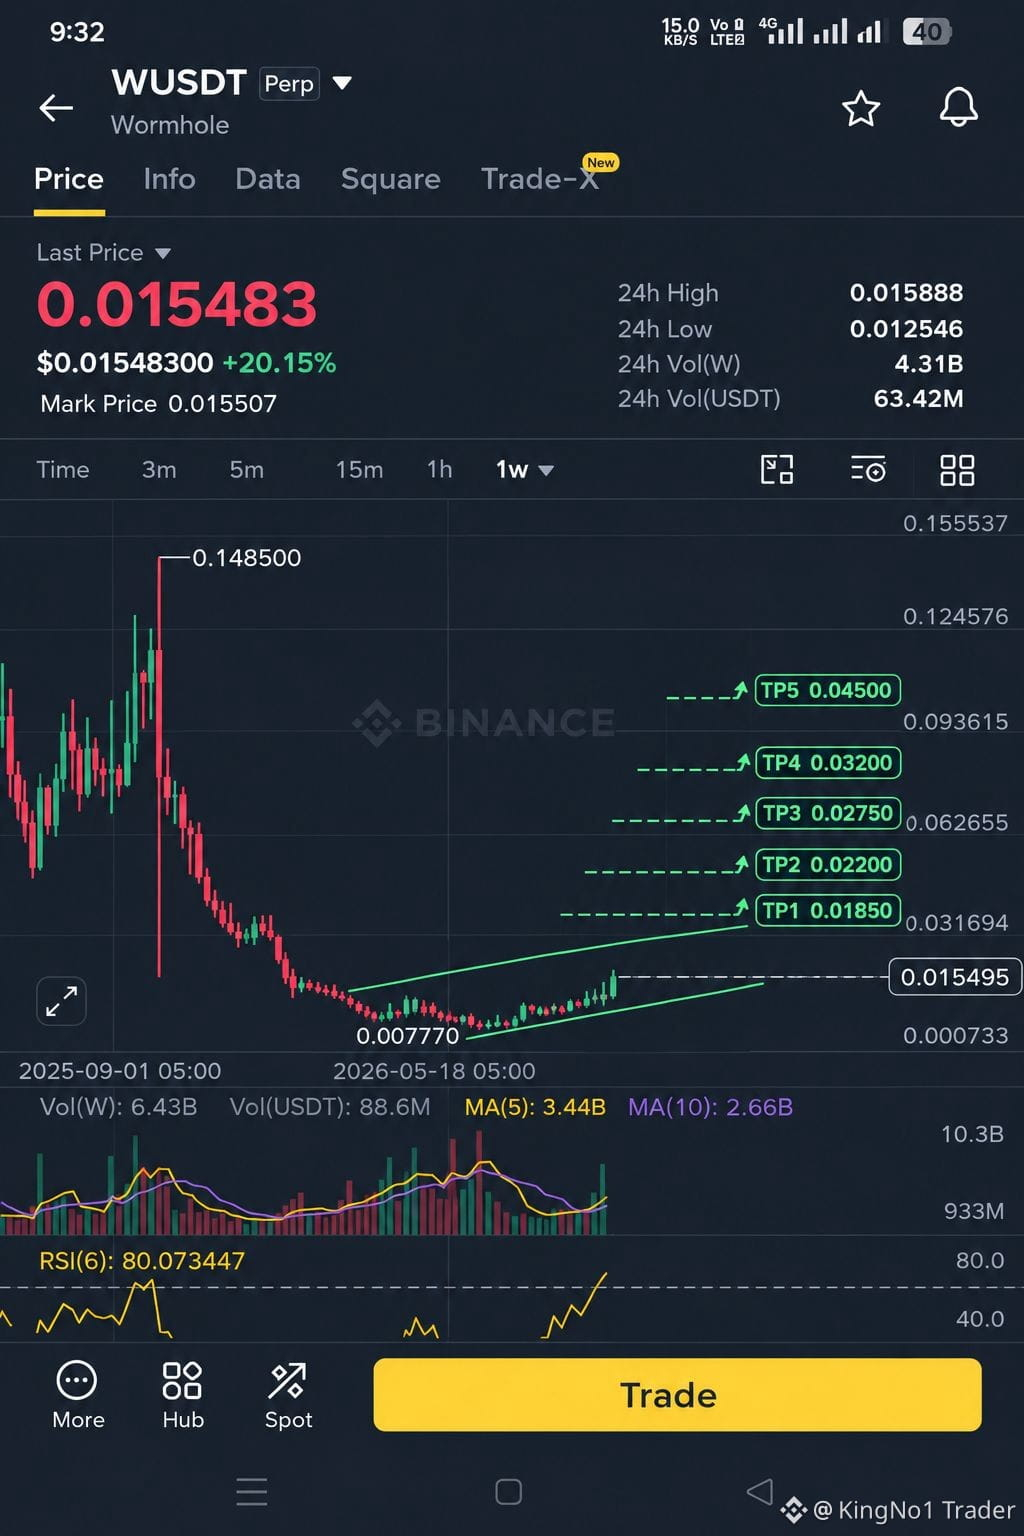
$W WUSDT zeigt eine starke bullische Umkehrstruktur: Der Kurs bricht nach oben aus der langfristigen Basis bei etwa 0.007770 aus.
Die ansteigende Trendlinie und das zunehmende Kaufvolumen stützen die Möglichkeit weiterer Aufwärtsdynamik.
Ein anhaltender Ausbruch über 0.01550–0.01590 könnte die bullische Struktur weiter festigen und den Weg zu höheren Widerstandsbereichen öffnen.
{spot}(WUSDT)
TP1: 0.01850 — erstes Aufwärtsziel und anfängliche Ausbruchszone.
TP2: 0.02200
TP3:0.02750
TP4: 0.03200
TP5: 0.04500
$W WUSDT zeigt eine starke bullische Umkehrstruktur: Der Kurs bricht nach oben aus der langfristigen Basis bei etwa 0.007770 aus.
Die ansteigende Trendlinie und das zunehmende Kaufvolumen stützen die Möglichkeit weiterer Aufwärtsdynamik.
Ein anhaltender Ausbruch über 0.01550–0.01590 könnte die bullische Struktur weiter festigen und den Weg zu höheren Widerstandsbereichen öffnen.
TP1: 0.01850 — erstes Aufwärtsziel und anfängliche Ausbruchszone.
TP2: 0.02200
TP3:0.02750
TP4: 0.03200
TP5: 0.04500
Die ansteigende Trendlinie und das zunehmende Kaufvolumen stützen die Möglichkeit weiterer Aufwärtsdynamik.
Ein anhaltender Ausbruch über 0.01550–0.01590 könnte die bullische Struktur weiter festigen und den Weg zu höheren Widerstandsbereichen öffnen.
TP1: 0.01850 — erstes Aufwärtsziel und anfängliche Ausbruchszone.
TP2: 0.02200
TP3:0.02750
TP4: 0.03200
TP5: 0.04500
156
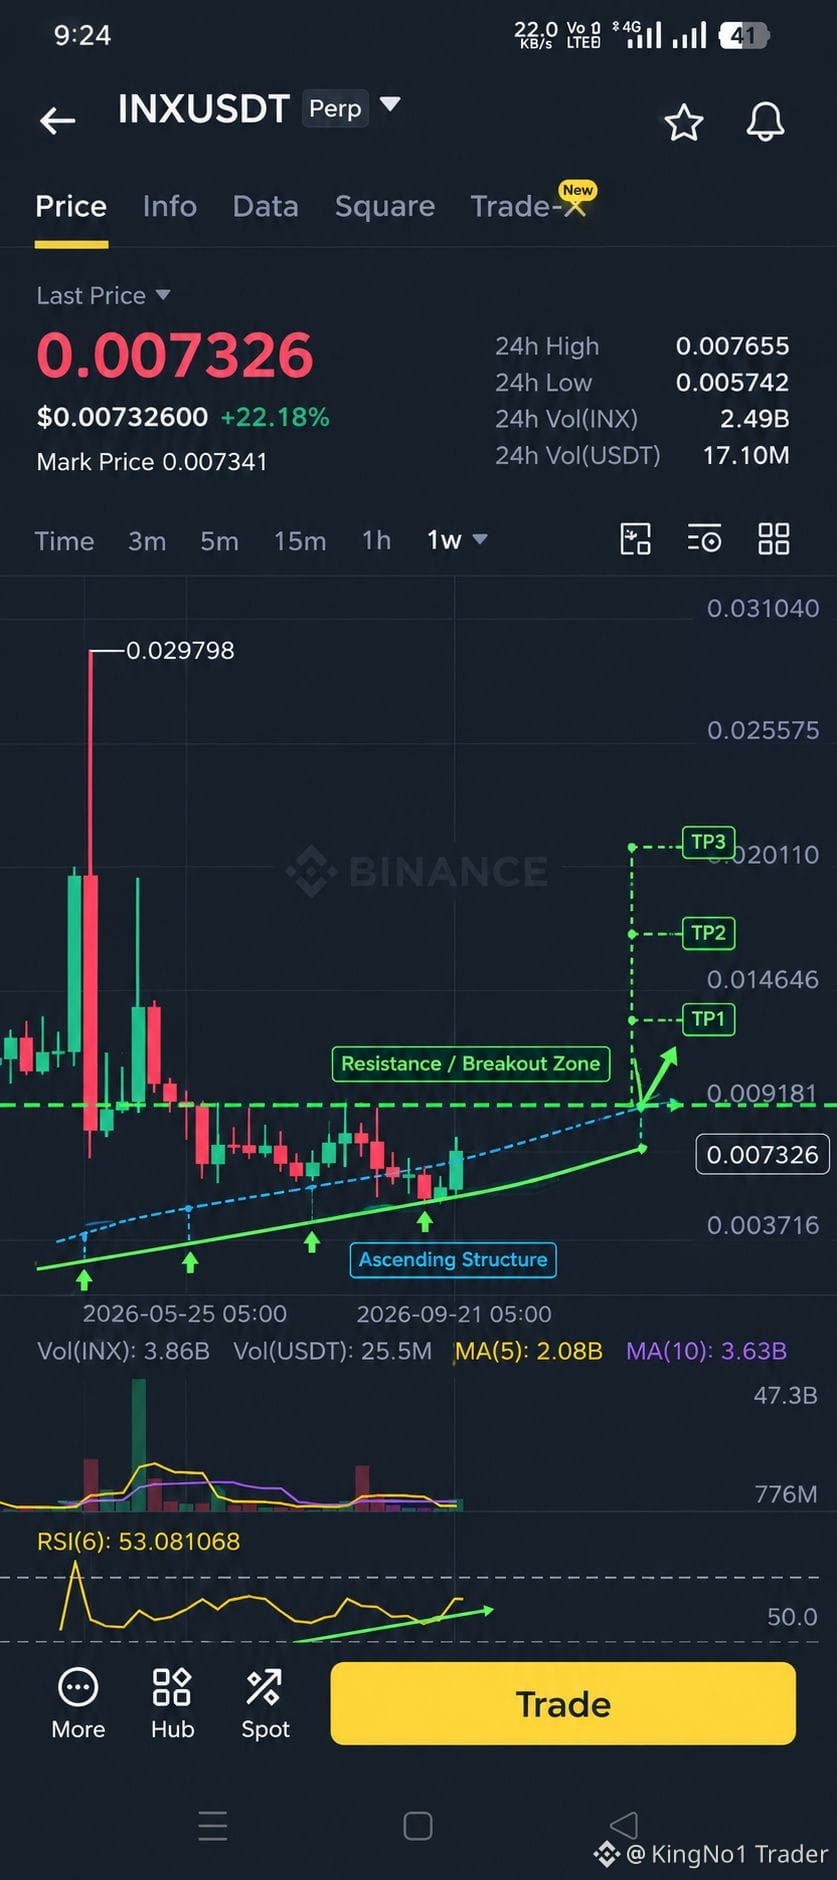
$INX INXUSDT zeigt nach der Bildung eines größeren Tiefs bei etwa 0.004958 eine bullische Struktur. Derzeit liegt der Kurs bei rund 0.007326, wobei sich höhere Tiefs entwickeln und der RSI(6) nahe 53 liegt; dies deutet auf eine verbesserte bullische Dynamik hin. Der zentrale Widerstands-/Breakout-Bereich liegt bei etwa 0.00918; ein starker wöchentlicher Breakout über diese Zone hinweg mit erhöhtem Volumen würde das bullische Setup weiter stärken.
Chancen nach oben:
🎯 TP1: 0.0146
🎯 TP2: 0.018–0.020
🎯 TP3: 0.0255
{future}(INXUSDT)
Die wichtigste strukturelle Unterstützung bleibt bei etwa 0.00495–0.0057. Eine anhaltende Bewegung über 0.00918 würde den Weg zu den oben genannten Zielen eröffnen, während eine Abweisung vom Widerstand zu einer erneuten Konsolidierung/Neu-Tests führen könnte.
$INX INXUSDT zeigt nach der Bildung eines größeren Tiefs bei etwa 0.004958 eine bullische Struktur. Derzeit liegt der Kurs bei rund 0.007326, wobei sich höhere Tiefs entwickeln und der RSI(6) nahe 53 liegt; dies deutet auf eine verbesserte bullische Dynamik hin. Der zentrale Widerstands-/Breakout-Bereich liegt bei etwa 0.00918; ein starker wöchentlicher Breakout über diese Zone hinweg mit erhöhtem Volumen würde das bullische Setup weiter stärken.
Chancen nach oben:
🎯 TP1: 0.0146
🎯 TP2: 0.018–0.020
🎯 TP3: 0.0255
Die wichtigste strukturelle Unterstützung bleibt bei etwa 0.00495–0.0057. Eine anhaltende Bewegung über 0.00918 würde den Weg zu den oben genannten Zielen eröffnen, während eine Abweisung vom Widerstand zu einer erneuten Konsolidierung/Neu-Tests führen könnte.
Chancen nach oben:
🎯 TP1: 0.0146
🎯 TP2: 0.018–0.020
🎯 TP3: 0.0255
Die wichtigste strukturelle Unterstützung bleibt bei etwa 0.00495–0.0057. Eine anhaltende Bewegung über 0.00918 würde den Weg zu den oben genannten Zielen eröffnen, während eine Abweisung vom Widerstand zu einer erneuten Konsolidierung/Neu-Tests führen könnte.
313
Übersetzung ansehen
$ARX
{future}(ARXUSDT)
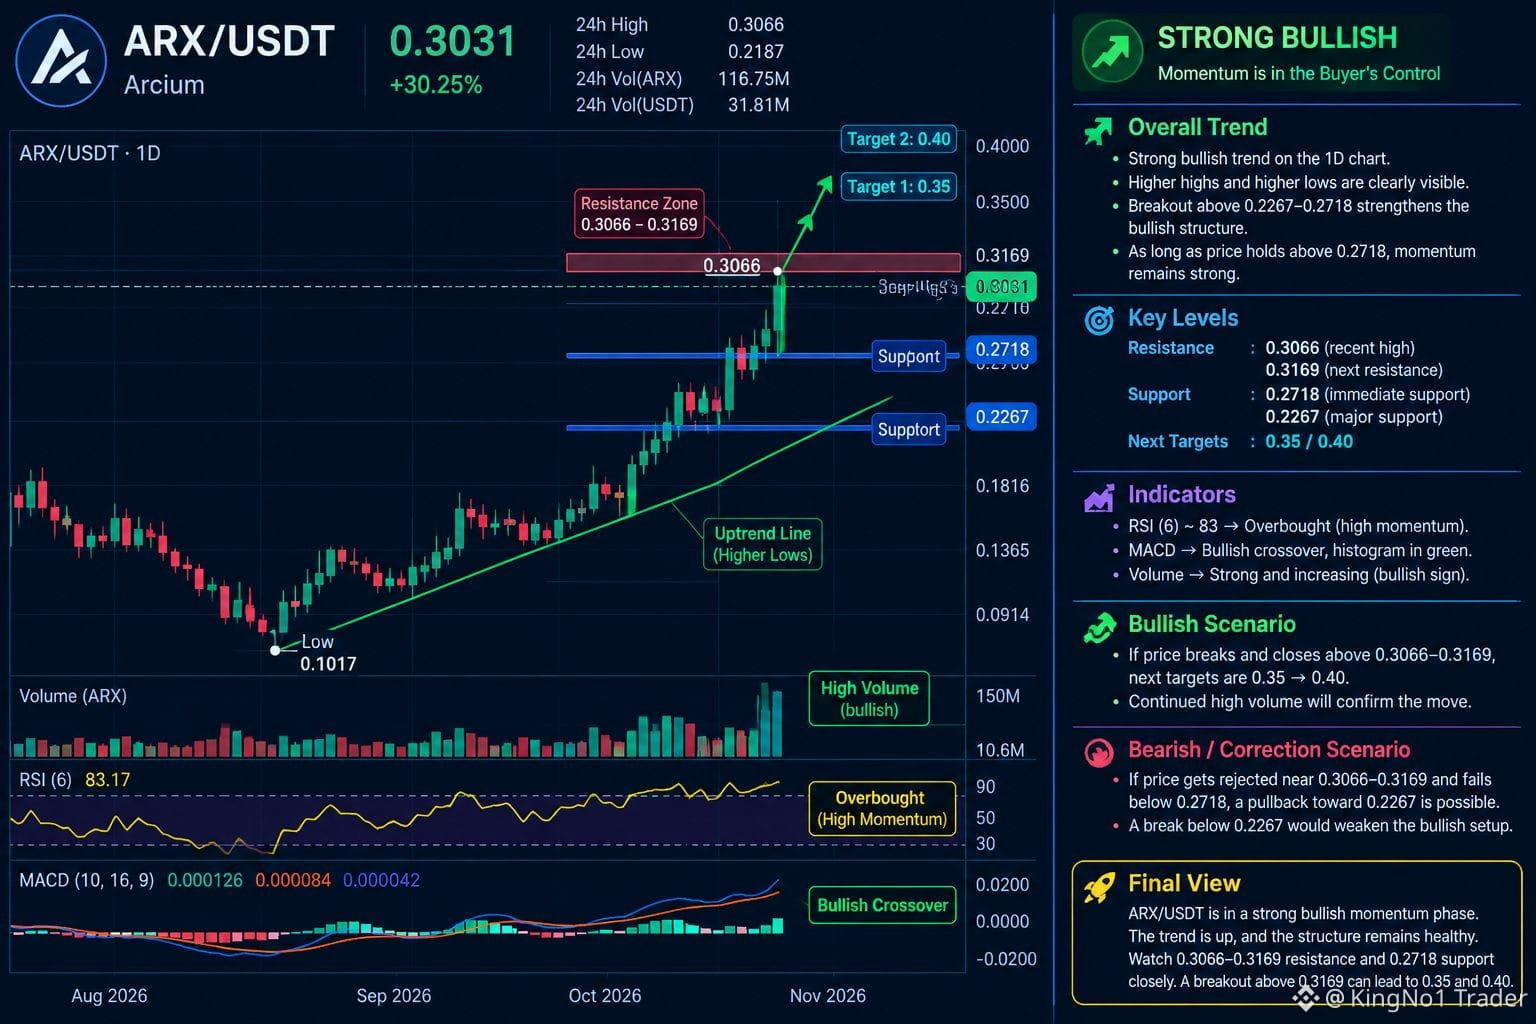
ARX is showing a very strong bullish structure on the 1D chart, with a clear sequence of higher highs and higher lows after forming a major low around 0.1017. Price has now surged to 0.3031, with the recent high at 0.3066, while volume has expanded significantly—confirming strong participation behind the upward move. The breakout above the previous 0.2267–0.2718 area further strengthens the bullish structure. As long as price holds above 0.2718, the current momentum remains technically strong.
Key levels: The immediate resistance is 0.3066, followed by the 0.3169 area. A decisive daily close above 0.3066–0.3169 could expose the next psychological zones around 0.35 and 0.40. RSI is around 83, indicating extremely strong momentum but also an overbought condition, so a short consolidation or pullback can occur without necessarily breaking the bullish structure. The main levels to monitor on any pullback are 0.2718, then 0.2267; holding these areas would keep the broader bullish setup intact.
$ARX
ARX is showing a very strong bullish structure on the 1D chart, with a clear sequence of higher highs and higher lows after forming a major low around 0.1017. Price has now surged to 0.3031, with the recent high at 0.3066, while volume has expanded significantly—confirming strong participation behind the upward move. The breakout above the previous 0.2267–0.2718 area further strengthens the bullish structure. As long as price holds above 0.2718, the current momentum remains technically strong.
Key levels: The immediate resistance is 0.3066, followed by the 0.3169 area. A decisive daily close above 0.3066–0.3169 could expose the next psychological zones around 0.35 and 0.40. RSI is around 83, indicating extremely strong momentum but also an overbought condition, so a short consolidation or pullback can occur without necessarily breaking the bullish structure. The main levels to monitor on any pullback are 0.2718, then 0.2267; holding these areas would keep the broader bullish setup intact.
ARX is showing a very strong bullish structure on the 1D chart, with a clear sequence of higher highs and higher lows after forming a major low around 0.1017. Price has now surged to 0.3031, with the recent high at 0.3066, while volume has expanded significantly—confirming strong participation behind the upward move. The breakout above the previous 0.2267–0.2718 area further strengthens the bullish structure. As long as price holds above 0.2718, the current momentum remains technically strong.
Key levels: The immediate resistance is 0.3066, followed by the 0.3169 area. A decisive daily close above 0.3066–0.3169 could expose the next psychological zones around 0.35 and 0.40. RSI is around 83, indicating extremely strong momentum but also an overbought condition, so a short consolidation or pullback can occur without necessarily breaking the bullish structure. The main levels to monitor on any pullback are 0.2718, then 0.2267; holding these areas would keep the broader bullish setup intact.
8
Übersetzung ansehen
$PUMP
{future}(PUMPUSDT)
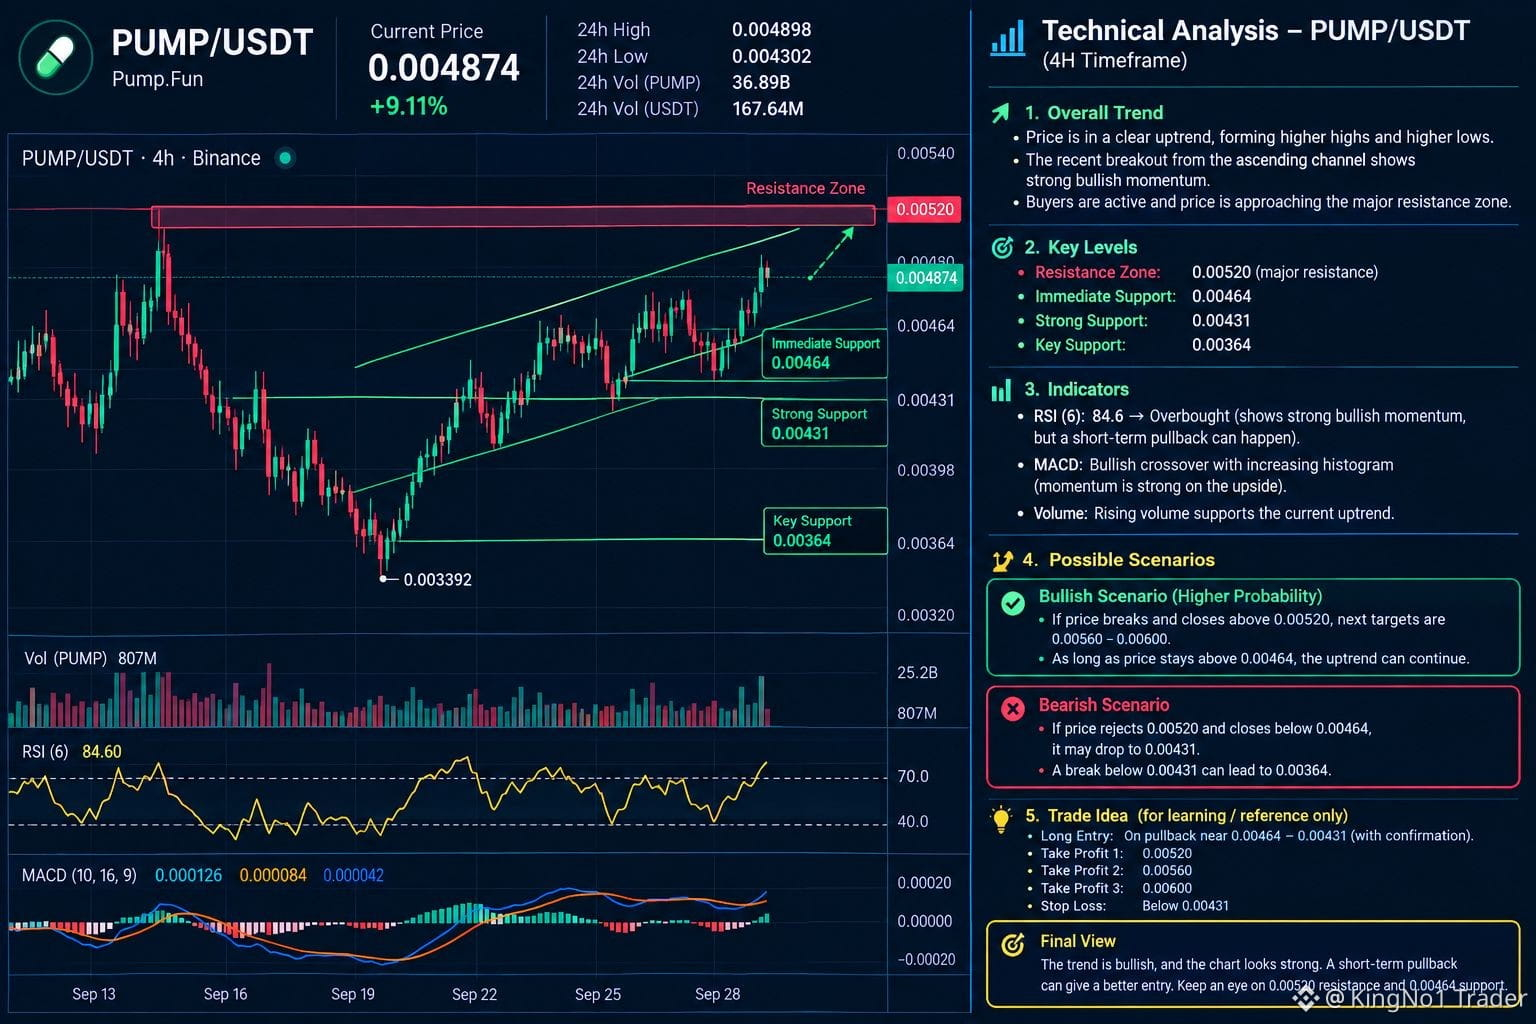
PUMP is making higher highs and higher lows after recovering strongly from the 0.003392 area. Price is currently around 0.004874, very close to the 24H high of 0.004898, showing strong buying momentum.
Resistance: The major resistance is around 0.00490–0.00520. A strong 4H candle close above 0.00520 could open the way toward 0.00560 and potentially 0.00600.
Support Levels: Immediate support is around 0.00464, followed by 0.00431. The stronger lower support is around 0.00364. As long as price holds above 0.00464–0.00431, the bullish structure remains intact.
RSI: RSI is around 84.6, which is strongly overbought. This confirms strong momentum but also increases the possibility of a short-term pullback or consolidation before another move upward.
Bullish Scenario: If PUMP breaks and closes above 0.00520 with strong volume, the next areas to watch are 0.00560 → 0.00600.
Bearish/Correction Scenario: If price gets rejected around 0.00490–0.00520 and falls below 0.00464, a retracement toward 0.00431 becomes possible. A break below 0.00431 would weaken the current bullish structure.
Conclusion: The 4H structure is currently bullish, but chasing the price at the current level carries higher risk because RSI is already overbought. The key levels to watch are 0.00520 resistance and 0.00464 support.
$PUMP
PUMP is making higher highs and higher lows after recovering strongly from the 0.003392 area. Price is currently around 0.004874, very close to the 24H high of 0.004898, showing strong buying momentum.
Resistance: The major resistance is around 0.00490–0.00520. A strong 4H candle close above 0.00520 could open the way toward 0.00560 and potentially 0.00600.
Support Levels: Immediate support is around 0.00464, followed by 0.00431. The stronger lower support is around 0.00364. As long as price holds above 0.00464–0.00431, the bullish structure remains intact.
RSI: RSI is around 84.6, which is strongly overbought. This confirms strong momentum but also increases the possibility of a short-term pullback or consolidation before another move upward.
Bullish Scenario: If PUMP breaks and closes above 0.00520 with strong volume, the next areas to watch are 0.00560 → 0.00600.
Bearish/Correction Scenario: If price gets rejected around 0.00490–0.00520 and falls below 0.00464, a retracement toward 0.00431 becomes possible. A break below 0.00431 would weaken the current bullish structure.
Conclusion: The 4H structure is currently bullish, but chasing the price at the current level carries higher risk because RSI is already overbought. The key levels to watch are 0.00520 resistance and 0.00464 support.
PUMP is making higher highs and higher lows after recovering strongly from the 0.003392 area. Price is currently around 0.004874, very close to the 24H high of 0.004898, showing strong buying momentum.
Resistance: The major resistance is around 0.00490–0.00520. A strong 4H candle close above 0.00520 could open the way toward 0.00560 and potentially 0.00600.
Support Levels: Immediate support is around 0.00464, followed by 0.00431. The stronger lower support is around 0.00364. As long as price holds above 0.00464–0.00431, the bullish structure remains intact.
RSI: RSI is around 84.6, which is strongly overbought. This confirms strong momentum but also increases the possibility of a short-term pullback or consolidation before another move upward.
Bullish Scenario: If PUMP breaks and closes above 0.00520 with strong volume, the next areas to watch are 0.00560 → 0.00600.
Bearish/Correction Scenario: If price gets rejected around 0.00490–0.00520 and falls below 0.00464, a retracement toward 0.00431 becomes possible. A break below 0.00431 would weaken the current bullish structure.
Conclusion: The 4H structure is currently bullish, but chasing the price at the current level carries higher risk because RSI is already overbought. The key levels to watch are 0.00520 resistance and 0.00464 support.
110
Übersetzung ansehen
$KMNO
{spot}(KMNOUSDT)
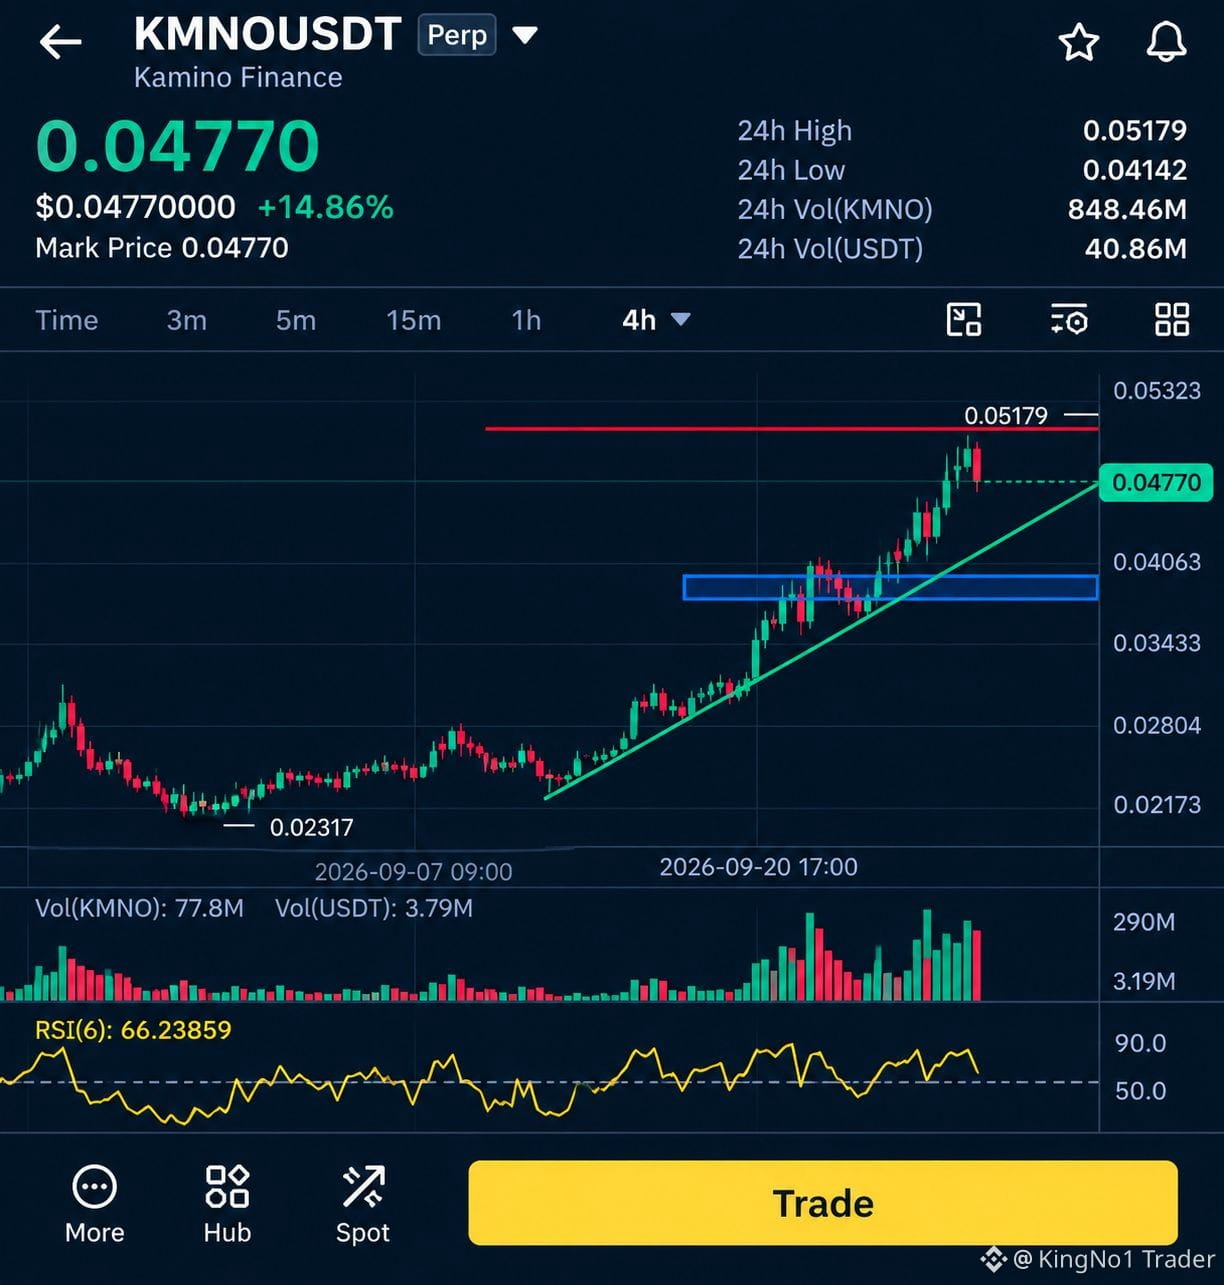
KMNO/USDT is showing a strong bullish uptrend, with a clear ascending trendline and a sequence of higher highs and higher lows. Price is around 0.04770, while the major resistance is near 0.05179; a clean breakout above this level with strong volume could support further upside.
The 0.038–0.040 area is an important support zone, and the rising trendline is also providing dynamic support. RSI is around 66, showing strong momentum without being extremely overbought, so a pullback toward support could be possible before another attempt at the 0.05179 resistance.
$KMNO
KMNO/USDT is showing a strong bullish uptrend, with a clear ascending trendline and a sequence of higher highs and higher lows. Price is around 0.04770, while the major resistance is near 0.05179; a clean breakout above this level with strong volume could support further upside.
The 0.038–0.040 area is an important support zone, and the rising trendline is also providing dynamic support. RSI is around 66, showing strong momentum without being extremely overbought, so a pullback toward support could be possible before another attempt at the 0.05179 resistance.
KMNO/USDT is showing a strong bullish uptrend, with a clear ascending trendline and a sequence of higher highs and higher lows. Price is around 0.04770, while the major resistance is near 0.05179; a clean breakout above this level with strong volume could support further upside.
The 0.038–0.040 area is an important support zone, and the rising trendline is also providing dynamic support. RSI is around 66, showing strong momentum without being extremely overbought, so a pullback toward support could be possible before another attempt at the 0.05179 resistance.
82
·
--
Bullisch
Übersetzung ansehen
$GRASS
{future}(GRASSUSDT)
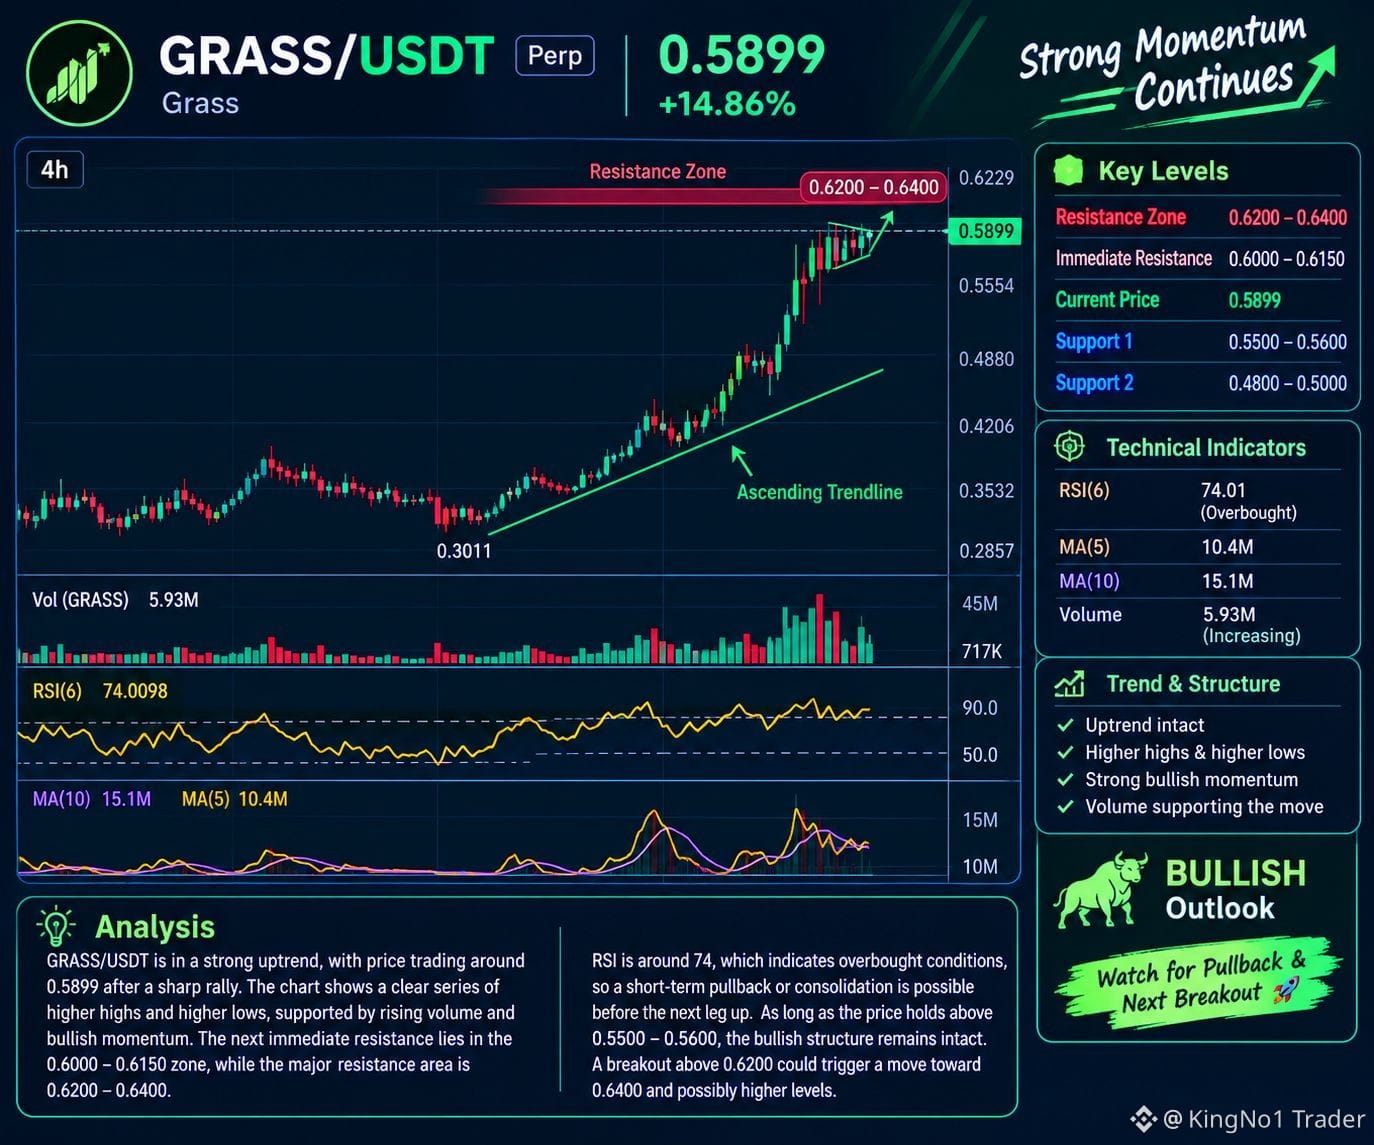
GRASS/USDT is showing a strong bullish structure, with clear higher highs and higher lows after a sharp upward move. Price is currently around 0.5899, with strong momentum and increased volume. The immediate resistance is around 0.6000–0.6150, while the major resistance zone is 0.6200–0.6400.
RSI is around 74, so the market is somewhat overbought and a short-term pullback or consolidation is possible. The key support zone is 0.5500–0.5600; holding above this area keeps the bullish structure intact, while a strong breakout above 0.6200 could open the way toward 0.6400+.
$GRASS
GRASS/USDT is showing a strong bullish structure, with clear higher highs and higher lows after a sharp upward move. Price is currently around 0.5899, with strong momentum and increased volume. The immediate resistance is around 0.6000–0.6150, while the major resistance zone is 0.6200–0.6400.
RSI is around 74, so the market is somewhat overbought and a short-term pullback or consolidation is possible. The key support zone is 0.5500–0.5600; holding above this area keeps the bullish structure intact, while a strong breakout above 0.6200 could open the way toward 0.6400+.
GRASS/USDT is showing a strong bullish structure, with clear higher highs and higher lows after a sharp upward move. Price is currently around 0.5899, with strong momentum and increased volume. The immediate resistance is around 0.6000–0.6150, while the major resistance zone is 0.6200–0.6400.
RSI is around 74, so the market is somewhat overbought and a short-term pullback or consolidation is possible. The key support zone is 0.5500–0.5600; holding above this area keeps the bullish structure intact, while a strong breakout above 0.6200 could open the way toward 0.6400+.
134
·
--
Bullisch
Übersetzung ansehen
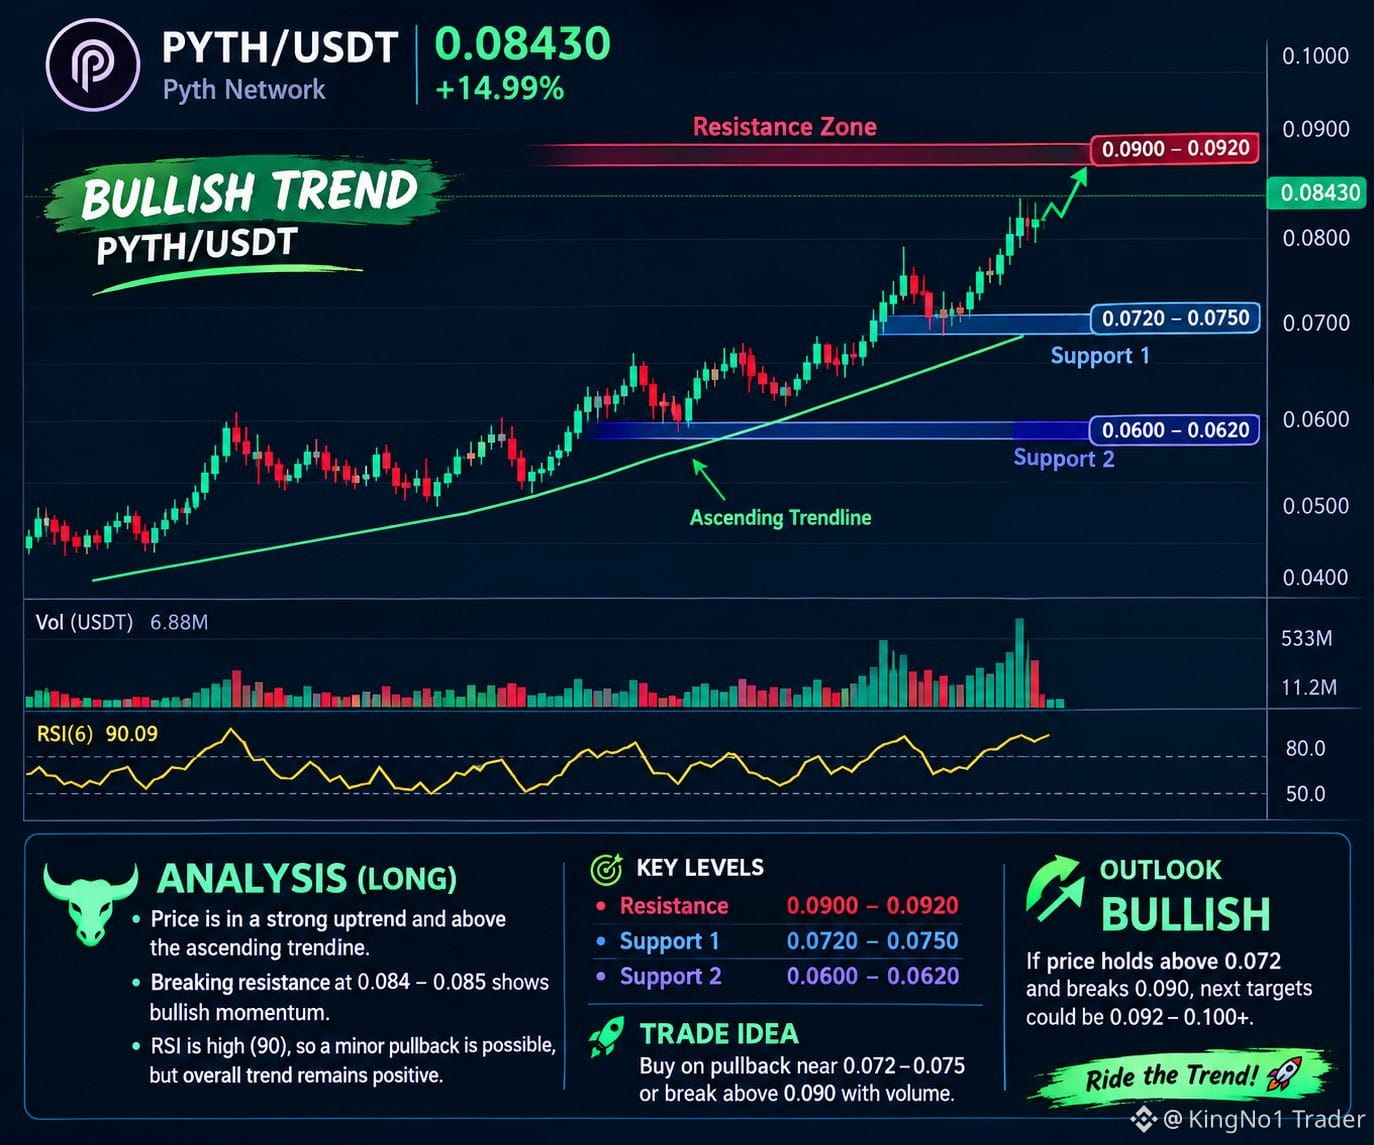
$PYTH PYTH/USDT is showing a strong bullish structure, with price around 0.08430 after a sharp upward move and a clear series of higher highs and higher lows. The 0.084–0.085 area is the immediate breakout zone, while 0.072–0.075 is an important support area. Volume has increased with the rise, supporting the current bullish momentum.
{future}(PYTHUSDT)
However, RSI is around 90, indicating an extremely overbought condition, so a short-term pullback or consolidation is possible before another move higher. If price holds above 0.072–0.075, the next major resistance zone is around 0.090–0.092; a strong breakout above that area could open the way toward 0.10.
$PYTH PYTH/USDT is showing a strong bullish structure, with price around 0.08430 after a sharp upward move and a clear series of higher highs and higher lows. The 0.084–0.085 area is the immediate breakout zone, while 0.072–0.075 is an important support area. Volume has increased with the rise, supporting the current bullish momentum.
However, RSI is around 90, indicating an extremely overbought condition, so a short-term pullback or consolidation is possible before another move higher. If price holds above 0.072–0.075, the next major resistance zone is around 0.090–0.092; a strong breakout above that area could open the way toward 0.10.
However, RSI is around 90, indicating an extremely overbought condition, so a short-term pullback or consolidation is possible before another move higher. If price holds above 0.072–0.075, the next major resistance zone is around 0.090–0.092; a strong breakout above that area could open the way toward 0.10.
186
Übersetzung ansehen
$CLO
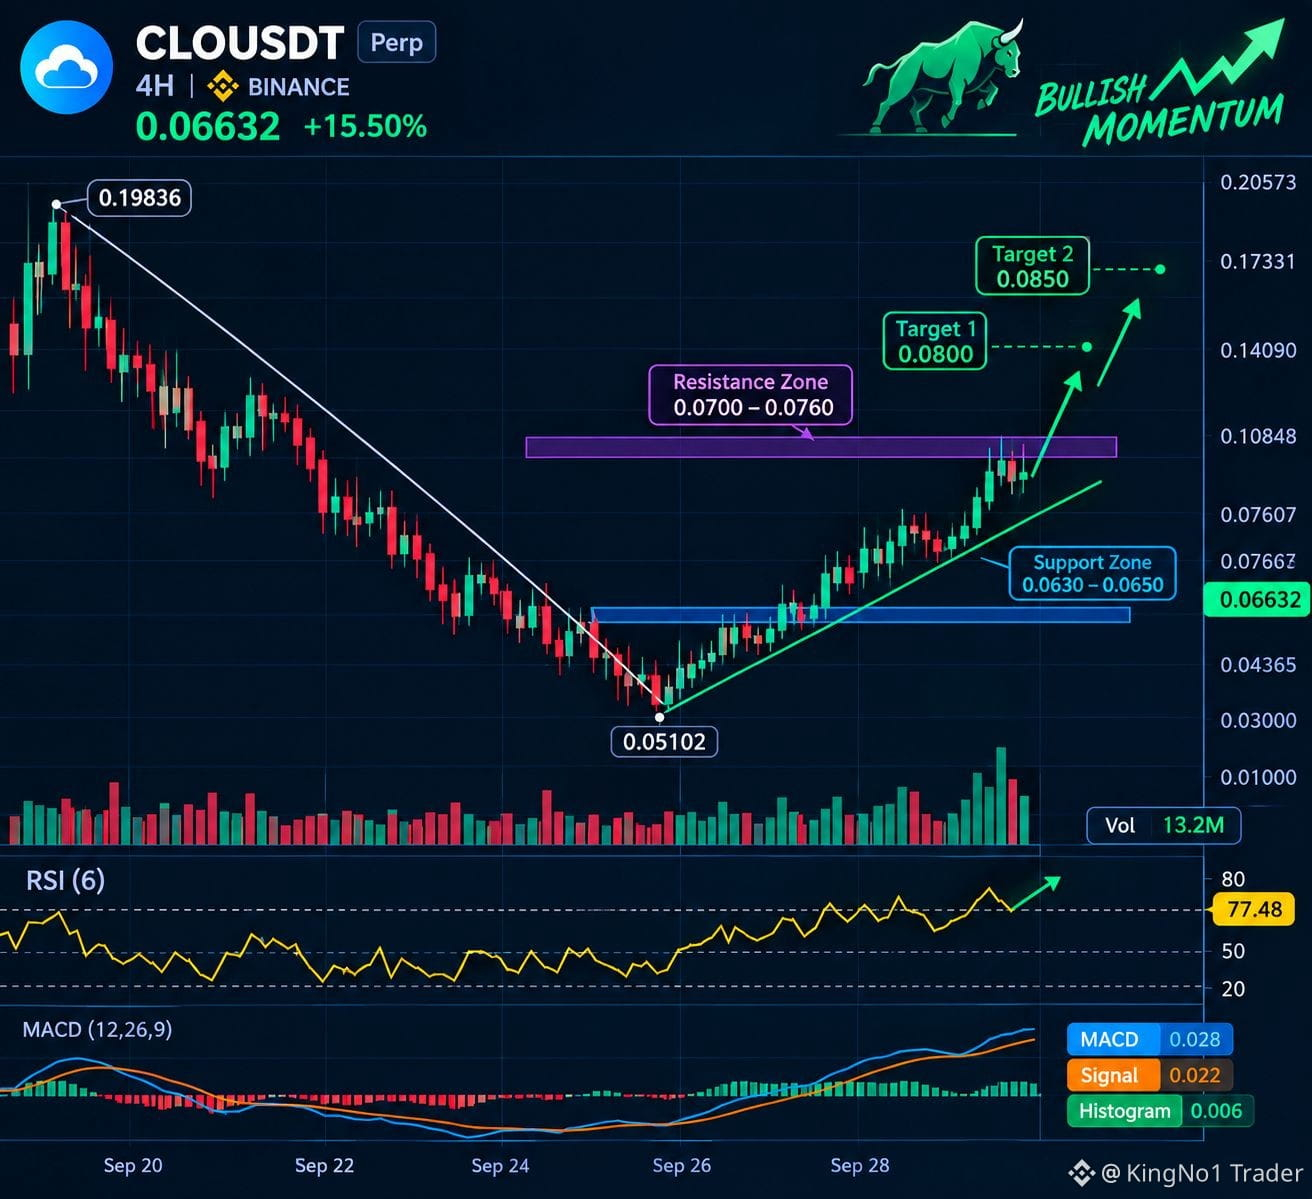
Bullish Outlook: A sustained breakout above 0.0700, supported by strong volume and a successful retest, could open the way toward 0.0800 and potentially 0.0850. Further bullish continuation would depend on the price forming higher highs and higher lows while maintaining buying pressure.
{future}(CLOUSDT)
On the downside, 0.0600–0.0630 is an important potential support area, while 0.05102 remains the major visible swing low. A breakdown below the immediate support zone could weaken the recovery. Overall, CLOUSDT has a short-term bullish recovery structure, but confirmation above resistance is important before assuming a sustained trend reversal.
$CLO
Bullish Outlook: A sustained breakout above 0.0700, supported by strong volume and a successful retest, could open the way toward 0.0800 and potentially 0.0850. Further bullish continuation would depend on the price forming higher highs and higher lows while maintaining buying pressure.
On the downside, 0.0600–0.0630 is an important potential support area, while 0.05102 remains the major visible swing low. A breakdown below the immediate support zone could weaken the recovery. Overall, CLOUSDT has a short-term bullish recovery structure, but confirmation above resistance is important before assuming a sustained trend reversal.
Bullish Outlook: A sustained breakout above 0.0700, supported by strong volume and a successful retest, could open the way toward 0.0800 and potentially 0.0850. Further bullish continuation would depend on the price forming higher highs and higher lows while maintaining buying pressure.
On the downside, 0.0600–0.0630 is an important potential support area, while 0.05102 remains the major visible swing low. A breakdown below the immediate support zone could weaken the recovery. Overall, CLOUSDT has a short-term bullish recovery structure, but confirmation above resistance is important before assuming a sustained trend reversal.
1
594
·
--
Bullisch
Übersetzung ansehen
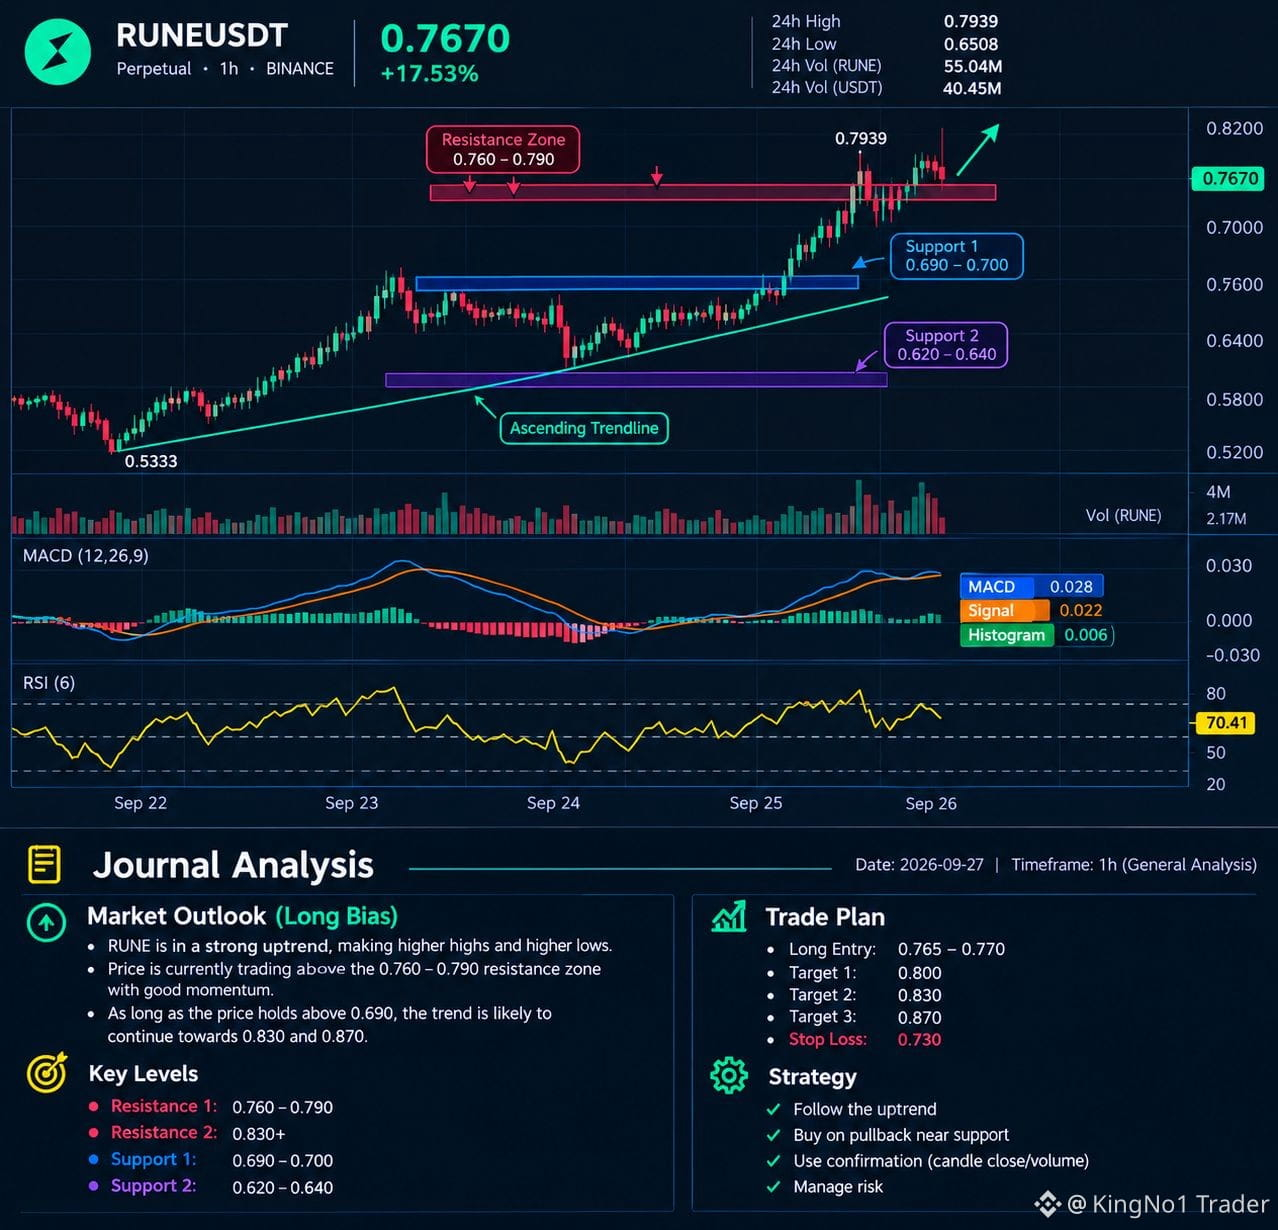
$RUNE RUNE is showing a strong bullish structure with higher highs and higher lows.
{spot}(RUNEUSDT)
Price is holding around the 0.760–0.790 resistance zone, while momentum remains positive; a sustained breakout above 0.790 could open the way toward 0.830 and potentially 0.870.
Key supports are 0.690–0.700 and 0.620–0.640. RSI is around 70, so a short-term pullback is possible; confirmation through candle close and volume is important before entering, with risk managed around the 0.730 invalidation area.
$RUNE RUNE is showing a strong bullish structure with higher highs and higher lows.
Price is holding around the 0.760–0.790 resistance zone, while momentum remains positive; a sustained breakout above 0.790 could open the way toward 0.830 and potentially 0.870.
Key supports are 0.690–0.700 and 0.620–0.640. RSI is around 70, so a short-term pullback is possible; confirmation through candle close and volume is important before entering, with risk managed around the 0.730 invalidation area.
Price is holding around the 0.760–0.790 resistance zone, while momentum remains positive; a sustained breakout above 0.790 could open the way toward 0.830 and potentially 0.870.
Key supports are 0.690–0.700 and 0.620–0.640. RSI is around 70, so a short-term pullback is possible; confirmation through candle close and volume is important before entering, with risk managed around the 0.730 invalidation area.
107
Übersetzung ansehen
$2Z
{future}(2ZUSDT)
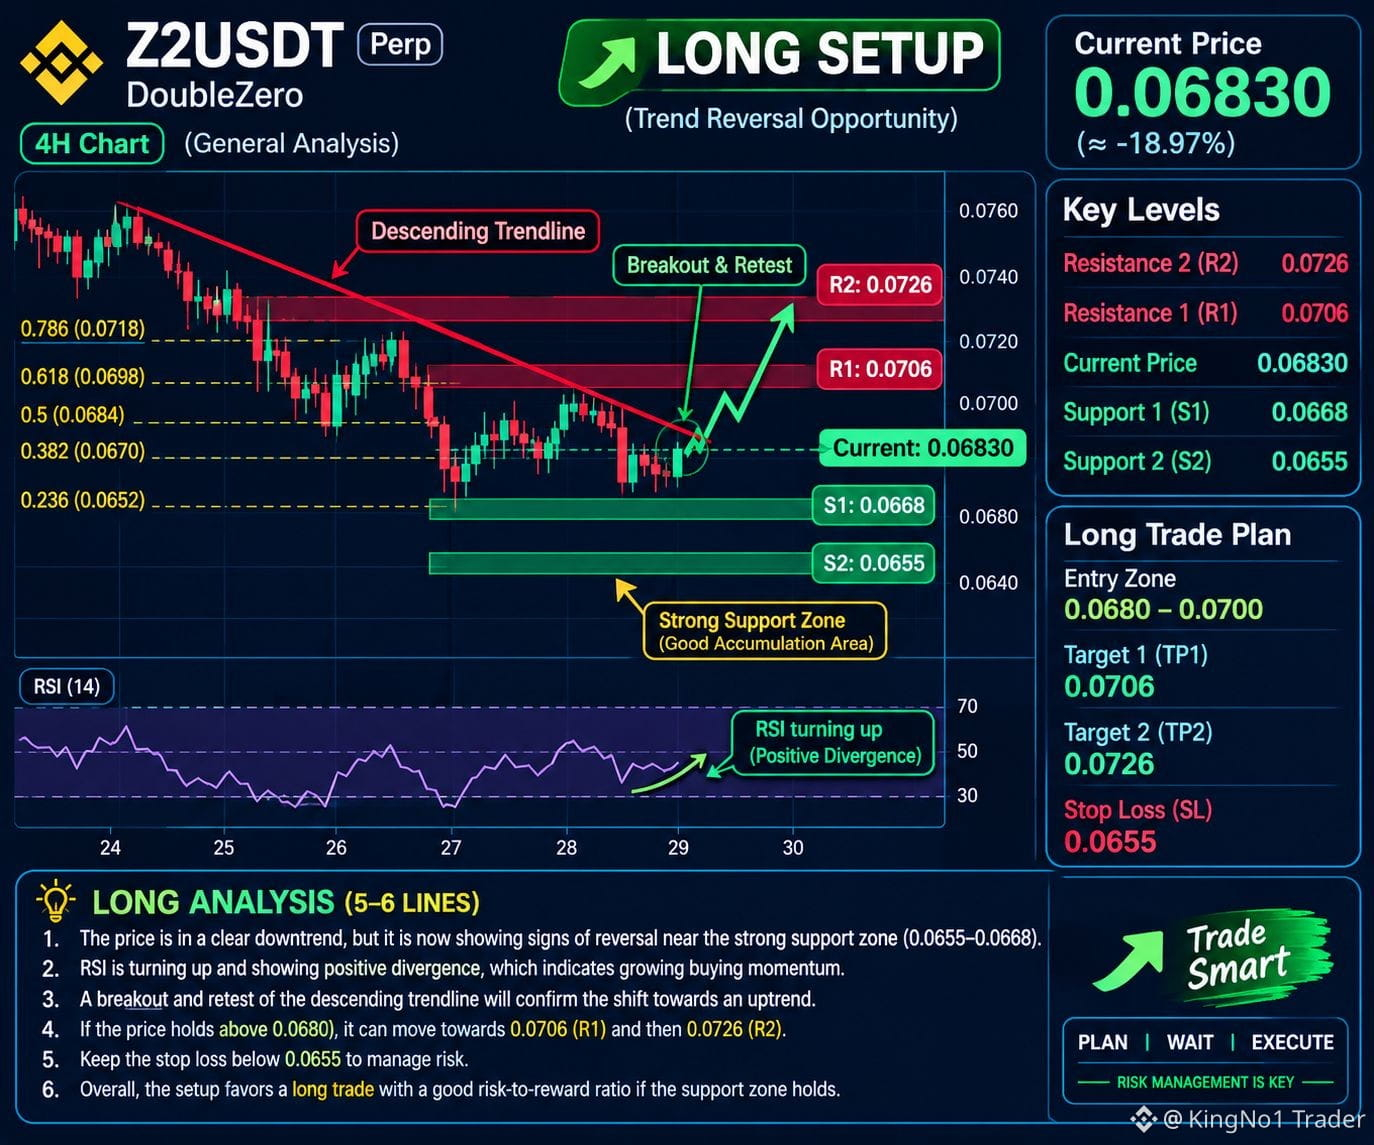
Price is holding near the strong support zone around 0.0655–0.0668, showing potential for a bullish reversal.
RSI is turning upward, suggesting that buying momentum may be returning.
A breakout and retest of the descending trendline would provide stronger confirmation for a long setup.
If price holds above 0.0680,
The next targets are
0.0706 (TP1) and 0.0726 (TP2).
Stop Loss: 0.0655; a break below this level would weaken the long setup.
Overall, the long setup becomes stronger if support holds and the trendline is successfully broken.
$2Z
Price is holding near the strong support zone around 0.0655–0.0668, showing potential for a bullish reversal.
RSI is turning upward, suggesting that buying momentum may be returning.
A breakout and retest of the descending trendline would provide stronger confirmation for a long setup.
If price holds above 0.0680,
The next targets are
0.0706 (TP1) and 0.0726 (TP2).
Stop Loss: 0.0655; a break below this level would weaken the long setup.
Overall, the long setup becomes stronger if support holds and the trendline is successfully broken.
Price is holding near the strong support zone around 0.0655–0.0668, showing potential for a bullish reversal.
RSI is turning upward, suggesting that buying momentum may be returning.
A breakout and retest of the descending trendline would provide stronger confirmation for a long setup.
If price holds above 0.0680,
The next targets are
0.0706 (TP1) and 0.0726 (TP2).
Stop Loss: 0.0655; a break below this level would weaken the long setup.
Overall, the long setup becomes stronger if support holds and the trendline is successfully broken.
143
Übersetzung ansehen
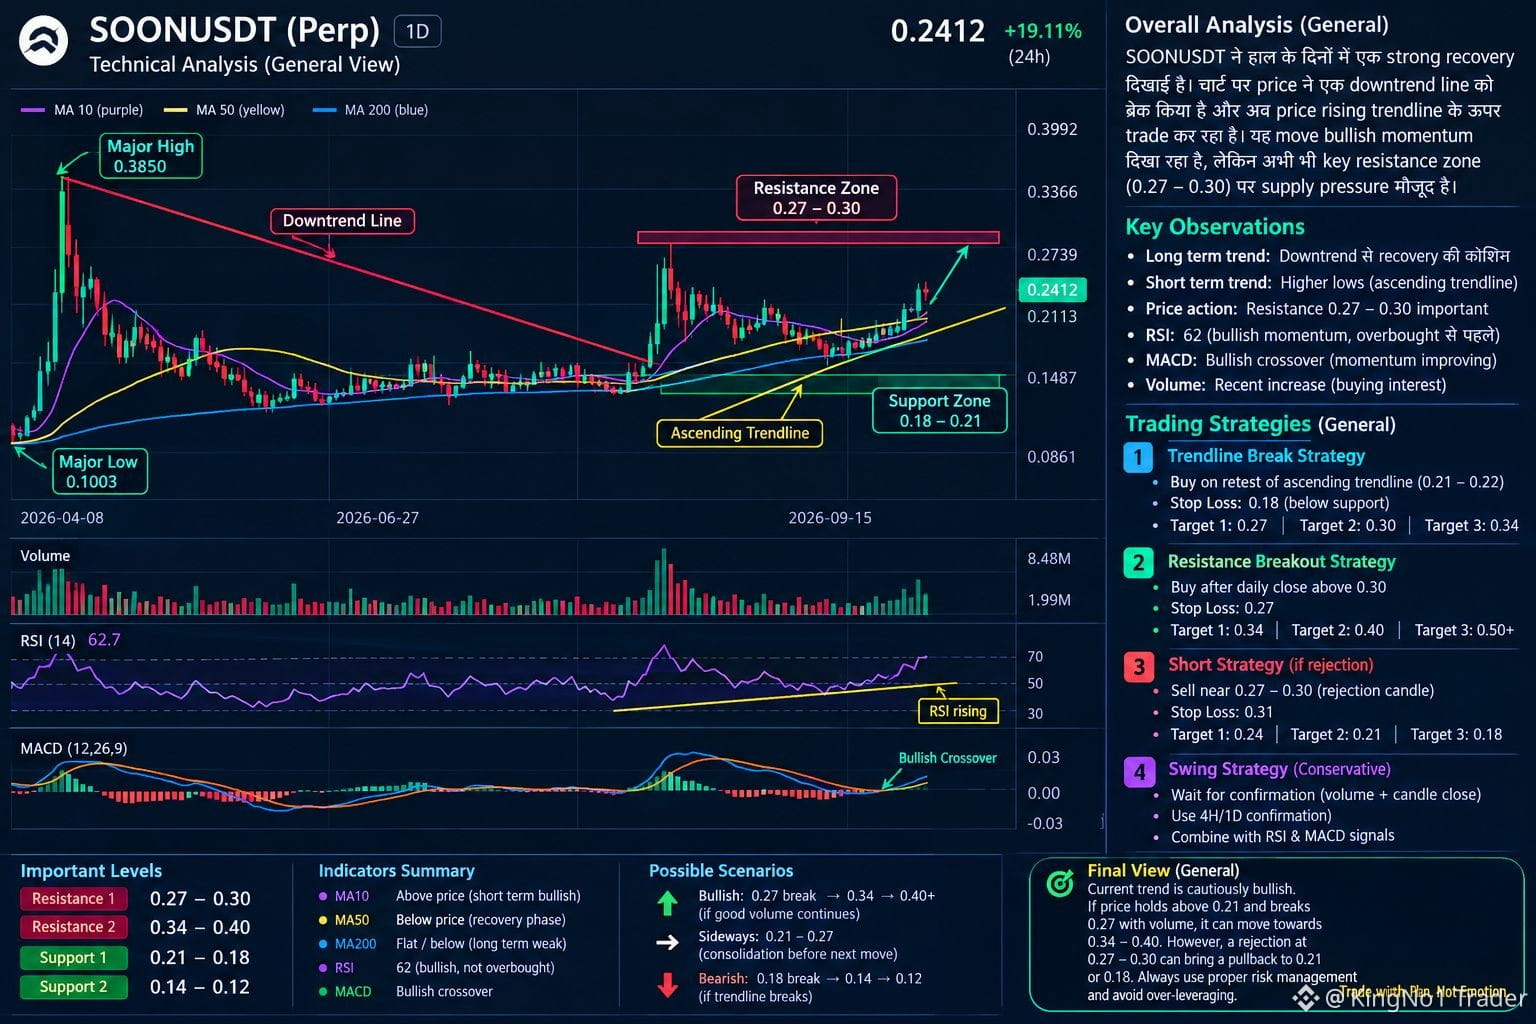
$SOON Current price shown: ~$0.2412
24H change: +19.11%
Market structure: Bullish recovery, but approaching major resistance
1. Trend Structure
Price has broken above the previous descending trendline.
A new ascending trendline is developing from the recent lows.
Structure is forming higher lows + higher highs, which supports a bullish short/medium-term bias.
However, the larger structure still needs confirmation above the major resistance area.
2. Key Support & Resistance
Level
Role
$0.27–0.30
Major resistance zone
$0.24–0.25
Current breakout area
$0.21–0.22
Important support
$0.18–0.20
Stronger support
$0.14–0.15
Major downside support
$0.10
Previous major low
3. RSI
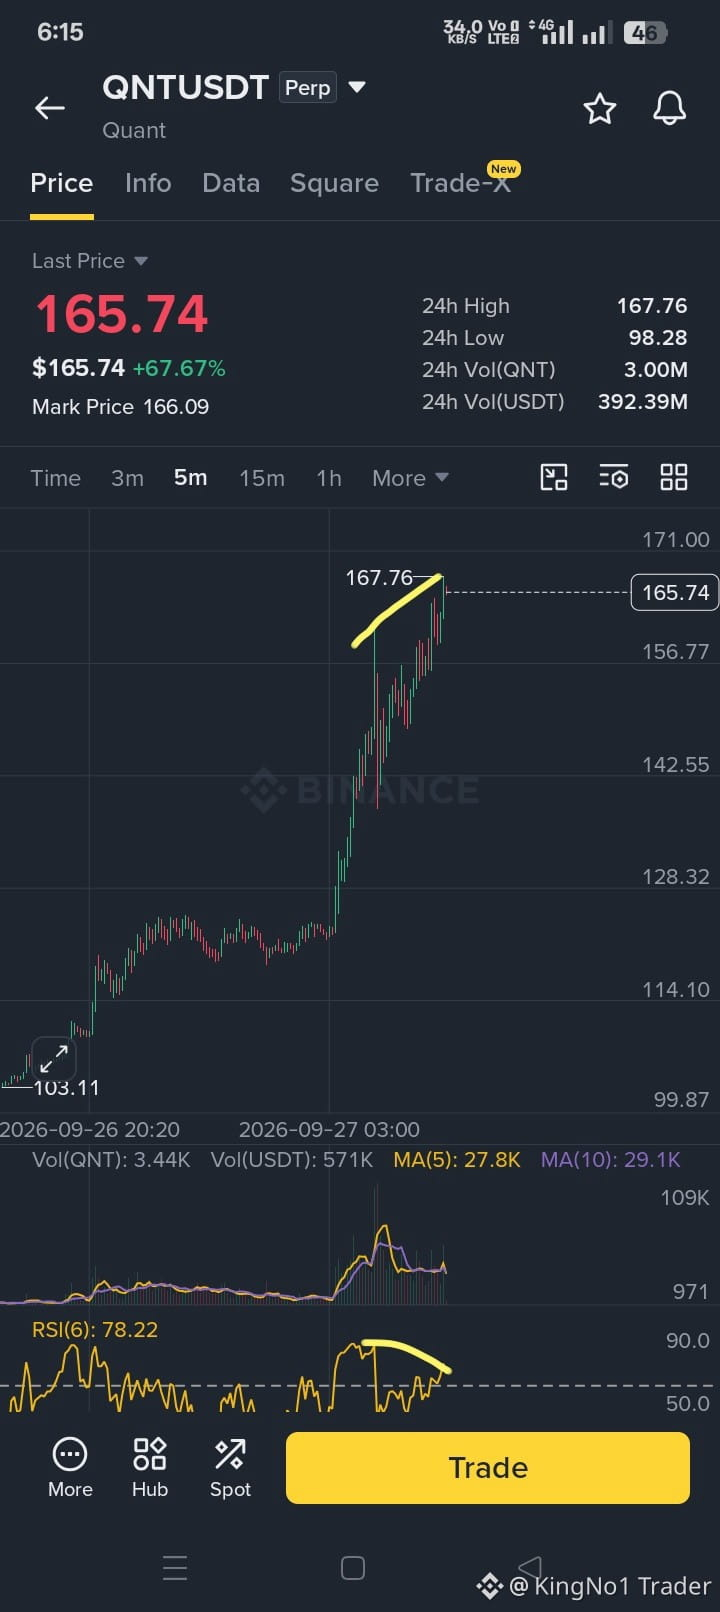
The chart's RSI(6) is around 88, which is very high.
That means:
Strong buying momentum
But the market is short-term overbought
A pullback/consolidation before another move higher is possible.
So I would not treat the current candle alone as a safe entry signal.
4. Volume
Recent volume has increased together with the price rise.
That's important because a breakout accompanied by increasing volume generally has more confirmation than a breakout on weak volume.
The key question now is whether volume remains strong if price approaches $0.27–$0.30.
5. Main Strategies
Strategy A — Trendline Retest
Wait for price to pull back toward $0.21–$0.22.
Look for bullish rejection/confirmation.
Invalidation: sustained break below the rising trendline/support.
Potential upside areas: $0.27 → $0.30 → $0.34
Strategy B — Resistance Breakout
Watch $0.27–$0.30 carefully.
A strong daily close above the zone with volume would provide stronger breakout confirmation.
Possible next areas: $0.34–$0.40.
Strategy C — Resistance Rejection
If price reaches $0.27–$0.30 and forms a strong rejection candle with declining momentum, a pullback becomes a possibility.
Important downside levels: $0.24 → $0.21 → $0.18.
Overall View
Bullish structure:
Momentum: Strong
Volume confirmation: Improving
RSI: Very high
Major obstacle: $0.27–$0.30
$SOON Current price shown: ~$0.2412
24H change: +19.11%
Market structure: Bullish recovery, but approaching major resistance
1. Trend Structure
Price has broken above the previous descending trendline.
A new ascending trendline is developing from the recent lows.
Structure is forming higher lows + higher highs, which supports a bullish short/medium-term bias.
However, the larger structure still needs confirmation above the major resistance area.
2. Key Support & Resistance
Level
Role
$0.27–0.30
Major resistance zone
$0.24–0.25
Current breakout area
$0.21–0.22
Important support
$0.18–0.20
Stronger support
$0.14–0.15
Major downside support
$0.10
Previous major low
3. RSI
The chart's RSI(6) is around 88, which is very high.
That means:
Strong buying momentum
But the market is short-term overbought
A pullback/consolidation before another move higher is possible.
So I would not treat the current candle alone as a safe entry signal.
4. Volume
Recent volume has increased together with the price rise.
That's important because a breakout accompanied by increasing volume generally has more confirmation than a breakout on weak volume.
The key question now is whether volume remains strong if price approaches $0.27–$0.30.
5. Main Strategies
Strategy A — Trendline Retest
Wait for price to pull back toward $0.21–$0.22.
Look for bullish rejection/confirmation.
Invalidation: sustained break below the rising trendline/support.
Potential upside areas: $0.27 → $0.30 → $0.34
Strategy B — Resistance Breakout
Watch $0.27–$0.30 carefully.
A strong daily close above the zone with volume would provide stronger breakout confirmation.
Possible next areas: $0.34–$0.40.
Strategy C — Resistance Rejection
If price reaches $0.27–$0.30 and forms a strong rejection candle with declining momentum, a pullback becomes a possibility.
Important downside levels: $0.24 → $0.21 → $0.18.
Overall View
Bullish structure:
Momentum: Strong
Volume confirmation: Improving
RSI: Very high
Major obstacle: $0.27–$0.30
24H change: +19.11%
Market structure: Bullish recovery, but approaching major resistance
1. Trend Structure
Price has broken above the previous descending trendline.
A new ascending trendline is developing from the recent lows.
Structure is forming higher lows + higher highs, which supports a bullish short/medium-term bias.
However, the larger structure still needs confirmation above the major resistance area.
2. Key Support & Resistance
Level
Role
$0.27–0.30
Major resistance zone
$0.24–0.25
Current breakout area
$0.21–0.22
Important support
$0.18–0.20
Stronger support
$0.14–0.15
Major downside support
$0.10
Previous major low
3. RSI
The chart's RSI(6) is around 88, which is very high.
That means:
Strong buying momentum
But the market is short-term overbought
A pullback/consolidation before another move higher is possible.
So I would not treat the current candle alone as a safe entry signal.
4. Volume
Recent volume has increased together with the price rise.
That's important because a breakout accompanied by increasing volume generally has more confirmation than a breakout on weak volume.
The key question now is whether volume remains strong if price approaches $0.27–$0.30.
5. Main Strategies
Strategy A — Trendline Retest
Wait for price to pull back toward $0.21–$0.22.
Look for bullish rejection/confirmation.
Invalidation: sustained break below the rising trendline/support.
Potential upside areas: $0.27 → $0.30 → $0.34
Strategy B — Resistance Breakout
Watch $0.27–$0.30 carefully.
A strong daily close above the zone with volume would provide stronger breakout confirmation.
Possible next areas: $0.34–$0.40.
Strategy C — Resistance Rejection
If price reaches $0.27–$0.30 and forms a strong rejection candle with declining momentum, a pullback becomes a possibility.
Important downside levels: $0.24 → $0.21 → $0.18.
Overall View
Bullish structure:
Momentum: Strong
Volume confirmation: Improving
RSI: Very high
Major obstacle: $0.27–$0.30
216
Übersetzung ansehen
$BR
{future}(BRUSDT)
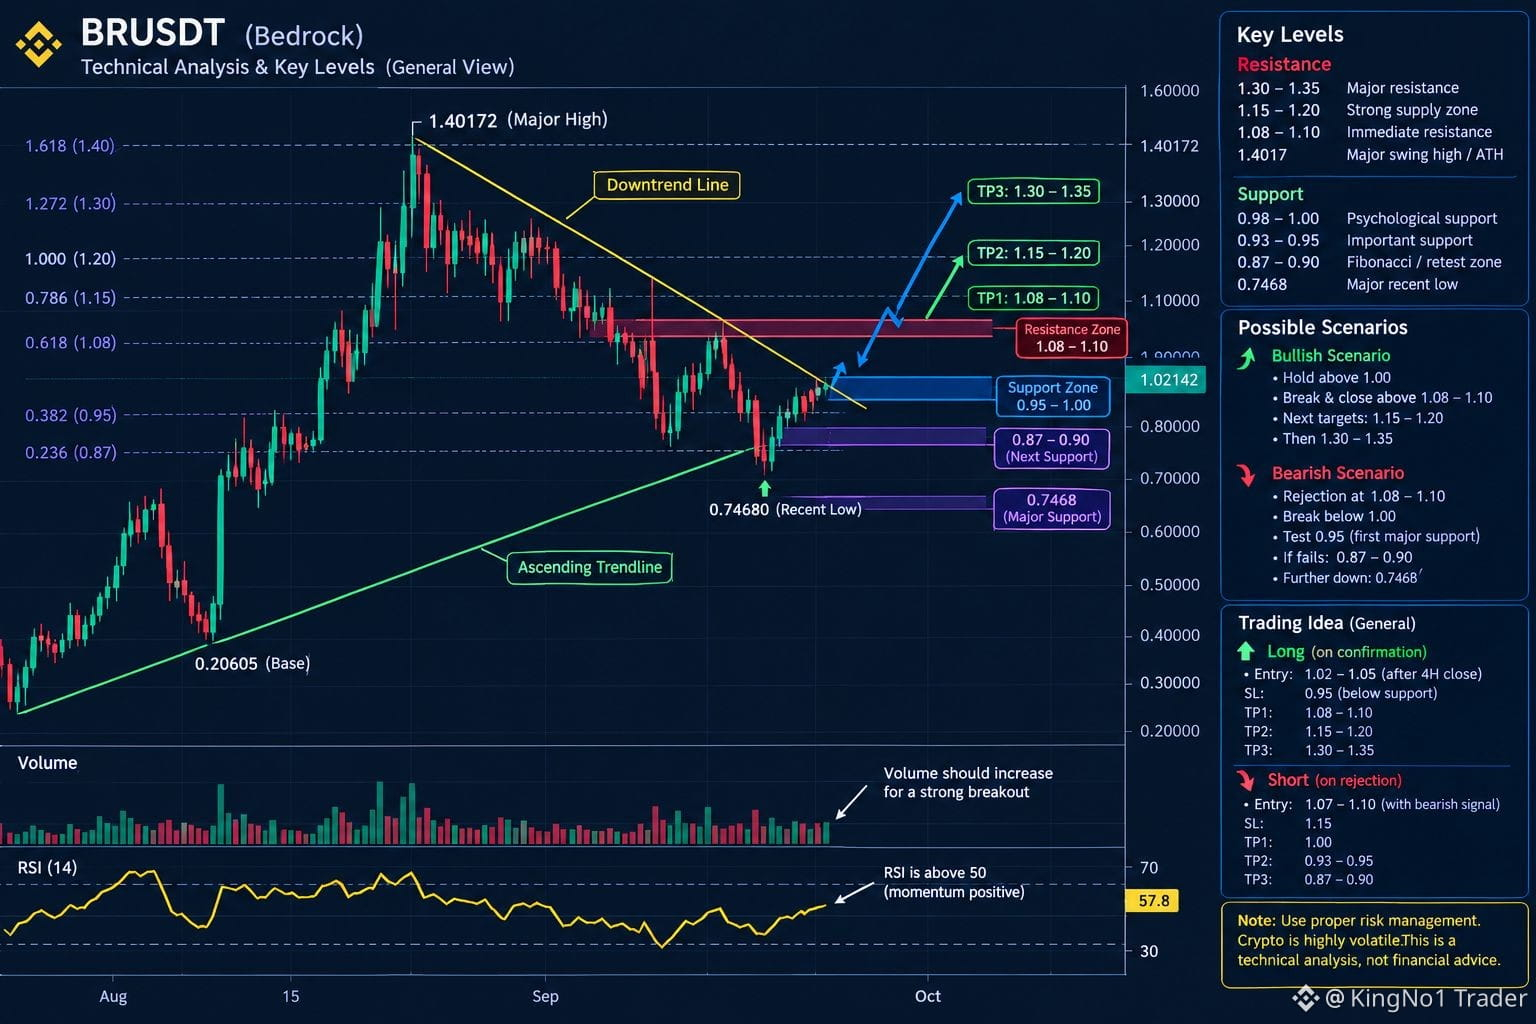
BRUSDT has recovered strongly from the 0.7468 low. Price is currently around 1.02, approaching an important resistance zone.
Trendlines:
The descending trendline from 1.4017 represents the previous bearish structure.
The rising trendline from the 0.2060 base toward the recent low shows a broader bullish recovery structure.
A breakout above the descending trendline would provide additional bullish confirmation.
Resistance:
1.08–1.10 — Immediate resistance
1.15–1.20 — Strong resistance/supply
1.30–1.35 — Major resistance
1.4017 — Major swing high
Support:
0.98–1.00 — Psychological support
0.93–0.95 — Important support
0.87–0.90 — Secondary support
0.7468 — Major recent low
Bullish Confirmation:
A strong breakout and close above 1.08–1.10, preferably with increased volume, could open the way toward 1.15–1.20 and potentially 1.30–1.35.
Bearish Confirmation:
A rejection from 1.08–1.10 followed by a break below 1.00 could bring 0.93–0.95 into focus, followed by 0.87–0.90.
RSI:
RSI is around 57.8, indicating positive momentum without being in the traditional overbought zone.
Overall:
The broader structure shows a recovery with bullish momentum, but 1.08–1.10 is the key decision zone. Confirmation through price action and volume is important before treating the move as a sustained breakout.
$BR
BRUSDT has recovered strongly from the 0.7468 low. Price is currently around 1.02, approaching an important resistance zone.
Trendlines:
The descending trendline from 1.4017 represents the previous bearish structure.
The rising trendline from the 0.2060 base toward the recent low shows a broader bullish recovery structure.
A breakout above the descending trendline would provide additional bullish confirmation.
Resistance:
1.08–1.10 — Immediate resistance
1.15–1.20 — Strong resistance/supply
1.30–1.35 — Major resistance
1.4017 — Major swing high
Support:
0.98–1.00 — Psychological support
0.93–0.95 — Important support
0.87–0.90 — Secondary support
0.7468 — Major recent low
Bullish Confirmation:
A strong breakout and close above 1.08–1.10, preferably with increased volume, could open the way toward 1.15–1.20 and potentially 1.30–1.35.
Bearish Confirmation:
A rejection from 1.08–1.10 followed by a break below 1.00 could bring 0.93–0.95 into focus, followed by 0.87–0.90.
RSI:
RSI is around 57.8, indicating positive momentum without being in the traditional overbought zone.
Overall:
The broader structure shows a recovery with bullish momentum, but 1.08–1.10 is the key decision zone. Confirmation through price action and volume is important before treating the move as a sustained breakout.
BRUSDT has recovered strongly from the 0.7468 low. Price is currently around 1.02, approaching an important resistance zone.
Trendlines:
The descending trendline from 1.4017 represents the previous bearish structure.
The rising trendline from the 0.2060 base toward the recent low shows a broader bullish recovery structure.
A breakout above the descending trendline would provide additional bullish confirmation.
Resistance:
1.08–1.10 — Immediate resistance
1.15–1.20 — Strong resistance/supply
1.30–1.35 — Major resistance
1.4017 — Major swing high
Support:
0.98–1.00 — Psychological support
0.93–0.95 — Important support
0.87–0.90 — Secondary support
0.7468 — Major recent low
Bullish Confirmation:
A strong breakout and close above 1.08–1.10, preferably with increased volume, could open the way toward 1.15–1.20 and potentially 1.30–1.35.
Bearish Confirmation:
A rejection from 1.08–1.10 followed by a break below 1.00 could bring 0.93–0.95 into focus, followed by 0.87–0.90.
RSI:
RSI is around 57.8, indicating positive momentum without being in the traditional overbought zone.
Overall:
The broader structure shows a recovery with bullish momentum, but 1.08–1.10 is the key decision zone. Confirmation through price action and volume is important before treating the move as a sustained breakout.
282
$RARE , RAREUSDT hohe Rendite, aber auch ein bisschen riskant.
Unterstützung: 0.01160–0.01165
Widerstand: 0.01206
Ausbruch-Ziele: 0.01230 → 0.01270
Abwärtsniveaus: 0.01140 → 0.01100
Bullisches Setup: Ein überzeugender Schlusskurs oberhalb von 0.01206, vorzugsweise mit erhöhtem Volumen, würde eine technische Ausbruch-Bestätigung darstellen.
Bärisches Setup: Ein klarer Bruch unter 0.01160 könnte die tieferen Niveaus bei etwa 0.01140 und 0.01100 freilegen.
$RARE , RAREUSDT hohe Rendite, aber auch ein bisschen riskant.
Unterstützung: 0.01160–0.01165
Widerstand: 0.01206
Ausbruch-Ziele: 0.01230 → 0.01270
Abwärtsniveaus: 0.01140 → 0.01100
Bullisches Setup: Ein überzeugender Schlusskurs oberhalb von 0.01206, vorzugsweise mit erhöhtem Volumen, würde eine technische Ausbruch-Bestätigung darstellen.
Bärisches Setup: Ein klarer Bruch unter 0.01160 könnte die tieferen Niveaus bei etwa 0.01140 und 0.01100 freilegen.
Unterstützung: 0.01160–0.01165
Widerstand: 0.01206
Ausbruch-Ziele: 0.01230 → 0.01270
Abwärtsniveaus: 0.01140 → 0.01100
Bullisches Setup: Ein überzeugender Schlusskurs oberhalb von 0.01206, vorzugsweise mit erhöhtem Volumen, würde eine technische Ausbruch-Bestätigung darstellen.
Bärisches Setup: Ein klarer Bruch unter 0.01160 könnte die tieferen Niveaus bei etwa 0.01140 und 0.01100 freilegen.
291
Übersetzung ansehen
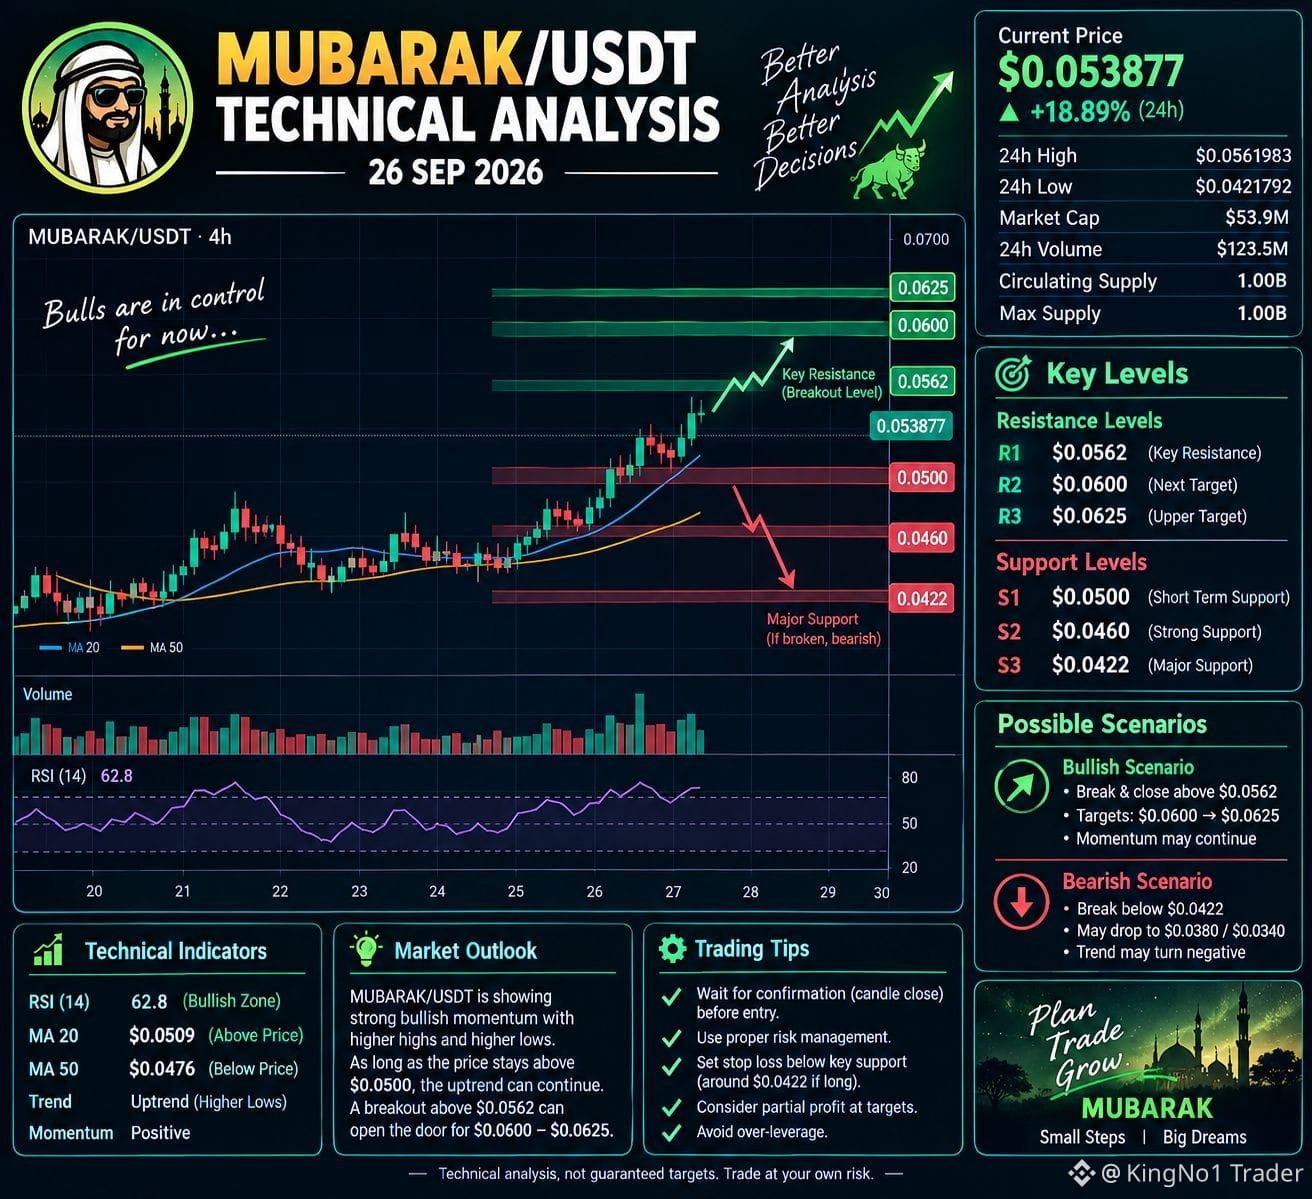
Momentum is currently bullish after the strong 24h move, but because MUBARAK is a meme coin and volatility is high, a pullback from the $0.0562 area is possible. Binance reports the entire 1 billion supply is already circulating, so there is no listed future supply unlock from the remaining supply.
MUBARAK/USDT — Technical Analysis
Current price: ~$0.05388
24h change: +18.89%
24h high: $0.05620
24h low: $0.04218
24h volume: ~$123.5M
Market cap: ~$53.9M
Key resistance = $0.0562
immediate breakout level=$0.0600
next resistance/target zone=$0.0625
upper target zone
Key support=$0.0500 important short-term support=$0.0460
stronger support=$0.0422 major support/invalidation area
Bullish scenario: A confirmed break and hold above $0.0562 could open the $0.0600–$0.0625 area.
Bearish scenario: Losing $0.0500 would weaken the short-term structure; a break of $0.0422 would be a much stronger bearish signal.
Momentum is currently bullish after the strong 24h move, but because MUBARAK is a meme coin and volatility is high, a pullback from the $0.0562 area is possible. Binance reports the entire 1 billion supply is already circulating, so there is no listed future supply unlock from the remaining supply.
MUBARAK/USDT — Technical Analysis
Current price: ~$0.05388
24h change: +18.89%
24h high: $0.05620
24h low: $0.04218
24h volume: ~$123.5M
Market cap: ~$53.9M
Key resistance = $0.0562
immediate breakout level=$0.0600
next resistance/target zone=$0.0625
upper target zone
Key support=$0.0500 important short-term support=$0.0460
stronger support=$0.0422 major support/invalidation area
Bullish scenario: A confirmed break and hold above $0.0562 could open the $0.0600–$0.0625 area.
Bearish scenario: Losing $0.0500 would weaken the short-term structure; a break of $0.0422 would be a much stronger bearish signal.
MUBARAK/USDT — Technical Analysis
Current price: ~$0.05388
24h change: +18.89%
24h high: $0.05620
24h low: $0.04218
24h volume: ~$123.5M
Market cap: ~$53.9M
Key resistance = $0.0562
immediate breakout level=$0.0600
next resistance/target zone=$0.0625
upper target zone
Key support=$0.0500 important short-term support=$0.0460
stronger support=$0.0422 major support/invalidation area
Bullish scenario: A confirmed break and hold above $0.0562 could open the $0.0600–$0.0625 area.
Bearish scenario: Losing $0.0500 would weaken the short-term structure; a break of $0.0422 would be a much stronger bearish signal.
161
Übersetzung ansehen
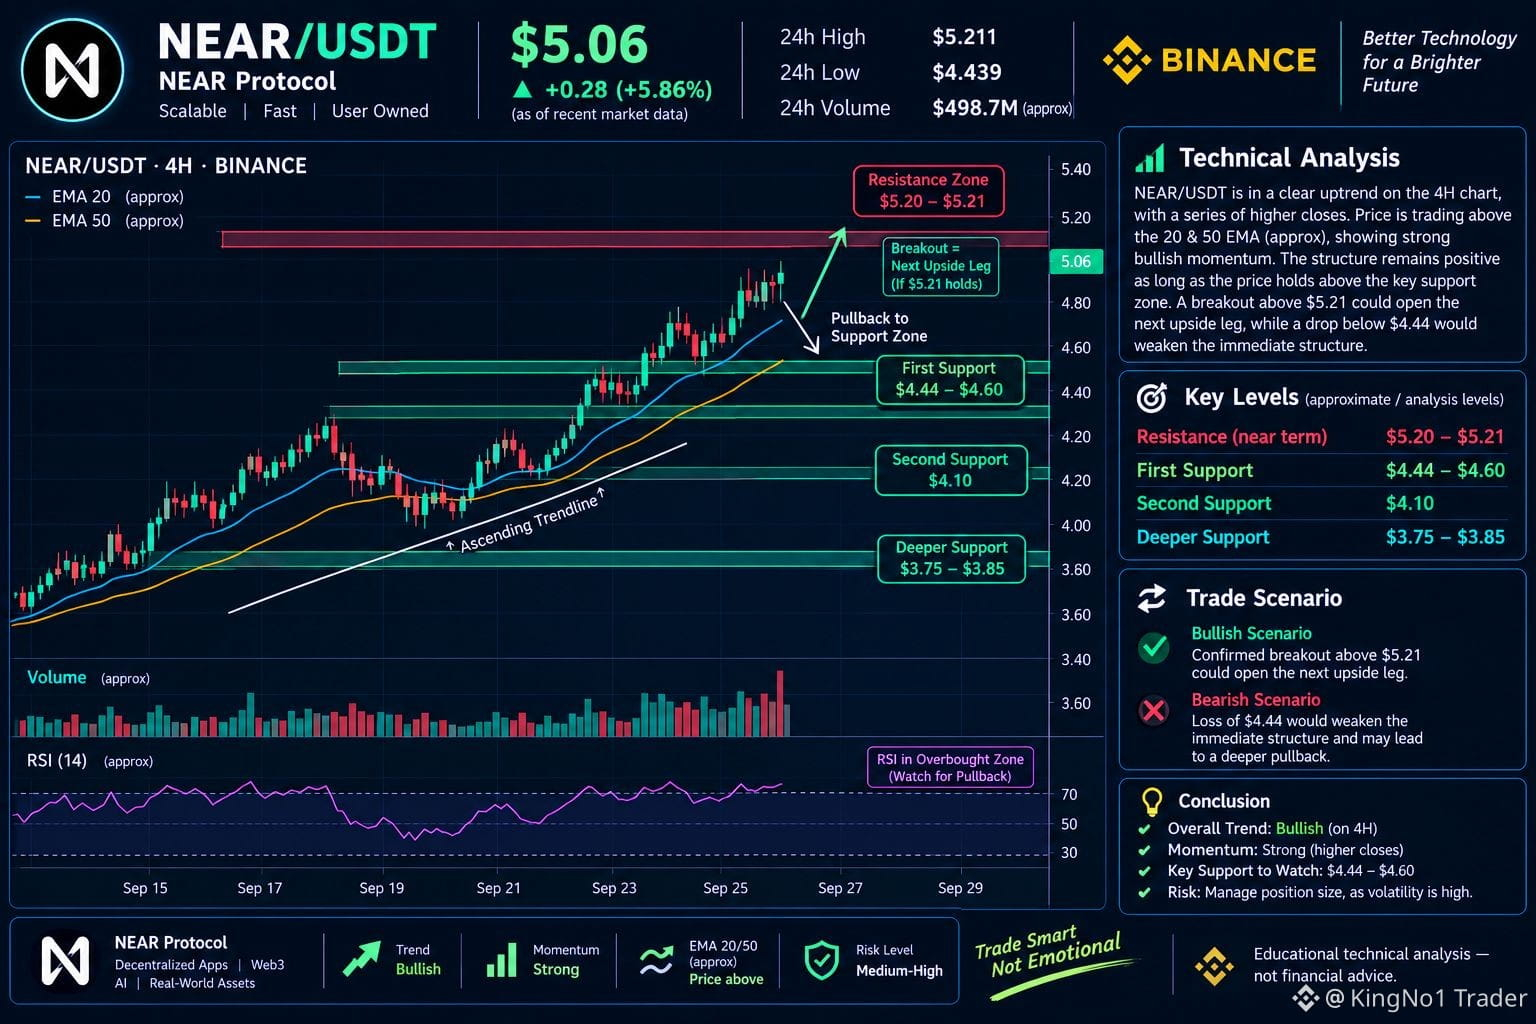
NEAR/USDT is currently showing a bullish market structure. The price has made a series of higher highs and higher lows, indicating strong buying momentum.
The recent rally has pushed NEAR close to the $5.20–$5.21 resistance zone, which is the most important level to watch in the short term.
Key Resistance Levels
Resistance 1: $5.20–$5.21
A strong candle close above $5.21 with increased trading volume could confirm a breakout and potentially open the way for the next upward move.
Key Support Levels
Support 1: $4.44–$4.60
This is the first important pullback/support zone.
Support 2: $4.10
A stronger support area if the first support fails.
Major Support: $3.75–$3.85
A deeper correction could potentially reach this zone.
Bullish Scenario
If NEAR breaks above $5.21 with strong volume and successfully holds above this level, the bullish structure could continue and the market may attempt to establish new higher levels.
NEAR/USDT is currently showing a bullish market structure. The price has made a series of higher highs and higher lows, indicating strong buying momentum.
The recent rally has pushed NEAR close to the $5.20–$5.21 resistance zone, which is the most important level to watch in the short term.
Key Resistance Levels
Resistance 1: $5.20–$5.21
A strong candle close above $5.21 with increased trading volume could confirm a breakout and potentially open the way for the next upward move.
Key Support Levels
Support 1: $4.44–$4.60
This is the first important pullback/support zone.
Support 2: $4.10
A stronger support area if the first support fails.
Major Support: $3.75–$3.85
A deeper correction could potentially reach this zone.
Bullish Scenario
If NEAR breaks above $5.21 with strong volume and successfully holds above this level, the bullish structure could continue and the market may attempt to establish new higher levels.
The recent rally has pushed NEAR close to the $5.20–$5.21 resistance zone, which is the most important level to watch in the short term.
Key Resistance Levels
Resistance 1: $5.20–$5.21
A strong candle close above $5.21 with increased trading volume could confirm a breakout and potentially open the way for the next upward move.
Key Support Levels
Support 1: $4.44–$4.60
This is the first important pullback/support zone.
Support 2: $4.10
A stronger support area if the first support fails.
Major Support: $3.75–$3.85
A deeper correction could potentially reach this zone.
Bullish Scenario
If NEAR breaks above $5.21 with strong volume and successfully holds above this level, the bullish structure could continue and the market may attempt to establish new higher levels.
167
Anmelden und weiter Inhalte entdecken
Krypto-Nutzer weltweit auf Binance Square kennenlernen
⚡️ Bleib in Sachen Krypto stets am Puls.
💬 Die weltgrößte Kryptobörse vertraut darauf.
👍 Erhalte verlässliche Einblicke von verifizierten Creators.
E-Mail-Adresse/Telefonnummer