
The Billionaire Trades
639 Beiträge

The Billionaire Trades
Melden
Nutzer blockieren
Billions Network Market Strategist - Xerox Token Founder 🇿🇦
Trade eröffnen
Gelegenheitstrader
1.1 Jahre
103 Following
46 Follower
65 Like gegeben
Beiträge
Portfolio
Alle
Zitierungen

Artikel
Ripple-Kursprognose: XRP beschleunigt den Rückgang unter 1,00 $, während die Beteiligung von Kleinanlegern nachlässtXRP bleibt unter der wichtigen Marke von 1,00 $ unter Druck und wird am Montag bei etwa 0,95 $ gehandelt.
Die Nachfrage nach XRP-Derivaten lässt nach, da sich Kleinanleger zurückziehen und das Open Interest bei Futures auf 2,1 Milliarden XRP sinkt.
Die technische Struktur von XRP zeigt trotz überverkaufter Bedingungen anhaltende Schwäche.
Ripple (XRP) gibt am Montag nach und wird bei 0,95 $ gehandelt, während die Verkäufer weitgehend die Kontrolle behalten. Die Versuche der Bullen, die Kontrolle zurückzugewinnen, sind in den vergangenen Wochen zunehmend gescheitert und stehen damit im Einklang mit dem breiteren Kryptomarkt.
Die Nachfrage nach Derivaten bricht ein, während XRP nahe Mehrjahrestiefs gehandelt wird.
Ripple-Kursprognose: XRP beschleunigt den Rückgang unter 1,00 $, während die Beteiligung von Kleinanlegern nachlässt
XRP bleibt unter der wichtigen Marke von 1,00 $ unter Druck und wird am Montag bei etwa 0,95 $ gehandelt.
Die Nachfrage nach XRP-Derivaten lässt nach, da sich Kleinanleger zurückziehen und das Open Interest bei Futures auf 2,1 Milliarden XRP sinkt.
Die technische Struktur von XRP zeigt trotz überverkaufter Bedingungen anhaltende Schwäche.
Ripple (XRP) gibt am Montag nach und wird bei 0,95 $ gehandelt, während die Verkäufer weitgehend die Kontrolle behalten. Die Versuche der Bullen, die Kontrolle zurückzugewinnen, sind in den vergangenen Wochen zunehmend gescheitert und stehen damit im Einklang mit dem breiteren Kryptomarkt.
Die Nachfrage nach Derivaten bricht ein, während XRP nahe Mehrjahrestiefs gehandelt wird.
Die Nachfrage nach XRP-Derivaten lässt nach, da sich Kleinanleger zurückziehen und das Open Interest bei Futures auf 2,1 Milliarden XRP sinkt.
Die technische Struktur von XRP zeigt trotz überverkaufter Bedingungen anhaltende Schwäche.
Ripple (XRP) gibt am Montag nach und wird bei 0,95 $ gehandelt, während die Verkäufer weitgehend die Kontrolle behalten. Die Versuche der Bullen, die Kontrolle zurückzugewinnen, sind in den vergangenen Wochen zunehmend gescheitert und stehen damit im Einklang mit dem breiteren Kryptomarkt.
Die Nachfrage nach Derivaten bricht ein, während XRP nahe Mehrjahrestiefs gehandelt wird.
274

Artikel
Übersetzung ansehen
Solana drops 'mainnet beta' label and adopts protocol version 1.0The Solana Foundation has retired the network's “mainnet beta” designation and introduced Solana 1.0 as a shared protocol version independent of individual validator client versions.
In a statement on Monday, the foundation said the change recognizes Solana's technical progress and separates its protocol version from the software releases of individual validator clients.
Solana 1.0 recognizes the progress on network performance, resilience, and developer experience," the foundation wrote. "That progress continues with this simplification of nomenclature."
The foundation said the change does not require any action from users, while SOL
SolanaSOL+0.41% holdings, transaction histories, and accounts remain unaffected.
Developers and validator operators should continue following individual software release guidance, since assigning a protocol version does not automatically activate every associated network improvement, according to the statement.
Alpenglow and Firedancer milestones
The name change comes as Solana has been upgrading its infrastructure. In October, the network's mainnet activated Alpenglow, a consensus upgrade that targets transaction finality of about 150 milliseconds, down from 12.8 seconds.
Jump Crypto's Firedancer went live on Solana mainnet in December 2025, giving operators an independently developed alternative to Agave. The two are built with separate codebases, release schedules, and version numbers.
Following the name change, both development teams, validators, and infrastructure operators will have a common way to identify changes to Solana, regardless of which client they run, the foundation said.
Last week, the Depository Trust & Clearing Corporation announced plans to connect its tokenization service to the network in the second half of 2027.
Formation Securities has also notified the SEC of plans to operate a tokenized securities trading venue on Solana, targeting an early 2027 launch.
Separately, asset manager Schroders launched a tokenized emerging-markets debt fund on Solana through Centrifuge earlier this month. Other notable launches on Solana this year include USDC accounts for U.S. Samsung Galaxy users and integration with Polygon Labs' Open Money Stack.
#TheBillionaireTrades #TheBillionaireTradesMarketInsights
{spot}(SOLUSDT)
Solana drops 'mainnet beta' label and adopts protocol version 1.0
The Solana Foundation has retired the network's “mainnet beta” designation and introduced Solana 1.0 as a shared protocol version independent of individual validator client versions.
In a statement on Monday, the foundation said the change recognizes Solana's technical progress and separates its protocol version from the software releases of individual validator clients.
Solana 1.0 recognizes the progress on network performance, resilience, and developer experience," the foundation wrote. "That progress continues with this simplification of nomenclature."
The foundation said the change does not require any action from users, while SOL
SolanaSOL+0.41% holdings, transaction histories, and accounts remain unaffected.
Developers and validator operators should continue following individual software release guidance, since assigning a protocol version does not automatically activate every associated network improvement, according to the statement.
Alpenglow and Firedancer milestones
The name change comes as Solana has been upgrading its infrastructure. In October, the network's mainnet activated Alpenglow, a consensus upgrade that targets transaction finality of about 150 milliseconds, down from 12.8 seconds.
Jump Crypto's Firedancer went live on Solana mainnet in December 2025, giving operators an independently developed alternative to Agave. The two are built with separate codebases, release schedules, and version numbers.
Following the name change, both development teams, validators, and infrastructure operators will have a common way to identify changes to Solana, regardless of which client they run, the foundation said.
Last week, the Depository Trust & Clearing Corporation announced plans to connect its tokenization service to the network in the second half of 2027.
Formation Securities has also notified the SEC of plans to operate a tokenized securities trading venue on Solana, targeting an early 2027 launch.
Separately, asset manager Schroders launched a tokenized emerging-markets debt fund on Solana through Centrifuge earlier this month. Other notable launches on Solana this year include USDC accounts for U.S. Samsung Galaxy users and integration with Polygon Labs' Open Money Stack.
#TheBillionaireTrades #TheBillionaireTradesMarketInsights
In a statement on Monday, the foundation said the change recognizes Solana's technical progress and separates its protocol version from the software releases of individual validator clients.
Solana 1.0 recognizes the progress on network performance, resilience, and developer experience," the foundation wrote. "That progress continues with this simplification of nomenclature."
The foundation said the change does not require any action from users, while SOL
SolanaSOL+0.41% holdings, transaction histories, and accounts remain unaffected.
Developers and validator operators should continue following individual software release guidance, since assigning a protocol version does not automatically activate every associated network improvement, according to the statement.
Alpenglow and Firedancer milestones
The name change comes as Solana has been upgrading its infrastructure. In October, the network's mainnet activated Alpenglow, a consensus upgrade that targets transaction finality of about 150 milliseconds, down from 12.8 seconds.
Jump Crypto's Firedancer went live on Solana mainnet in December 2025, giving operators an independently developed alternative to Agave. The two are built with separate codebases, release schedules, and version numbers.
Following the name change, both development teams, validators, and infrastructure operators will have a common way to identify changes to Solana, regardless of which client they run, the foundation said.
Last week, the Depository Trust & Clearing Corporation announced plans to connect its tokenization service to the network in the second half of 2027.
Formation Securities has also notified the SEC of plans to operate a tokenized securities trading venue on Solana, targeting an early 2027 launch.
Separately, asset manager Schroders launched a tokenized emerging-markets debt fund on Solana through Centrifuge earlier this month. Other notable launches on Solana this year include USDC accounts for U.S. Samsung Galaxy users and integration with Polygon Labs' Open Money Stack.
#TheBillionaireTrades #TheBillionaireTradesMarketInsights
62
Artikel
Übersetzung ansehen
Crypto Market Loses About $330 Billion in a Week as Bitcoin Slides and Inflation Fears MountA six-week cryptocurrency selloff accelerated during the week of Nov. 9, wiping an estimated $330 billion from the market as investors confronted hotter-than-expected U.S. inflation, tighter monetary-policy expectations and renewed volatility in technology stocks.
The global cryptocurrency market declined 13% to approximately $2.2 trillion, according to Anadolu Agency, marking its sixth consecutive weekly decline. The estimated $330 billion loss is calculated from the reported percentage drop and rounded market value.
Bitcoin fell 14% during the week, dropping as low as $61,919.70 before recovering to $65,082 at the end of the reporting period. Ether, the cryptocurrency of the Ethereum network, declined 18% to $1,826.20.
The losses extended a downturn that has affected digital assets for more than a month, with investors reassessing the outlook for U.S. interest rates and other risk-sensitive investments.
Market capitalization represents the combined market value of circulating cryptocurrencies. A decline in that figure does not mean an equivalent amount of cash was withdrawn from the market, but reflects lower prices across digital assets.
Mete Ali Baskaya, a blockchain and crypto asset strategist, told Anadolu that stronger-than-expected U.S. inflation figures had strengthened expectations that the Federal Reserve would maintain a restrictive monetary policy.
The latest inflation data showed that U.S. consumer prices rose 0.4% in October, exceeding economists' expectations of a 0.3% increase. Core prices, which exclude food and energy, rose 0.3%, also above forecasts.
The figures added to expectations of another interest rate increase in December, placing additional pressure on cryptocurrencies and other speculative investments.
Higher interest rates can make interest-bearing assets more attractive while increasing the cost of financing leveraged investments. Expectations of tighter monetary policy can also reduce investors' willingness to take risks.
Baskaya identified withdrawals from spot Bitcoin exchange-traded funds and forced liquidations in futures markets as additional factors behind the decline.
The scale of those withdrawals has been significant.
According to Binance Research, U.S. spot Bitcoin ETFs recorded approximately $1.91 billion in net outflows over seven consecutive trading sessions from Nov. 5 through Nov.
#TheBillionaireTrades #TheBillionaireTradesMarketInsights
{spot}(BTCUSDT)
Crypto Market Loses About $330 Billion in a Week as Bitcoin Slides and Inflation Fears Mount
A six-week cryptocurrency selloff accelerated during the week of Nov. 9, wiping an estimated $330 billion from the market as investors confronted hotter-than-expected U.S. inflation, tighter monetary-policy expectations and renewed volatility in technology stocks.
The global cryptocurrency market declined 13% to approximately $2.2 trillion, according to Anadolu Agency, marking its sixth consecutive weekly decline. The estimated $330 billion loss is calculated from the reported percentage drop and rounded market value.
Bitcoin fell 14% during the week, dropping as low as $61,919.70 before recovering to $65,082 at the end of the reporting period. Ether, the cryptocurrency of the Ethereum network, declined 18% to $1,826.20.
The losses extended a downturn that has affected digital assets for more than a month, with investors reassessing the outlook for U.S. interest rates and other risk-sensitive investments.
Market capitalization represents the combined market value of circulating cryptocurrencies. A decline in that figure does not mean an equivalent amount of cash was withdrawn from the market, but reflects lower prices across digital assets.
Mete Ali Baskaya, a blockchain and crypto asset strategist, told Anadolu that stronger-than-expected U.S. inflation figures had strengthened expectations that the Federal Reserve would maintain a restrictive monetary policy.
The latest inflation data showed that U.S. consumer prices rose 0.4% in October, exceeding economists' expectations of a 0.3% increase. Core prices, which exclude food and energy, rose 0.3%, also above forecasts.
The figures added to expectations of another interest rate increase in December, placing additional pressure on cryptocurrencies and other speculative investments.
Higher interest rates can make interest-bearing assets more attractive while increasing the cost of financing leveraged investments. Expectations of tighter monetary policy can also reduce investors' willingness to take risks.
Baskaya identified withdrawals from spot Bitcoin exchange-traded funds and forced liquidations in futures markets as additional factors behind the decline.
The scale of those withdrawals has been significant.
According to Binance Research, U.S. spot Bitcoin ETFs recorded approximately $1.91 billion in net outflows over seven consecutive trading sessions from Nov. 5 through Nov.
#TheBillionaireTrades #TheBillionaireTradesMarketInsights
The global cryptocurrency market declined 13% to approximately $2.2 trillion, according to Anadolu Agency, marking its sixth consecutive weekly decline. The estimated $330 billion loss is calculated from the reported percentage drop and rounded market value.
Bitcoin fell 14% during the week, dropping as low as $61,919.70 before recovering to $65,082 at the end of the reporting period. Ether, the cryptocurrency of the Ethereum network, declined 18% to $1,826.20.
The losses extended a downturn that has affected digital assets for more than a month, with investors reassessing the outlook for U.S. interest rates and other risk-sensitive investments.
Market capitalization represents the combined market value of circulating cryptocurrencies. A decline in that figure does not mean an equivalent amount of cash was withdrawn from the market, but reflects lower prices across digital assets.
Mete Ali Baskaya, a blockchain and crypto asset strategist, told Anadolu that stronger-than-expected U.S. inflation figures had strengthened expectations that the Federal Reserve would maintain a restrictive monetary policy.
The latest inflation data showed that U.S. consumer prices rose 0.4% in October, exceeding economists' expectations of a 0.3% increase. Core prices, which exclude food and energy, rose 0.3%, also above forecasts.
The figures added to expectations of another interest rate increase in December, placing additional pressure on cryptocurrencies and other speculative investments.
Higher interest rates can make interest-bearing assets more attractive while increasing the cost of financing leveraged investments. Expectations of tighter monetary policy can also reduce investors' willingness to take risks.
Baskaya identified withdrawals from spot Bitcoin exchange-traded funds and forced liquidations in futures markets as additional factors behind the decline.
The scale of those withdrawals has been significant.
According to Binance Research, U.S. spot Bitcoin ETFs recorded approximately $1.91 billion in net outflows over seven consecutive trading sessions from Nov. 5 through Nov.
#TheBillionaireTrades #TheBillionaireTradesMarketInsights
9

Artikel
Übersetzung ansehen
The current price of Billions Network (BILL) hovers around $0.0041 to $0.00438, depending on live maBillions Network Price Overview
• Current Price Range: $0.0041 – $0.00438
• Circulating Supply: ~2.43 billion BILL
• Market Cap: ~$10 million
Key Market Factors & Risks
Low Liquidity & Volatility: With a relatively small market capitalization (~$10 million) and thin order-book depth compared to total fully diluted valuations, individual large-volume trades can cause sharp short-term volatility.
Ecosystem Adoption: Billions Network focuses on zero-knowledge human verification and Know-Your-Agent (KYA) frameworks for AI. Wider protocol integration and market sentiment (Fear & Greed Index currently leaning toward fear/neutral around 34) heavily dictate near-term trajectory.
Technical Analysis Indicators
On broader daily timeframes, $BILL shows a bearish macro trend with oversold short-term signals, meaning selling pressure has been heavy, though brief relief bounces can occur.
Relative Strength Index (RSI): The 14-day RSI sits near 28 to 32 across major trackers like CoinMarketCap and CoinGlass. Readings around or below 30 typically signal oversold conditions, which often precede short-term technical bounces—though intraday timeframes can briefly spike higher during minor rallies.
Moving Averages (SMA/EMA): BILL is trading well below its key 30-day (~$0.0056), 50-day, and 200-day moving averages. Until the price reclaims and holds above these lines, moving averages act as overhead resistance and maintain an overall Sell signal on daily charts.
Momentum & Volatility: With a 30-day decline of roughly 46% and high daily volatility, volume spikes remain muted. Traders on Binance generally look for sustained volume alongside a break above the 50-day SMA before confirming a trend reversal.
Risk Assessment: Micro-Cap & Token-Specific Factors
Investing in micro-cap tokens (market caps under $15M–$50M) carries amplified risks compared to established assets:
Order-Book Slippage: While BILL trades on exchanges such as Coinbase and Kraken, +/-2% order-book depth on individual pairs often ranges between $4,000 and $29,000. Market orders of even a few thousand dollars can move the price noticeably and cause slippage.
Supply Overhang & Unlocks: Only about 24.3% of BILL's 10 billion maximum supply is currently circulating (~$10M market cap vs. ~$40.7M fully diluted valuation). Furthermore, a 180-day staking lock expired on October 31, 2026, freeing up staked tokens and rewards that can create ongoing sell pressure if holders exit.
On-Chain & Governance Scrutiny: On-chain analysts have flagged large historical token transfers from wallets attributed to team-linked entities onto exchanges. Combined with a ~98% drawdown from its May 2026 all-time high (~$0.233), investor confidence requires strict due diligence.
#TheBillionaireTrades
{future}(BILLUSDT)
The current price of Billions Network (BILL) hovers around $0.0041 to $0.00438, depending on live ma
Billions Network Price Overview
• Current Price Range: $0.0041 – $0.00438
• Circulating Supply: ~2.43 billion BILL
• Market Cap: ~$10 million
Key Market Factors & Risks
Low Liquidity & Volatility: With a relatively small market capitalization (~$10 million) and thin order-book depth compared to total fully diluted valuations, individual large-volume trades can cause sharp short-term volatility.
Ecosystem Adoption: Billions Network focuses on zero-knowledge human verification and Know-Your-Agent (KYA) frameworks for AI. Wider protocol integration and market sentiment (Fear & Greed Index currently leaning toward fear/neutral around 34) heavily dictate near-term trajectory.
Technical Analysis Indicators
On broader daily timeframes, $BILL shows a bearish macro trend with oversold short-term signals, meaning selling pressure has been heavy, though brief relief bounces can occur.
Relative Strength Index (RSI): The 14-day RSI sits near 28 to 32 across major trackers like CoinMarketCap and CoinGlass. Readings around or below 30 typically signal oversold conditions, which often precede short-term technical bounces—though intraday timeframes can briefly spike higher during minor rallies.
Moving Averages (SMA/EMA): BILL is trading well below its key 30-day (~$0.0056), 50-day, and 200-day moving averages. Until the price reclaims and holds above these lines, moving averages act as overhead resistance and maintain an overall Sell signal on daily charts.
Momentum & Volatility: With a 30-day decline of roughly 46% and high daily volatility, volume spikes remain muted. Traders on Binance generally look for sustained volume alongside a break above the 50-day SMA before confirming a trend reversal.
Risk Assessment: Micro-Cap & Token-Specific Factors
Investing in micro-cap tokens (market caps under $15M–$50M) carries amplified risks compared to established assets:
Order-Book Slippage: While BILL trades on exchanges such as Coinbase and Kraken, +/-2% order-book depth on individual pairs often ranges between $4,000 and $29,000. Market orders of even a few thousand dollars can move the price noticeably and cause slippage.
Supply Overhang & Unlocks: Only about 24.3% of BILL's 10 billion maximum supply is currently circulating (~$10M market cap vs. ~$40.7M fully diluted valuation). Furthermore, a 180-day staking lock expired on October 31, 2026, freeing up staked tokens and rewards that can create ongoing sell pressure if holders exit.
On-Chain & Governance Scrutiny: On-chain analysts have flagged large historical token transfers from wallets attributed to team-linked entities onto exchanges. Combined with a ~98% drawdown from its May 2026 all-time high (~$0.233), investor confidence requires strict due diligence.
#TheBillionaireTrades
• Current Price Range: $0.0041 – $0.00438
• Circulating Supply: ~2.43 billion BILL
• Market Cap: ~$10 million
Key Market Factors & Risks
Low Liquidity & Volatility: With a relatively small market capitalization (~$10 million) and thin order-book depth compared to total fully diluted valuations, individual large-volume trades can cause sharp short-term volatility.
Ecosystem Adoption: Billions Network focuses on zero-knowledge human verification and Know-Your-Agent (KYA) frameworks for AI. Wider protocol integration and market sentiment (Fear & Greed Index currently leaning toward fear/neutral around 34) heavily dictate near-term trajectory.
Technical Analysis Indicators
On broader daily timeframes, $BILL shows a bearish macro trend with oversold short-term signals, meaning selling pressure has been heavy, though brief relief bounces can occur.
Relative Strength Index (RSI): The 14-day RSI sits near 28 to 32 across major trackers like CoinMarketCap and CoinGlass. Readings around or below 30 typically signal oversold conditions, which often precede short-term technical bounces—though intraday timeframes can briefly spike higher during minor rallies.
Moving Averages (SMA/EMA): BILL is trading well below its key 30-day (~$0.0056), 50-day, and 200-day moving averages. Until the price reclaims and holds above these lines, moving averages act as overhead resistance and maintain an overall Sell signal on daily charts.
Momentum & Volatility: With a 30-day decline of roughly 46% and high daily volatility, volume spikes remain muted. Traders on Binance generally look for sustained volume alongside a break above the 50-day SMA before confirming a trend reversal.
Risk Assessment: Micro-Cap & Token-Specific Factors
Investing in micro-cap tokens (market caps under $15M–$50M) carries amplified risks compared to established assets:
Order-Book Slippage: While BILL trades on exchanges such as Coinbase and Kraken, +/-2% order-book depth on individual pairs often ranges between $4,000 and $29,000. Market orders of even a few thousand dollars can move the price noticeably and cause slippage.
Supply Overhang & Unlocks: Only about 24.3% of BILL's 10 billion maximum supply is currently circulating (~$10M market cap vs. ~$40.7M fully diluted valuation). Furthermore, a 180-day staking lock expired on October 31, 2026, freeing up staked tokens and rewards that can create ongoing sell pressure if holders exit.
On-Chain & Governance Scrutiny: On-chain analysts have flagged large historical token transfers from wallets attributed to team-linked entities onto exchanges. Combined with a ~98% drawdown from its May 2026 all-time high (~$0.233), investor confidence requires strict due diligence.
#TheBillionaireTrades
2
571
Artikel
Übersetzung ansehen
XRP Ledger Creates New Baseline: 1 Billion SecuredDespite the market downturn, $XRP Ledger is showing a somewhat reassuring trend: the price has bounced toward the $1 mark and, thankfully, the move is followed by a volume uptick, which could start a proper recovery rally.
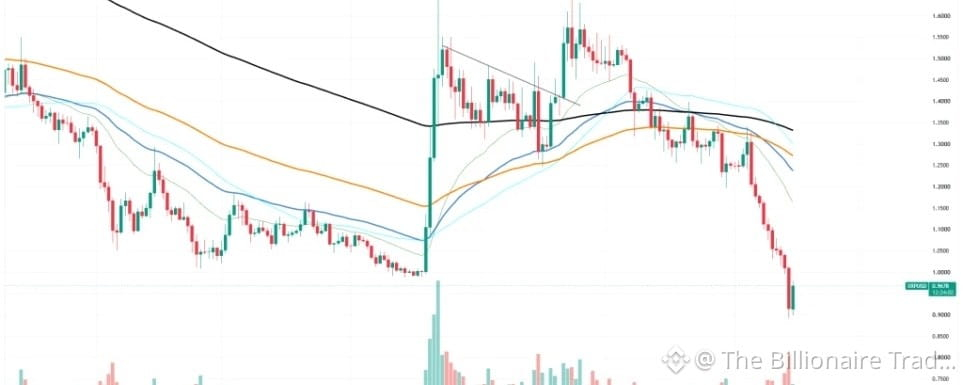
XRP is trading at $0.96 after dipping to $0.89. The $1 threshold, which essentially enables a rapid decrease if broken, gave in on November 14. It's the first time XRP traded below $1 since mid-August.
The market is bearish, and the RSI dropped into the 20-ish zone, which is considered "extremely oversold". Moving averages are still rapidly diverging, which might further reinforce the bearish dynamic.
Even if XRP reclaims the round number, bulls might still stay sidelined. If bulls somehow wake up, a recovery toward $1.2 is the main priority, as it's the level where a lot of investors accumulated XRP in the past.
Ledger activity
On the other hand, the Ledger shows elevated activity, with the potential to go further and reclaim levels we haven't seen in the bear market. Still, elevated activity during a prolonged market descent is not something we should just shake off.
According to on-chain data, payment volume on the XRP Ledger reached around 1.1 billion XRP, up 139.9%. Active accounts went up by 154.5%, reaching 42,300. Payments volume growth is substantial, but not record-breaking by any means.
The XRP Ledger has seen substantial growth in various on-chain metrics, which, unfortunately, does not give the price enough support. A lot of the Ledger activity might be automated, driven by either trading bots or sophisticated LLM models. The market is mostly driven by speculative interest rather than fundamental network usage.
The activity of investors who are trying to cash out or pull their holdings away from exchanges could be the key here. Growing payments volume most likely reflects growing fear among investors, as some of them move funds to exchanges in order to liquidate their coins.
Payments volume rises, but so does the bear market pressure, with a possibility of a further downturn that could make things worse than they already are.
#TheBillionaireTrades #TheBillionaireTradesMarketInsights
{spot}(XRPUSDT)
XRP Ledger Creates New Baseline: 1 Billion Secured
Despite the market downturn, $XRP Ledger is showing a somewhat reassuring trend: the price has bounced toward the $1 mark and, thankfully, the move is followed by a volume uptick, which could start a proper recovery rally.
XRP is trading at $0.96 after dipping to $0.89. The $1 threshold, which essentially enables a rapid decrease if broken, gave in on November 14. It's the first time XRP traded below $1 since mid-August.
The market is bearish, and the RSI dropped into the 20-ish zone, which is considered "extremely oversold". Moving averages are still rapidly diverging, which might further reinforce the bearish dynamic.
Even if XRP reclaims the round number, bulls might still stay sidelined. If bulls somehow wake up, a recovery toward $1.2 is the main priority, as it's the level where a lot of investors accumulated XRP in the past.
Ledger activity
On the other hand, the Ledger shows elevated activity, with the potential to go further and reclaim levels we haven't seen in the bear market. Still, elevated activity during a prolonged market descent is not something we should just shake off.
According to on-chain data, payment volume on the XRP Ledger reached around 1.1 billion XRP, up 139.9%. Active accounts went up by 154.5%, reaching 42,300. Payments volume growth is substantial, but not record-breaking by any means.
The XRP Ledger has seen substantial growth in various on-chain metrics, which, unfortunately, does not give the price enough support. A lot of the Ledger activity might be automated, driven by either trading bots or sophisticated LLM models. The market is mostly driven by speculative interest rather than fundamental network usage.
The activity of investors who are trying to cash out or pull their holdings away from exchanges could be the key here. Growing payments volume most likely reflects growing fear among investors, as some of them move funds to exchanges in order to liquidate their coins.
Payments volume rises, but so does the bear market pressure, with a possibility of a further downturn that could make things worse than they already are.
#TheBillionaireTrades #TheBillionaireTradesMarketInsights
XRP is trading at $0.96 after dipping to $0.89. The $1 threshold, which essentially enables a rapid decrease if broken, gave in on November 14. It's the first time XRP traded below $1 since mid-August.
The market is bearish, and the RSI dropped into the 20-ish zone, which is considered "extremely oversold". Moving averages are still rapidly diverging, which might further reinforce the bearish dynamic.
Even if XRP reclaims the round number, bulls might still stay sidelined. If bulls somehow wake up, a recovery toward $1.2 is the main priority, as it's the level where a lot of investors accumulated XRP in the past.
Ledger activity
On the other hand, the Ledger shows elevated activity, with the potential to go further and reclaim levels we haven't seen in the bear market. Still, elevated activity during a prolonged market descent is not something we should just shake off.
According to on-chain data, payment volume on the XRP Ledger reached around 1.1 billion XRP, up 139.9%. Active accounts went up by 154.5%, reaching 42,300. Payments volume growth is substantial, but not record-breaking by any means.
The XRP Ledger has seen substantial growth in various on-chain metrics, which, unfortunately, does not give the price enough support. A lot of the Ledger activity might be automated, driven by either trading bots or sophisticated LLM models. The market is mostly driven by speculative interest rather than fundamental network usage.
The activity of investors who are trying to cash out or pull their holdings away from exchanges could be the key here. Growing payments volume most likely reflects growing fear among investors, as some of them move funds to exchanges in order to liquidate their coins.
Payments volume rises, but so does the bear market pressure, with a possibility of a further downturn that could make things worse than they already are.
#TheBillionaireTrades #TheBillionaireTradesMarketInsights
50
Artikel
Übersetzung ansehen
Bitcoin heads for sixth weekly loss as Anthropic’s blockbuster IPO loomsBitcoin $BTC is down 21% this year as investors weigh Anthropic’s anticipated listing, Nvidia’s leadership upheaval and rising Fed rate hike expectations.
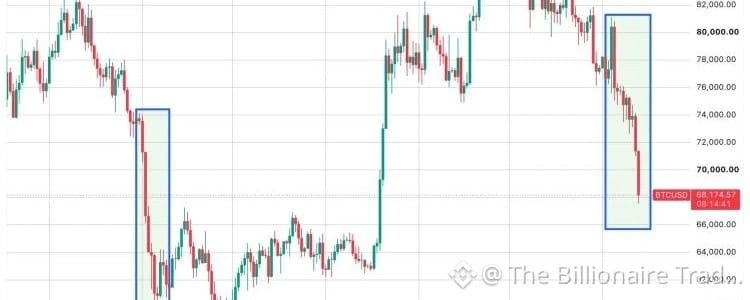
Bitcoin is on course for its sixth consecutive weekly decline, echoing the losing streak in Q1, when prices bottomed out near $60,000. The record is nine weeks, set in 2022. Bitcoin is now down 11% in November, 17% in the fourth quarter and 21% so far in 2026.
One of next week’s biggest market events is Anthropic’s anticipated IPO. The offering has attracted orders for roughly six times the shares available, Bloomberg reported. The AI company aims to raise up to $64.4 billion, alongside a $26 billion private placement, targeting a fully diluted valuation of about $1.4 trillion. Nvidia has committed around $10 billion to the private placement. Anthropic’s annualized revenue run rate reached $81 billion at the end of October, up $10 billion in a month, with shares expected to trade on Nasdaq under the ticker $ANTHROPIC .
The prospect of investors freeing up capital for one of the blockbuster listing offers one possible explanation for the sell-off in bitcoin. There are parallels with the run-up to SpaceX’s IPO. The company began trading on June 12. Earlier that month, bitcoin fell roughly 20%, from around $75,000 to $60,000 between June 1 and June 5, before rebounding toward $68,000 after the IPO launched.
Other headwinds on the plunge include Jensen Huang’s resignation as CEO of Nvidia and growing expectations of a 25-basis-point Federal Reserve rate increase at its Dec. 9 meeting.
#TheBillionaireTrades #TheBillionaireTradesMarketInsights
{spot}(BTCUSDT)
{future}(ANTHROPICUSDT)
Bitcoin heads for sixth weekly loss as Anthropic’s blockbuster IPO looms
Bitcoin $BTC is down 21% this year as investors weigh Anthropic’s anticipated listing, Nvidia’s leadership upheaval and rising Fed rate hike expectations.
Bitcoin is on course for its sixth consecutive weekly decline, echoing the losing streak in Q1, when prices bottomed out near $60,000. The record is nine weeks, set in 2022. Bitcoin is now down 11% in November, 17% in the fourth quarter and 21% so far in 2026.
One of next week’s biggest market events is Anthropic’s anticipated IPO. The offering has attracted orders for roughly six times the shares available, Bloomberg reported. The AI company aims to raise up to $64.4 billion, alongside a $26 billion private placement, targeting a fully diluted valuation of about $1.4 trillion. Nvidia has committed around $10 billion to the private placement. Anthropic’s annualized revenue run rate reached $81 billion at the end of October, up $10 billion in a month, with shares expected to trade on Nasdaq under the ticker $ANTHROPIC .
The prospect of investors freeing up capital for one of the blockbuster listing offers one possible explanation for the sell-off in bitcoin. There are parallels with the run-up to SpaceX’s IPO. The company began trading on June 12. Earlier that month, bitcoin fell roughly 20%, from around $75,000 to $60,000 between June 1 and June 5, before rebounding toward $68,000 after the IPO launched.
Other headwinds on the plunge include Jensen Huang’s resignation as CEO of Nvidia and growing expectations of a 25-basis-point Federal Reserve rate increase at its Dec. 9 meeting.
#TheBillionaireTrades #TheBillionaireTradesMarketInsights
Bitcoin is on course for its sixth consecutive weekly decline, echoing the losing streak in Q1, when prices bottomed out near $60,000. The record is nine weeks, set in 2022. Bitcoin is now down 11% in November, 17% in the fourth quarter and 21% so far in 2026.
One of next week’s biggest market events is Anthropic’s anticipated IPO. The offering has attracted orders for roughly six times the shares available, Bloomberg reported. The AI company aims to raise up to $64.4 billion, alongside a $26 billion private placement, targeting a fully diluted valuation of about $1.4 trillion. Nvidia has committed around $10 billion to the private placement. Anthropic’s annualized revenue run rate reached $81 billion at the end of October, up $10 billion in a month, with shares expected to trade on Nasdaq under the ticker $ANTHROPIC .
The prospect of investors freeing up capital for one of the blockbuster listing offers one possible explanation for the sell-off in bitcoin. There are parallels with the run-up to SpaceX’s IPO. The company began trading on June 12. Earlier that month, bitcoin fell roughly 20%, from around $75,000 to $60,000 between June 1 and June 5, before rebounding toward $68,000 after the IPO launched.
Other headwinds on the plunge include Jensen Huang’s resignation as CEO of Nvidia and growing expectations of a 25-basis-point Federal Reserve rate increase at its Dec. 9 meeting.
#TheBillionaireTrades #TheBillionaireTradesMarketInsights
69
Übersetzung ansehen
$BTC must hold the $70,000 level. A breakdown or daily close below this level could put significant downside pressure on the market.
Currently, Bitcoin is sitting at the intersection of two key trendline supports — an upward trendline and a downward trendline.
Ideally, we should see a strong bounce from this zone to maintain the current structure.
If BTC holds $70K, my upside targets are:
🎯 $83,000
🎯 $86,000
🎯 $88,000
🎯 $92,000
However, if $70,000 fails to hold, the next major downside target could be $60,000.
$70K is the level to watch. The next move could define Bitcoin’s direction.
#TheBillionaireTrades
{spot}(BTCUSDT)
$BTC must hold the $70,000 level. A breakdown or daily close below this level could put significant downside pressure on the market.
Currently, Bitcoin is sitting at the intersection of two key trendline supports — an upward trendline and a downward trendline.
Ideally, we should see a strong bounce from this zone to maintain the current structure.
If BTC holds $70K, my upside targets are:
🎯 $83,000
🎯 $86,000
🎯 $88,000
🎯 $92,000
However, if $70,000 fails to hold, the next major downside target could be $60,000.
$70K is the level to watch. The next move could define Bitcoin’s direction.
#TheBillionaireTrades
Currently, Bitcoin is sitting at the intersection of two key trendline supports — an upward trendline and a downward trendline.
Ideally, we should see a strong bounce from this zone to maintain the current structure.
If BTC holds $70K, my upside targets are:
🎯 $83,000
🎯 $86,000
🎯 $88,000
🎯 $92,000
However, if $70,000 fails to hold, the next major downside target could be $60,000.
$70K is the level to watch. The next move could define Bitcoin’s direction.
#TheBillionaireTrades
1
78
Übersetzung ansehen
Russia loses ground as Europe's 4th-largest economy doubles exports to Africa's largest oil reserve holder, with Italy–Libya trade hitting €6.8 billion
Bilateral trade between Italy, Europe's 4th-largest economy (statista ranking), and Libya, Africa's largest oil reserve holder, experienced dramatic growth during the first seven months of 2026, driven by a surge in commercial shipments and refined petroleum sales.
Bilateral trade between Italy and Libya saw a significant 44.9% increase in the first seven months of 2026, reaching nearly €6.8 billion.
Italian exports to Libya doubled, with refined petroleum products making up 58.8% of total exports and non-energy sectors also growing.
Italy became Libya's largest foreign trading partner, supplying 17% of all Libyan imports and diversifying into sectors like construction materials and consumer goods.
As a result, Russian fuel exports to Libya plummeted from 56,000 to about 5,000 barrels per day, with Italy now providing most of Libya's imported fuel.
#TheBillionaireTrades
Russia loses ground as Europe's 4th-largest economy doubles exports to Africa's largest oil reserve holder, with Italy–Libya trade hitting €6.8 billion
Bilateral trade between Italy, Europe's 4th-largest economy (statista ranking), and Libya, Africa's largest oil reserve holder, experienced dramatic growth during the first seven months of 2026, driven by a surge in commercial shipments and refined petroleum sales.
Bilateral trade between Italy and Libya saw a significant 44.9% increase in the first seven months of 2026, reaching nearly €6.8 billion.
Italian exports to Libya doubled, with refined petroleum products making up 58.8% of total exports and non-energy sectors also growing.
Italy became Libya's largest foreign trading partner, supplying 17% of all Libyan imports and diversifying into sectors like construction materials and consumer goods.
As a result, Russian fuel exports to Libya plummeted from 56,000 to about 5,000 barrels per day, with Italy now providing most of Libya's imported fuel.
#TheBillionaireTrades
Bilateral trade between Italy, Europe's 4th-largest economy (statista ranking), and Libya, Africa's largest oil reserve holder, experienced dramatic growth during the first seven months of 2026, driven by a surge in commercial shipments and refined petroleum sales.
Bilateral trade between Italy and Libya saw a significant 44.9% increase in the first seven months of 2026, reaching nearly €6.8 billion.
Italian exports to Libya doubled, with refined petroleum products making up 58.8% of total exports and non-energy sectors also growing.
Italy became Libya's largest foreign trading partner, supplying 17% of all Libyan imports and diversifying into sectors like construction materials and consumer goods.
As a result, Russian fuel exports to Libya plummeted from 56,000 to about 5,000 barrels per day, with Italy now providing most of Libya's imported fuel.
#TheBillionaireTrades
43
Übersetzung ansehen
Bitcoin Retreats as Nvidia Turmoil Weighs on Risk Appetite
Bitcoin $BTC retreated Thursday as renewed unease over technology stocks weighed on risk appetite, with persistent withdrawals from US spot exchange-traded funds adding to the pressure.
The original cryptocurrency fell as much as 2.2% and was trading around $72,900 as of early morning in New York. Other cryptocurrencies also weakened along with US stock futures, which were dragged lower as concerns over leadership turmoil at Nvidia Corp. weighed on the artificial intelligence trade.
#TheBillionaireTrades
{spot}(BTCUSDT)
Bitcoin Retreats as Nvidia Turmoil Weighs on Risk Appetite
Bitcoin $BTC retreated Thursday as renewed unease over technology stocks weighed on risk appetite, with persistent withdrawals from US spot exchange-traded funds adding to the pressure.
The original cryptocurrency fell as much as 2.2% and was trading around $72,900 as of early morning in New York. Other cryptocurrencies also weakened along with US stock futures, which were dragged lower as concerns over leadership turmoil at Nvidia Corp. weighed on the artificial intelligence trade.
#TheBillionaireTrades
Bitcoin $BTC retreated Thursday as renewed unease over technology stocks weighed on risk appetite, with persistent withdrawals from US spot exchange-traded funds adding to the pressure.
The original cryptocurrency fell as much as 2.2% and was trading around $72,900 as of early morning in New York. Other cryptocurrencies also weakened along with US stock futures, which were dragged lower as concerns over leadership turmoil at Nvidia Corp. weighed on the artificial intelligence trade.
#TheBillionaireTrades
283
Übersetzung ansehen
Billions Network (BILL) has experienced a further breakdown, dropping to a new all-time low of $0.004716.
Overview
• The Breakdown: The token has continued its downward trajectory, dropping significantly below the previous stabilization levels and hitting an absolute historic floor of $0.004716 USD.
• Current Standing: As of November 4, 2026, BILL is trading at approximately $0.00485 USD across major platforms. This marks an additional decline from the previous alert's $0.00535 floor.
• Technical Impact: The token remains in an aggressive macro down-trend, trading roughly 97.9% below its structural all-time high of $0.23 USD. Momentum indicators indicate deep, persistent selling pressure with no immediate sign of a reversal structure.
Market Digest & Insights
• New Floor Discovery: Market tracking from CryptoSlate confirms that the token recorded its absolute all-time low during this observation window.
• Volume Distribution: Aggregated derivatives data from CoinGecko shows active short positions maintaining dominance, with millions in 24-hour volume concentrated across Binance and OKX futures contracts.
• Immediate Outlook: The token is currently attempting a low-volume drift. Near-term structural charts indicate that any potential recovery must first reclaim and hold the $0.0050–$0.0055 liquidity range before buyers can target a broader trend.
#TheBillionaireTrades
{future}(BILLUSDT)
Billions Network (BILL) has experienced a further breakdown, dropping to a new all-time low of $0.004716.
Overview
• The Breakdown: The token has continued its downward trajectory, dropping significantly below the previous stabilization levels and hitting an absolute historic floor of $0.004716 USD.
• Current Standing: As of November 4, 2026, BILL is trading at approximately $0.00485 USD across major platforms. This marks an additional decline from the previous alert's $0.00535 floor.
• Technical Impact: The token remains in an aggressive macro down-trend, trading roughly 97.9% below its structural all-time high of $0.23 USD. Momentum indicators indicate deep, persistent selling pressure with no immediate sign of a reversal structure.
Market Digest & Insights
• New Floor Discovery: Market tracking from CryptoSlate confirms that the token recorded its absolute all-time low during this observation window.
• Volume Distribution: Aggregated derivatives data from CoinGecko shows active short positions maintaining dominance, with millions in 24-hour volume concentrated across Binance and OKX futures contracts.
• Immediate Outlook: The token is currently attempting a low-volume drift. Near-term structural charts indicate that any potential recovery must first reclaim and hold the $0.0050–$0.0055 liquidity range before buyers can target a broader trend.
#TheBillionaireTrades
Overview
• The Breakdown: The token has continued its downward trajectory, dropping significantly below the previous stabilization levels and hitting an absolute historic floor of $0.004716 USD.
• Current Standing: As of November 4, 2026, BILL is trading at approximately $0.00485 USD across major platforms. This marks an additional decline from the previous alert's $0.00535 floor.
• Technical Impact: The token remains in an aggressive macro down-trend, trading roughly 97.9% below its structural all-time high of $0.23 USD. Momentum indicators indicate deep, persistent selling pressure with no immediate sign of a reversal structure.
Market Digest & Insights
• New Floor Discovery: Market tracking from CryptoSlate confirms that the token recorded its absolute all-time low during this observation window.
• Volume Distribution: Aggregated derivatives data from CoinGecko shows active short positions maintaining dominance, with millions in 24-hour volume concentrated across Binance and OKX futures contracts.
• Immediate Outlook: The token is currently attempting a low-volume drift. Near-term structural charts indicate that any potential recovery must first reclaim and hold the $0.0050–$0.0055 liquidity range before buyers can target a broader trend.
#TheBillionaireTrades
671

Artikel
Kursprognose für die wichtigsten Altcoins: Ripple, Cardano und Solana bleiben anfällig für weitere VerlusteRipple hält sich am Dienstag über seiner psychologischen Unterstützung bei 1,00 $, nachdem der Kurs fünf Tage in Folge gefallen ist.
Cardano notiert über 0,1700 $, während Käufer die Unterstützung bei 0,1712 $ verteidigen, die nun im Fokus steht.
Solana setzt seinen Abwärtstrend fort, nachdem der Kurs unter eine langfristige Unterstützungstrendlinie gefallen ist.
Ripple $XRP , Cardano $ADA und Solana $SOL haben nach dem Rückgang der vergangenen Woche Schwierigkeiten, wieder Tritt zu fassen. Grund ist die nachlassende Risikobereitschaft institutioneller Anleger. Ripple steht kurz davor, seine psychologische Schwelle von 1,00 $ zu testen, Cardano prüft eine wichtige horizontale Marke, während Solana nach dem Durchbruch einer entscheidenden Unterstützungstrendlinie weiterhin Gefahr läuft, seinen Abwärtstrend auszuweiten.
Kursprognose für die wichtigsten Altcoins: Ripple, Cardano und Solana bleiben anfällig für weitere Verluste
Ripple hält sich am Dienstag über seiner psychologischen Unterstützung bei 1,00 $, nachdem der Kurs fünf Tage in Folge gefallen ist.
Cardano notiert über 0,1700 $, während Käufer die Unterstützung bei 0,1712 $ verteidigen, die nun im Fokus steht.
Solana setzt seinen Abwärtstrend fort, nachdem der Kurs unter eine langfristige Unterstützungstrendlinie gefallen ist.
Ripple $XRP , Cardano $ADA und Solana $SOL haben nach dem Rückgang der vergangenen Woche Schwierigkeiten, wieder Tritt zu fassen. Grund ist die nachlassende Risikobereitschaft institutioneller Anleger. Ripple steht kurz davor, seine psychologische Schwelle von 1,00 $ zu testen, Cardano prüft eine wichtige horizontale Marke, während Solana nach dem Durchbruch einer entscheidenden Unterstützungstrendlinie weiterhin Gefahr läuft, seinen Abwärtstrend auszuweiten.
Cardano notiert über 0,1700 $, während Käufer die Unterstützung bei 0,1712 $ verteidigen, die nun im Fokus steht.
Solana setzt seinen Abwärtstrend fort, nachdem der Kurs unter eine langfristige Unterstützungstrendlinie gefallen ist.
Ripple $XRP , Cardano $ADA und Solana $SOL haben nach dem Rückgang der vergangenen Woche Schwierigkeiten, wieder Tritt zu fassen. Grund ist die nachlassende Risikobereitschaft institutioneller Anleger. Ripple steht kurz davor, seine psychologische Schwelle von 1,00 $ zu testen, Cardano prüft eine wichtige horizontale Marke, während Solana nach dem Durchbruch einer entscheidenden Unterstützungstrendlinie weiterhin Gefahr läuft, seinen Abwärtstrend auszuweiten.
256

Artikel
Nvidias Ausverkauf beschleunigt sich. Was kommt als Nächstes für die Aktie?Die Aktien des Chipgiganten schlossen am Dienstag mit einem Minus von 5,5 % und gaben damit den zweiten Tag in dieser Woche nach. Sie fielen auf Stände, die zuletzt im Frühjahr erreicht worden waren. Beim Schlusskurs am Dienstag von 168,47 US-Dollar und jüngsten Kursen um 168 US-Dollar liegen sie seit dem Schlusskurs am Freitag rund 10 % im Minus. Anleger verarbeiteten die Nachricht, dass CEO Jensen Huang wegen mutmaßlicher Verbindungen zu einem chinesischen Spion untersucht wird, und setzten sich mit der allgemeinen pessimistischeren Stimmung auseinander, die teilweise durch neue Sorgen über Zinserhöhungen ausgelöst wurde.
Durch den jüngsten Rückgang liegt die Aktie in diesem Monat rund 18 % im Minus. Was als Nächstes auf Huang und Nvidia (NVDA) zukommt, bleibt offen.
Nvidias Ausverkauf beschleunigt sich. Was kommt als Nächstes für die Aktie?
Die Aktien des Chipgiganten schlossen am Dienstag mit einem Minus von 5,5 % und gaben damit den zweiten Tag in dieser Woche nach. Sie fielen auf Stände, die zuletzt im Frühjahr erreicht worden waren. Beim Schlusskurs am Dienstag von 168,47 US-Dollar und jüngsten Kursen um 168 US-Dollar liegen sie seit dem Schlusskurs am Freitag rund 10 % im Minus. Anleger verarbeiteten die Nachricht, dass CEO Jensen Huang wegen mutmaßlicher Verbindungen zu einem chinesischen Spion untersucht wird, und setzten sich mit der allgemeinen pessimistischeren Stimmung auseinander, die teilweise durch neue Sorgen über Zinserhöhungen ausgelöst wurde.
Durch den jüngsten Rückgang liegt die Aktie in diesem Monat rund 18 % im Minus. Was als Nächstes auf Huang und Nvidia (NVDA) zukommt, bleibt offen.
Durch den jüngsten Rückgang liegt die Aktie in diesem Monat rund 18 % im Minus. Was als Nächstes auf Huang und Nvidia (NVDA) zukommt, bleibt offen.
NVDAB+0,31%
ARKKETF+0,80%
113
Übersetzung ansehen
Billions Network $BILL is displaying a Strong Sell overall technical rating across daily and weekly timeframes, driven by steep multi-month downtrends and heavy supply concentration.
Current Price & Market Snapshot
• Current Price: ~$0.0045 – $0.0055 USD
• All-Time High (May 2026): $0.23 – $0.24 USD (down over 96% from peak)
• Market Capitalization: ~$13.26M USD (#555 rank)
• Fully Diluted Valuation (FDV): ~$42.5M – $54.7M USD
• Circulating Supply: ~2 Billion / 10 Billion total tokens (24.2%)
Key Technical & Fundamental Risks
• Supply Concentration: On-chain metrics reveal that the core team and top 10 wallets control roughly 94% to 97% of the total 10 billion token supply.
• Sell-Side Pressure: Low circulating float (24.2%) paired with upcoming token unlocks creates persistent downward distribution and thin liquidity.
• Key Levels to Watch:
• Support: Immediate downside risk tests levels below $0.0045 if selling persists.
• Resistance: A reclaim and daily close above $0.0050 – $0.0051 is required to signal initial short-term stabilization.
#TheBillionaireTrades
{future}(BILLUSDT)
Billions Network $BILL is displaying a Strong Sell overall technical rating across daily and weekly timeframes, driven by steep multi-month downtrends and heavy supply concentration.
Current Price & Market Snapshot
• Current Price: ~$0.0045 – $0.0055 USD
• All-Time High (May 2026): $0.23 – $0.24 USD (down over 96% from peak)
• Market Capitalization: ~$13.26M USD (#555 rank)
• Fully Diluted Valuation (FDV): ~$42.5M – $54.7M USD
• Circulating Supply: ~2 Billion / 10 Billion total tokens (24.2%)
Key Technical & Fundamental Risks
• Supply Concentration: On-chain metrics reveal that the core team and top 10 wallets control roughly 94% to 97% of the total 10 billion token supply.
• Sell-Side Pressure: Low circulating float (24.2%) paired with upcoming token unlocks creates persistent downward distribution and thin liquidity.
• Key Levels to Watch:
• Support: Immediate downside risk tests levels below $0.0045 if selling persists.
• Resistance: A reclaim and daily close above $0.0050 – $0.0051 is required to signal initial short-term stabilization.
#TheBillionaireTrades
Current Price & Market Snapshot
• Current Price: ~$0.0045 – $0.0055 USD
• All-Time High (May 2026): $0.23 – $0.24 USD (down over 96% from peak)
• Market Capitalization: ~$13.26M USD (#555 rank)
• Fully Diluted Valuation (FDV): ~$42.5M – $54.7M USD
• Circulating Supply: ~2 Billion / 10 Billion total tokens (24.2%)
Key Technical & Fundamental Risks
• Supply Concentration: On-chain metrics reveal that the core team and top 10 wallets control roughly 94% to 97% of the total 10 billion token supply.
• Sell-Side Pressure: Low circulating float (24.2%) paired with upcoming token unlocks creates persistent downward distribution and thin liquidity.
• Key Levels to Watch:
• Support: Immediate downside risk tests levels below $0.0045 if selling persists.
• Resistance: A reclaim and daily close above $0.0050 – $0.0051 is required to signal initial short-term stabilization.
#TheBillionaireTrades
572
Übersetzung ansehen
The live price of Billions Network $BILL / BILLIONSN is approximately $0.0043 to $0.0059 USD, reflecting a downward trend over the past 24 hours.
News & Market Analysis
• Downward Momentum: Billions Network has experienced significant multi-week and monthly pullbacks, declining roughly 48% to 52% over the past month and down over 75% across the last 3 months.
• Technical Outlook: Overall technical indicators, oscillators, and moving averages lean neutral to bearish in the short term as the token consolidates after its earlier 2026 highs.
• Ecosystem Role: Billions Network operates as a mobile-first universal Human and AI network utilizing zero-knowledge proofs for privacy-preserving human verification and AI agent validation, trading across major centralized and decentralized exchanges.
#TheBillionaireTrades
{future}(BILLUSDT)
The live price of Billions Network $BILL / BILLIONSN is approximately $0.0043 to $0.0059 USD, reflecting a downward trend over the past 24 hours.
News & Market Analysis
• Downward Momentum: Billions Network has experienced significant multi-week and monthly pullbacks, declining roughly 48% to 52% over the past month and down over 75% across the last 3 months.
• Technical Outlook: Overall technical indicators, oscillators, and moving averages lean neutral to bearish in the short term as the token consolidates after its earlier 2026 highs.
• Ecosystem Role: Billions Network operates as a mobile-first universal Human and AI network utilizing zero-knowledge proofs for privacy-preserving human verification and AI agent validation, trading across major centralized and decentralized exchanges.
#TheBillionaireTrades
News & Market Analysis
• Downward Momentum: Billions Network has experienced significant multi-week and monthly pullbacks, declining roughly 48% to 52% over the past month and down over 75% across the last 3 months.
• Technical Outlook: Overall technical indicators, oscillators, and moving averages lean neutral to bearish in the short term as the token consolidates after its earlier 2026 highs.
• Ecosystem Role: Billions Network operates as a mobile-first universal Human and AI network utilizing zero-knowledge proofs for privacy-preserving human verification and AI agent validation, trading across major centralized and decentralized exchanges.
#TheBillionaireTrades
393

Artikel
Übersetzung ansehen
Bitcoin holds below $76K as Binance EU closures add to crypto market pressureBitcoin $BTC traded below $76,000 on Sunday as fresh regulatory and security concerns weighed on the cryptocurrency industry, with Binance preparing to close certain European customer accounts and authorities intensifying scrutiny of digital asset transactions.
The world’s largest cryptocurrency reversed course from earlier in the day to trade higher by 0.3% to $75,908 at 15:20 ET (20:20 GMT), after a difficult week for digital assets. Bitcoin remained below the $80,000 mark as investors assessed regulatory developments and risks surrounding major cryptocurrency platforms.
The world’s largest cryptocurrency reversed course from earlier in the day to trade higher by 0.3% to $75,908 at 15:20 ET (20:20 GMT), after a difficult week for digital assets. Bitcoin remained below the $80,000 mark as investors assessed regulatory developments and risks surrounding major cryptocurrency platforms.
Binance $BNB confirmed plans to close affected European accounts by December 31 following the expiration of the European Union’s Markets in Crypto-Assets transition period.
Customers in France, Spain, Italy and Poland have reported receiving withdrawal notices. Deposits have been blocked for affected accounts, although withdrawals remain available.
From November 29, Binance plans to charge remaining balances a monthly fee of 0.025%, or 10 USDC, whichever is higher. Another charge is scheduled after December 24.
The restrictions follow Binance’s failure so far to obtain authorization under the EU’s unified licensing framework. The exchange withdrew its Greek license application in June and continues pursuing regulatory approval elsewhere in Europe.
Separately, the EU established a cryptocurrency task force to combat Russian sanctions evasion through digital assets. The 12-month initiative will coordinate enforcement among member states and target networks facilitating prohibited transactions.
Security concerns intensified after crypto debit card provider Gnosis Pay disclosed unauthorized access to its consumer system on November 3.
Exposed information included customer addresses, payment card numbers and linked cryptocurrency wallets, potentially allowing criminals to connect individuals with their digital asset holdings.
Gnosis Pay said customer funds were unaffected and the breach was contained. The company has strengthened fraud monitoring ahead of its legacy consumer system’s planned December shutdown.
Meanwhile, Strategy executive chairman Michael Saylor defended the company’s bitcoin-backed financing approach, highlighting its Stretch preferred shares as a mechanism for raising capital and supporting cryptocurrency holdings.
Ripple CEO Brad Garlinghouse also reaffirmed $XRP central role in the company’s strategy, linking its RLUSD stablecoin expansion to greater liquidity and institutional activity.
For Bitcoin investors, the developments add regulatory compliance, exchange accessibility, and customer security to an already challenging market environment, with the cryptocurrency struggling to regain momentum above $80,000.
Crypto prices today: altcoins generally mixed on Sunday
Broader crypto prices were mixed early Sunday, based on the latest market snapshot.
World No. 2 cryptocurrency Ether fell 0.57% to $2,233.99
World No. 3 cryptocurrency XRP dropped 0.48% to $1.1634.
Solana rose 0.4% to $89.510, while BNB edged up 0.33% to $696.99.
Cardano fell 2.49% to trade at $0.1802, while Dogecoin lost 1.01%.
Among meme coins, TRUMP was trading flat for the day, while Shiba Inu fell 1.11%
#TheBillionaireTrades #TheBillionaireTradesMarketInsights
{spot}(BTCUSDT)
{spot}(BNBUSDT)
{spot}(XRPUSDT)
Bitcoin holds below $76K as Binance EU closures add to crypto market pressure
Bitcoin $BTC traded below $76,000 on Sunday as fresh regulatory and security concerns weighed on the cryptocurrency industry, with Binance preparing to close certain European customer accounts and authorities intensifying scrutiny of digital asset transactions.
The world’s largest cryptocurrency reversed course from earlier in the day to trade higher by 0.3% to $75,908 at 15:20 ET (20:20 GMT), after a difficult week for digital assets. Bitcoin remained below the $80,000 mark as investors assessed regulatory developments and risks surrounding major cryptocurrency platforms.
The world’s largest cryptocurrency reversed course from earlier in the day to trade higher by 0.3% to $75,908 at 15:20 ET (20:20 GMT), after a difficult week for digital assets. Bitcoin remained below the $80,000 mark as investors assessed regulatory developments and risks surrounding major cryptocurrency platforms.
Binance $BNB confirmed plans to close affected European accounts by December 31 following the expiration of the European Union’s Markets in Crypto-Assets transition period.
Customers in France, Spain, Italy and Poland have reported receiving withdrawal notices. Deposits have been blocked for affected accounts, although withdrawals remain available.
From November 29, Binance plans to charge remaining balances a monthly fee of 0.025%, or 10 USDC, whichever is higher. Another charge is scheduled after December 24.
The restrictions follow Binance’s failure so far to obtain authorization under the EU’s unified licensing framework. The exchange withdrew its Greek license application in June and continues pursuing regulatory approval elsewhere in Europe.
Separately, the EU established a cryptocurrency task force to combat Russian sanctions evasion through digital assets. The 12-month initiative will coordinate enforcement among member states and target networks facilitating prohibited transactions.
Security concerns intensified after crypto debit card provider Gnosis Pay disclosed unauthorized access to its consumer system on November 3.
Exposed information included customer addresses, payment card numbers and linked cryptocurrency wallets, potentially allowing criminals to connect individuals with their digital asset holdings.
Gnosis Pay said customer funds were unaffected and the breach was contained. The company has strengthened fraud monitoring ahead of its legacy consumer system’s planned December shutdown.
Meanwhile, Strategy executive chairman Michael Saylor defended the company’s bitcoin-backed financing approach, highlighting its Stretch preferred shares as a mechanism for raising capital and supporting cryptocurrency holdings.
Ripple CEO Brad Garlinghouse also reaffirmed $XRP central role in the company’s strategy, linking its RLUSD stablecoin expansion to greater liquidity and institutional activity.
For Bitcoin investors, the developments add regulatory compliance, exchange accessibility, and customer security to an already challenging market environment, with the cryptocurrency struggling to regain momentum above $80,000.
Crypto prices today: altcoins generally mixed on Sunday
Broader crypto prices were mixed early Sunday, based on the latest market snapshot.
World No. 2 cryptocurrency Ether fell 0.57% to $2,233.99
World No. 3 cryptocurrency XRP dropped 0.48% to $1.1634.
Solana rose 0.4% to $89.510, while BNB edged up 0.33% to $696.99.
Cardano fell 2.49% to trade at $0.1802, while Dogecoin lost 1.01%.
Among meme coins, TRUMP was trading flat for the day, while Shiba Inu fell 1.11%
#TheBillionaireTrades #TheBillionaireTradesMarketInsights
The world’s largest cryptocurrency reversed course from earlier in the day to trade higher by 0.3% to $75,908 at 15:20 ET (20:20 GMT), after a difficult week for digital assets. Bitcoin remained below the $80,000 mark as investors assessed regulatory developments and risks surrounding major cryptocurrency platforms.
The world’s largest cryptocurrency reversed course from earlier in the day to trade higher by 0.3% to $75,908 at 15:20 ET (20:20 GMT), after a difficult week for digital assets. Bitcoin remained below the $80,000 mark as investors assessed regulatory developments and risks surrounding major cryptocurrency platforms.
Binance $BNB confirmed plans to close affected European accounts by December 31 following the expiration of the European Union’s Markets in Crypto-Assets transition period.
Customers in France, Spain, Italy and Poland have reported receiving withdrawal notices. Deposits have been blocked for affected accounts, although withdrawals remain available.
From November 29, Binance plans to charge remaining balances a monthly fee of 0.025%, or 10 USDC, whichever is higher. Another charge is scheduled after December 24.
The restrictions follow Binance’s failure so far to obtain authorization under the EU’s unified licensing framework. The exchange withdrew its Greek license application in June and continues pursuing regulatory approval elsewhere in Europe.
Separately, the EU established a cryptocurrency task force to combat Russian sanctions evasion through digital assets. The 12-month initiative will coordinate enforcement among member states and target networks facilitating prohibited transactions.
Security concerns intensified after crypto debit card provider Gnosis Pay disclosed unauthorized access to its consumer system on November 3.
Exposed information included customer addresses, payment card numbers and linked cryptocurrency wallets, potentially allowing criminals to connect individuals with their digital asset holdings.
Gnosis Pay said customer funds were unaffected and the breach was contained. The company has strengthened fraud monitoring ahead of its legacy consumer system’s planned December shutdown.
Meanwhile, Strategy executive chairman Michael Saylor defended the company’s bitcoin-backed financing approach, highlighting its Stretch preferred shares as a mechanism for raising capital and supporting cryptocurrency holdings.
Ripple CEO Brad Garlinghouse also reaffirmed $XRP central role in the company’s strategy, linking its RLUSD stablecoin expansion to greater liquidity and institutional activity.
For Bitcoin investors, the developments add regulatory compliance, exchange accessibility, and customer security to an already challenging market environment, with the cryptocurrency struggling to regain momentum above $80,000.
Crypto prices today: altcoins generally mixed on Sunday
Broader crypto prices were mixed early Sunday, based on the latest market snapshot.
World No. 2 cryptocurrency Ether fell 0.57% to $2,233.99
World No. 3 cryptocurrency XRP dropped 0.48% to $1.1634.
Solana rose 0.4% to $89.510, while BNB edged up 0.33% to $696.99.
Cardano fell 2.49% to trade at $0.1802, while Dogecoin lost 1.01%.
Among meme coins, TRUMP was trading flat for the day, while Shiba Inu fell 1.11%
#TheBillionaireTrades #TheBillionaireTradesMarketInsights
55
Artikel
Übersetzung ansehen
$1B liquidated from crypto market as Bitcoin, Ethereum dropCrypto traders who bet on higher prices just had a very expensive couple of days.
More than $1 billion in leveraged positions were liquidated as Bitcoin $BTC , Ethereum $ETH , $XRP , and Solana all fell below key price levels. A widely shared market post put the wipeout at $1 billion in just 10 minutes. Broader derivatives data showed over $1.05 billion liquidated in the 24 hours leading up to November 6, 2026.
The trigger wasn't a hack, a collapsed exchange, or a rogue tweet. It came from Wall Street, where a sharp selloff in US tech and AI stocks dragged crypto down with it.
Bitcoin hit an intraday low of $74,780.91 on November 6. That marked its weakest intraday level since August 21.
The world's largest crypto fell nearly 6% during the episode. Ethereum had it worse, sliding more than 7% to about $2,247.
XRP and Solana also broke below critical support levels.
Long positions accounted for approximately $930 million of the total, or 88.2%.
Bitcoin positions accounted for around $267 million in liquidations during the key session. Ethereum followed with approximately $167 million, and XRP and Solana added further losses on top.
Nearly 211,000 traders were hit by the liquidations. Most of the damage landed on major exchanges like Binance.
When a trader borrows to amplify a bet and the price moves against them, the exchange automatically closes the position once collateral runs thin. That forced closure is a liquidation.
The problem is that liquidating a long position means selling. That selling pushes prices lower, which triggers the next batch of liquidations, which means more selling.
That chain reaction is how a market can shed $1 billion in leveraged bets in a matter of minutes, as the viral post described.
The Nasdaq Composite fell 5.5% amid turmoil across AI and chip stocks. Escalating worries about the AI sector's growth prospects collided with uncertainty in the post-midterm election landscape.
Bitcoin ETFs added to the pressure. The selloff coincided with hefty outflows from the funds, giving prices another downward shove.
Sentiment followed price. The Fear & Greed Index, a popular gauge of crypto market mood, slipped into "fear" territory, resetting the bullish tone that had been building.
The most immediate takeaway is about leverage, not direction. A nearly 6% move in Bitcoin is unremarkable by crypto standards. The lopsided 88.2% share of long liquidations suggests the market was crowded on one side heading into the drop.
The bigger story for investors is correlation. Crypto's fate this week was decided largely by what happened to AI and chip stocks, not by anything happening on a blockchain.
#TheBillionaireTrades #TheBillionaireTradesMarketInsights
{spot}(BTCUSDT)
{spot}(ETHUSDT)
{spot}(XRPUSDT)
$1B liquidated from crypto market as Bitcoin, Ethereum drop
Crypto traders who bet on higher prices just had a very expensive couple of days.
More than $1 billion in leveraged positions were liquidated as Bitcoin $BTC , Ethereum $ETH , $XRP , and Solana all fell below key price levels. A widely shared market post put the wipeout at $1 billion in just 10 minutes. Broader derivatives data showed over $1.05 billion liquidated in the 24 hours leading up to November 6, 2026.
The trigger wasn't a hack, a collapsed exchange, or a rogue tweet. It came from Wall Street, where a sharp selloff in US tech and AI stocks dragged crypto down with it.
Bitcoin hit an intraday low of $74,780.91 on November 6. That marked its weakest intraday level since August 21.
The world's largest crypto fell nearly 6% during the episode. Ethereum had it worse, sliding more than 7% to about $2,247.
XRP and Solana also broke below critical support levels.
Long positions accounted for approximately $930 million of the total, or 88.2%.
Bitcoin positions accounted for around $267 million in liquidations during the key session. Ethereum followed with approximately $167 million, and XRP and Solana added further losses on top.
Nearly 211,000 traders were hit by the liquidations. Most of the damage landed on major exchanges like Binance.
When a trader borrows to amplify a bet and the price moves against them, the exchange automatically closes the position once collateral runs thin. That forced closure is a liquidation.
The problem is that liquidating a long position means selling. That selling pushes prices lower, which triggers the next batch of liquidations, which means more selling.
That chain reaction is how a market can shed $1 billion in leveraged bets in a matter of minutes, as the viral post described.
The Nasdaq Composite fell 5.5% amid turmoil across AI and chip stocks. Escalating worries about the AI sector's growth prospects collided with uncertainty in the post-midterm election landscape.
Bitcoin ETFs added to the pressure. The selloff coincided with hefty outflows from the funds, giving prices another downward shove.
Sentiment followed price. The Fear & Greed Index, a popular gauge of crypto market mood, slipped into "fear" territory, resetting the bullish tone that had been building.
The most immediate takeaway is about leverage, not direction. A nearly 6% move in Bitcoin is unremarkable by crypto standards. The lopsided 88.2% share of long liquidations suggests the market was crowded on one side heading into the drop.
The bigger story for investors is correlation. Crypto's fate this week was decided largely by what happened to AI and chip stocks, not by anything happening on a blockchain.
#TheBillionaireTrades #TheBillionaireTradesMarketInsights
More than $1 billion in leveraged positions were liquidated as Bitcoin $BTC , Ethereum $ETH , $XRP , and Solana all fell below key price levels. A widely shared market post put the wipeout at $1 billion in just 10 minutes. Broader derivatives data showed over $1.05 billion liquidated in the 24 hours leading up to November 6, 2026.
The trigger wasn't a hack, a collapsed exchange, or a rogue tweet. It came from Wall Street, where a sharp selloff in US tech and AI stocks dragged crypto down with it.
Bitcoin hit an intraday low of $74,780.91 on November 6. That marked its weakest intraday level since August 21.
The world's largest crypto fell nearly 6% during the episode. Ethereum had it worse, sliding more than 7% to about $2,247.
XRP and Solana also broke below critical support levels.
Long positions accounted for approximately $930 million of the total, or 88.2%.
Bitcoin positions accounted for around $267 million in liquidations during the key session. Ethereum followed with approximately $167 million, and XRP and Solana added further losses on top.
Nearly 211,000 traders were hit by the liquidations. Most of the damage landed on major exchanges like Binance.
When a trader borrows to amplify a bet and the price moves against them, the exchange automatically closes the position once collateral runs thin. That forced closure is a liquidation.
The problem is that liquidating a long position means selling. That selling pushes prices lower, which triggers the next batch of liquidations, which means more selling.
That chain reaction is how a market can shed $1 billion in leveraged bets in a matter of minutes, as the viral post described.
The Nasdaq Composite fell 5.5% amid turmoil across AI and chip stocks. Escalating worries about the AI sector's growth prospects collided with uncertainty in the post-midterm election landscape.
Bitcoin ETFs added to the pressure. The selloff coincided with hefty outflows from the funds, giving prices another downward shove.
Sentiment followed price. The Fear & Greed Index, a popular gauge of crypto market mood, slipped into "fear" territory, resetting the bullish tone that had been building.
The most immediate takeaway is about leverage, not direction. A nearly 6% move in Bitcoin is unremarkable by crypto standards. The lopsided 88.2% share of long liquidations suggests the market was crowded on one side heading into the drop.
The bigger story for investors is correlation. Crypto's fate this week was decided largely by what happened to AI and chip stocks, not by anything happening on a blockchain.
#TheBillionaireTrades #TheBillionaireTradesMarketInsights
85
Artikel
Übersetzung ansehen
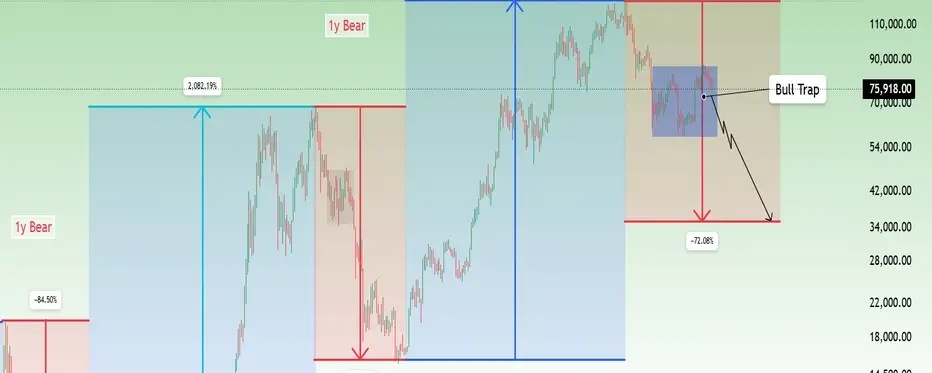
Bitcoin's Four-Year Cycle: Is History About to Repeat?Bitcoin has gone through several major bull and bear markets, and there has always been one pattern that traders keep coming back to: the four-year cycle.
Every few years, Bitcoin goes through a strong rally, reaches a new high, and then enters a long correction. The timing has often been connected to Bitcoin halving events, when the amount of new BTC entering the market is cut in half.
Looking at the weekly chart, the similarities between previous cycles are hard to ignore. But there is also something interesting happening: each cycle is becoming smaller in terms of percentage gains and losses.
Four cycle, one repeating pattern
The first major cycle shown on the chart started around 2015 and continued until the 2017 peak. Bitcoin gained nearly 11,900% during that bull run before entering a bear market that wiped out around 84.5% of its value.
The next major rally came between 2019 and 2021. This time, the gain was around 2,082%, followed by a correction of approximately 76.8%.
Then came the latest cycle, which started from the 2022 bear-market low and continued into the 2025 high. The rally was still impressive, but the gain was around 698%, much smaller than in previous cycles.
The chart now compares the current decline with the earlier bear markets. The projected drop is around 72%, which would bring Bitcoin close to the $35,000 area.
That is a historical comparison, not a confirmed price target. The market can follow a similar pattern without repeating the exact same numbers.
Why each cycle is getting smaller
Bitcoin was a much smaller market during its early cycles. It didn't take the same amount of money to push its price higher, and retail traders played a much bigger role.
Today, the situation is different. Bitcoin has spot ETFs, institutional investors and much stronger connections with traditional financial markets. The amount of capital needed to produce the same percentage move is now significantly larger.
There is also the effect of each halving becoming smaller over time. In 2012, around half of Bitcoin's total supply was still waiting to be mined. By the 2024 halving, roughly 94% of the total supply had already been issued.
This means each new halving reduces a smaller amount of the remaining supply. The supply shock is still part of Bitcoin's design, but its impact on the overall market is not the same as it was in the early years.
Wells Fargo's research also highlights this change. Its historical data shows that both the gains after halvings and the drawdowns after cycle peaks have become smaller.
Is the four-year cycle still reliable?
This is where things get interesting.
Historically, Bitcoin's major peaks have arrived roughly 12 to 18 months after a halving. The latest cycle reached its high in 2025, around 16 months after the April 2024 halving.
That fits the old pattern quite well. However, it doesn't mean Bitcoin must now follow the same correction schedule as 2018 or 2022.
Fidelity's research points to lower volatility and growing institutional participation as reasons why Bitcoin may behave differently in the future. More capital from ETFs and traditional investors could make the market less prone to the extreme rises and falls seen in earlier years.
But the four-year cycle hasn't necessarily disappeared either. The historical data still shows a recurring pattern, even if the size of each move is changing.
What the current chart is suggesting
Bitcoin is trading around $75,900 in the range marked on the weekly chart. The recent recovery has not been strong enough to reclaim the previous highs, and the area marked as a bull trap shows where buyers could get caught if the price fails to move higher.
The chart projects a possible decline toward $35,000, based on a correction similar to previous bear markets. The path could include several smaller recoveries along the way, rather than one continuous fall.
Whether Bitcoin reaches that level is another question entirely. ETFs, institutional demand, global liquidity and the next halving will all play a role in how this cycle develops.
Bitcoin's history gives us a useful way to understand its market cycles, but it doesn't give us a guaranteed roadmap. The pattern is still worth watching, especially now that the market is changing in ways we haven't seen in earlier cycles.
What If Bitcoin Enters Another Bear Market
Bitcoin has followed a four-year cycle in the past, but that doesn't mean the same pattern has to repeat every time. Still, looking at previous cycles, what if Bitcoin is heading towards another long bear market?
Does that mean we have to stop trading and wait for the next bull run? Not really. There are other markets too, and stocks can offer opportunities even when crypto is struggling.
Take AI stocks, for example. Anthropic, the company behind Claude AI, is one name worth following. On November 8, reports came out about a $3.4 billion deal for gas-fired power generators to support its growing data center needs. That's a big move as demand for Claude and other AI services keeps growing
Anthropic's upcoming IPO is another thing to keep an eye on. Getting an allocation in a major IPO is not always easy for regular investors through traditional channels. I have used Bitget IPO Prime during the SpaceX round, and now Anthropic is available there too. I'm considering starting with $100 in USDT when the public round opens on November 10.
My point is, even if Bitcoin enters another bear market, we don't have to sit out completely. There are opportunities beyond crypto, and it's worth keeping an eye on them too.
#TheBillionaireTrades #TheBillionaireTradesMarketInsights
{spot}(BTCUSDT)
Bitcoin's Four-Year Cycle: Is History About to Repeat?
Bitcoin has gone through several major bull and bear markets, and there has always been one pattern that traders keep coming back to: the four-year cycle.
Every few years, Bitcoin goes through a strong rally, reaches a new high, and then enters a long correction. The timing has often been connected to Bitcoin halving events, when the amount of new BTC entering the market is cut in half.
Looking at the weekly chart, the similarities between previous cycles are hard to ignore. But there is also something interesting happening: each cycle is becoming smaller in terms of percentage gains and losses.
Four cycle, one repeating pattern
The first major cycle shown on the chart started around 2015 and continued until the 2017 peak. Bitcoin gained nearly 11,900% during that bull run before entering a bear market that wiped out around 84.5% of its value.
The next major rally came between 2019 and 2021. This time, the gain was around 2,082%, followed by a correction of approximately 76.8%.
Then came the latest cycle, which started from the 2022 bear-market low and continued into the 2025 high. The rally was still impressive, but the gain was around 698%, much smaller than in previous cycles.
The chart now compares the current decline with the earlier bear markets. The projected drop is around 72%, which would bring Bitcoin close to the $35,000 area.
That is a historical comparison, not a confirmed price target. The market can follow a similar pattern without repeating the exact same numbers.
Why each cycle is getting smaller
Bitcoin was a much smaller market during its early cycles. It didn't take the same amount of money to push its price higher, and retail traders played a much bigger role.
Today, the situation is different. Bitcoin has spot ETFs, institutional investors and much stronger connections with traditional financial markets. The amount of capital needed to produce the same percentage move is now significantly larger.
There is also the effect of each halving becoming smaller over time. In 2012, around half of Bitcoin's total supply was still waiting to be mined. By the 2024 halving, roughly 94% of the total supply had already been issued.
This means each new halving reduces a smaller amount of the remaining supply. The supply shock is still part of Bitcoin's design, but its impact on the overall market is not the same as it was in the early years.
Wells Fargo's research also highlights this change. Its historical data shows that both the gains after halvings and the drawdowns after cycle peaks have become smaller.
Is the four-year cycle still reliable?
This is where things get interesting.
Historically, Bitcoin's major peaks have arrived roughly 12 to 18 months after a halving. The latest cycle reached its high in 2025, around 16 months after the April 2024 halving.
That fits the old pattern quite well. However, it doesn't mean Bitcoin must now follow the same correction schedule as 2018 or 2022.
Fidelity's research points to lower volatility and growing institutional participation as reasons why Bitcoin may behave differently in the future. More capital from ETFs and traditional investors could make the market less prone to the extreme rises and falls seen in earlier years.
But the four-year cycle hasn't necessarily disappeared either. The historical data still shows a recurring pattern, even if the size of each move is changing.
What the current chart is suggesting
Bitcoin is trading around $75,900 in the range marked on the weekly chart. The recent recovery has not been strong enough to reclaim the previous highs, and the area marked as a bull trap shows where buyers could get caught if the price fails to move higher.
The chart projects a possible decline toward $35,000, based on a correction similar to previous bear markets. The path could include several smaller recoveries along the way, rather than one continuous fall.
Whether Bitcoin reaches that level is another question entirely. ETFs, institutional demand, global liquidity and the next halving will all play a role in how this cycle develops.
Bitcoin's history gives us a useful way to understand its market cycles, but it doesn't give us a guaranteed roadmap. The pattern is still worth watching, especially now that the market is changing in ways we haven't seen in earlier cycles.
What If Bitcoin Enters Another Bear Market
Bitcoin has followed a four-year cycle in the past, but that doesn't mean the same pattern has to repeat every time. Still, looking at previous cycles, what if Bitcoin is heading towards another long bear market?
Does that mean we have to stop trading and wait for the next bull run? Not really. There are other markets too, and stocks can offer opportunities even when crypto is struggling.
Take AI stocks, for example. Anthropic, the company behind Claude AI, is one name worth following. On November 8, reports came out about a $3.4 billion deal for gas-fired power generators to support its growing data center needs. That's a big move as demand for Claude and other AI services keeps growing
Anthropic's upcoming IPO is another thing to keep an eye on. Getting an allocation in a major IPO is not always easy for regular investors through traditional channels. I have used Bitget IPO Prime during the SpaceX round, and now Anthropic is available there too. I'm considering starting with $100 in USDT when the public round opens on November 10.
My point is, even if Bitcoin enters another bear market, we don't have to sit out completely. There are opportunities beyond crypto, and it's worth keeping an eye on them too.
#TheBillionaireTrades #TheBillionaireTradesMarketInsights
Every few years, Bitcoin goes through a strong rally, reaches a new high, and then enters a long correction. The timing has often been connected to Bitcoin halving events, when the amount of new BTC entering the market is cut in half.
Looking at the weekly chart, the similarities between previous cycles are hard to ignore. But there is also something interesting happening: each cycle is becoming smaller in terms of percentage gains and losses.
Four cycle, one repeating pattern
The first major cycle shown on the chart started around 2015 and continued until the 2017 peak. Bitcoin gained nearly 11,900% during that bull run before entering a bear market that wiped out around 84.5% of its value.
The next major rally came between 2019 and 2021. This time, the gain was around 2,082%, followed by a correction of approximately 76.8%.
Then came the latest cycle, which started from the 2022 bear-market low and continued into the 2025 high. The rally was still impressive, but the gain was around 698%, much smaller than in previous cycles.
The chart now compares the current decline with the earlier bear markets. The projected drop is around 72%, which would bring Bitcoin close to the $35,000 area.
That is a historical comparison, not a confirmed price target. The market can follow a similar pattern without repeating the exact same numbers.
Why each cycle is getting smaller
Bitcoin was a much smaller market during its early cycles. It didn't take the same amount of money to push its price higher, and retail traders played a much bigger role.
Today, the situation is different. Bitcoin has spot ETFs, institutional investors and much stronger connections with traditional financial markets. The amount of capital needed to produce the same percentage move is now significantly larger.
There is also the effect of each halving becoming smaller over time. In 2012, around half of Bitcoin's total supply was still waiting to be mined. By the 2024 halving, roughly 94% of the total supply had already been issued.
This means each new halving reduces a smaller amount of the remaining supply. The supply shock is still part of Bitcoin's design, but its impact on the overall market is not the same as it was in the early years.
Wells Fargo's research also highlights this change. Its historical data shows that both the gains after halvings and the drawdowns after cycle peaks have become smaller.
Is the four-year cycle still reliable?
This is where things get interesting.
Historically, Bitcoin's major peaks have arrived roughly 12 to 18 months after a halving. The latest cycle reached its high in 2025, around 16 months after the April 2024 halving.
That fits the old pattern quite well. However, it doesn't mean Bitcoin must now follow the same correction schedule as 2018 or 2022.
Fidelity's research points to lower volatility and growing institutional participation as reasons why Bitcoin may behave differently in the future. More capital from ETFs and traditional investors could make the market less prone to the extreme rises and falls seen in earlier years.
But the four-year cycle hasn't necessarily disappeared either. The historical data still shows a recurring pattern, even if the size of each move is changing.
What the current chart is suggesting
Bitcoin is trading around $75,900 in the range marked on the weekly chart. The recent recovery has not been strong enough to reclaim the previous highs, and the area marked as a bull trap shows where buyers could get caught if the price fails to move higher.
The chart projects a possible decline toward $35,000, based on a correction similar to previous bear markets. The path could include several smaller recoveries along the way, rather than one continuous fall.
Whether Bitcoin reaches that level is another question entirely. ETFs, institutional demand, global liquidity and the next halving will all play a role in how this cycle develops.
Bitcoin's history gives us a useful way to understand its market cycles, but it doesn't give us a guaranteed roadmap. The pattern is still worth watching, especially now that the market is changing in ways we haven't seen in earlier cycles.
What If Bitcoin Enters Another Bear Market
Bitcoin has followed a four-year cycle in the past, but that doesn't mean the same pattern has to repeat every time. Still, looking at previous cycles, what if Bitcoin is heading towards another long bear market?
Does that mean we have to stop trading and wait for the next bull run? Not really. There are other markets too, and stocks can offer opportunities even when crypto is struggling.
Take AI stocks, for example. Anthropic, the company behind Claude AI, is one name worth following. On November 8, reports came out about a $3.4 billion deal for gas-fired power generators to support its growing data center needs. That's a big move as demand for Claude and other AI services keeps growing
Anthropic's upcoming IPO is another thing to keep an eye on. Getting an allocation in a major IPO is not always easy for regular investors through traditional channels. I have used Bitget IPO Prime during the SpaceX round, and now Anthropic is available there too. I'm considering starting with $100 in USDT when the public round opens on November 10.
My point is, even if Bitcoin enters another bear market, we don't have to sit out completely. There are opportunities beyond crypto, and it's worth keeping an eye on them too.
#TheBillionaireTrades #TheBillionaireTradesMarketInsights
12
Solana prallt von einer wichtigen Unterstützungstrendlinie ab
Solana notiert am Donnerstag zum Zeitpunkt der Veröffentlichung bei etwa 96,80 $, nachdem der Kurs von seiner steigenden Unterstützungstrendlinie bei rund 89,69 $ abgeprallt ist. Nun testet er seinen 200-Tage-EMA bei 98,08 $.
Die Momentumindikatoren erholen sich im Tageschart. Der RSI bewegt sich um 40, und die MACD-Linie steht kurz davor, ihre Signallinie von unten zu kreuzen – ein Hinweis darauf, dass der Abwärtsdruck anhält.
Ein Tagesschlusskurs über dem 200-Tage-EMA bei 98,08 $ wäre ein erstes Zeichen für nachlassenden Druck. Ein stärkerer Widerstand liegt jedoch beim 50-Tage-EMA nahe 102,71 $, gefolgt von den früheren horizontalen Obergrenzen bei 110,60 $ und 122,94 $.
Auf der Unterseite liegt die erste Unterstützung bei der steigenden Trendlinie um 89,69 $, die nächste horizontale Unterstützung bei 87,21 $. Bei stärkeren Verlusten kämen die weiter entfernten Unterstützungen bei 70,58 $ und 60,13 $ in den Blick.
#TheBillionaireTrades
{spot}(SOLUSDT)
Solana prallt von einer wichtigen Unterstützungstrendlinie ab
Solana notiert am Donnerstag zum Zeitpunkt der Veröffentlichung bei etwa 96,80 $, nachdem der Kurs von seiner steigenden Unterstützungstrendlinie bei rund 89,69 $ abgeprallt ist. Nun testet er seinen 200-Tage-EMA bei 98,08 $.
Die Momentumindikatoren erholen sich im Tageschart. Der RSI bewegt sich um 40, und die MACD-Linie steht kurz davor, ihre Signallinie von unten zu kreuzen – ein Hinweis darauf, dass der Abwärtsdruck anhält.
Ein Tagesschlusskurs über dem 200-Tage-EMA bei 98,08 $ wäre ein erstes Zeichen für nachlassenden Druck. Ein stärkerer Widerstand liegt jedoch beim 50-Tage-EMA nahe 102,71 $, gefolgt von den früheren horizontalen Obergrenzen bei 110,60 $ und 122,94 $.
Auf der Unterseite liegt die erste Unterstützung bei der steigenden Trendlinie um 89,69 $, die nächste horizontale Unterstützung bei 87,21 $. Bei stärkeren Verlusten kämen die weiter entfernten Unterstützungen bei 70,58 $ und 60,13 $ in den Blick.
#TheBillionaireTrades
Solana notiert am Donnerstag zum Zeitpunkt der Veröffentlichung bei etwa 96,80 $, nachdem der Kurs von seiner steigenden Unterstützungstrendlinie bei rund 89,69 $ abgeprallt ist. Nun testet er seinen 200-Tage-EMA bei 98,08 $.
Die Momentumindikatoren erholen sich im Tageschart. Der RSI bewegt sich um 40, und die MACD-Linie steht kurz davor, ihre Signallinie von unten zu kreuzen – ein Hinweis darauf, dass der Abwärtsdruck anhält.
Ein Tagesschlusskurs über dem 200-Tage-EMA bei 98,08 $ wäre ein erstes Zeichen für nachlassenden Druck. Ein stärkerer Widerstand liegt jedoch beim 50-Tage-EMA nahe 102,71 $, gefolgt von den früheren horizontalen Obergrenzen bei 110,60 $ und 122,94 $.
Auf der Unterseite liegt die erste Unterstützung bei der steigenden Trendlinie um 89,69 $, die nächste horizontale Unterstützung bei 87,21 $. Bei stärkeren Verlusten kämen die weiter entfernten Unterstützungen bei 70,58 $ und 60,13 $ in den Blick.
#TheBillionaireTrades
34
Cardano verteidigt wichtige Unterstützungsmarke
Cardano hält sich nach einem Anstieg von 4 % am Vortag stabil bei etwa 0,1985 $. Dennoch bewahrt $ADA einen kurzfristig pessimistischen Ton, da der Kurs unter der ehemaligen steigenden Trendlinienunterstützung bei 0,2034 $ bleibt und sowohl durch den 50-Tage-EMA bei 0,2151 $ als auch durch den 200-Tage-EMA bei 0,2381 $ gedeckelt wird.
Die Kurskonstellation unterhalb dieser wichtigen Durchschnitte deutet darauf hin, dass Kursanstiege wahrscheinlich auf Verkaufsinteresse stoßen. Gleichzeitig hat sich der MACD der Signallinie für ein bullisches Crossover angenähert, während sich der RSI bei etwa 40 moderat von seinem jüngsten überverkauften Bereich erholt. Das deutet eher auf eine vorsichtige Stabilisierung als auf eine entschlossene Trendwende hin.
Cardano muss die verlorene Trendlinie nahe 0,2034 $ zurückerobern, um einen Aufwärtstrend wiederherzustellen. Dies könnte den Weg zum 50-Tage-EMA bei 0,2151 $ ebnen.
Das horizontale Niveau um 0,1894 $ hält seit dem 30. August und bietet wichtige Unterstützung. Zugleich begrenzt es das Abwärtspotenzial bis zum Tief vom 18. August bei 0,1712 $.
#TheBillionaireTrades
{spot}(ADAUSDT)
Cardano verteidigt wichtige Unterstützungsmarke
Cardano hält sich nach einem Anstieg von 4 % am Vortag stabil bei etwa 0,1985 $. Dennoch bewahrt $ADA einen kurzfristig pessimistischen Ton, da der Kurs unter der ehemaligen steigenden Trendlinienunterstützung bei 0,2034 $ bleibt und sowohl durch den 50-Tage-EMA bei 0,2151 $ als auch durch den 200-Tage-EMA bei 0,2381 $ gedeckelt wird.
Die Kurskonstellation unterhalb dieser wichtigen Durchschnitte deutet darauf hin, dass Kursanstiege wahrscheinlich auf Verkaufsinteresse stoßen. Gleichzeitig hat sich der MACD der Signallinie für ein bullisches Crossover angenähert, während sich der RSI bei etwa 40 moderat von seinem jüngsten überverkauften Bereich erholt. Das deutet eher auf eine vorsichtige Stabilisierung als auf eine entschlossene Trendwende hin.
Cardano muss die verlorene Trendlinie nahe 0,2034 $ zurückerobern, um einen Aufwärtstrend wiederherzustellen. Dies könnte den Weg zum 50-Tage-EMA bei 0,2151 $ ebnen.
Das horizontale Niveau um 0,1894 $ hält seit dem 30. August und bietet wichtige Unterstützung. Zugleich begrenzt es das Abwärtspotenzial bis zum Tief vom 18. August bei 0,1712 $.
#TheBillionaireTrades
Cardano hält sich nach einem Anstieg von 4 % am Vortag stabil bei etwa 0,1985 $. Dennoch bewahrt $ADA einen kurzfristig pessimistischen Ton, da der Kurs unter der ehemaligen steigenden Trendlinienunterstützung bei 0,2034 $ bleibt und sowohl durch den 50-Tage-EMA bei 0,2151 $ als auch durch den 200-Tage-EMA bei 0,2381 $ gedeckelt wird.
Die Kurskonstellation unterhalb dieser wichtigen Durchschnitte deutet darauf hin, dass Kursanstiege wahrscheinlich auf Verkaufsinteresse stoßen. Gleichzeitig hat sich der MACD der Signallinie für ein bullisches Crossover angenähert, während sich der RSI bei etwa 40 moderat von seinem jüngsten überverkauften Bereich erholt. Das deutet eher auf eine vorsichtige Stabilisierung als auf eine entschlossene Trendwende hin.
Cardano muss die verlorene Trendlinie nahe 0,2034 $ zurückerobern, um einen Aufwärtstrend wiederherzustellen. Dies könnte den Weg zum 50-Tage-EMA bei 0,2151 $ ebnen.
Das horizontale Niveau um 0,1894 $ hält seit dem 30. August und bietet wichtige Unterstützung. Zugleich begrenzt es das Abwärtspotenzial bis zum Tief vom 18. August bei 0,1712 $.
#TheBillionaireTrades
127
Ripple erholt sich angesichts erneuten Kaufdrucks
Ripple notiert am Donnerstag zum Zeitpunkt der Veröffentlichung bei 1,3191 $, womit die Gewinne den dritten Tag in Folge ausgeweitet werden. $XRP durchbricht eine kurzfristige Widerstandstrendlinie, die die Hochs vom 23. September und 28. Oktober verbindet und bei etwa 1,2691 $ verläuft.
Kurzfristig bleibt der Kurs sowohl durch den exponentiellen gleitenden Durchschnitt (EMA) über 50 Perioden bei 1,3357 $ als auch durch den EMA über 200 Perioden bei 1,3580 $ gedeckelt. Dadurch bleibt die übergeordnete Stimmung trotz der jüngsten Erholung bearish.
Das Momentum hat sich im Tageschart verbessert: Die Moving Average Convergence Divergence (MACD) hat ihre Signallinie von unten gekreuzt, und der Relative Strength Index (RSI) bewegt sich um den neutralen Wert von 50. Das deutet auf ein wieder wachsendes Kaufinteresse hin, reicht aber noch nicht aus, um den Trend zu drehen.
Der erste Widerstand für XRP liegt beim EMA über 50 Perioden bei 1,3357 $; ein Durchbruch darüber würde den Weg zum bedeutenderen Hindernis beim EMA über 200 Perioden bei 1,3579 $ freimachen.
Auf der anderen Seite verläuft die unmittelbare Unterstützung entlang der früheren abwärts gerichteten Widerstandstrendlinie, die nun im Bereich von 1,2691 $ als Unterstützung dient. Bei erneutem Verkaufsdruck bieten tiefere Unterstützungszonen Halt an der psychologischen Schwelle von 1,0000 $.
#TheBillionaireTrades
{spot}(XRPUSDT)
Ripple erholt sich angesichts erneuten Kaufdrucks
Ripple notiert am Donnerstag zum Zeitpunkt der Veröffentlichung bei 1,3191 $, womit die Gewinne den dritten Tag in Folge ausgeweitet werden. $XRP durchbricht eine kurzfristige Widerstandstrendlinie, die die Hochs vom 23. September und 28. Oktober verbindet und bei etwa 1,2691 $ verläuft.
Kurzfristig bleibt der Kurs sowohl durch den exponentiellen gleitenden Durchschnitt (EMA) über 50 Perioden bei 1,3357 $ als auch durch den EMA über 200 Perioden bei 1,3580 $ gedeckelt. Dadurch bleibt die übergeordnete Stimmung trotz der jüngsten Erholung bearish.
Das Momentum hat sich im Tageschart verbessert: Die Moving Average Convergence Divergence (MACD) hat ihre Signallinie von unten gekreuzt, und der Relative Strength Index (RSI) bewegt sich um den neutralen Wert von 50. Das deutet auf ein wieder wachsendes Kaufinteresse hin, reicht aber noch nicht aus, um den Trend zu drehen.
Der erste Widerstand für XRP liegt beim EMA über 50 Perioden bei 1,3357 $; ein Durchbruch darüber würde den Weg zum bedeutenderen Hindernis beim EMA über 200 Perioden bei 1,3579 $ freimachen.
Auf der anderen Seite verläuft die unmittelbare Unterstützung entlang der früheren abwärts gerichteten Widerstandstrendlinie, die nun im Bereich von 1,2691 $ als Unterstützung dient. Bei erneutem Verkaufsdruck bieten tiefere Unterstützungszonen Halt an der psychologischen Schwelle von 1,0000 $.
#TheBillionaireTrades
Ripple notiert am Donnerstag zum Zeitpunkt der Veröffentlichung bei 1,3191 $, womit die Gewinne den dritten Tag in Folge ausgeweitet werden. $XRP durchbricht eine kurzfristige Widerstandstrendlinie, die die Hochs vom 23. September und 28. Oktober verbindet und bei etwa 1,2691 $ verläuft.
Kurzfristig bleibt der Kurs sowohl durch den exponentiellen gleitenden Durchschnitt (EMA) über 50 Perioden bei 1,3357 $ als auch durch den EMA über 200 Perioden bei 1,3580 $ gedeckelt. Dadurch bleibt die übergeordnete Stimmung trotz der jüngsten Erholung bearish.
Das Momentum hat sich im Tageschart verbessert: Die Moving Average Convergence Divergence (MACD) hat ihre Signallinie von unten gekreuzt, und der Relative Strength Index (RSI) bewegt sich um den neutralen Wert von 50. Das deutet auf ein wieder wachsendes Kaufinteresse hin, reicht aber noch nicht aus, um den Trend zu drehen.
Der erste Widerstand für XRP liegt beim EMA über 50 Perioden bei 1,3357 $; ein Durchbruch darüber würde den Weg zum bedeutenderen Hindernis beim EMA über 200 Perioden bei 1,3579 $ freimachen.
Auf der anderen Seite verläuft die unmittelbare Unterstützung entlang der früheren abwärts gerichteten Widerstandstrendlinie, die nun im Bereich von 1,2691 $ als Unterstützung dient. Bei erneutem Verkaufsdruck bieten tiefere Unterstützungszonen Halt an der psychologischen Schwelle von 1,0000 $.
#TheBillionaireTrades
340
Anmelden und weiter Inhalte entdecken
Krypto-Nutzer weltweit auf Binance Square kennenlernen
⚡️ Bleib in Sachen Krypto stets am Puls.
💬 Die weltgrößte Kryptobörse vertraut darauf.
👍 Erhalte verlässliche Einblicke von verifizierten Creators.
E-Mail-Adresse/Telefonnummer
Trendthemen
NvidiaBeatsEstimatesWith$130BQ4Outlook
2,931 Aufrufe
56 Kommentare
Nvidia übertrifft Erwartungen mit 115,8 Milliarden US-Dollar Umsatz, prognostiziert 130 Milliarden und stockt Aktienrückkäufe um 150 Milliarden auf
Binance News
·25 Likes
·31.5k Aufrufe
AnthropicIPOPriceCouldExceed$80
6,918 Aufrufe
63 Kommentare
CanNvidia’sDataCenterGrowthContinue?
15,493 Aufrufe
265 Kommentare